Embed Size (px)
Citation preview

International Journal of Computer Applications (0975 – 8887)
Volume 80 – No1, October 2013
23
Thermo-Hydraulic Behavior of Water Cooling Channel
Subjected to Constant Heat Flux during Pressure
Reduction Transient in its Cooling System
Akram W. Ahmed Ezzat, Ph.D Asst. prof. Dept. of Mech. Eng.
University of Baghdad Emad W. Nayyef Dept. of Mech. Eng.
University of Baghdad
ABSTRACT Heat transfer parameters of concentric heat source cooling
channel exposed to pressure reduction transient is studied
experimentally and theoretically. The heat source is of constant
heat flux cooled by upward flowing water in concentric
channel. The heat source is located inside cylindrical shape
tube which is fixed in an annular vertical channel. The cooling
water pressure reduction transient is ensured by different shape
disturbance functions. The theoretical investigation involved a
mathematical modeling for axially, symmetric, simultaneously
developing laminar water flow in a vertical annulus. The
mathematical model is based on one dimensional flow. The
boundary conditions of the studied case are based on adiabatic
outer wall while the inner wall is subjected to a constant heat
flux for upwards flow. The heat & mass balance equation
derived for specified element of bulk water within the annulus,
is solved to determine the variation of bulk water temperature,
heat transfer coefficient, clad surface temperature and the
boiling safety factor based on clad surface temperature versus
length and time during transient course. The present theoretical
work covers heat flux of 46345 W/m2, channel inner to outer
diameter ratio of 0.8, water sub-cooled degree in the channel
inlet ranging (20-30OC), heat source length of 0.65, water
pressure at channel inlet of 1.3 bars and pressure reduction
transient according to step, ramp and sinusoidal shape
disturbance function (1.3- 1.0) bars. The experimental
investigation included a set of experiments carried out to
investigate the temperature variation along the heat source for
step, ramp and sinusoidal pressure reduction transients in
cooling system during and after reaching the steady state
condition.
Keywords
Pressure reduction, CHF prediction, Sub-cooled flow boiling,
Heat transfer parameters, nucleate boiling and concentric
annular channel.
1. INTRODUCTION Thermal hydraulic systems may be exposed to phenomena
that may cause boiling in its different forms. The main
initiators of these phenomena are sudden increased power,
pressure reduction or coolant flow rate reduction which causes
the so-called poor heat transfer. Possible improvement occurs
for the heat transfer coefficient, in the area called nucleate
boiling but this may lead to critical region at any time when it
turned into a film boiling region during which is the most
dangerous area accompanied by poor heat transfer coefficient
that leads to malfunctioned heat generation systems, see
figure (1),[2]. The transient boiling phenomenon sometimes
occurs in the steps of startup and shut-down of the boiling
systems. Transient boiling systems could be categorized into
three types of transients: power transients, flow transients and
pressure transients. In this paper, the effect of pressure
transient will be investigated in boiling systems. Pressure
transient occurs when the local pressure in the cooling
channel varies with time. Therefore such studies will be of
interest in engineering safety analysis of heat generations
systems subjected to transient pressure reduction disturbance
in their cooling systems. This disturbance will affect the heat
removal efficiency of the coolant due to phase change
accompanying pressure reduction. An example of such
transients is small pipe break in nuclear power systems which
affect fluid pressure rather than its velocity in the cooling
channels and cause adverse boiling crisis in their cooling
systems. Another example related to boiling water reactor
(BWR) safety systems in which the nuclear safety systems is
added to prevent or mitigate environmental and health hazards
in the event of accident or natural disaster. However, unlike a
pressurized water reactor which contains no steam in the
reactor core, a sudden increase in BWR steam pressure
(caused, for example, by the actuation of the main steam
isolation valve (MSIV) from the reactor) will result in a
sudden decrease in the proportion of steam to liquid water
inside the reactor. The increased ratio of water to steam will
lead to increased neutron moderation, which in turn will cause
an increase in the power output of the reactor. This type of
event is referred to as a "pressure transient". Most of the
applications for this topic are related to engineering safety
analysis of heat generation systems in process plants and
power generation systems which are mainly utilized in
different industrial sectors.[1]
Fig (1): Flow boiling in a vertical tube (Collier 1981).
Several theoretical and experimental works are related to our
research. Kwang et al. investigated transition boiling
mechanism to predict transition boiling heat flux realistically
for forced convection transition boiling. This model was

International Journal of Computer Applications (0975 – 8887)
Volume 80 – No1, October 2013
24
based on a postulated multi-stage boiling process occurring
during the passage time of the elongated vapor blanket
specified at a critical heat flux (CHF) condition. The model
predictions were compared with some available experimental
transition boiling data given as the steady-state or transient
boiling curves. Also they investigated the parametric effects
of pressure, mass flux, inlet sub-cooling on the transition
boiling heat transfer[3]. Gungor and Winterton studied flow
boiling heat transfer for saturated and sub-cooled conditions
using vertical and horizontal flow. The study is developed
with the aid of a large data bank[4]. Prodanovic et al. studied
the relation of boiling heat transfer process with
experimentally observed bubble behavior during subcooled
flow boiling of water in a vertical heated annulus. They
explained the transition from partial to fully developed flow
boiling with regard to bubble growth rates and to the time that
individual bubbles attached to the heater surface. Within the
partial nucleate boiling region bubbles barely change in size
and shape while sliding a long distance on the heater surface.
With increasing heat flux, or reducing flow rate at constant
heat flux, bubble growth rates increase significantly. Bubbles
grow while sliding, detach from the heater, and subsequently
collapse in the bulk fluid within a distance of 1–2 diameters
parallel to the heater surface[5]. Hamid and Mehdi calculated
the convective heat transfer coefficient and the wall
temperature in a uniform heated tube with downward flow
regarding the pressure drop along the tube. They investigated
in this study two- phase flow pressure drop and two –phase
properties such as void friction[6]. Bang and Kim studied
experimentally the effect of pressure on the flow boiling of
water in mini channels. The range of pressure was 2-16 bars
in the experiments. The experimental apparatus consisted
mainly of the 1.73 mm inner diameter round tube test section,
gear pump, pre-heater, pressurize, pre evaporator, and
condenser. He used the pre-evaporator for varying the vapor
quality entering the test section. The pressurize control the
desired system pressure. The test tube is made of 316 stainless
steel and the test tube and the pre-evaporator tube were heated
by DC electric current through the tubes. The measured flow
boiling heat transfer coefficients were in the range of 10,000 -
35,000 W/m2.K and showed the general convection dominant
trend in terms of vapor quality. The data also indicates that the
pressure does not alter the heat transfer coefficient
significantly[7]. Xiao Hu, Guiping, Yan Cai and Dongsheng,
studied by Using FC-72 as the coolant, a closed- loop two-
phase mini channel heat sink driven by a micro-gear pump
was developed in this work. The cooling system was made of
oxygen-free copper containing 14 parallel channels of the
dimension of 0.8 mm (W)* 2 mm(D) *20 mm(L )[8].
2. THEORETICAL ANALYSI Flowing water in a vertical annulus subjected to transient
forced convection effect in radial direction is presented for
modeling. A one- dimensional model can be used to describe
the transient forced convection heat transfer in vertical
annuals, with inner radius and outer radius which has a
configuration shown in figure (2). Water flow direction is
assumed to be in the upward direction according to the
experimental setup. The following assumptions are used in the
modeling:
Incompressible fluid.
One dimensional in (z-axis) flow. There is only one non
zero velocity component, namely that in the direction of
flow, thus,
The axial velocity is independent of the angular location;
that is,
Simultaneously developing hydrodynamic.
No internal heat generation and heat dissipation.
Neglecting viscous dissipation.
The flow during steady state condition is single phase as
water bulk temperature does not exceed the saturation
temperature along the cooling channel, x=0.
The two phase flow and heat transfer during transient case at
the upper part of the test section where water quality, x >0 is
based on homogeneous model.
Fig (2): Axial annular geometry
2.1 Formulas Used for Prediction Measured
Parameters during Steady State Condition To analyze the heat transfer process by forced convection from
the heat source surface to the water flowing along it through
annular section adjacent to the heat source surface simplified
steps were used by conducting mass and heat balance at
specified cross sectional area in the channel. The heat transfer
coefficient is one of the affective parameters that should be
estimated using the proper equations, Calculation procedure is
conducted as follows:
The total input power supplied to the wall can be
calculated as;
(1)
The heat loss ( from the annular channel to the
surrounding can be found from the following relation:
(2)
The outer heat transfer coefficient of insulated cylinder
( ) is found using the following equation, (Harlan and
Bengtson, [9]. The correlation for Nu adopted for laminar
flow at ( ) is:
V
R
TS
ql

International Journal of Computer Applications (0975 – 8887)
Volume 80 – No1, October 2013
25
(3)
(4)
= (5)
(6)
(7)
Heat transferred to the flowing water by convection is
calculated by the following relation;
= (8)
Convective heat flux is calculated by using the following
relation;
(9)
(10)
The cross section area of annular tubes, in which the
cooling water flowing inside it could be calculated as
follows:
(11)
The average velocity of water could be determined as
follows:
(12)
The input parameters related to the total power of the heat
source, hydraulic diameter, water volumetric flow rate,
channel geometry and inlet water temperature are based on the
experimental data that are used during the experimental part
of the study. The target from theoretical study is to ensure
certain model that predicts the measured parameters during
transient condition initiated by pressure step reduction. These
parameters include water and surface temperatures response to
such disturbance and the elapsed time required to gain the
steady state condition again. The results obtained from the
experimental and theoretical results are compared with each
other.
2.2 Bulk water temperature To determine the bulk water temperature at the six points
and compare them with the six thermocouple read out fixed
along heater tube wall during study state condition, the
following calculations are conducted;
(13)
2.3 Local Heat Transfer Coefficient In order to investigate if the flow in the test section is fully
developed or developing flow, it is necessary to estimate the
thermal entrance length, zet as given by the following
expression; (Ebadian and Dong, 2006)[10].
(14)
Where (
The following equation is used to calculate the heat transfer
coefficient as shown below, (EL-Wakil, 1962)[11].
(15)
(16)
The previous equations are based for calculation local heat
transfer coefficient, h for forced convection using sub-cooled
liquid.
2.4 Surface Temperature of Electrical
Heater (heat source) Clad surface temperature of heat source is calculated from the
following equation:
(17)
2.5 Sub-cooled Boiling Temperature and
Safety Factor Estimation Sub-cooled nucleate boiling of the coolant starts when the
heat source surface temperature reach to the boiling
temperature at that position; The following correlation is
used for estimation; (Ezzat and Taki, 1988)[12].
(18)
P = Pi - g z - (f . ( (19)
To avoid sub-cooled nucleate boiling at clad surface, the
maximum clad temperature at the hot spot shall be lower than
boiling temperature. A safety factor (K) given by the
following equation. K used to estimate this temperature;
(Ezzat and Taki, 1988).
(20)
To find out heat transfer coefficients after initiating of
nucleate boiling on heat source surface it is necessary to add
another part to the equation used for sub-cooled liquid, as
nucleate boiling will enhance heat transfer mechanism due to
turbulence effect of vapor nucleation. The following equation
is used for calculating flow boiling heat transfer by (Chen
1963)[12].
(21)
…….(22)

International Journal of Computer Applications (0975 – 8887)
Volume 80 – No1, October 2013
26
2.6 Derivation of Temperature Response to
Pressure Reduction Transient According to
Step Disturbance Function The derivation of bulk water and surface temperature to
pressure step reduction is based on the flow pattern and water
quality along the channel. Could be derived from the following
heat balance and as shown in figure (3):
(23)
(24)
(25)
Then, (26)
(27)
It is assumed that (i) is the point where local temperature
[ at that point [ .
(28)
Where:
Now, we will use ( to calculate the temperature and
pressure at (i+1) using the same steady state equation taking
into account the effect of two phase water quality
(29)
First we assume Pi+1 to find out xi+1 then we use the new value
of Pi+1 to investigate the new value of xi+1. After certain
iteration and when the value of Pi+1 stabilize we base the final
value of xi+1 to calculate Tw(i+1) as shown below:
(30)
At i=0 which the steady state pressure = 1.3
bar.
During transient course at t >0 pi=1.0 bar.
Water velocity inside the channel will be used to find the
position of the affected position x1 at which T > Tsat after
each time interval.
i.e: at t=t1 x1=v*t1, at t=t2 x2=v*t2 x2=v*t2
All the positions which are less than x1, x2, …..etc. till x=L
,length of heat source, will be using temperature distribution
based on inlet pressure of 1.3 bar, i.e steady state equation.
While positions which are above x1, x2, ….etc. will use
temperature distribution based on inlet pressure equal to 1.0
bar, i.e transient equation.
Accordingly the temperature distribution along the heat
source surface will be calculated based on (Tw) found from
the above equations. Clad surface temperature, (TS) will be
calculated based on the following equation:
.
Note: that will be based on following equation which
is used for steady state condition when the position (i) falls
below Tsat position.
The following equation is used to find out when (i)
falls above Tsat position.
When the position reaches to the film boiling region, the
heat transfer coefficient (hf) is then given by:
(31)
Fig (3): Heat balance mass transfer
3. EXPERIMENTAL WORK The experimental system consists of 0.7 m vertical
mounted glass test section pipe linked to water circulation
system. The water loses part of its static head as it moves
up due to frictional pressure drop along the test section.
Accordingly the local pressure along the channel is
function of its pressure at the channel inlet, water velocity
and water density which is in turn is function of the local
m°CPTwi+1
MCPaveTavedt
ql q″πDi
z
m°CPTwi
i+1
i
International Journal of Computer Applications (0975 – 8887)
Volume 80 – No1, October 2013
27
water quality. Accordingly film boiling will be ensured
somewhere inside the test section where the water local
temperature reaches its saturation temperature at that
position. The inlet pressure reduction versus time is
simulated by three disturbance functions: step change,
ramp change and sinusoidal change. According to the
design criteria of the test rig the range of the pressure
reduction in the test section inlet is limited to (1.3 to 1.0)
bar. Proper cylindrical shape heat source is fabricated to
ensure constant heat flux used to heat up the upward
flowing water in the vertical annulus that surrounds it. The
heat source consists of a nickel-chrome wire, wounded as
(U) shape coil inside solid stainless steel cylinder and the
stainless steel tube to ensure constant heat flux. The length
of the heater is (70 cm), while it’s heating active length is
(66cm), the diameter is (2 cm), the maximum total power
is (2500 W), resistance of heat source (19.2 ) and the
maximum applied voltage (220-240) Volts. The outer tube
of the circular annulus is made of Perspex glass to
minimize the heat lost to the surrounding air due to its low
thermal conductivity in addition to its transparency to
enable visualization the flow patterns during water phase
change. The cylindrical channel thickness is (1 cm), its
length is (70 cm), with inner diameter equals (2.5 cm) and
outer diameter equals (4.5 cm). Proper flanges made from
Teflon are fitted in the both ends of the cylindrical
channel to ensure the gap between the two concentric
cylinders equal to 0.25cm. The temperature of the outside
surface of the inner cylinder heat source is measured by
using six asbestos sheath alumel - chromel (type K)
thermocouples installed in six positions (6.5, 19.5, 32.5,
45.5, 58.5 and 66) cm from the entrance of the heat source
active length. Circular holes of (d=2 mm) are drilled in the
surface of the Perspex glass cylinder which are used for
thermocouple penetration. They are installed in equal
space distances at six positions while the bulk water
temperature was measured by using three thermocouples
which are fixed in distances (19.5, 45.5 and 65) cm from
the channel entrance, while two thermocouples are
installed inside the channel to measure water temperature
in the inlet and the outlet of the channel. To determine the
heat lost from the channel to the surrounding, three
thermocouples are fixed in the lengths (19.5, 45.5 and 65)
cm of the channel for the purpose of estimating the
temperature at the outer surface of the Perspex glass and
then calculating the heat lost to the surrounding air by the
following equation;
(32)
The supplied water to the annular test section is heated up to
the inlet water temperature in a rectangular cross section tank.
The tank is shown in plates (1) and figure (4).
`The conducted experiments are based on the following input
parameters, water temperature at the entrance of the channel
range (76oC - 80oC). Water flow rate is fixed at 1.4 l / m.
Sharp pressure fluctuation at any of these points predicts the
transition of boiling configuration from nucleate boiling to
film boiling at distance located upper from the pressure
fluctuation point. Water flow pressure at distances (6.5, 32.5
and 65) cm from the heated wall inlet is measured by the
water manometer during the pressure reduction transient.
Temperature Response to Pressure reduction are conducted
for 3 types of disturbance functions: step, ramp and
sinusoidal.
Plate (1.a): Test rig used for conducting experimental
tests- front View.
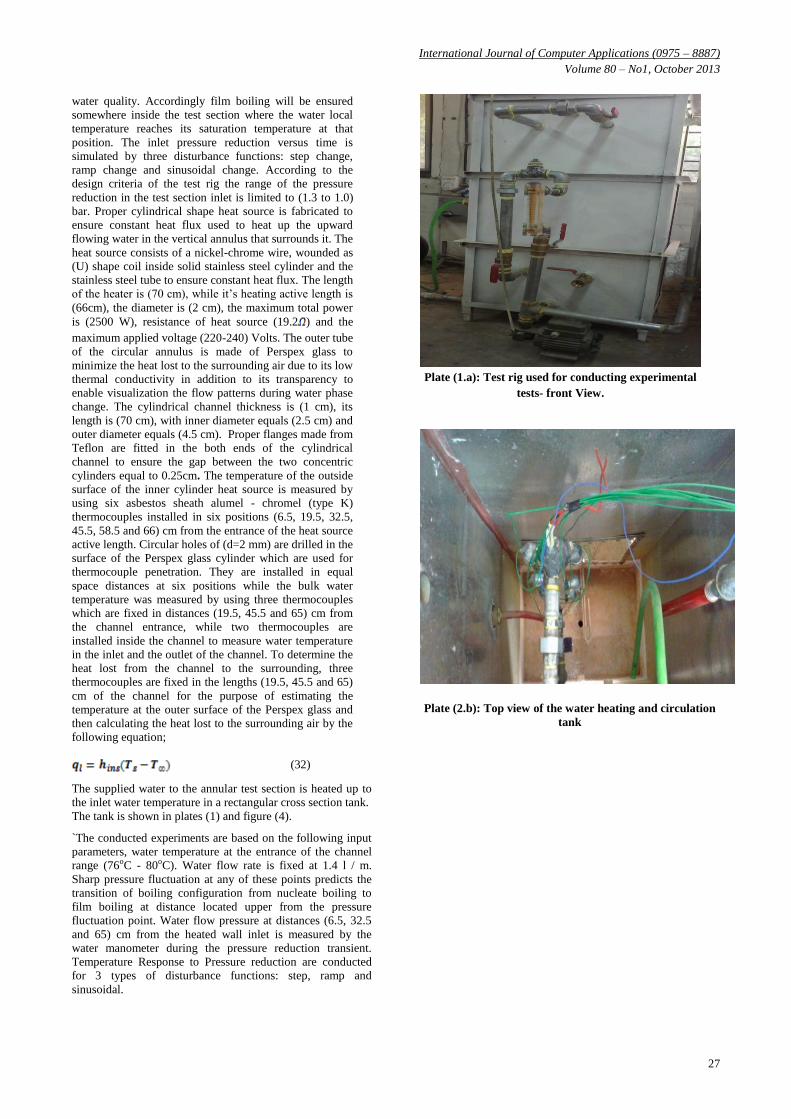
Plate (2.b): Top view of the water heating and circulation
tank

International Journal of Computer Applications (0975 – 8887)
Volume 80 – No1, October 2013
28
Fig (4): Diagram of experimental test rig from its interior
and exterior
4. RESULT AND DISCUSSION Generally, the variation of the temperature along the heat
source clad surface may be affected by many variables such as
the input heat flux, water inlet temperature, water velocity
inside the channel, gap between concentric cylinders and the
distances of the test section at which the clad temperature is
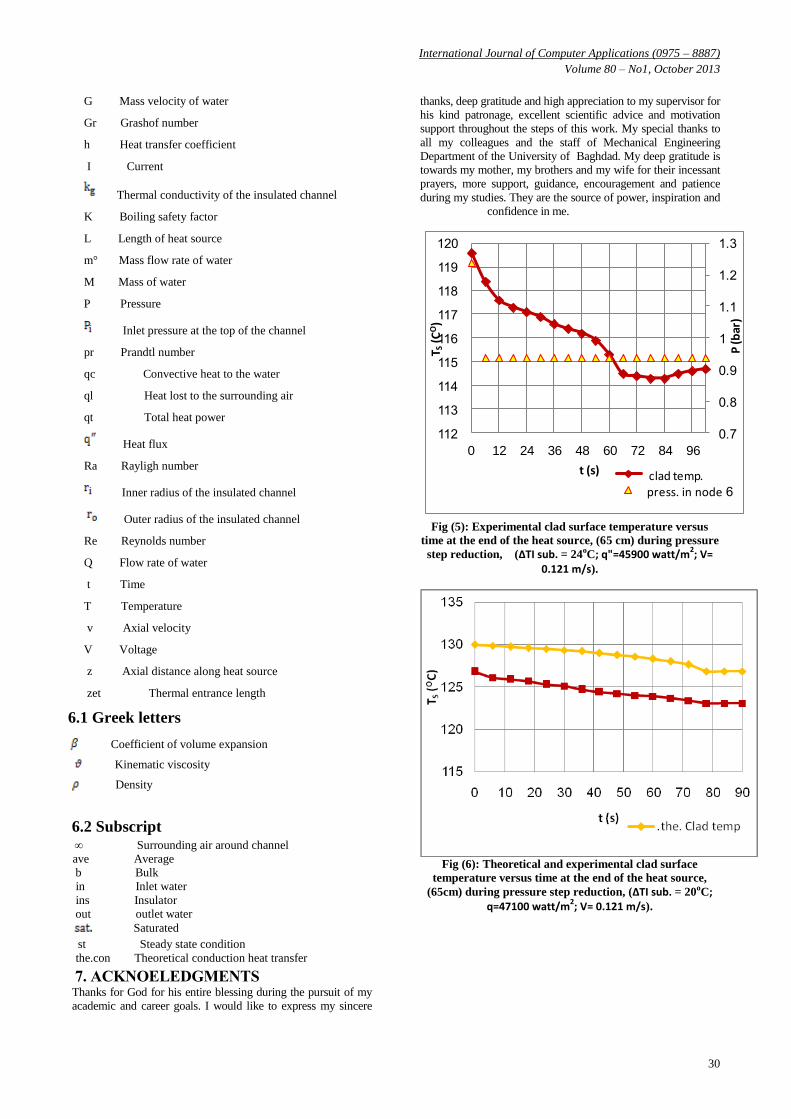
measured or calculated. Figure (5) shows the effect of
pressure step reduction transient on the heat source clad
surface temperature at the end of the electrical heat source,
(65 cm) and (ΔTI sub.= 24oC). The figure shows that the
maximum surface temperature measured at the end of the heat
source starts to decreases after initiating the transient due to
the effect of water bulk temperature decrease affected by the
water phase change which uses water latent heat for
evaporation during its flow at the part of channel where the
local pressure is below the saturation pressure. Figure (6)
shows the effect of pressure step reduction transient on the
heat source clad surface temperature at the end of the
electrical heat source, (65 cm) and (ΔTI sub.= 20oC). The
figure shows the same behavior of figure (5). The figure also
illustrate that the difference between the experimental and
theoretical approach is acceptable. Figure (7) represents the
curves plotted for pressure step reduction transient conditions
at ΔTI sub. equals (30oC, 24oC and 20oC) respectively. It is
clear that the elapsed time required for clad surface
temperature to reach their steady state values is proportional
to the water sub-cooled degree at the channel inlet. The figure
illustrates also the behavior of clad temperature based on
experimental results. It is clear that water sub-cooled
temperature at channel inlet slightly affect the clad
temperature after the end of the transient course. Figure (8)
shows the effect of pressure ramp reduction transient on the
heat source clad surface temperature at the end of the
electrical heat source, (65 cm) and (ΔTI sub.= 24OC). It shows
the pressure ramp reduction effect based on 30 seconds
period. The figure shows that the measured surface
temperature at the end of the heat source decreases versus
pressure reduction due to the effect of water bulk temperature
decrease affected by the water phase change which uses water
latent heat for evaporation during its flow at the part of
channel where the local pressure is below the saturation
pressure. Figure (9) shows the effect of pressure reduction
transient according to sinusoidal disturbance function on the
heat source clad surface temperature at the end of the
electrical heat source, (65 cm) and (ΔTI sub.= 24 CO). Three
transient periods are selected during these experiments (30
seconds, 60 seconds and 90 seconds) which represents
pressure reduction period. Figure (9) shows the pressure
reduction effect based on 30 seconds period. As discussed
before that the surface temperature is directly proportional to
the pressure reduction history and the values of these
temperatures follow the same disturbance function shape
without any time delay. This behavior is affected by water
velocity in the channel and the period of the disturbance
function. It is clear also that maximum difference between the
clad surface temperature at this point before the transient
course and within the whole disturbance cycle does not
exceed 2.5oC. Figure (10) shows the experimental and
theoretical bulk water temperature versus elapsed time
required to reach the steady state condition at the end of the
heat source, (65 cm) and (ΔTI sub.= 20oC). The figure shows
that the maximum water temperature is measured at the end of
the heat source then it begins to decrease due to the effect of
water bulk temperature decrease affected by the water phase
change which uses water latent heat for evaporation during its
flow at the part of channel where the local pressure is below
the saturation pressure. The figure illustrates also perfect
compatibility between theoretical and experimental results.
The experimental results related to the water bulk temperature
versus the elapsed time required to reach these temperatures
to their steady state values at the end of the heat source, 65 cm
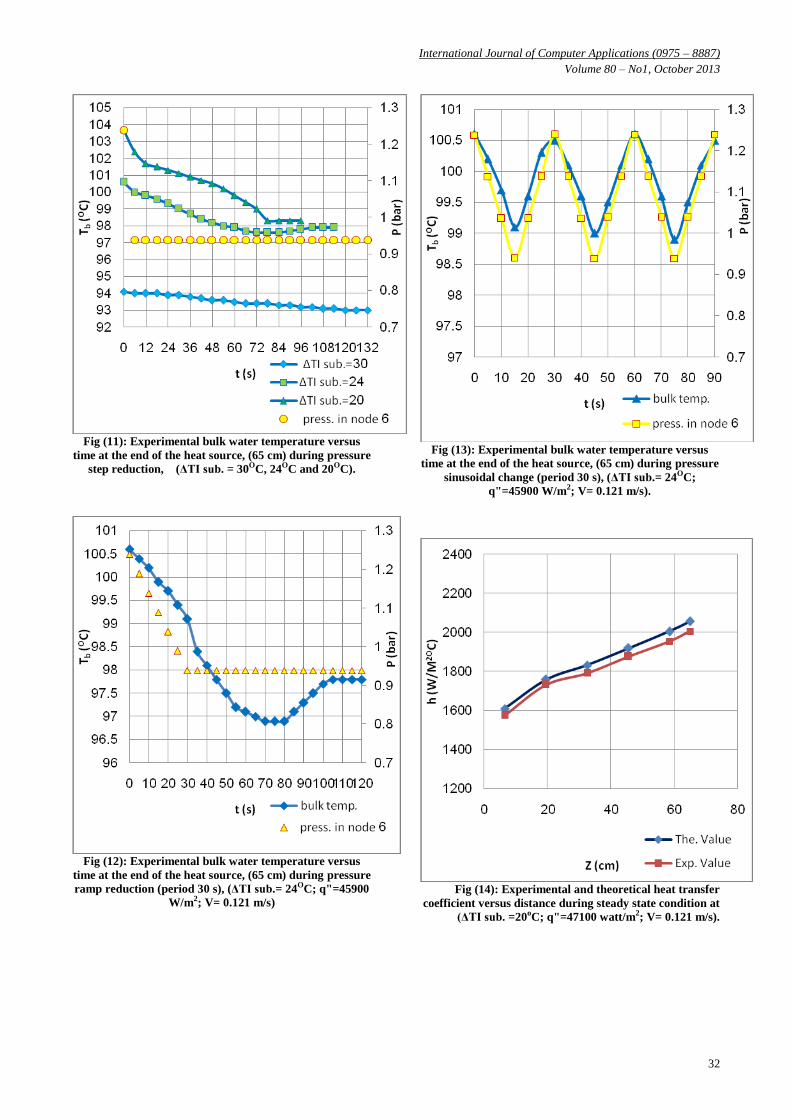
are plotted. Figure (11) represents the curves plotted for
pressure step reduction transient conditions at ΔTI sub. equals
(30oC, 24oC and 20oC) respectively. It is clear that the elapsed
time required for bulk water temperature to reach their steady
state values is proportional to the water sub-cooled degree at
the channel inlet. Table (1) shows the related parameters at
(100%) elapsed time of each ΔTI sub. at the end of the heater,
(65 cm). The effect of pressure reduction ramp change
transient on the bulk water temperature at the end of the
electrical heat source, (65 cm) related to water sub-cooled
temperature (ΔTI sub.= 24 CO) plotted in figure (12). Three
transient periods are selected during these experiments (30
seconds, 60 seconds and 90 seconds) which represents
pressure ramp reduction period. Figure (12) shows the
pressure ramp reduction effect based on 30 seconds period.
The figure shows that the measured water bulk temperature at
the end of the heat source decreases versus pressure reduction
due to water phase change which uses water latent heat for
evaporation during its flow at the part of channel where the
local pressure is below the saturation pressure. The figure
illustrates that as the transient period increase the water bulk
temperature graph posse flatter response. Another conclusion
is investigated which prove that pressure reduction period do
not affect water bulk temperature value at the end of the
transient course, while the elapsed time required for water
bulk temperature to reaches their steady state values is

International Journal of Computer Applications (0975 – 8887)
Volume 80 – No1, October 2013
29
proportional to the pressure reduction period. Figure (13)
shows the effect of pressure reduction transient according to
sinusoidal disturbance function on the water bulk temperature
at the end of the electrical heat source, (65 cm) and (ΔTI
sub.= 24oC). Three transient periods are selected during these
experiments (30 seconds, 60 seconds and 90 seconds) which
represents pressure reduction period. Figure (13) shows the
pressure reduction effect based on 30 seconds period. As
discussed before that the water bulk temperature is directly
proportional to the pressure reduction history and the values
of these temperatures follow the same disturbance function
shape. Another conclusion is reached that demonstrates water
bulk temperature at the end of the transient is proportional to
the transient period. Figure (14) shows the experimental and
theoretical values of the heat transfer coefficient versus
distance during steady state condition at (ΔTI sub. = 20oC).
The figure reveals that the heat transfer coefficient
distribution along the heat source length after reaching the
steady state condition keeps its linear proportionality with
distance which ensures maximum heat transfer coefficient at
the end of the heat source, (65 cm) due to the effect of average
bulk water velocity increase along the channel affected by
water density decease to ensure continuity provision. The
figure shows agreeable conformity between the experimental
and theoretical results. Figure (15) shows the experimental
and theoretical heat transfer coefficient versus the elapsed
time after reaching the steady state condition at the end of the
heat source, (65 cm) during (ΔTI sub.= 20oC) and pressure
step reduction transient. The heat transfer coefficient at the
end of the channel decreases with time during pressure
reduction transient due to the effect of film boiling near the
heat source surface at the that portion which reduces the
ability of the two phase flow on heat transfer mechanism
between the heat source surface and bulk water. The figure
shows agreeable conformity between the experimental and
theoretical results.
5. CONCLUSIONS The results of the experimental and theoretical investigation
are mainly describes the thermal-hydraulic behavior of an
electrical heat source cooled by forced convection of water
flow in upward in a vertical annulus during pressure reduction
transient conditions. As many other previous researches
outputs and conclusions of such type of studies describes the
safety margins of boiling crisis, necessary mitigating action
required to be interfered by the engineering safety features
systems, ESFS. The following conclusions can be made:
1- Pressure reduction studied by three types of disturbance
functions (step change, ramp change and sinusoidal) showed
that pressure reduction effect on the bulk water and heat
source surface temperatures is more evident in step and ramp
disturbance functions than that of pressure reduction
according to sinusoidal disturbance function due to the
continuous pressure recovery after each half period.
2- Heat transfer process improves versus pressure reduction
transient due to the effect of nucleate boiling which depends
on the nominal power rate, pressure decrease rate, coolant
mass flow rate, channel geometry and sub-cooled degree of
inlet water. The heat source surface temperature is affected by
both the phase of the bulk water and its temperature, as the
heat transfer between the surface and the bulk water is
affected by the turbulence initiation due to the bubble
formation on the surface which nominated by nucleate boiling
and predicted by boiling safety factor as mentioned in
previous chapters.
3- As the power source is constant heat flux, clad surface
temperature reaches its maximum value at the end of the heat
source, (0.65 m) while the flow pressure decreases in the
upward direction due to the friction and head pressure loss
which leads to initialization of the boiling crisis at that part of
the channel.
4- Step change pressure reduction showed that water bulk
temperature reaches to almost same temperature after the step
pressure reduction nevertheless the water sub-cooled degree at
the channel inlet, while the elapsed time required to reaches
this steady state value is proportional to the water sub-cooled
degree and the maximum elapsed time is 125 s for 30oC sub-
cooled degree. It is concluded also that heat source surface
temperature is inversely proportional to the water sub-cooled
degree as it reaches its maximum value at 20oC water sub-
cooled degree while the maximum time required to reach the
steady state value again is 118 s at water sub-cooled of 30oC.
6- Ramp pressure reduction transient showed that the elapsed
time required for both water bulk temperature and heat source
surface temperature to reach their steady state values after
transient course is proportional to the transient period. This
time is 158s for bulk water temperature and 152 s for heat
source surface temperature at transient period equal 90 s.
which means that any safety system response to such power
transients are more effective when their temperature sensors
are linked to surface clad rather than bulk water.
7- Sinusoidal pressure reduction transient proved that both
water bulk temperature and heat source surface temperature
follows same pressure reduction shape and period due to
immediate pressure recovery that do not allow phase change
in the flowing water.
8- The heat transfer enhancement due to the nucleate boiling
and its poor characteristic due to the film boiling
accompanied by CHF should be taken under consideration in
any thermal design of power generation systems selecting
proper boiling safety factor, (K) for their thermal hydraulic
design.
6. NOMENCLATURE
Surface area of channel
As Surface area of heat source
Cp Specific heat of constant pressure
di Inner diameter of heat source
do Outer diameter of channel
Dh Hydraulic diameter= (Do-Di)
f Friction factor (f= 64/ Re)
g Gravity acceleration
International Journal of Computer Applications (0975 – 8887)
Volume 80 – No1, October 2013
30
G Mass velocity of water
Gr Grashof number
h Heat transfer coefficient
I Current
Thermal conductivity of the insulated channel
K Boiling safety factor
L Length of heat source
m° Mass flow rate of water
M Mass of water
P Pressure
Inlet pressure at the top of the channel
pr Prandtl number
qc Convective heat to the water
ql Heat lost to the surrounding air
qt Total heat power
Heat flux
Ra Rayligh number
Inner radius of the insulated channel
Outer radius of the insulated channel
Re Reynolds number
Q Flow rate of water
t Time
T Temperature
v Axial velocity
V Voltage
z Axial distance along heat source
zet Thermal entrance length
6.1 Greek letters
Coefficient of volume expansion
Kinematic viscosity
Density
6.2 Subscript ∞ Surrounding air around channel
ave Average
b Bulk
in Inlet water
ins Insulator
out outlet water
Saturated
st Steady state condition
the.con Theoretical conduction heat transfer
7. ACKNOELEDGMENTS Thanks for God for his entire blessing during the pursuit of my
academic and career goals. I would like to express my sincere
thanks, deep gratitude and high appreciation to my supervisor for
his kind patronage, excellent scientific advice and motivation
support throughout the steps of this work. My special thanks to
all my colleagues and the staff of Mechanical Engineering
Department of the University of Baghdad. My deep gratitude is
towards my mother, my brothers and my wife for their incessant
prayers, more support, guidance, encouragement and patience
during my studies. They are the source of power, inspiration and
confidence in me.
0 12 24 36 48 60 72 84 96
P (b
ar)
T S(C
O)
t (s) .clad temp press. in node
Fig (5): Experimental clad surface temperature versus
time at the end of the heat source, (65 cm) during pressure
step reduction, (ΔTI sub. = 24oC; q"=45900 watt/m2; V=
0.121 m/s).
Fig (6): Theoretical and experimental clad surface
temperature versus time at the end of the heat source,
(65cm) during pressure step reduction, (ΔTI sub. = 20oC; q=47100 watt/m
2; V= 0.121 m/s).

International Journal of Computer Applications (0975 – 8887)
Volume 80 – No1, October 2013
31
0 12 24 36 48 60 72 84 96 108120132
p (b
ar)
T S(O
C)
t (s) .=Δ I sub
.=Δ I sub
.=Δ I sub
Fig (7): Experimental clad surface temperature versus
time at the end of the heat source, (65 cm) during pressure
step reduction, (ΔTI sub. = 30oC, 24oC and 20oC).
0 12 24 36 48 60 72 84 96 108120
P (b
ar)
T S(O
C)
t (s) .clad temp
press. in node
Fig (8): Experimental clad surface temperature versus
time at the end of the heat source, (65 cm) during pressure
ramp reduction (period 30 s), (ΔTI sub. = 24oC; q"=45900
watt/m2; V= 0.121 m/s).
Fig (9): Experimental clad surface temperature versus
time at the end of the heat source, (65 cm) during pressure
sinusoidal change (period 30 s), (ΔTI sub.= 24oC; q"=45900 W/m
2; V= 0.121 m/s).
Fig (10): Theoretical and experimental bulk water
temperature versus time at the end of the heat source,
(65cm) during pressure step reduction, (ΔTI sub. = 20OC;
q=47100 W/m2; V= 0.121 m/s).
International Journal of Computer Applications (0975 – 8887)
Volume 80 – No1, October 2013
32
Fig (11): Experimental bulk water temperature versus
time at the end of the heat source, (65 cm) during pressure
step reduction, (ΔTI sub. = 30OC, 24OC and 20OC).
Fig (12): Experimental bulk water temperature versus
time at the end of the heat source, (65 cm) during pressure
ramp reduction (period 30 s), (ΔTI sub.= 24OC; q"=45900
W/m2; V= 0.121 m/s)
Fig (13): Experimental bulk water temperature versus
time at the end of the heat source, (65 cm) during pressure
sinusoidal change (period 30 s), (ΔTI sub.= 24OC;
q"=45900 W/m2; V= 0.121 m/s).
Fig (14): Experimental and theoretical heat transfer
coefficient versus distance during steady state condition at
(ΔTI sub. =20oC; q"=47100 watt/m2; V= 0.121 m/s).

International Journal of Computer Applications (0975 – 8887)
Volume 80 – No1, October 2013
33
Fig (15): Experimental and theoretical heat transfer
coefficient versus time at the end of the heat source,
(65cm), (ΔTI sub.= 20oC; q"=47100 watt/m2; V= 0.121
m/s).
8. REFERENCES [1] Sarmad Aziz (2012) "Experimental Study of Power
Increase Transient in Heat Generation Systems
Simulated by Immersed Heat Source" A thesis submitted
to the college of engineering university of Baghdad in
partial fulfillment of the requirements for the degree of
master of science in mechanical engineering.
[2] Collier, J. G. (1981) "Convective boiling and
condensation" (2nd end.) McGraw-Hill, New York.
[3] Kwang-Won Lee and Sang-Yong Lee. (1997) "An
investigation of transition boiling mechanisms of
subcooled water under forced convective conditions
"Journal of Nuclear Engineering and Design, Vol. 177,
PP. 25-39.
[4] K. E. GUNGOR and R. H. S. WINTERTON (1985) "A
general correlation for flow boiling in tubes and
annuli" Department of Mechanical Engineering,
University of Birmingham, Journal of heat and mass
transfer Vol. 29, No. 3, PP. 351-358.
[5] V.Prodanvic, D.Fraser and M.Salcudean. (2002) "On the
transition from partial to fully developed subcooled flow
boiling"International Journal of Heat and Mass Transfer
Vol.45, PP. 4727-4738.
[6] Hamid Saffari and Mehdi Ghobadi. (2010) "Calculation of
convective boiling in a vertical tube at sub-atmospheric
pressures"Australian Journal of Basic and Applied
Sciences, 4(5), PP. 687-697.
[7] K.H. Bang, K.K. Kim, S.K. Lee and B.W. Lee (2011) " Pressure effect on flow boiling heat transfer of water in
minichannels" International Journal of Thermal Sciences,
Vol. 50 PP. 280 – 286.
[8] Xiao Hu, Guiping, Yan Cai and Dongsheng (2011) "
Experimental study of flow boiling of FC-72 in parallel
minichannels under sub-atmospheric pressure" Applied
Thermal Engineering, Vol.31, PP. 3839-3853.
[9] Dr.Harlan H.Bengtson,P.E. (2010) "Convection heat
transfer coefficient estimation" www.SunCam.com, PP.
2-40.
[10] M.A.Ebadian and Z.F.Dong. (2006) "Forced convection,
internal flow in ducts "Chapter 5, Florida International
University.
[11] M.M.El.Wakil. (1962) "Nuclear Power Engineering "
McGraw-Hill Book Company, New York.
[12] A.W.Ezzat and H.M.Taki. (1988) Final safety report for
14th Tammuz 5000 KW reactor, INC, Iraq nuclear
commission under the supervision of IAEA, paragraph
5.4.
[13] LAEA Library Cataloguing in publication DATA. (2008)
) " Safety analysis for research reactors " International
Atomic Energy Agency, Vienna, Safety Reports Series,
No. 55. P.B Whalley (1987) " Boiling, Condensation &
Gas Liquid flow" Clarendon.
[14] P.B Whalley (1987) " Boiling, Condensation & Gas
Liquid flow" Clarendon.
IJCATM : www.ijcaonline.org