Embed Size (px)
Citation preview

THERMO-HYDRAULIC ANALYSIS OF THE PBMR
FUEL HANDLING AND STORAGE SYSTEM
PHILIP LOUIS LE ROUX
B.ENG. (MECHANICAL)
DISSERTATION SUBMITTED IN PARTIAL FULFILMENT OF THE
REQUIREMENTS FOR THE DEGREE
MAGISTER ENGENERIAE (MECHANICAL ENGINEERING)
IN THE FACULTY OF ENGINEERING AT THE
NORTH-WEST UNIVERSITY, POTCHEFSTROOM CAMPUS.
Promoter: Prof M Kleingeld
Potchefstroom
2010

THERMO-HYDRAULIC ANALYSIS OF THE PBMR FUEL HANDLING AND STORAGE SYSTEM PAGE - I -
ABSTRACT
The work done for this dissertation is based on actual thermo-hydraulic design work
done during 2002 to 2006 on one of the subsystems of the Pebble Bed Modular
Reactor (PBMR).
The Pebble Bed Modular Reactor is a proved revolutionary small, compact and safe
nuclear power plant. It operates on a direct closed Brayton cycle. One of the unique
features of this concept is its ability to easily regulate the power output depending on
the electricity demand.
The PBMR fuel comprises particles of enriched uranium dioxide coated with silicon
carbide and pyrolytic carbon. The particles are encased in graphite to form a fuel
sphere or pebble about the size of a billiard ball. The core of the reactor contains
approximately 360 000 of these fuel spheres for a 400 MW design reactor.
The fuel spheres are continuously circulated through the reactor core via a closed loop
helium conveying system, referred to as the Fuel Handling and Storage System
(FHSS). The system is also responsible for discharging spent-fuel spheres to the
spent-fuel storage area and recharging the reactor with fresh fuel spheres.
The focus of this dissertation is the thermo-hydraulic design of the FHSS system, with
specific focus on the FHSS helium circulator, referred to as the FHSS blower. The
FHSS blower is a single-stage centrifugal machine, submerged in an enclosed
pressure boundary, which forms part of the closed-loop helium pressure boundary.
The aim of the dissertation is to simulate all the operating parameters of the system to
determine the volumetric flow rate and pressure rise the impeller of the blower has to
deliver.
Due to the complexity of the simulation model and lack of experimental data a
Sensitivity and Monte Carlo study was also done.
The output of the study is sufficient thermo-hydraulic data to design all the major
components of the FHSS system. For components such as the piping and pressure
boundary this includes (i) temperature, (ii) pressure and (iii) heat transfer through the
material at all the operating conditions. For the blower it includes; (i) blower mass
flow rate, (ii) pressure ratio, (iii) inlet pressure and (iv) inlet temperature at all the
operating conditions.

THERMO-HYDRAULIC ANALYSIS OF THE PBMR FUEL HANDLING AND STORAGE SYSTEM PAGE - II -
UITTREKSEL
Die basis vir hierdie verhandeling is die termo hidroliese ontwerp wat uitgevoer is
gedurende die periode vanaf 2002 tot 2006 op een van die Kieselbed Kern Reaktor
(KKR) se substelsels.
Die Kieselbed Kern Reaktor (KKR) is ʼn revolusionêre klein, kompakte en veilige
kernaanleg. Dit word deur middel van ʼn direkte geslote Brayton siklus aangedryf. Een
van die unieke kenmerke van hierdie konsep is die vermoë om kraglewering te
reguleer soos wat die elektrisiteitsaanvraag varieer gedurende bedryfstoestande.
Die KKR brandstof bestaan uit partikels verrykde uraandioksied met ‘n silikon
karbied en ‘n pyrolitiese koolstoflaag rondom. Die partikels word bedek met grafiet
en gevorm om ‘n brandstofsfeer omtrent die grootte van ‘n snoekerbal aan te neem.
Die kern van die reaktor bevat ongeveer 360 000 van hierdie brandstofsfere.
Die brandstofsfere word deurlopend deur die reaktorkern gesirkuleer via ‘n geslote
helium vervoerstelsel, bekend as die Brandstof Hantering en Bewaring Stelsel
(BHBS). Die stelsel is ook verantwoordelik om volledige ontbrande sfere te vervang
met vars brandstofsfere.
Die fokus van hierdie skripsie is die termo hidrouliese ontwerp van die BHBS stelsel,
met spesifieke fokus op die BHBS gas-sirkulerings komponente, ook bekend as die
BHBS waaier. Die waaier is n enkelstadium sentrifugale masjien binne-in die
drukgrens van die totale BHBS stelsel.
Weens die kompleksiteit van die simulasiemodel en tekort aan eksperimentele data is
‘n Sensitiwiteits-, asook ʼn Monte Carlo-studie uitgevoer.
Die resultate van die studie sluit voldoende inligting in om al die hoofkomponente
van die BHBS te ontwerp. Vir komponente soos die pype en die drukgrens sluit dit in;
(i) temperatuur, (ii) druk en (iii) die hitte-oordrag deur al die materiaalwande vir alle
bedryfstoestande. Vir die waaier sluit dit in; (i) waaiermassa-vloei benodig, (ii)
drukverhouding, (iii) inlaatdruk en (iv) inlaattemperatuur vir alle bedryfstoestande.
Die waaier is die hoof-fokus van die verhandeling.

THERMO-HYDRAULIC ANALYSIS OF THE PBMR FUEL HANDLING AND STORAGE SYSTEM PAGE - III -
TABLE OF CONTENTS
1. INTRODUCTION ............................................................................................... 1
1.1 BACKGROUNDD ........................................................................................... 1
1.2 PROBLEM STATEMENT .............................................................................. 9
1.3 LITERATURE SURVEY ON BLOWERS ..................................................... 10
1.4 OVERVIEW OF REPORT ............................................................................. 18
2. DESCRIPTION OF AN APPROPRIATE SOLVING METHOD .................. 19
2.1 PREAMBLE .................................................................................................. 19
2.2 BACKGROUND ON FLOWNEX ................................................................. 21
2.3 PROCESS DEVELOPED FOR THE ANALYSIS .......................................... 24
2.4 VERIFICATION AND VALIDATION (V&V) OF THE CODE..................... 27
3. SIMULATION MODEL ................................................................................... 29
3.1 PREAMBLE .................................................................................................. 29
3.2 SENSITIVITY AND MONTE CARLO STUDY FOR SPHERE VELOCITY
CALCULATION ................................................................................................ 30
4. INTERPRETATION AND VERIFICATION OF RESULTS ......................... 49
4.1 PREAMBLE .................................................................................................. 49
4.2 SENSITIVITY AND MONTE CARLO STUDY RESULTS .......................... 49
4.3 FHSS SIMULATION RESULTS ................................................................... 60
5. CONCLUSION AND RECOMMENDATIONS .............................................. 76
6. REFERENCES .................................................................................................. 82
APPENDIX A ........................................................................................................ 86
MONTE CARLO SIMULATIONS INPUT DISTRIBUTION .............................. 86
APPENDIX B ........................................................................................................ 90
FHSS FLOWNEX MODEL DESCRIPTION ....................................................... 90

THERMO-HYDRAULIC ANALYSIS OF THE PBMR FUEL HANDLING AND STORAGE SYSTEM PAGE - IV -
GENERIC INPUTS AND ASSUMPTIONS ........................................................ 91
DETAILED ELEMENTS DESCRIPTION ......................................................... 105
OUTSTANDING ISSUES .................................................................................. 129
MODEL LIMITATIONS .................................................................................... 130

THERMO-HYDRAULIC ANALYSIS OF THE PBMR FUEL HANDLING AND STORAGE SYSTEM PAGE - V -
LIST OF ABBREVIATIONS
AGS Auxiliary Gas System
AMS Activity Measurement Sensor
ASME American Society of Mechanical Engineers
ATL Air Test Loop
BUMS Burn-up Measurement Sensor
CBA Conveying Block Assembly
CCS Core Conditioning System
CFD Computational Fluid Dynamics
CUD Core Unloading Device
DSI Double Seat Isolation
FHSS Fuel Handling and Storage System
FRI Flow Restricting Indexer (Drucksperre)
GRBA Gas Return Block Assembly
GSBA Gas Supply Block Assembly
HICS Helium Inventory Control System
HPC High-pressure Compressor
HVAC Heating, Ventilation and Air-conditioning System
IBA Isolation Block Assembly
ICS Inventory Control System
MCR Maximum Continuous Rating
MCRI Maximum Continuous Rating Inventory
MPS Main Power System
NNR National Nuclear Regulator
NQA Nuclear Quality Assurance
PBMR Pebble Bed Modular Reactor (The unit, The Project or The Company)
PCU Power Conversion Unit
PPB Primary Pressure Boundary
PU for CHE Potchefstroom University for Christian Higher Education
QAP Quality Assurance Procedure
ROT Reactor Outlet Temperature
RSS Reserve Shutdown System
RU Reactor Unit
SAS Small Absorber Spheres
SFSS Spent-fuel Storage System
SLP Sphere Loading Pipe (in SFSS)
SRP Sphere Return Pipe (in SFSS)
SUP Sphere Unloading Pipe (in SFSS)

THERMO-HYDRAULIC ANALYSIS OF THE PBMR FUEL HANDLING AND STORAGE SYSTEM PAGE - VI -
TBC To be Confirmed
TBD To be Determined
TD Transfer Device (in SFSS)
TUD Tank Unloading Device
US User Specified Element (Flownex)

THERMO-HYDRAULIC ANALYSIS OF THE PBMR FUEL HANDLING AND STORAGE SYSTEM PAGE - VII -
LIST OF FIGURES
FIGURE 1: A PRESENTATION OF THE PEBBLE FUEL DESIGN. ........................................... 1
FIGURE 2: SIMPLIFIED DIAGRAM OF A DIRECT BRAYTON CYCLE NUCLEAR POWER
CONVERSION SYSTEM. ......................................................................................... 3
FIGURE 3: THE TEST MODEL THAT WAS BUILT AT THE PU FOR CHE ............................. 4
FIGURE 4: LAYOUT OF THE PBMR .............................................................................. 5
FIGURE 5: LAYOUT OF THE PBMR FUEL HANDLING AND STORAGE SYSTEM ................ 8
FIGURE 6: BLOWER SELECTION GUIDE FROM PAXTON BLOWER SELECTION CHART .... 13
FIGURE 7: BLOWER CHARACTERISTICAL MAP ........................................................... 15
FIGURE 8: BASIC BUILDING BLOCKS OF A NETWORK ................................................. 25
FIGURE 9: SPHERE ROLL AND SLIP DIAGRAM ............................................................ 31
FIGURE 10: SPHERE VELOCITY DIAGRAM ................................................................... 32
FIGURE 11: EXTERNAL FORCE ON SPHERE................................................................. 33
FIGURE 12: EXAMPLE OF SPHERE ROTATION INCLUDED IN SPHERE VELOCITY
CALCULATION .................................................................................................. 36
FIGURE 13: SIDE VIEW OF SPHERE CONVEYING PIPING SIMULATED ............................. 44
FIGURE 14: SPHERE VELOCITY PROFILE FOR A 58.5MM SPHERE ................................. 44
FIGURE 15: SPHERE VELOCITY PROFILE FOR A 61MM SPHERE .................................... 44
FIGURE 16: 10° PNEUMATIC BRAKE SECTION ............................................................ 45
FIGURE 17: 33.4° PNEUMATIC BRAKE SECTION ......................................................... 46
FIGURE 18: PNEUMATIC BRAKE SECTION BEFORE SPHERE STORAGE AREA.................. 47
FIGURE 19: 10º PNEUMATIC BRAKE SECTION ANALYSIS ............................................ 48
FIGURE 20: 33.4º PNEUMATIC BRAKE SECTION ANALYSIS ......................................... 48
FIGURE 21: MULTI ANGLED PNEUMATIC BRAKE SECTION ANALYSIS......................... 48
FIGURE 22: MONTE CARLO RESULTS AT 1000KPA AND 250ºC ................................... 54

THERMO-HYDRAULIC ANALYSIS OF THE PBMR FUEL HANDLING AND STORAGE SYSTEM PAGE - VIII -
FIGURE 23: MONTE CARLO RESULTS AT 1000KPA AND 250ºC WITH NO COUNTER FLOW
........................................................................................................................ 55
FIGURE 24: MONTE CARLO RESULTS AT 3300KPA AND 150ºC ................................... 56
FIGURE 25: MONTE CARLO RESULTS AT 3300KPA AND 150ºC WITH NO COUNTER FLOW
........................................................................................................................ 57
FIGURE 26: MONTE CARLO RESULTS AT 9000KPA AND 150ºC ................................... 58
FIGURE 27: MONTE CARLO RESULTS AT 9000KPA AND 150ºC WITH NO COUNTER FLOW
........................................................................................................................ 59
FIGURE 28: FHSS NORMAL OPERATION REQUIRED BLOWER OPERATING PARAMETERS
........................................................................................................................ 61
FIGURE 29: BLOWER DESIGN PARAMETERS OVERLAID ON THE HTF IMPELLER .......... 62
FIGURE 30: BLOWER DESIGN PARAMETERS OVERLAID ON THE HTF IMPELLER .......... 63
FIGURE 31: DUST CLEANING OPERATION SUMMARY ................................................. 66
FIGURE 32: BLOWER DESIGN PARAMETERS FOR SPHERE CIRCULATION ..................... 68
FIGURE 33: BLOWER DESIGN PARAMETERS FOR DE-FUEL OPERATION ....................... 70
FIGURE 34: BLOWER DESIGN PARAMETERS FOR UNLOAD OPERATION ....................... 71
FIGURE 35: BLOWER DESIGN PARAMETERS FOR CLEANING OPERATION .................... 73
FIGURE 36: SUMMARY OF BLOWER DESIGN PARAMETERS FOR FHSS AIR OPERATION 75
FIGURE 37: FHSS BLOWER DESIGN PARAMETERS FOR HIGH PRESSURE OPERATION .. 77
FIGURE 38: FHSS LOW PRESSURE OPERATION BLOWER DESIGN PARAMETERS
OVERLAID ON THE HTF IMPELLER ..................................................................... 78
FIGURE 39: SUMMARY OF BLOWER DESIGN PARAMETERS FOR FHSS AIR OPERATION 80
FIGURE 40: REDUCTION GAS FLOW PATH ................................................................. 92
FIGURE 41: CROSS SECTION OF INSULATED PIPE ....................................................... 93
FIGURE 42: 3D SECTION OF INSULATED PIPE ............................................................. 93
FIGURE 43: FHSS HEAT EXCHANGER CHARACTERISTIC ............................................ 97
FIGURE 44: VIEW OF THE FRI HEAD ......................................................................... 98

THERMO-HYDRAULIC ANALYSIS OF THE PBMR FUEL HANDLING AND STORAGE SYSTEM PAGE - IX -
FIGURE 45: FHSS FRI CHARACTERISTIC FOR HELIUM ............................................... 99
FIGURE 46: FHSS FRI CHARACTERISTIC FOR AIR .................................................... 100

THERMO-HYDRAULIC ANALYSIS OF THE PBMR FUEL HANDLING AND STORAGE SYSTEM PAGE - X -
LIST OF TABLES
TABLE 1: BLOWER TYPES AND USES IN THE INDUSTRY ............................................... 11
TABLE 2: FORCE BALANCE ON SPHERE ..................................................................... 31
TABLE 3: SPHERE VELOCITY EQUATIONS .................................................................. 32
TABLE 4: SPHERE ENERGY BALANCE ........................................................................ 33
TABLE 5: REQUIRED GAS FLOW FOR SPHERE TERMINAL VELOCITY CALCULATION ....... 34
TABLE 6: SPHERE ACCELERATION, VELOCITY AND DISPLACEMENT CALCULATION ...... 35
TABLE 7: CIRCULATION OPERATION SYSTEM BOUNDARY CONDITIONS ..................... 38
TABLE 8: SPHERE FLOW PATH FOR MASS FLOW RATE CALCULATION ........................... 42
TABLE 9: PARAMETER INPUT SENSITIVITY STUDY ..................................................... 51
TABLE 10: SENSITIVITY STUDY SUMMARY ................................................................ 53
TABLE 11: PIPE ANGLE SENSITIVITY .......................................................................... 53
TABLE 12: FHSS SPHERE CIRCULATION REQUIRED DURING NORMAL BLOWER
OPERATING CONDITIONS ................................................................................... 60
TABLE 13: BLOWER DESIGN PARAMETERS FOR REFUELLING OPERATION .................. 62
TABLE 14: BLOWER DESIGN PARAMETERS FOR REFUELLING OPERATION .................. 63
TABLE 15: BLOWER PARAMETERS FOR CLEANING OPERATION .................................. 65
TABLE 16: BLOWER DESIGN PARAMETERS FOR SPHERE CIRCULATION....................... 66
TABLE 17: SPHERE VELOCITIES DURING CIRCULATION OPERATION ........................... 67
TABLE 18: BLOWER DESIGN PARAMETERS FOR DE-FUEL OPERATION ........................ 68
TABLE 19: SPHERE VELOCITIES DURING DE-FUEL OPERATION ................................... 69
TABLE 20: BLOWER DESIGN PARAMETERS FOR UNLOAD OPERATION ........................ 71
TABLE 21: SPHERE VELOCITIES DURING UNLOAD OPERATION ................................... 71
TABLE 22: BLOWER DESIGN PARAMETERS FOR CLEANING OPERATION ...................... 72
TABLE 23: SUMMARY OF BLOWER DESIGN PARAMETERS FOR FHSS AIR OPERATION 74
THERMO-HYDRAULIC ANALYSIS OF THE PBMR FUEL HANDLING AND STORAGE SYSTEM PAGE - XI -
TABLE 24: CALCULATED SPHERE TERMINAL VELOCITIES FOR AIR OPERATION .......... 74
TABLE 25: FHSS BLOWER DESIGN PARAMETERS FOR HIGH PRESSURE OPERATION ... 76
TABLE 26: FHSS LOW PRESSURE OPERATION BLOWER DESIGN PARAMETERS ........... 77
TABLE 27: SUMMARY OF BLOWER DESIGN PARAMETERS FOR FHSS AIR OPERATION 79
TABLE 28: ELEMENT NUMBERING CONVENTION ....................................................... 90
TABLE 29: GENERIC PIPE BEND LOSSES .................................................................... 91
TABLE 30: IMPLEMENTED JUNCTION LOSSES ............................................................. 92
TABLE 31: GENERIC VALUES FOR INSULATED PIPE ELEMENTS. ................................... 94
TABLE 32: ELEMENTS PRESENTED WITH HEAT TRANSFER TO AMBIENT...................... 94
TABLE 33: HEAT EXCHANGER INPUT PARAMETERS (ELEMENT 2320) ......................... 97
TABLE 34: ELEMENTS REPRESENTING THE TUD ...................................................... 102
THERMO-HYDRAULIC ANALYSIS OF THE PBMR FUEL HANDLING AND STORAGE SYSTEM
PAGE - 1 -
1. INTRODUCTION
1.1 BACKGROUNDD
To better understand the operation of the Fuel Handling and Storage System (FHSS) it is
necessary to give a brief background on the Pebble Bed Modular reactor (PBMR) project as a
whole, including the operation of the entire plant.
The increasing demand for energy in the world created an extensive research field for finding
alternative ways to convert energy into electricity. Nuclear power was always considered as a
potential solution to the problem, although questions regarding its safety have always been
raised.
The outstanding features of the PBMR concept are that it is a potentially small, safe, clean,
cost-effective and robust nuclear reactor in its operation. During the initial phases of the
project South Africa’s power utility giant, Eskom, has committed itself to the development of
the PBMR so that, in the future, it can play a leading role as a major energy provider.
The nuclear technology of the PBMR is based on a concept that was developed in Germany
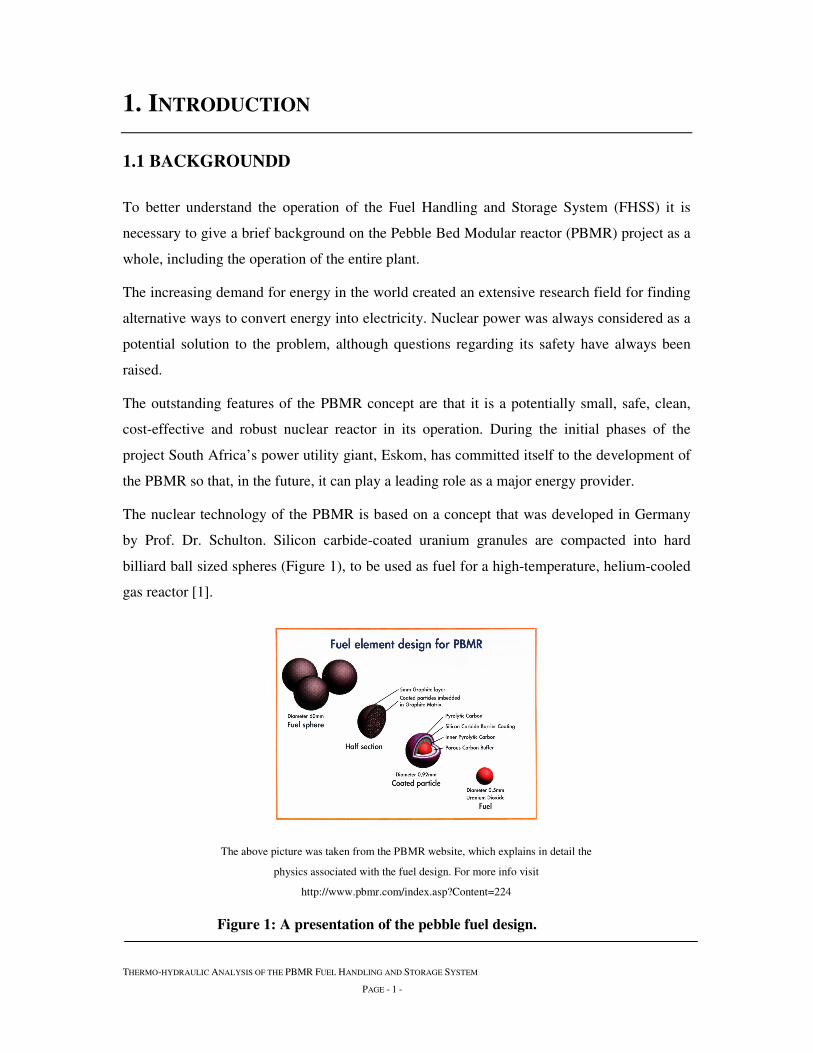
by Prof. Dr. Schulton. Silicon carbide-coated uranium granules are compacted into hard
billiard ball sized spheres (Figure 1), to be used as fuel for a high-temperature, helium-cooled
gas reactor [1].
The above picture was taken from the PBMR website, which explains in detail the
physics associated with the fuel design. For more info visit
http://www.pbmr.com/index.asp?Content=224
Figure 1: A presentation of the pebble fuel design.

THERMO-HYDRAULIC ANALYSIS OF THE PBMR FUEL HANDLING AND STORAGE SYSTEM PAGE - 2 -
This concept was transformed into a design that resulted in the AVR (“Arbeidsgemeinschaft
Versuchsreactor”), a 15 MW demonstration pebble bed reactor, built in Germany. It operated
successfully for 21 years, but the intense wave of post-Chernobyl anti-nuclear sentiment that
swept through Europe brought a premature end to this reactor [1].
In 1994, Eskom started with feasibility studies into the design and construction of PBMR’s in
South Africa. The design and costing studies showed that the PBMR has a number of
advantages over other potential power sources [2].
Most of South Africa’s coal-fired power stations are built close to the coal-producing areas.
This requires long power lines from coal-rich areas to the end-user centres, which in turn,
implies high capital costs and transmission losses. Due to poor support infrastructure in South
Africa and the high costs involved, the option of transporting coal to distant power stations is
not feasible. The opportunities in South Africa for producing hydroelectric power stations, or
obtaining power from natural gas, are limited.
Eskom experiences short, sharp, demand peaks in winter that are difficult to accommodate
with the slow ramping characteristics of the existing large power stations. Every modern
utility will pay a premium for plants with load-following capability. Not only does it provide
the utility with the ability to meet all power demands (base and peak load) with the same
plant, but also there are hefty premiums attached to peak load supply [1].
These factors created the need for small electricity generation units situated near the points of
large demand. The PBMR concept, which has a potentially short construction lead-time of
about 4 years, low operating cost and fast load-following characteristics, is such an option.
Furthermore, the pebble fuel used in this concept has inherently safe characteristics.
Research has shown that a closed loop Brayton cycle layout configuration would provide the
optimal thermal efficiency for the PBMR [2]. Figure 2 shows a simplified schematic diagram
of the operation of a Brayton cycle [3].

THERMO-HYDRAULIC ANALYSIS OF THE PBMR FUEL HANDLING AND STORAGE SYSTEM PAGE - 3 -
Helium extraction form system
Helium injection to system
B
Figure 2: Simplified diagram of a direct Brayton cycle nuclear power conversion
system.
The operation of the Brayton Cycle is not important for this dissertation. Note however that
the output power of the generator is controlled by injecting or extracting helium from the
closed-loop cycle by the Inventory Control System (ICS). This process is used to achieve load
following, where the output of the cycle is increased or decreased when the required load
fluctuates.
The difference in pressure levels in the closed-loop Brayton Cycle has a direct effect on the
power produced by the power turbine, which is in turn connected to the generator.
This fluctuation in the system pressure levels, due to output power control, has a direct
influence on the FHSS operation, as the system will be designed to operate across the
spectrum of the total system operating pressures and temperatures.

THERMO-HYDRAULIC ANALYSIS OF THE PBMR FUEL HANDLING AND STORAGE SYSTEM PAGE - 4 -
One of the requirements that needed verification was whether the Brayton Cycle could be
used to achieve load following. A three-shaft recuperative Brayton cycle was tested prior to
this project to better understand the operation and simulation of a Brayton cycle. The test rig
operating on this cycle was built at the Potchefstroom University for Christian Higher
Education (PU for CHE) in 2002 (Figure 3). The project was a success and proved that this
concept is feasible with the cycle being self-sustaining and controllable within the design
limitations [5].
The above photo was taken at engineering department at the Faculty of Engineering at the then PU for CHE micro model.
Figure 3: The test model that was built at the PU for CHE
The system responsible for load-following of the plant, the ICS, can be seen in Figure 4.

THERMO-HYDRAULIC ANALYSIS OF THE PBMR FUEL HANDLING AND STORAGE SYSTEM PAGE - 5 -
Figure 4: Layout of the PBMR

THERMO-HYDRAULIC ANALYSIS OF THE PBMR FUEL HANDLING AND STORAGE SYSTEM PAGE - 6 -
The FHSS is a support subsystem of the Main Power System (MPS) of the PBMR module.
The main purpose of the FHSS is to circulate the spherical fuel elements of the PBMR
through the reactor core during reactor operation. When equilibrium condition is reached in
the core, an almost constant pattern of spheres with different burn-up states throughout the
core is maintained with their associated flux profiles that change little over time.
The reactor core operates according to a ‘multi-pass’ fuelling scheme. This means that fuel
spheres are moved through the core several times before reaching the desired burn-up and
before being discharged. The fuel spheres are circulated by means of a combination of
gravitational flow and pneumatic conveying, using helium as the transporting gas at MPS
operating pressures.
The FHSS also stores the spent-fuel spheres discharged from the reactor after these spheres
have achieved their maximum burn-up. Fresh fuel spheres are then fed into, and circulated
through, the reactor core. The discharge of spent-fuel and the feeding of fresh fuel are
performed while the reactor is at a steady state operation. Provision is made to remove
specific spheres, identified as samples, before discharge to the spent-fuel storage tanks.
If required, the FHSS can be used to substitute the fuel spheres in the reactor core with non-
nuclear graphite spheres. This is accomplished by discharging the used fuel spheres from the
reactor and storing these spheres in the used fuel storage tanks outside the MPS, as shown in
Figure 5. At the same time, graphite spheres, which are normally stored in the graphite storage
tank outside the MPS, are fed into the reactor core. This process of changing fuel spheres
forms part of the reactor shutdown sequence and takes about 24 hours to complete. The
process is reversed again once the shutdown is completed, where graphite spheres are
extracted from the core and filled again with the fuel pebbles.
During commissioning of the PBMR module, the FHSS is initially used to load the complete
core of the reactor with graphite spheres. The graphite spheres in the core are then gradually
replaced with a mixture of graphite and fresh fuel spheres supplied from the fresh fuel store,
until the reactor achieves criticality.
An important aspect to understand is the criticality of the reactor core, which is achieved by
the fuel and graphite sphere mixture as well as external control on the reactor via specific
control rods.

THERMO-HYDRAULIC ANALYSIS OF THE PBMR FUEL HANDLING AND STORAGE SYSTEM PAGE - 7 -
The term critical refers to an equilibrium fission reaction (steady state or continuous chain
reaction); this is where there is no increase or decrease in power, temperature, or neutron
population [55].
A numerical measure of a critical mass is dependent on the neutron multiplication factor, k,
where:
k = f − l
f is the average number of neutrons released per fission event and l is the average number of
neutrons lost by either leaving the system or being captured in a non-fission event. When k =
1 the mass is critical.
A subcritical mass is a mass of fissile material that does not have the ability to sustain a
fission reaction. In this case, k < 1. A population of neutrons introduced to a subcritical
assembly will decrease exponentially. A steady rate of spontaneous fissions causes a
proportional steady level of neutron activity. The constant of proportionality increases as k
increases.
A supercritical mass is one where there is an increasing rate of fission. In the case of super
criticality, k > 1. The material may settle into equilibrium (i.e. become critical again) at an
elevated temperature/power level or destroy itself (disassembly is an equilibrium state).
At the end of life of the PBMR module, the FHSS is used to remove the used fuel spheres of
the last core from the reactor. The used fuel is stored in a helium filled storage tank to prevent
corrosion of the hot used fuel while dissipating its decay heat.
In summary the FHSS system is thus the system responsible to circulate both fuel and
graphite spheres through the reactor core as well as transporting these spheres to various
containment units. The system operates during all the plant operating conditions, except
during plant maintenance, at various temperature and pressure levels.

THERMO-HYDRAULIC ANALYSIS OF THE PBMR FUEL HANDLING AND STORAGE SYSTEM PAGE - 8 -
Figure 5: Layout of the PBMR Fuel Handling and Storage System

THERMO-HYDRAULIC ANALYSIS OF THE PBMR FUEL HANDLING AND STORAGE SYSTEM PAGE - 9 -
1.2 PROBLEM STATEMENT
The FHSS system performance design is largely driven by the circulation rate of the spheres
through the reactor core for the various operating conditions. To achieve these circulation
rates, spheres have to be transported from the bottom of the reactor to the top at a specific
rate.
Specific gas flow rates, for the pneumatic conveying of the spheres are required in the FHSS
sphere-transport piping to achieve the specified circulation rates of both fuel and graphite
spheres, at all the operating conditions. The required gas velocities for pneumatic conveying
of the spheres are achieved by using a gas blower.
The primary focus of the study is to calculate the correct gas flow rate required to achieve the
correct sphere circulation rates. The secondary focus is to calculate the blower operating range
for the entire operating functions of the FHSS as well as the thermo-hydraulic input data
required for the design of the rest of the FHSS.
A simulation model of the entire FHSS system was constructed in order to calculate the full
operating range of the blower as well as to calculate the required thermo-hydraulic input data
for the design of the rest of the FHSS. A method had to be selected and a process developed
which could be used to perform a complete thermo-hydraulic analysis of the FHSS. The
required sphere velocities calculated during the pneumatic and gravity transport had to be
shown to be accurate and conservative. To this end, a sensitivity and Monte Carlo study was
carried out on the sphere velocity calculations.

THERMO-HYDRAULIC ANALYSIS OF THE PBMR FUEL HANDLING AND STORAGE SYSTEM PAGE - 10 -
1.3 LITERATURE SURVEY ON BLOWERS
To better understand the limitations and application in the industry for gas blowers a literature
study was carried out.
1.3.1 HELIUM/GAS BLOWERS USED BY INDUSTRY
Helium is widely used in industrial gas-cooling applications. One example is a 74kW gas
blower where an improved low-pressure-drop internal furnace and a fin-and-tube heat
exchanger are used for quenching processes [25].
The design of a power plant based on the Spherical Tokamak (ST), is being developed in
order to explore its potential advantages [27]. The pebbles are transferred to an upper tank by
a pneumatic conveyor, also known as a helium blower.
3rd and 4th generation high-temperature gas-cooled nuclear reactors will be used in the near
future to harness nuclear power safely. Helium blowers have become widely used in the
following projects:
1. The High Temperature Gas Cooled Reactor Programme in China [25].
2. The AVR (Arbeidsgemeinschaft Versuchsreactor - German for Jointly-developed
Prototype Reactor), a 15MWe experimental pebble bed reactor operated for 21 years
in Germany [1].
3. THTR, a 300MWe German demonstration pebble bed reactor with steam turbine
operated for five years [1].
4. Fort St Vrain, a 330 MWe US HTGR operated for 14 years [1].
5. HTTR, a 30 MWth Japanese HTGR reached criticality in 1998 [1].
6. HTR-10, a 10 MWth Chinese HTGR under construction reached criticality in 2000
[1].
7. HTR-100, a 100 MWe German modular pebble bed reactor design by HRB/BBC [1].
8. GT-MHR, a 300 MWe US HTGR, direct-cycle design [1].
Initial research done, before the development of the FHSS started, indicated that the most
probable solution would be a single stage axial or centrifugal blower.

THERMO-HYDRAULIC ANALYSIS OF THE PBMR FUEL HANDLING AND STORAGE SYSTEM PAGE - 11 -
There are various types of other blowers and uses in the industry. Table 1 provides an
indication of the vast variety of blower types available on the market [24], but not considered
for this study.
Table 1: Blower types and uses in the industry
Blower Type Use/Characteristics
Axial Blower Acceleration of the gas is followed by diffusion to convert kinetic
energy into pressure energy; very high flow rates.
Centrifugal
Blower
High-speed impeller produces radial airflow; velocity converted to
pressure energy. Evacuated air flows radially outward as opposed to
axial flow in axial blowers.
FURTHER LITERATURE STUDY WAS DONE ON THE FOLLOWING BUT NOT INCLUDED IN THIS STUDY
Circumferential
Piston
Multiple-rotor configuration where two rotors, each with two "wings"
that trap air against the outside wall during rotation and compress it in
their rotary stroke towards the outlet. The wings of the two rotors
alternate in making compression strokes.
Claw Claw or rotary-claw pumps use precision-designed intermeshing
hooked claws with very tight tolerances and clearances for highly
efficient internal compression. There is typically no contact, thus
minimising or eliminating friction and wear.
Diaphragm Oscillating diaphragm driven by a reciprocating or eccentric "rocking"
rod; no sliding seals or parts. This design isolates the pumped fluid
from any contact with the pumping mechanism. Diaphragm pumps
exhibit a much lower compression ratio than piston pumps, but
frequently offer quiet, economical performance.
Linear The stroke of a sliding compression piston is generated with
electromagnetic oscillation; clean and quiet.
Liquid Ring Eccentrically mounted rotor and vanes utilise liquid ring on inside of
chamber to compress air. The liquid also absorbs compression heat and
entrained particles in the air.
Lobed Rotor Air is trapped and compressed by the diminishing volume caused by
the meshing of oppositely rotating lobes.

THERMO-HYDRAULIC ANALYSIS OF THE PBMR FUEL HANDLING AND STORAGE SYSTEM PAGE - 12 -
Reciprocating
Piston
Piston mechanically reduces air volume inside cylinder. These pumps
may have one or several pistons being driven by a motor. The vacuum
levels produced by this pump style are higher than for other types of
mechanical pumps.
Regenerative
Blower
Similar to centrifugal, with airflow chamber designed to generate
higher pressure. Air flows in a radial direction outward along a blade
to the housing wall, whereupon it flows down to the root of the next
blade gap and repeats the cycle. The airflow thus creates several
"stages" of compression.
Rocking Piston Similar to reciprocating piston but is not articulated; "rocks" with
eccentric motion of drive.
Rotary Piston Rotary piston or cam is rotating eccentrically; evacuates air through
check valve on the "compression" or evacuation stroke while air from
the vacuum application fills in behind it.
Rotary Vane Eccentrically mounted rotor and sliding vanes compress air in
diminishing volume compartments.
Rotary Screw Two or more spindles with intermeshing screws rotate in opposite
directions, creating axially progressing "chambers," moving the air
from suction to discharge. Larger pumps often have double suction,
where air is let in from both ends to a central discharge port.
Scroll Air is moved as intake air is compressed between the surfaces of
mating involute spirals, one of which is moving to push the evacuated
air out to the exhaust progressively.

THERMO-HYDRAULIC ANALYSIS OF THE PBMR FUEL HANDLING AND STORAGE SYSTEM PAGE - 13 -
1.3.2 REQUIRED INPUTS FOR A BLOWER DESIGN
To ensure that all the correct inputs are calculated for the ultimate blower design, a literature
study was done to establish what industry standards require.
For a simple blower design with the blower operating at a fixed input/output or pressure ratio
pressure and flow rate, catalogue designs are usually adequate. The relevant inlet pressure,
flow rate and working fluid are given to the supplier. From this information an off-the-shelf
item can usually be selected to meet the required flow or pressure variations.
Figure 6 shows a typical example where a required blower output is used to select the blower
[28].
Figure 6: Blower selection guide from Paxton Blower Selection Chart
This chart is typically used to select the blower for the required performance.
Because of the large operating range of the FHSS blower and the first-of-a kind engineering
required to develop such a unique blower, it is necessary to do a detailed analysis of the FHSS
system. The calculated parameters for all the operating conditions would then serve as an
input to the FHSS blower design.
THERMO-HYDRAULIC ANALYSIS OF THE PBMR FUEL HANDLING AND STORAGE SYSTEM PAGE - 14 -
1.3.3 FHSS BLOWER REQUIREMENTS
The characteristics of compressible-flow machines are usually described in non-dimensional
terms, of groups of variables given by the function [29]:
Where
P02 refers to the outlet absolute pressure of the blower.
P01 refers to the inlet absolute pressure of the blower.
T02 refers to the outlet absolute temperature of the blower.
T01 refers to the inlet absolute temperature of the blower.
m refers to the delivery of the blower
N refers to the rotational speed of the blower [29].
Obtaining the required component is a simple exercise because a specific flow rate at a
specific pressure and temperature is required. The FHSS blower, however, operates over a
large pressure range (between 1000 kPa and 9000 kPa helium and 100 kPa Nitrogen/Air).
The Nitrogen/Air operation is applicable during the system commissioning and also in a fault
mode, where the system will be flushed with nitrogen.
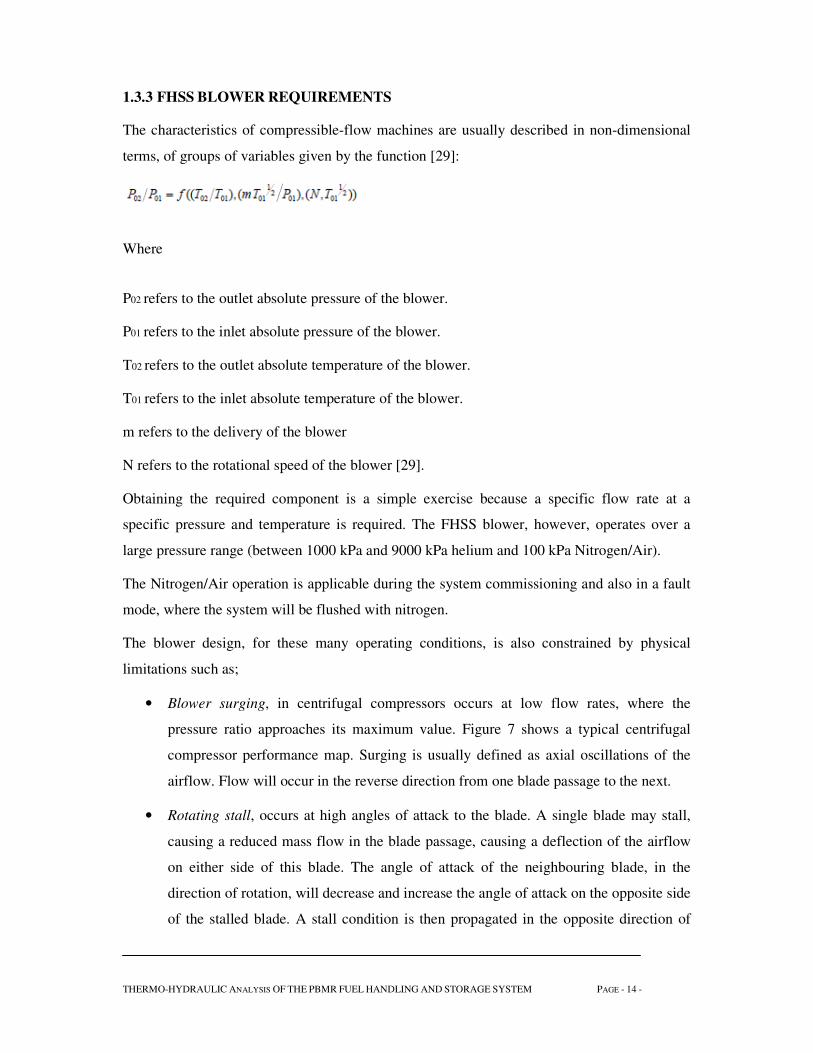
The blower design, for these many operating conditions, is also constrained by physical
limitations such as;
• Blower surging, in centrifugal compressors occurs at low flow rates, where the
pressure ratio approaches its maximum value. Figure 7 shows a typical centrifugal
compressor performance map. Surging is usually defined as axial oscillations of the
airflow. Flow will occur in the reverse direction from one blade passage to the next.
• Rotating stall, occurs at high angles of attack to the blade. A single blade may stall,
causing a reduced mass flow in the blade passage, causing a deflection of the airflow
on either side of this blade. The angle of attack of the neighbouring blade, in the
direction of rotation, will decrease and increase the angle of attack on the opposite side
of the stalled blade. A stall condition is then propagated in the opposite direction of

THERMO-HYDRAULIC ANALYSIS OF THE PBMR FUEL HANDLING AND STORAGE SYSTEM PAGE - 15 -
rotation, blade by blade. The blades tend to stall individually. This prolonged cyclic
loading and unloading of the rotor blades can lead to eventual fatigue failure or even
sudden catastrophic failure.
• Choking can occur where at some point within the blower, sonic conditions are
reached. Shock waves are formed within certain passages and the flow is said to
choke. No further increase in mass flow can take place.
Indicated below is an example of the non-dimensional characteristic map of a blower [29].
Figure 7: Blower Characteristic Map

THERMO-HYDRAULIC ANALYSIS OF THE PBMR FUEL HANDLING AND STORAGE SYSTEM PAGE - 16 -
1.3.4 LITERATURE SURVEY ON POSSIBLE METHODS FOR ANALYSIS
Three different methods were evaluated to perform the thermo-hydraulic analysis:
A. First order calculations [7]:
This would have been a tedious process to follow, considering all the different test
conditions that had to be evaluated and the number of components in the test set-up.
B. Computational Fluid Dynamics (CFD)
The ability to determine the fluid flow and heat transfer in complex networks was an
important prerequisite in the design process of thermal-fluid networks. Complex flows
could be solved using a CFD code, which require complex meshing in three
dimensions to resolve the flow and temperature fields [8].
To obtain a solution using a CFD code for a simple pipe in three dimensions would
have required many hundreds or even thousands of cells to ensure an accurate
solution. This was simply not practical for large network simulations consisting of a
large number of different and complex components. In particular, when dynamic
simulations are performed, they would require excessive computational resources that
could take many hours to solve.
A CFD analysis required the generation of meshes, which would have to be altered
and updated as the design progressed. Mesh generation in CFD is a complex process
requiring a great deal of time and user expertise.
C. One-dimensional modelling methodology.
Simulation modelling overcame the difficulty associated with traditional CFD
simulations, by employing a one-dimensional modelling methodology. This simplified
the problem considerably by using average flow conditions across the flow area. Flow
velocity, pressure and fluid properties would be average values for the cross-sectional
area and would vary only in the direction of flow.
This assumption greatly simplified the solution procedure and eliminated the
requirement for complex computational meshes. The drawback of using such a one-
dimensional simulation methodology was that the detailed flow fields within a
component could not be resolved. However, this assumption did not adversely affect
the accuracy required for this study.

THERMO-HYDRAULIC ANALYSIS OF THE PBMR FUEL HANDLING AND STORAGE SYSTEM PAGE - 17 -
1.3.5 SELECTED METHOD FOR THE ANALYSIS - ONE-DIMENSIONAL MODELLING
The process involved setting up a thermal-fluid network, consisting of thermal-fluid
components connected in an unstructured manner. Thermal-fluid networks could therefore
vary in complexity from just a few different components in a network to hundreds and even
thousands of components in a single network.
Flownex, a software fluid-analysis program, provides the means to design and analyse very
complex unstructured thermal fluid networks [9]. This program was selected for the present
analysis. The objective of a thermal-fluid network analysis was to determine the flow rates,
pressures, temperatures and heat transfer rates for the components in the network. Every
thermal-fluid component in the network had to comply with the system specifications and the
individual components had to function correctly as part of the integrated system.
When designing a thermal-fluid network, it is essential to accurately predict the flow rates
through the components. It is also essential to accurately estimate the temperature
distributions and heat transfer rates throughout the network. Flownex can then be used to
assess the performance and operating conditions of the thermal-fluid components in complex
unstructured thermal-fluid networks [9].
1.3.6 REQUIREMENT FOR THE SIMULATION
Thermal system design involved the consideration of the technical details of the basic concept
and the creation of a new or improved system for the specified task. It was important to
distinguish between thermal-fluid Design and thermal-fluid Simulation.
Design refers to a situation where the characteristics of a system have to be specified so that it
will enable the execution of specific functions at an acceptable level of performance.
Simulation, on the other hand, generally refers to a situation where the characteristics of the
system are known. Models have to be set up that will predict its functionality and performance
level under various operating conditions. Simulation therefore forms an integral part of the
design process, because new design has to be analysed and evaluated to ensure that the design
criteria are satisfied.
Simulation was used to calculate the required blower operating conditions. Flownex was
considered a satisfactory simulation software tool and was chosen for this study. Many
simulation tools are commercially available for this purpose.

THERMO-HYDRAULIC ANALYSIS OF THE PBMR FUEL HANDLING AND STORAGE SYSTEM PAGE - 18 -
1.4 OVERVIEW OF REPORT
The first Chapter of the report elaborated on the background of the PBMR plant as well as on
one of its essential subsystems. The requirement for thermo-hydraulic input data to design the
FHSS blower was identified. A literature survey was conducted to identify possible methods
for thermo-hydraulic analysis of the FHSS to obtain the required design data.
The following two Chapters discuss the selected approach in detail. Different aspects of the
concept were implemented and addressed in the solving technique. Chapter 2 is a detailed
literature review on the solving method.
Chapter 3 gives a description of the method that was developed to set up the simulation model
for the analysis as well as the sensitivity and Monte Carlo study. The system model for the
simulation is documented in the appendices to this report.
The last two Chapters of the report contain the conclusions from this study, as well as a list of
all the references used. Recommendations for future work are also given.
The appendices to this document include the distribution parameters for the Monte Carlo
simulation as well as the complete model description for the FHSS Flownex model.

THERMO-HYDRAULIC ANALYSIS OF THE PBMR FUEL HANDLING AND STORAGE SYSTEM PAGE - 19 -
2. DESCRIPTION OF AN APPROPRIATE SOLVING
METHOD
2.1 PREAMBLE
A component as critical as the FHSS blower, must be tested before the proposed concept can
be implemented in a full-scale nuclear reactor. Designing, developing and testing an
experimental model is necessary to ensure that each component produces the required results.
The time and costs involved in the development and design of each component are
substantial. To reduce the time involved and ensure that the required design inputs used to
develop the component were accurate, it was necessary to verify the requirements and
specifications of the design inputs and the required outputs of the blower.
To determine the required design parameters for the blower, the FHSS fluid flow
characteristics must first be solved. A few different approaches can be followed to solve this
specific type of fluid flow problem. Building and testing an experimental model would
obviously have provided reliable answers. However, the time and costs involved in such an
experiment would make it impractical.
Fluid flow conditions of the FHSS are governed by two system requirements. The first would
be to transport fuel and graphite spheres at specific velocities and various fluid densities; the
second would ensure proper dust removal from all the gravity pipe sections at selected
intervals. Dust removal is an important part of maintaining the FHSS system to ensure that the
dust build-up will not result in system blockages over time. The generation of dust in a
nuclear system is also a sensitive parameter requiring additional safety precautions, because of
the fact that the airborne dust has the ability to spread easily. Therefore the generation of dust
in a nuclear system needs to be contained and maintained.
To compensate for the lack of experimental and calculation inputs to predict pneumatic sphere
transport velocities in pipe sections accurately, a Monte Carlo and Sensitivity study was done.
Experimental data will be used to predict the required gas velocities for dust removal.
An appropriate software package was selected and used to build the simulation model and
accurately calculate the fluid flow scenario. Flownex was selected as the most suitable
software package to accomplish this requirement. The procedure for setting up such a

THERMO-HYDRAULIC ANALYSIS OF THE PBMR FUEL HANDLING AND STORAGE SYSTEM PAGE - 20 -
simulation model had to be fully understood in order to create a simulation model that would
reflect the actual FHSS fluid flow conditions [10].
Because the PBMR is a nuclear power plant, the model must be designed according to strict
rules and regulations. It has to comply with safety standards and quality assurance codes
given by the National Nuclear Regulator (NNR) in order to obtain an operating licence in
South Africa. A detailed Verification and Validation (V&V) process must be performed on all
software used as part of the design.

THERMO-HYDRAULIC ANALYSIS OF THE PBMR FUEL HANDLING AND STORAGE SYSTEM PAGE - 21 -
2.2 BACKGROUND ON FLOWNEX
A literature survey was conducted on both the development of Flownex and the application of
the software in this relevant field. This was done to determine whether Flownex would be an
acceptable tool for the required analysis.
2.2.1 GENERAL [54]
Flownex is a systems CFD code that enables users to perform detailed design, analysis and
optimisation of thermal-fluid systems These range from simple pipe networks to complex
systems such as gas turbine engines and combined-cycle power plants.
“Systems CFD” refers to the approach where component models with different levels of
complexity, from analytical models or lumped models to 1-D, 2-D or even 3-D CFD models
are linked together in a network, to represent a complex system.
Flownex’s solution algorithm is similar to that of a conventional CFD code. The system is
discretized into a number of spatial or conceptual control volumes to which a set of
conservation equations are applied and then solved.
Distinguishing features of Flownex are:
• the ability to deal with both steady-state and dynamic problems
• the ability to deal with both single-phase and two-phase fluids
• the ability to deal with very large networks
• the speed of execution.

THERMO-HYDRAULIC ANALYSIS OF THE PBMR FUEL HANDLING AND STORAGE SYSTEM PAGE - 22 -
2.2.2 THE DEVELOPMENT OF FLOWNEX
Flownex is a general-systems CFD code that finds wide application in the industry. M-Tech
Industrial developed the code over the past 15 years, in collaboration with the Faculty of
Engineering at PU for CHE (now known as the North West University) [11].
The PBMR project has boosted the development of Flownex as a commercial product, and
users include companies such as Rolls Royce, Mitsubishi Heavy Industries, Kobe Steel,
Concepts NREC, Eskom, Sasol, CSIR Miningtek as well as Iscor. MIT University, Cranfield
University, and Stuttgart University [11].
Flownex is used in the industry by Rolls Royce [12] for the modelling and simulation of
aircraft combustion chambers. Clients such as PCA Engineers (USA) [13], Concepts NREC
(USA) and Mitsubishi Heavy Industries [15] use Flownex for the modelling of turbo
machines [14].
Mitsubishi Heavy Industries, Ltd (MHI) is one of the world’s leading manufacturers of heavy
machinery. With a vast amount of practical experience and a high level of technological
capability, MHI has been active in the nuclear industry for more than three decades. Since
starting research into and development of nuclear power generation in the 1950’s, MHI has
taken part in the design, manufacture and construction of a large number of very successful
Pressurised Water Reactor (PWR) power plants [15].
MHI is the only organisation to produce such a large range of supplies for nuclear power
generation. These supplies include Architectural Engineering, Nuclear Steam Supply Systems,
Turbine Generator Systems, Electrical Systems, I & C Systems, Nuclear Fuel, and also the
Balance of Plant.
Kobe Steel Ltd (Japan) uses the software for the simulation of air-chilling units [16]. From
comprehensive power generation plants to individual machines, the Plant Engineering Sector
of Kobe Steel’s Plant Engineering Company has the capability to fulfil a vast range of needs
in such industries as iron and steel making, cement, energy and chemical-related fields.
Integrating excellent manufacturing and plant engineering capabilities, they are expanding
their operations into a variety of business fields. Kobe Steel produces the world’s largest
desulphurisation reactors and oxygen generation plants for oil refining and petrochemical
plants. In addition, they offer a wide range of power generation and gas supply facilities,
nuclear equipment, and district heating and cooling systems [16].

THERMO-HYDRAULIC ANALYSIS OF THE PBMR FUEL HANDLING AND STORAGE SYSTEM PAGE - 23 -
Flownex is also used by a number of academic institutions. The Massachusetts Institute of
Technology (MIT) uses Flownex for simulating various designs of the Brayton cycle [17].
Cranfield University uses it for the simulation of compressor units [18].
These references show that Flownex is widely used in the industry and academic institutions
for the modelling and simulation of various thermal-fluid systems and networks. Flownex
users are all well known and respected in industry and academic fields. It can therefore be
accepted that Flownex will be a reliable tool for the analysis of this particular thermal-fluid
network.

THERMO-HYDRAULIC ANALYSIS OF THE PBMR FUEL HANDLING AND STORAGE SYSTEM PAGE - 24 -
2.3 PROCESS DEVELOPED FOR THE ANALYSIS
2.3.1 SETTING UP OF THE THERMAL-FLUID NETWORK
Flownex was used as the simulation tool to set up a thermal-fluid network for performing the
analysis. Thermal-fluid networks are presented in Flownex by a combination of Nodes and
Elements. In the Flownex Graphical User Interface (GUI), nodes are indicated with a square
box symbol while elements are indicated with a circle.
A network was created by placing and connecting elements and nodes in a random fashion.
Flownex caters for any number of nodes and elements per network, limited only by the
available computer memory. It was therefore possible to create very complex thermo-fluid
networks.
Nodes were used to connect various elements and to represent boundaries for a network.
Reservoirs and tanks can also be represented by these nodes. Junction losses can also be
modelled where elements meet at a common node.
2.3.2 SOLVING OF THE THERMAL-FLUID NETWORK
Flownex solves networks quickly and accurately by employing a very fast and stable implicit
solver [9]. This eliminates the excessive time-step restriction imposed on explicit codes.
Flownex uses dynamic memory allocation, which means that very large networks can be
solved on a personal computer without re-dimensioning the code each time.
Flownex provides extensive error and warning messages. Although nodes are the endpoints of
elements, a node can have a volume. Flownex can also deal with heat transfer to and from
nodes. Long pipes can be subdivided into a number of smaller element lengths. This increases
the accuracy and enables the user to study pressure and temperature variations over the length
of the pipe. Different pipe-loss coefficients can also be specified in the forward and reverse
flow directions.
2.3.3 PROCESS FOR CREATING A FLOWNEX NETWORK
Flownex is run from within the Windows environment. Elements and nodes define a network
and form the basic building blocks to simulate a network.
An element is a component, such as a length of pipe, duct, orifice, fan, pump, compressor,
turbine or heat exchanger, which causes a pressure variation. An element can also be a

THERMO-HYDRAULIC ANALYSIS OF THE PBMR FUEL HANDLING AND STORAGE SYSTEM PAGE - 25 -
combination component, such as a length of pipe, which includes a number of secondary
pressure loss components and orifices. In the case of a combined element, the diameter of the
pipe has to be constant.
Nodes are the endpoints of elements. A network is defined by joining elements at common
nodes as shown in the figure 8.
Figure 8: Basic Building Blocks of a Network
It is possible to distinguish between the following three types of nodes:
• Boundary nodes. A node associated with only one element is called a boundary node.
• Fixed pressure node. When defining a network, the pressure at any node, even that of
boundary nodes, could have been fixed. Such nodes are called fixed pressure nodes. A
node can therefore be both a boundary node and a fixed pressure node.
• Internal nodes. Nodes that are neither boundary nor fixed pressure nodes.
It is also possible to distinguish between the following two types of elements:
• Boundary elements. A boundary element is an element associated with a boundary
node or a fixed pressure node.
• Internal elements. Internal elements are all elements that are not boundary elements.
In specifying a network, the following simple rules apply:
• For boundary node/element pairs, at least one of the node pressure, the node mass
source or the element mass flow must be specified.
• If the pressure of an internal node was fixed, continuity would not be satisfied at the
node for the network specified by the user. It is important to remember that if the

THERMO-HYDRAULIC ANALYSIS OF THE PBMR FUEL HANDLING AND STORAGE SYSTEM PAGE - 26 -
pressure of a node is fixed, Flownex will generate a mass source or sink at that node,
which will cause continuity to be satisfied.
• If the mass flow of an internal element is fixed, generally, the relationship between
mass flow and pressure change over that specific element will not be satisfied. An
additional pressure difference will be generated in the element with the specified mass
flow. If the mass flow of a boundary element as well as the pressure of the associated
boundary node is fixed, the pressure of the boundary node will be ignored. If the mass
flow was specified at a boundary, Flownex will calculate the pressure of the boundary
node.
• Mass flows may not be fixed for all boundary elements. For at least one boundary
element-node pair, the pressure and not the flow should be fixed. If two networks are
connected through a single fixed-flow element, the pressure of at least one boundary
node in each of the two networks should be fixed.
• The mass flow either in a boundary element or the pressure of its associated boundary
node must be fixed. It is not allowed to specify both the pressure and mass source at
the same node.
• If neither the node pressure nor the node mass source of a boundary node is specified,
the flow in the associated boundary element will be zero.
The convergence parameters specified for the project were subdivided into two groups. The
first group was where the convergence criteria and the number of iterations for each solver
were specified. The second group was where the relaxation parameters were specified to
ensure a stable solution. For the solution to have been considered as convergent, the
conservation of mass, momentum and energy must be satisfied. To check whether continuity
was satisfied, conservation of mass at each node, the sum of the continuity errors at all the
nodes divided by the mean of the entire element mass flows (absolute values) was calculated.

THERMO-HYDRAULIC ANALYSIS OF THE PBMR FUEL HANDLING AND STORAGE SYSTEM PAGE - 27 -
2.4 VERIFICATION AND VALIDATION (V&V) OF THE CODE
Because the PBMR is a nuclear power plant, it has to be designed under strict rules and
regulations. It has to comply with safety standards and quality assurance codes given by the
NNR in order to obtain an operating licence in South Africa.
One regulatory requirement is that all applicable software codes used for the design of the
PBMR must be verified and validated. To verify and validate these codes is a lengthy process.
In order to meet this requirement, PBMR has dedicated personnel that are responsible for this
task.
The Software V&V process for Flownex was captured in the Verification and Validation of
software [20]. This document, in conjunction with the procedure for Project Management for
the Design, Development and Maintenance of Software [21] and Configuration Management
Process Definition for Software [22], dictated the Software V&V process.
Many of the software codes used as part of the PBMR design are commercial codes that have
been developed for industry over many years. These codes however also have to undergo a
strict verification and validation to ensure that all requirements are met for using these codes
in a nuclear design.
Flownex Nuclear differs from other codes used on the PBMR project because it is categorised
as Software Under Development (SUD). The code is being specifically developed to perform
thermal-fluid analyses on a high-temperature gas-cooled reactor coupled to a direct,
recuperated Brayton cycle in an implicit way. As it is the first software product of its kind
various verification and validation methods, from different sources, are used to license the
software.
It should be stressed that Flownex Nuclear is the first software product of its kind, because
this affects the availability of codes that can be used for independent V&V activities. In order
to ensure that all phenomena for each component in Flownex Nuclear are validated for the
various extremities, an extensive V&V exercise must be completed.
Verification forms part of the overall Flownex Nuclear development process and includes the
verification activities that form part of the software engineering process. Furthermore, all
related verification is done as part of the derivation of the theory for component models or
model enhancements. Validation of Flownex Nuclear is performed by comparing the results

THERMO-HYDRAULIC ANALYSIS OF THE PBMR FUEL HANDLING AND STORAGE SYSTEM PAGE - 28 -
of the implemented theoretical models in Flownex Nuclear with benchmark data obtained
using appropriate methods [23].
The Nuclear Research and Consultancy Group (NRG) in Petten, the Netherlands, performs
Independent Software V & V on the Flownex Nuclear software. The NRG operates
technically, managerially and financially independently of PBMR and M-Tech. This V&V is
managed by PBMR and data obtained is accessible to M-Tech for V&V activities.

THERMO-HYDRAULIC ANALYSIS OF THE PBMR FUEL HANDLING AND STORAGE SYSTEM PAGE - 29 -
3. SIMULATION MODEL
3.1 PREAMBLE
The FHSS makes use of pneumatic helium- and gravity conveying to circulate fuel spheres
through the core of the reactor. At the same time, it will discharge spent-fuel to the spent-fuel
storage area and recharge the reactor with fresh fuel. As part of the sphere conveying system
there are also pneumatic brake sections included that reduce the sphere velocity as they exit
the lift line sections. The sphere velocities must be reduced to prevent high impact velocities
downstream of the pneumatic brake section. As a first estimate, the pneumatic brake gas
velocity is set to ensure that the largest sphere, with a diameter of 60.3mm, has a terminal
velocity of 1 m/s in the specific brake section. The formulae used to compute the sphere
velocities and ensure adequate brake lengths must be verified. To ensure the accuracy and
correctness of these computed parameters, a parametric and sensitivity study was used to
calculate the sphere velocities. This also includes a Monte Carlo study of the inputs.
After the parametric and sensitivity study had been completed, the blower operating
parameters were calculated for the various FHSS operating conditions. These parameters were
calculated for the high pressures, (3300 kPa to 9000 kPa absolute helium pressure), low
pressure, (1000 kPa absolute helium pressure), and air operation at atmospheric conditions.
The FHSS Flownex model was used to balance the sphere conveying lines gas flow velocities
to achieve the required sphere velocities in the sphere lines. The blower thermo-hydraulic
performance requirements could then be calculated from the overall system thermo-hydraulic
calculation.

THERMO-HYDRAULIC ANALYSIS OF THE PBMR FUEL HANDLING AND STORAGE SYSTEM PAGE - 30 -
3.2 SENSITIVITY AND MONTE CARLO STUDY FOR SPHERE
VELOCITY CALCULATION
3.2.1 PARAMETRIC STUDY
Sphere velocity vs. pneumatic brake distance is calculated for the following operational
conditions in helium:
1. 1000 kPa and 250 °C, lifting velocity of 10 to 15 m/s
2. 3300 kPa and 150 °C, lifting velocity of 2 to 4 m/s
3. 9000 kPa and 150 °C, lifting velocity of 2 to 4 m/s
The sphere sizes simulated range between 59.3 mm to 60.3 mm spheres. The lift line gas
velocity is calculated for the average sphere size. The pneumatic brake line gas velocity is
calculated to ensure that the largest sphere has a 1 m/s velocity. The calculations are done for
a 10° pneumatic brake section. The outputs are presented in brake distance vs. sphere velocity
graphs.
Note that the calculations do not compensate for the rotation energy of the sphere. The effect
of the sphere rotation energy is not taken into account and is discussed in section 3.2.4.
3.2.2 SENSITIVITY STUDY
The sensitivity of the input parameters is compared to the sphere terminal velocity. This study
also includes the effect of the sphere rotation energy that is normally ignored in the
calculations.
The input parameters are varied with a normal distribution as indicated in the appendix of the
document for the Monte Carlo study. The study is repeated with the sphere rotation energy
taken into account.

THERMO-HYDRAULIC ANALYSIS OF THE PBMR FUEL HANDLING AND STORAGE SYSTEM PAGE - 31 -
3.2.3 SPHERE ROTATION AND VELOCITY CALCULATION
α
y
xa
mg
θ
θ
Fn Fw
Figure 9: Sphere Roll and Slip Diagram
Table 2: Force Balance on Sphere
Equation Variables Description Units
))(Cos.)(Sin.(ga
))(Cos.)(Sin.(g.m
F)(Sin.g.m
F)(Sin.g.ma.m:Fx
)(Cos.g.mF
0)(Cos.g.mF:F
n
w
n
ny
θµ−θ=
θµ−θ∴=
µ−θ∴=
−θ=∑
θ=∴
=θ−∑
Equation 1
r/)(Cos.g.2
5
)(Cos.g.m.r.F.r.r.m5
2
F.r.I
n
2
w
θµ=α
θµ=µ=α∴
=α
Equation 2
Fy Force in y-direction N
Fx Force in x-direction N
Fn Normal Force acting in on
sphere
N
Fw Drag Force acting in on sphere N
m Sphere Mass Kg
G Gravitational acceleration m/s2
a Sphere linear acceleration m/s2
α Sphere rotational acceleration rad/s2
µ Rolling co-efficient of Friction -
θ Angle between horizontal and x-
axis
°
I Sphere moment of inertia kg.m2
r Sphere radius m
THERMO-HYDRAULIC ANALYSIS OF THE PBMR FUEL HANDLING AND STORAGE SYSTEM PAGE - 32 -
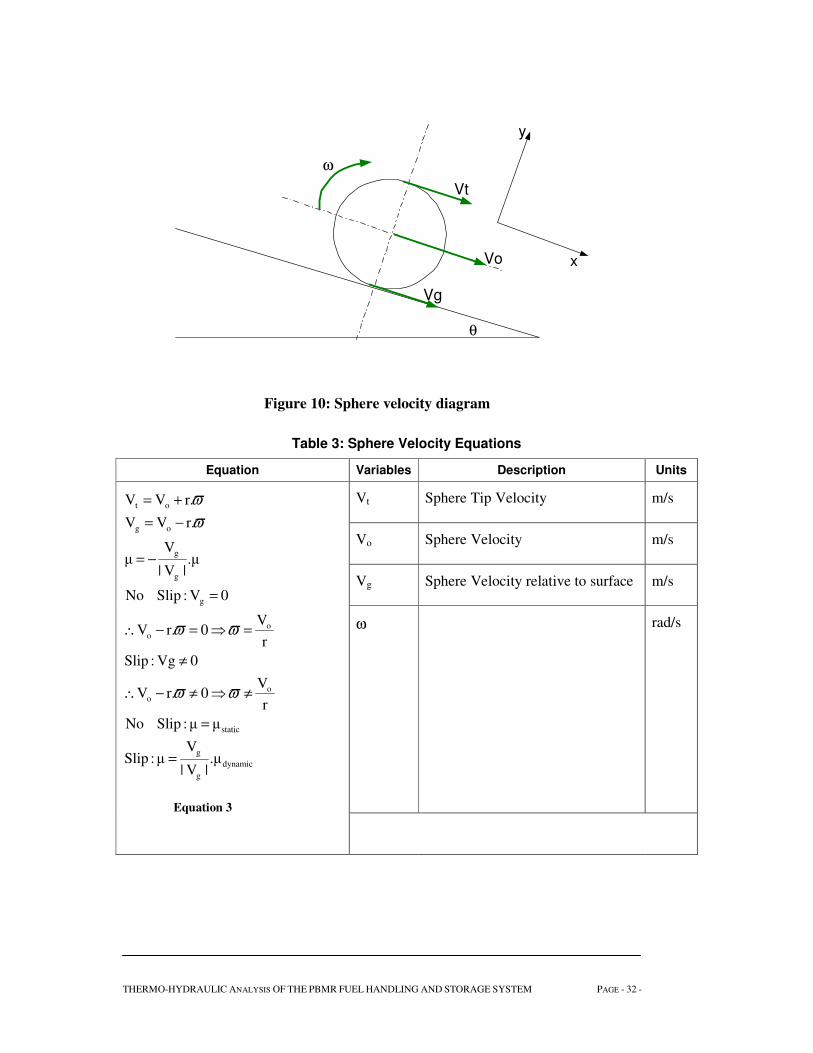
y
x
θ
Vt
Vo
Vg
ω
Figure 10: Sphere velocity diagram
Table 3: Sphere Velocity Equations
Equation Variables Description Units
dynamic
g
g
static
oo
oo
g
g
g
og
ot
.µ|V|
Vµ:Slip
µµ:SlipNo
r
V0r.V
0Vg:Slip
r
V0r.V
0V:SlipNo
.µ|V|
Vµ
r.VV
r.VV
=
=
≠⇒≠−∴
≠
=⇒=−∴
=
−=
−=
+=
ϖϖ
ϖϖ
ϖ
ϖ
Equation 3
Vt Sphere Tip Velocity m/s
Vo Sphere Velocity m/s
Vg Sphere Velocity relative to surface m/s
ω rad/s

THERMO-HYDRAULIC ANALYSIS OF THE PBMR FUEL HANDLING AND STORAGE SYSTEM PAGE - 33 -
Table 4: Sphere Energy Balance
Equation Variables Description Units
static
twttt
total22
But
)tan(7
2
)(Sin)(Cos.2
7
)(Cos.)(Sin)(Cos.2
5
r/))(Cos.)(Sin(gr/)(Cos.g.2
5
r
a:SlipNo
|s/FEE
Emghv.m.I
µ≤µ
θ=µ
θ=θµ
θµ−θ=θµ
θµ−θ=θµ∴
=α
−=
=++ω
∆∆+
Equation 4
E Energy Joule
h Height m
s Distance m
t Time sec
α
y
xa
mg
θ
θ
Fn Fw
Fx
Figure 11: External Force on Sphere

THERMO-HYDRAULIC ANALYSIS OF THE PBMR FUEL HANDLING AND STORAGE SYSTEM PAGE - 34 -
m
F))(Cos)(Sin.(ga
F))(Cos)(Sin(g.m
FF)(Sin.g.m
FF)(Sin.g.ma.m:F
x
x
xn
xwx
+θµ−θ=∴
+θµ−θ=
+µ−θ=
+−θ=∑
Equation 5
From the above calculations and the equations noted in [30]:
Table 5: Required gas flow for Sphere terminal velocity calculation
Equation Variables Description Units
Sphere Velocity Calculation ignoring rotation energy of the sphere
ρ
α
.C.A
)sin(.m.g.2VV
dps
ssg +=
Equation 6
Vg Gas velocity m/s
Vs Sphere terminal velocity m/s
g Gravitational acceleration – (9.81) m/s2
ms Sphere mass Kg
α Pipe angle with horizon °
As Sphere cross sectional area m2
Cdp Drag coefficient for a sphere in a pipe -
ρ Gas density kg/m3
Sphere Velocity Calculation
.ρ.CA
µ.cos(α)).sin(αs2.g.mVV
dps
ssg
−+=
Equation 7
All variables are depicted as above
µ Friction Force Coefficient
µ = 2/7.tan(α)
-
Sphere Drag Coefficient Calculation
2p
p
dsdp)D1(
DCC
−+=
Equation 8
Cds Free Flow Sphere Drag Coefficient -
Dp Pipe/Sphere Area Ratio, with
Dp=(Sphere Diameter/Pipe Diameter) 2
-
From the equations of table 2 it is possible to calculate the required gas velocity to achieve a
specific sphere terminal velocity. To calculate the sphere acceleration, velocity and
displacement vs. time, a force balance on the sphere is applied.

THERMO-HYDRAULIC ANALYSIS OF THE PBMR FUEL HANDLING AND STORAGE SYSTEM PAGE - 35 -
Table 6: Sphere acceleration, velocity and displacement calculation
Equation Variables Description Units
Gravitational force on sphere
g.m).sin(F sg α=
Equation 9
All variables are depicted as above
Fg Gravitational Force, which is the component of the force in the x direction.
N
Gravitational force on sphere including sphere roll
g.m)).cos(.)(sin(F sg αµα −=
Equation 10
All variables are depicted as above
Drag force on sphere
)VV.(A.C..2
1F sgsdpd −= ρ
Equation 11
All variables are depicted as above
Fd Drag Force on Sphere N
Resultant force on sphere
dgres FFF −=
Equation 12
All variables are depicted as above
Fres Resultant Force on Sphere N
Sphere acceleration as
s
res
m
Fa =
Equation 13
All variables are depicted as above
a Sphere acceleration m/s2
Sphere Velocity
t.a)1t(VV ss +−=
Equation 14
All variables are depicted as above
t Time interval (taken as 0.01s) S
Sphere Displacement
t.V)1t(xx s+−=
Equation 15
All variables are depicted as above
x Sphere Displacement M
Note that the sphere velocity drag coefficient does not have to be adjusted for the Reynolds
number range of simulations done, as the flow is laminar for both cases. For calculations
including the rotation energy of the sphere, it is assumed that there is no slip between the
sphere and the pipe surface. It is also assumed that the sphere rotation velocity is zero as it
enters the pneumatic brake section.

THERMO-HYDRAULIC ANALYSIS OF THE PBMR FUEL HANDLING AND STORAGE SYSTEM PAGE - 36 -
3.2.4 EFFECT OF SPHERE ROTATION ENERGY
The current equations used to calculate the sphere velocity profile do not compensate for
friction forces between the sphere and pipe wall. It also does not include the energy dissipated
by the sphere rotation.
If it is assumed that the sphere is not rotating when it enters the pneumatic brake and that
there is zero friction between the sphere and pipe wall, the sphere friction coefficient can be
defined as
from Equation 4
The sphere acceleration calculation becomes:
from Equation 5
when the wall friction and sphere rotation are taken into account.
From the simulations, which include the sphere rotation energy, it was evident that at low
pressure the system is more sensitive to sphere rotation. The greater the pipe angle (relative to
vertical) becomes, the larger the difference between the calculated sphere velocities (including
and excluding the sphere slip and rotation) becomes, as indicated below:
Figure 12: Example of Sphere rotation included in sphere velocity calculation
From Figure 12 sphere rotation results in a lower exit velocity. For the purpose of the study
the effect of the sphere rotation is ignored, therefore the exit velocity calculated is considered
conservative relative to the sphere exit velocity.

THERMO-HYDRAULIC ANALYSIS OF THE PBMR FUEL HANDLING AND STORAGE SYSTEM PAGE - 37 -
3.2.5 FHSS SIMULATION SET-UP PARAMETERS
This section explains the boundary values used and simulation parameters for the following
FHSS operation conditions:
• High Pressure/Normal Operation
• Low Pressure/Defuel and Refuel Operation
3.2.6 HIGH PRESSURE/NORMAL OPERATION
The required helium and air gas velocity was calculated using Equation 7. During this mode
of operation, the plant is at a varying power level, controlled by the helium inventory. It is
required that spheres are circulated between 9000 kPa and 3300 kPa helium at about 150 °C.
Sphere velocities are calculated with the average sphere lifting velocity 90° upwards
(vertically) between 2 - 4 m/s and the sphere brake velocity at a 10° slope, having a terminal
velocity of about 1 m/s.
The following assumptions were made for the analysis:
• The sphere storage tanks are isolated from the FHSS.
• Continuous dust pocket cleaning is included for only the IBA FRI’s. 10 mm Internal
Diameter (ID) piping for horizontal dust pocket extraction pipes and 12.7 mm ID
piping for vertical sections are used.
• Sphere lifting is controlled to only one sphere per lift line at any moment and three
spheres simultaneously in the separate lift lines.
• Should the blower exit temperature exceed 250 °C for any analysis, the heat exchanger
will be used to control the blower exit temperature to 250 °C. It is assumed that the
heat exchanger exit temperature is 50 °C.
• Sphere weight for simulation purposes is calculated using a density of 1.75 g/cm3.
• All the control valves utilised in the simulations contribute at least 30% of the total
system pressure loss as required for controllability.
• For dust cleaning the required gas velocity is:
Velocity (m/s) = 24.3 x [Gas Density (kg/m3)]
-1/2 [30]

THERMO-HYDRAULIC ANALYSIS OF THE PBMR FUEL HANDLING AND STORAGE SYSTEM PAGE - 38 -
3.2.6.1 CIRCULATE EQUILIBRIUM CORE
The following boundary temperature and pressures conditions were used for the simulation
[49]:
Table 7: Circulation Operation System Boundary Conditions
Note that the MPS steady state numbers, i.e. MPS-SS0052, refer to a particular steady state
operating simulation of the PBMR plant. The boundary values from these simulations were
used as input to the FHSS simulations.
The system gas mass balance and blower design points calculated were derived from two
philosophies. The first philosophy is described in 1A and 1B below and the second
philosophy in 2C and 2D.
Sphere Velocity Limit philosophy 1:
1A. The FHSS brake and gas supply valves were set to ensure that a 58.5 mm sphere has a
lifting line terminal velocity of 2 m/s and brake line terminal velocity of 1.2 m/s at MPS-
SS0065. This condition represents the allowable limits of 2 - 4.5 m/s for lifting line sphere
velocities and 0.5 - 1.2 m/s for sphere velocities at the brake exit.
1B. The same valve settings were used as calculated for the mass balance at MPS-SS0065,
sphere velocity limit philosophy 1-A. System temperatures and pressures were set to MPS-
SS00052. The blower speed was adjusted in the simulation to ensure a 58.5 mm sphere lifting
line terminal velocity of 2 m/s.
Sphere Velocity Limit philosophy 2:
2C. The system temperatures and pressures are set to MPS-SS00052. The blower speed is
adjusted to ensure a 58.5 mm sphere lifting line terminal velocity of 2 m/s. The same lift line
supply valve settings are still used as calculated in philosophy 1 above. The brake line supply

THERMO-HYDRAULIC ANALYSIS OF THE PBMR FUEL HANDLING AND STORAGE SYSTEM PAGE - 39 -
valve settings are adjusted to ensure that a 61 mm sphere will have a brake line terminal
velocity of 0.5 m/s.
2D. The same valve settings are used as calculated above for the mass balance at sphere
velocity limit philosophy 2-C. The system temperatures and pressures are set to MPS-
SS00065. The blower speed is adjusted to ensure a 58.5 mm sphere lifting line terminal
velocity of 2 m/s.
The blower design parameters are presented in section 4. All the control valves utilised in the
simulations contribute 30% or more of the total system pressure loss as required for
controllability.

THERMO-HYDRAULIC ANALYSIS OF THE PBMR FUEL HANDLING AND STORAGE SYSTEM PAGE - 40 -
3.2.7 LOW PRESSURE/DEFUEL AND REFUEL OPERATION
The defueling operation takes place at a lower system pressure of about 1000 kPa. Spheres get
withdrawn from the reactor and diverted to storage tanks, where it will be temporarily stored.
This is done to prepare the reactor for maintenance and inspection. Once the maintenance and
inspection is complete the reactor vessel is refuelled with the spheres again.
The required helium and air gas velocity was calculated using Equation 7. During this mode of
operation, the plant is at a minimum pressure of 1000 kPa helium and a maximum
temperature of 250 °C.
The following assumptions were made for the analysis:
• The storage tanks have an absolute pressure of 1 MPa.
• The influence of continuous dust pocket cleaning for all FRI’s is investigated and
included in this document.
• The pressure drop across all control valves actively used for controlling the gas flow
during the specific simulation shall be at least 30% of the total system pressure drop.
• Sphere lifting is controlled to only one sphere per lift line at any moment.
• Heat input of 100 spheres per buffer is accounted for.
• The density of a sphere (fuel or graphite) is assumed to be 1.7g/cm3.
• The blower bypass line shall never determine the system total resistance. If the bypass
line resistance is larger than the system resistance, the line size shall be increased and
noted as such.
• The current Helium Test Facility (HTF) blower characteristics, which are very similar
the FHSS in theory, shall be used to represent the FHSS blower for simulation
purposes [53]. Once the study is complete specific characteristic will be derived for
the FHSS system and will then be used in future to simulate the FHSS system more
accurately.
The required sphere velocities for the different required modes of operation are calculated
below:
There are two options for the Refuel Process, which is reliant on the preceding process.

THERMO-HYDRAULIC ANALYSIS OF THE PBMR FUEL HANDLING AND STORAGE SYSTEM PAGE - 41 -
If refuel follows a Used Core Graphite Load, the core is initially considered to contain only
graphite. Graphite spheres are removed from the core whilst being filled with fuel spheres
transported from the fuel storage area. If refuelling follows a de-fuel operation, the core
contains a mix of graphite and fuel. The remaining graphite spheres are separated from the
fuel spheres.
For the Flownex simulations, the pressure to node 2095, representing the graphite tank
assembly, has been fixed at 1000 kPa, (maximum allowable tank pressure). The reactor exit
temperature is fixed at 250 °C, which is the maximum allowable sphere temperature before
entering the FHSS.
3.2.7.1 SPHERE LINES FLOW RATE CALCULATION FOR REFUELLING OPERATION
The required circulation rate of spheres is given as approximately 1000 spheres/hour [47].
Thus:
This assumption is considered to be conservative due to the actual circulation rate stated in
[47] being slightly less than 1000. The mass flow rate required in the sphere conveying lines
is calculated to lift a 58.5 mm sphere in 10.8s for the following sections as taken from the
FHSS layout model. Larger spheres will thus circulate at a faster rate.

THERMO-HYDRAULIC ANALYSIS OF THE PBMR FUEL HANDLING AND STORAGE SYSTEM PAGE - 42 -
Table 8: Sphere flow path for mass flow rate calculation
Used Fuel/Graphite Spheres lifting from
storage area:
Fuel/Graphite Spheres removed from
reactor:
From Sphere
Counter
To Sphere Counter From Sphere
Counter
To Sphere Counter
SC801 SC803 SC103 SC104
SC901 SC903 SC203 SC204
SC1001 SC1003 SC303 SC304

THERMO-HYDRAULIC ANALYSIS OF THE PBMR FUEL HANDLING AND STORAGE SYSTEM PAGE - 43 -
S C 8 0 1
S C 9 0 1 S C 1 0 0 1
S C 8 0 3
S C 9 0 3 S C 1 0 0 3
S C 1 0 3
S C 2 0 3
S C 3 0 3
S C 1 0 4
S C 2 0 4
S C 3 0 4
As an estimate, the mass flow rate is only calculated for one line in each section and then used
as the required flow rate in the other two lines.
Using the sphere conveying equations as previously described, the piping layout is simulated
and a lift mass flow rate is calculated to ensure that a 58.5 mm sphere is conveyed in
approximately 10.8 seconds. From the simulations, it is also evident that the pneumatic brake
sections are too short for the spheres to reach terminal velocity, as can be seen in figures 12,

THERMO-HYDRAULIC ANALYSIS OF THE PBMR FUEL HANDLING AND STORAGE SYSTEM PAGE - 44 -
13 and 14. The brake line mass flow is therefore adjusted to ensure that a 61 mm sphere will
leave the brake at about 0.5 m/s.
Spheres lifting from storage area: Spheres removed from reactor:
0 5 10 15 20 25 30 35 400
5
10
15
20
25
30
35
40
Pipe Simulation Layout
Horizontal Displacement (m)
Ve
rtic
al D
isp
lace
me
nt (m
)
0 5 10 15 20 25 30 35 40
0
5
10
15
20
25
30
35
40
Pipe Simulation Layout
Horizontal Displacement (m)
Ve
rtic
al D
isp
lace
me
nt (m
)
Figure 13: Side view of sphere conveying piping simulated
0 10 20 30 40 50 60 700
2
4
6
8
10
12
Total Sphere Distance Travelled (m)
Sp
he
re V
elo
city P
rofil
e (
m/s
)
Total Sphere Conveying time of `10.4395s`
0 10 20 30 40 50 60
0
1
2
3
4
5
6
7
8
Total Sphere Distance Travelled (m)
Sp
he
re V
elo
city P
rofil
e (
m/s
)
Total Sphere Conveying time of `10.4359s`
Figure 14: Sphere Velocity Profile for a 58.5 mm sphere
0 10 20 30 40 50 60 700
2
4
6
8
10
12
Total Sphere Distance Travelled (m)
Sp
he
re V
elo
city P
rofile
(m
/s)
Total Sphere Conveying time of `8.9089s`
0 10 20 30 40 50 60
0
1
2
3
4
5
6
7
8
9
10
Total Sphere Distance Travelled (m)
Sp
he
re V
elo
city P
rofile
(m
/s)
Total Sphere Conveying time of `8.3365s`
Figure 15: Sphere Velocity Profile for a 61 mm sphere
From the above results, the mass flow rates calculated to lift a 58.5 mm sphere in less than
10.8s and ensure that a 61 mm sphere exits the pneumatic brake at 0.5 m/s, are as follow:

THERMO-HYDRAULIC ANALYSIS OF THE PBMR FUEL HANDLING AND STORAGE SYSTEM PAGE - 45 -
Used Fuel/Graphite Spheres lifting from storage area lift line mass flow rate = 0.054kg/s
Used Fuel/Graphite Spheres lifting from storage area brake line mass flow rate = 0.0159kg/s
Fuel/Graphite Spheres removed from reactor lift line mass flow rate = 0.0523kg/s
Fuel/Graphite Spheres removed from reactor brake line mass flow rate = 0.0148kg/s
3.2.7.2 FHSS PNEUMATIC BRAKE ANALYSIS DURING REFUELLING OPERATION
The thermo-hydraulic data obtained were for simulations without continuous dust pocket
cleaning. The sphere impact velocities were also calculated from this data.
There are three pneumatic brake sections active during the refuelling operation (shown in
figures 16, 17 and 18), namely:
a. 10° Pneumatic brake section at the top of the reactor before the spheres enter the
measurement block section.
Pneumatic Brake Section
Figure 16: 10°°°° Pneumatic Brake Section

THERMO-HYDRAULIC ANALYSIS OF THE PBMR FUEL HANDLING AND STORAGE SYSTEM PAGE - 46 -
b. 33.4° Pneumatic brake section before the charge lock outlet assembly coming from the
sphere storage area.
Pneumatic
Brake
Section
Figure 17: 33.4°°°° Pneumatic Brake Section
c. Multi angled pneumatic brake section for spheres transported to the sphere storage
area

THERMO-HYDRAULIC ANALYSIS OF THE PBMR FUEL HANDLING AND STORAGE SYSTEM PAGE - 47 -
Pneumatic
Brake
Section
Figure 18: Pneumatic Brake Section before sphere storage area
The following FHSS Pneumatic Brake Analysis results indicate the velocity profile for both
58.5 and 61 mm spheres in the relevant pneumatic brake section. Also displayed are the
sphere impact velocities after the spheres exit the pneumatic brake sections and roll under
gravity downstream to the relevant Flow Restricting Indexer (FRI).
Note that the sphere velocity profile is only for the relevant pneumatic brake section and not
the entire flow path, which includes the sphere lifting profile, etc. The graphs shown in figure
19, 20 and 21 are also for all three-line sections, superimposed on one another, every time.

THERMO-HYDRAULIC ANALYSIS OF THE PBMR FUEL HANDLING AND STORAGE SYSTEM PAGE - 48 -
58.5 mm Spheres maximum impact velocity = 3.6 m/s & 61 mm Spheres maximum impact velocity = 2.5 m/s
Figure 19: 10º Pneumatic Brake Section Analysis
58.5 mm Spheres maximum impact velocity = 4.0 m/s & 61 mm Spheres maximum impact velocity = 2.2 m/s
Figure 20: 33.4º Pneumatic Brake Section Analysis
58.5 mm Spheres maximum impact velocity = 4.1 m/s & 61 mm Spheres maximum impact velocity = 1 m/s
Figure 21: Multi Angled Pneumatic Brake Section Analysis

THERMO-HYDRAULIC ANALYSIS OF THE PBMR FUEL HANDLING AND STORAGE SYSTEM PAGE - 49 -
4. INTERPRETATION AND VERIFICATION OF RESULTS
4.1 PREAMBLE
This chapter describes the interpretation of the simulation results. The process that was
followed for the analysis as well as the experimental modes, are also described.
A number of assumptions were made during the analysis. These assumptions are given and
motivated to verify that valid results were obtained. The convergence criteria and relaxation
parameters that were selected are given and verified to be acceptable.
The detailed results that were obtained are also given and discussed in this chapter.
4.2 SENSITIVITY AND MONTE CARLO STUDY RESULTS
4.2.1 SENSITIVITY STUDY OF CALCULATION PARAMETERS
A sensitivity and Monte Carlo study was conducted to establish whether any key parameters
or variables might significantly influence the calculations. This will also ensure that there is
sufficient confidence in the calculated sphere velocity profiles. Otherwise, additional
calculations or research may have to be conducted.
The aim of the sensitivity study was to vary single calculation input parameters one at a time
and compare the various sphere computed terminal velocities. This procedure would
determine which single parameter had the largest effect on the calculated sphere velocity. All
the results were varied randomly with a normal distribution for the Monte Carlo study. From
these results, a sphere velocity exit band profile could be determined for each operating
condition. 10 000 different runs were made for the Monte Carlo study.
For the sensitivity study, the computed sphere drag coefficient was varied by ±10%. This was
done to compensate for the uncertainty of the drag coefficient calculation. For the Monte
Carlo study, the free flow drag coefficient of 0.4 was varied by 10%. The other parameters
were varied as follows:
1. Pipe diameter by ±1%
2. Sphere diameter between 59.3 - 60.3 mm
3. Gas velocity by ±5%
4. Gas density by ±2%

THERMO-HYDRAULIC ANALYSIS OF THE PBMR FUEL HANDLING AND STORAGE SYSTEM PAGE - 50 -
5. Sphere density between 1.75 - 1.85g/cm3
6. Pipe angle by ±1° for the series of simulations.
All the sensitivity studies were conducted in helium at:
a) 250 °C and 1000 kPa,
b) 150 °C and 3300 kPa,
c) 150 °C and 9000 kPa,
for a 10° pneumatic break. The counter flow calculated is for a 60.3 mm sphere with a
terminal brake exit velocity of 1 m/s.
Table 9 refers to a, b and c for the helium temperatures and pressures as referenced above.

THERMO-HYDRAULIC ANALYSIS OF THE PBMR FUEL HANDLING AND STORAGE SYSTEM PAGE - 51
4.2.2 SENSITIVITY STUDY RESULTS
Table 9: Parameter Input Sensitivity Study
Parameters
Nr
Cd φ Pipe φ Sphere Gas Velocity Gas Density Sphere Density TERMINAL VELOCITY
- (mm) (mm) (m/s) (kg/m3) (g/cm
3) (m/s)
1a
18.4 20.4 22.4 66.7 59.3
2.048 0.918
1.75
1.69 1.50 1.34
1b 0.515 3.716 1.35 1.25 1.17
1c 0.075 9.959 1.22 1.15 1.10
2a
20.4 65.64 66.70 66.69 59.3
2.048 0.918
1.75
1.82 1.50 1.19
2b 0.515 3.716 1.14 1.25 1.09
2c 0.075 9.959 1.26 1.15 1.06
3a
20.4 66.7 58.5 59.3 60.3
2.048 0.918
1.75
1.90 1.50 1.00
3b 0.515 3.716 1.46 1.25 1.00

THERMO-HYDRAULIC ANALYSIS OF THE PBMR FUEL HANDLING AND STORAGE SYSTEM PAGE - 52 -
3c 0.075 9.959 1.29 1.16 1.00
4a
20.4 66.7 59.3
1.95 2.05 2.15 0.918
1.75
1.60 1.50 1.40
4b 0.49 0.52 0.54 3.716 1.28 1.25 1.22
4c 0.071 0.075 0.078 9.959 1.16 1.15 1.15
5a
20.4 66.7 59.3
2.048 0.90 0.92 0.94
1.75
1.54 1.50 1.47
5b 0.515 3.64 3.72 3.79 1.27 1.25 1.23
5c 0.075 9.76 9.96 10.16 1.17 1.15 1.14
6a
20.4 66.7 59.3
2.048 0.918
1.75 1.80 1.85
1.60 1.55 1.50
6b 0.515 3.716 1.30 1.28 1.25
6c 0.075 9.959 1.18 1.17 1.15

THERMO-HYDRAULIC ANALYSIS OF THE PBMR FUEL HANDLING AND STORAGE SYSTEM PAGE 53
From these results, it is evident that at low operating pressures, resulting in low helium
densities, the parameter input sensitivity has the highest percentage difference between the
varied input parameters as depicted in Table 7.
Table 10: Sensitivity study summary
Parameter % Difference at:
1000 kPa 250°°°°C
Helium
3300 kPa 150°°°°C
Helium
9000 kPa 150°°°°C
Helium
Cd 12.67 | -10.67 8.0 | -6.4 6.09 | -4.35
φ Pipe 23.33 | -20.67 8.68 | -12.8 9.04 | -8.52
φ Sphere 26.94 | -33.28 16.97 | -20.05 11.27 | -13.42
Gas Velocity 6.87 | -6.87 2.01 | -2.05 0.33 | -0.32
Gas Density 2.45 | -2.31 1.38 | -1.41 0.95 | -1.01
Sphere Density 3.30 | -3.27 1.96 | -2.07 1.23 | -1.33
Table 11: Pipe angle sensitivity
1000 kPa and 250 °°°°C
Operation
3300 kPa and 150 °°°°C
Operation
9000 kPa and 150 °°°°C
Operation
Angle 9°°°° 10°°°° 11°°°° 9°°°° 10°°°° 11°°°° 9°°°° 10°°°° 11°°°°
Vexit 1.52 1.50 1.48 1.26 1.25 1.24 1.16 1.15 1.15
%Dif 1.62 0.00 1.63 0.92 0.00 0.96 0.57 0.00 0.59
From these results, it is evident that the pipe diameter and sphere diameter have the highest
sensitivity compared to the sphere terminal velocity calculated. This is because these two
inputs are used to calculate the sphere drag coefficient (see Equation 8), which is an
exponential equation.

THERMO-HYDRAULIC ANALYSIS OF THE PBMR FUEL HANDLING AND STORAGE SYSTEM PAGE 54
4.2.3 MONTE CARLO STUDY OF CALCULATION PARAMETERS RESULTS
The aim of the Monte Carlo study was to calculate the exit velocity distribution at the
pneumatic break sections. The gas mass balance in the sphere break lines has to ensure that
the spheres do not change direction, thus becoming a blockage in the sphere line.
Ultimately the gas mass balance would influence the blower design parameters.
The graphs below will indicate the normally calculated result displayed in red with the
various simulated results from the Monte Carlo analysis spread in blue.
4.2.3.1 MONTE CARLO STUDY RESULTS AT 1000 KPA AND 250 °°°°C
Calculated Sphere Exit Velocity Lower Limit Sphere Exit
Velocity Upper Limit Sphere Exit
Velocity
1.00 m/s 0.48 m/s 2.09 m/s
Figure 22: Monte Carlo Results at 1000 kPa and 250ºC

THERMO-HYDRAULIC ANALYSIS OF THE PBMR FUEL HANDLING AND STORAGE SYSTEM PAGE 55
4.2.3.2 MONTE CARLO STUDY RESULTS AT 1000 KPA AND 250 °°°°C WITH NO COUNTER FLOW
Calculated Sphere Exit Velocity Lower Limit Sphere Exit
Velocity Upper Limit Sphere Exit
Velocity
3.10 m/s 2.33 m/s 4.47 m/s
Figure 23: Monte Carlo Results at 1000 kPa and 250ºC with no counter flow

THERMO-HYDRAULIC ANALYSIS OF THE PBMR FUEL HANDLING AND STORAGE SYSTEM PAGE 56
4.2.3.3 MONTE CARLO STUDY RESULTS AT 3300 KPA AND 150 °°°°C
Calculated Sphere Exit Velocity Lower Limit Sphere Exit
Velocity Upper Limit Sphere Exit
Velocity
1.00 m/s 0.68 m/s 1.51 m/s
Figure 24: Monte Carlo Results at 3300 kPa and 150ºC

THERMO-HYDRAULIC ANALYSIS OF THE PBMR FUEL HANDLING AND STORAGE SYSTEM PAGE 57
4.2.3.4 MONTE CARLO STUDY RESULTS AT 3300 KPA AND 150 °°°°C WITH NO COUNTER FLOW
Calculated Sphere Exit Velocity Lower Limit Sphere Exit
Velocity Upper Limit Sphere Exit
Velocity
1.54 m/s 1.26 m/s 2.09 m/s
Figure 25: Monte Carlo Results at 3300 kPa and 150ºC with no counter flow

THERMO-HYDRAULIC ANALYSIS OF THE PBMR FUEL HANDLING AND STORAGE SYSTEM PAGE 58
4.2.3.5 MONTE CARLO STUDY RESULTS AT 9000 KPA AND 150 °°°°C
Calculated Sphere Exit Velocity Lower Limit Sphere Exit
Velocity Upper Limit Sphere Exit
Velocity
1.00 m/s 0.82 m/s 1.39 m/s
Figure 26: Monte Carlo Results at 9000 kPa and 150ºC

THERMO-HYDRAULIC ANALYSIS OF THE PBMR FUEL HANDLING AND STORAGE SYSTEM PAGE 59
4.2.3.6 MONTE CARLO STUDY RESULTS AT 9000 KPA AND 150 °°°°C WITH NO COUNTER FLOW
Calculated Sphere Exit Velocity Lower Limit Sphere Exit
Velocity Upper Limit Sphere Exit
Velocity
0.94 m/s 0.76 m/s 1.30 m/s
Figure 27: Monte Carlo Results at 9000 kPa and 150ºC with no counter flow
From the Monte Carlo results, it is evident that at low pressures, the sphere exit velocity range
is at its highest, varying between about 0.5 and 2 m/s. Important to notice is that no spheres
changed direction in the brake section. For the sensitivity and Monte Carlo study sphere
friction or rotation energy was not included in the sphere velocity profile calculations.

THERMO-HYDRAULIC ANALYSIS OF THE PBMR FUEL HANDLING AND STORAGE SYSTEM PAGE 60
4.3 FHSS SIMULATION RESULTS
The following section describes the simulation results, based on the operating conditions at a
high system pressure for normal operation and at a low pressure operation for defueling and
refuelling the reactor. The tables presented in this section depict the blower operating
parameters for the simulations whilst the graphs represent some operating points pressure
ratio vs. the corrected mass flow rate.
4.3.1 HIGH PRESSURE/NORMAL OPERATION RESULTS
For normal circulation of spheres the required blower operating conditions are shown in the
table below.
Table 12: FHSS sphere circulation required during normal blower operating conditions

THERMO-HYDRAULIC ANALYSIS OF THE PBMR FUEL HANDLING AND STORAGE SYSTEM PAGE 61
Figure 28: FHSS Normal Operation Required Blower Operating Parameters
The graph indicates the different operating points for the normal FHSSS system operation
modes at two different system pressure operations.

THERMO-HYDRAULIC ANALYSIS OF THE PBMR FUEL HANDLING AND STORAGE SYSTEM PAGE 62
4.3.2 LOW PRESSURE/DEFUEL AND REFUEL OPERATION RESULTS
4.3.2.1 BLOWER DESIGN PARAMETERS INCLUDING AND EXCLUDING CONTINUOUS FRI
DUST POCKET CLEANING FOR REFUELLING OPERATION
Table 13: Blower Design Parameters for Refuelling Operation
Figure 29: Blower Design Parameters overlaid on the HTF Impeller
4.3.2.2 FUEL CORE UNLOADING OPERATION
During this mode of operation, the used fuel tank is empty or has sufficient space to receive
the spheres from the reactor core. The reactor and subsequent buffers are emptied of spheres,

THERMO-HYDRAULIC ANALYSIS OF THE PBMR FUEL HANDLING AND STORAGE SYSTEM PAGE 63
and the spheres are stored in the appropriate tanks. The spheres are transferred to the used fuel
tank, which is directly coupled to the reactor by three transfer lines, while the system pressure
is below 1MPa (abs).
The Flownex simulation calculated the blower design parameters as shown in table 11:
Table 14: Blower Design Parameters for Refuelling Operation
All these results have been computed without continuous dust pocket cleaning.
Figure 30: Blower Design Parameters overlaid on the HTF Impeller

THERMO-HYDRAULIC ANALYSIS OF THE PBMR FUEL HANDLING AND STORAGE SYSTEM PAGE 64
From Figure 30 it can be seen that the blower operating point is located on the surge line of
the simulated blower. Bypassing of the blower will shift the operating point to the right. This
will have a minimal influence on the sphere conveying piping thermo-hydraulic data and is
therefore not simulated.
4.3.2.3 DUST CLEANING OPERATION
Periodic dust removal in the sphere conveying piping is required [47]. Dust removal will be
prompted after a predetermined number of spheres have passed through the lines. If dust
accumulation is suspected due to slow rolling spheres, dust removal will also be conducted.
Consistent periodic dust removal ensures that dust does not accumulate to unacceptable
levels. This is the preferred method, rather than waiting for symptoms of dust cakes lines.
When sphere rolling is retarded through dust accumulation, effective dust cleaning becomes
more difficult because the caked dust is difficult to remove.

THERMO-HYDRAULIC ANALYSIS OF THE PBMR FUEL HANDLING AND STORAGE SYSTEM PAGE 65
Table 15: Blower Parameters for Cleaning Operation

THERMO-HYDRAULIC ANALYSIS OF THE PBMR FUEL HANDLING AND STORAGE SYSTEM PAGE 66
Figure 31: Dust Cleaning Operation Summary
4.3.3 AIR/COMMISSIONING OPERATION RESULTS
4.3.3.1 SPHERE CIRCULATION IN AIR:
Part of the FHSS commissioning is the circulating of spheres in air. Two different rates were
simulated:
a. Where the FHSS blower is operated at 100% of the designed speed and
b. Where 58.5 mm spheres are lifted at 2 m/s.
For both these simulations, the 10° pneumatic brake sections are set to ensure that a 61 mm
sphere has a terminal velocity of 0.5 m/s in the pneumatic brake.
When operating at 100% blower speed all the supply valves are simulated fully open and only
the pneumatic brake supply valves are adjusted to ensure the correct gas flow. For 2 m/s
sphere lifting both the lifting and braking supply valves are set to ensure the correct sphere
velocities.
Table 16: Blower Design Parameters for Sphere Circulation
Blower Parameters Unit 100% 2 m/s
Total Pressure Blower Inlet kPa 87.71 95.91
Total Pressure Blower Outlet kPa 113.23 105.52
FHSS Blower Volume Flow Rate m3/s 0.267 0.140
Summary Cleaning
1
1.02
1.04
1.06
1.08
1.1
1.12
0 0.2 0.4 0.6 0.8 1 1.2 1.4 1.6
Corrected Mass Flow Rate
Pre
ssu
re R
ati
o
L01-L03 Cleaning Forward L01-L03 Cleaning Reverse L01d+e - L03d+e Cleaning Forward L01d+e - L03d+e Cleaning Reverse L8,10d-L11,13 - Cleaning Forward
L8,10d-L11,13 - Cleaning Reverse L04-L06 Cleaning L55-L57 Cleaning Forward L55-L57 Cleaning Reverse
0% Blower Bypass
±32% of Total Blower Flow Bypassed
kPa100
K
s
kg
⋅⋅
Revised Cleaning Points

THERMO-HYDRAULIC ANALYSIS OF THE PBMR FUEL HANDLING AND STORAGE SYSTEM PAGE 67
Blower Parameters Unit 100% 2 m/s
FHSS Blower Differential Pressure
kPa 25.51 9.61
FHSS Blower Pressure Ratio - 1.291 1.100
FHSS Blower Corrected Mass Flow Rate kPa100
K
s
kg
⋅⋅ 4.629 2.669
FHSS Blower Mass Flow Rate kg/s 0.202 0.140
Total Temperature Blower Inlet °C 131.49 60.99
Total Temperature Blower Outlet °C 177.84 75.17
Blower Efficiency (η) - 65.16 64.99
Blower Bypass Mass Flow Rate kg/s 0.000 0.000
Blower Fluidic Power kW 9.53 2.00
Table 17: Sphere Velocities during Circulation Operation
100% Operation 58.5 mm Sphere 61 mm Sphere
Lift Line Terminal Velocity (m/s) 11.07 14.24
10° Brake Line Terminal Velocity (m/s) 1.65 0.50
2 m/s Lifting Operation 58.5 mm Sphere 61 mm Sphere
Lift Line Terminal Velocity (m/s) 2.00 4.84
10° Brake Line Terminal Velocity (m/s) 1.65 0.50

THERMO-HYDRAULIC ANALYSIS OF THE PBMR FUEL HANDLING AND STORAGE SYSTEM PAGE 68
Figure 32: Blower Design Parameters for Sphere Circulation
4.3.3.2 DE-FUEL OPERATION IN AIR (REPRESENTATIVE FOR NITROGEN)
During de-fuelling the fuel spheres in the core are unloaded and transported to the fuel storage
area. At the same time, the core is filled with graphite spheres transported from the storage
area.
For the simulations the gas flow in the 10° and 33.4° pneumatic brake sections are set to
ensure that a 61 mm sphere has a terminal velocity of 0.5 m/s in the pneumatic brake.
During this operation both lift lines from the reactor and the lift lines from the storage area are
utilised. For maximum lifting velocities, the supply valves to the storage area lifting lines are
fully open and the supply valves to the reactor lift lines throttled to ensure that the flow is the
same in all the lift line sections. This is done only as a first estimation to see what maximum
possible flow in the lift lines is achievable. All the control valves are assumed to have a
cumulative pressure loss of at least 30% of the system pressure.
Table 18: Blower Design Parameters for De-fuel Operation
Blower Parameters Unit Value
Total Pressure Blower Inlet kPa 94.91
Total Pressure Blower Outlet kPa 110.57
FHSS Blower Volume Flow Rate m3/s 0.327

THERMO-HYDRAULIC ANALYSIS OF THE PBMR FUEL HANDLING AND STORAGE SYSTEM PAGE 69
Blower Parameters Unit Value
FHSS Blower Differential Pressure kPa 15.66
FHSS Blower Pressure Ratio - 1.165
FHSS Blower Corrected Mass Flow Rate kPa100
K
s
kg
⋅⋅ 6.117
FHSS Blower Mass Flow Rate kg/s 0.312
Total Temperature Blower Inlet °C 72.67
Total Temperature Blower Outlet °C 105.67
Blower Efficiency (η) - 46.41
Blower Bypass Mass Flow Rate kg/s 0.000
Blower Fluidic Power kW 10.42
Table 19: Sphere Velocities during De-fuel Operation
De-fuel Operation 58.5 mm Sphere 61 mm Sphere
All Lift Lines Terminal Velocity (m/s) 1.13 4.00
10° Brake Lines Terminal Velocity (m/s) 1.65 0.50
33.4° Brake Lines Terminal Velocity (m/s) 2.56 0.50
These graphs show that low lift line velocities will result in a very slow de-fuel rate during air
operation.

THERMO-HYDRAULIC ANALYSIS OF THE PBMR FUEL HANDLING AND STORAGE SYSTEM PAGE 70
0 1 2 3 4 5 6 71
1.05
1.1
1.15
1.2
1.25
1.3
1.35
0.353 0.707 1.413 2.827 4.240
5.654 7.067
8.481
9.894
11.308
12.721
14.135
Defuel Operation
Pre
ssure
ratio
Corrected Mass Flow Rate (kg/s sqrt(K)/100kPa
Figure 33: Blower Design Parameters for De-fuel Operation
4.3.3.3 UNLOAD OPERATION IN AIR (REPRESENTATIVE FOR NITROGEN)
During unload operation the reactor core is emptied of all spheres. The FHSS blower is set to
100% of its maximum speed. When operating at 100% all the supply valves are simulated
fully open and only the pneumatic brake supply valves are set to ensure the correct gas flow.
The pneumatic brake velocity is set to ensure that a 61 mm sphere has a brake terminal
velocity of 0.5 m/s.

THERMO-HYDRAULIC ANALYSIS OF THE PBMR FUEL HANDLING AND STORAGE SYSTEM PAGE 71
Table 20: Blower Design Parameters for Unload Operation
Blower Parameters Unit Value
Total Pressure Blower Inlet kPa 88.95
Total Pressure Blower Outlet kPa 112.65
FHSS Blower Volume Flow Rate m3/s 0.316
FHSS Blower Differential Pressure kPa 23.70
FHSS Blower Pressure Ratio - 1.266
FHSS Blower Corrected Mass Flow Rate kPa100
K
s
kg
⋅⋅
5.620
FHSS Blower Mass Flow Rate kg/s 0.255
Total Temperature Blower Inlet °C 110.37
Total Temperature Blower Outlet °C 152.67
Blower Efficiency (η) - 62.60
Blower Bypass Mass Flow Rate kg/s 0.000
Blower Fluidic Power kW 10.93
Table 21: Sphere Velocities during Unload Operation
Unload Operation 58.5 mm Sphere 61 mm Sphere
Lift Line Terminal Velocity (m/s) 9.19 12.27
10° Brake Line Terminal Velocity (m/s) 1.65 0.50
Figure 34: Blower Design Parameters for Unload Operation

THERMO-HYDRAULIC ANALYSIS OF THE PBMR FUEL HANDLING AND STORAGE SYSTEM PAGE 72
4.3.3.4 DUST CLEANING OPERATION IN AIR
As described previously the dust removal will be prompted after a pre-determined number of
spheres have passed through the lines or if dust accumulation is suspected due to slow rolling
spheres.
For the revised simulations, the gas piping diameters from the cleaning block to the three-way
valves on the measurement blocks were increased from 2½” (63.5 mm) ID piping to 3” (76.2
mm) ID piping. The return piping to the return manifold was increased by the same ratio. The
inlet nozzles inside the valve blocks connecting the sphere conveying lines to the cleaning
lines were also increased from a 42 mm to a 47 mm ID hole. This was done to show that,
conceptually, the FHSS piping could still be optimised by some margin to decrease the overall
system pressure ratio. The required cleaning velocity is in the order of 22 m/s.
Table 22: Blower Design Parameters for Cleaning Operation
Blower Parameters Unit Minimum
gas velocity required
Revised Minimum
gas velocity required
Total Pressure Blower Inlet kPa 100.62 100.85
Total Pressure Blower Outlet kPa 172.80 155.27
FHSS Blower Volume Flow Rate m3/s 0.144 0.109
FHSS Blower Differential Pressure kPa 72.18 54.42
FHSS Blower Pressure Ratio - 1.717 1.540
FHSS Blower Corrected Mass Flow Rate kPa100
K
s
kg
⋅⋅ 2.481 1.853
FHSS Blower Mass Flow Rate kg/s 0.123 0.091
Total Temperature Blower Inlet °C 136.69 144.40
Total Temperature Blower Outlet °C 250.00 235.00
Blower Efficiency (η) - 59.21 59.32
Blower Bypass Mass Flow Rate kg/s 0.025 0.000
Blower Fluidic Power kW 14.32 8.48

THERMO-HYDRAULIC ANALYSIS OF THE PBMR FUEL HANDLING AND STORAGE SYSTEM PAGE 73
Figure 35: Blower Design Parameters for Cleaning Operation
From table 22 and figure 35 above the results indicates that an increase in the piping ID
resulted in a 18 kPa decrease in the system pressure difference. The pressure difference is
illustrated by point 1 and point 2 on the figure 35 above. If it is assumed that a blower
pressure ratio of 1.5 is achievable in air and the system is optimised, cleaning line section L57
will be achievable at the required velocity. Some blower bypass will just have to be generated
to ensure that point 2 on the figure moves within the blowers surge line capacity.

THERMO-HYDRAULIC ANALYSIS OF THE PBMR FUEL HANDLING AND STORAGE SYSTEM PAGE 74
4.3.4 SUMMARY OF RESULTS FOR AIR OPERATION
Table 23: Summary of Blower Design Parameters for FHSS Air Operation
` Unit 100%
Circulation 2 m/s
Circulation De-fuel Unload
Minimum gas
velocity required
Revised Minimum
gas velocity required
Total Pressure Blower Inlet kPa 87.71 95.91 94.91 88.95 100.80 100.84
Total Pressure Blower Outlet kPa 113.23 105.52 110.57 112.65 175.64 159.05
FHSS Blower Volume Flow Rate
m3/s
0.267 0.140 0.327 0.316 0.102 0.097
FHSS Blower Differential Pressure
kPa 25.51 9.61 15.66 23.70 74.83 58.21
FHSS Blower Pressure Ratio - 1.291 1.100 1.165 1.266 1.742 1.577
FHSS Blower Corrected Mass Flow Rate
kPa100
K
s
kg
⋅⋅ 4.629 2.669 6.117 5.620 1.981 1.875
FHSS Blower Mass Flow Rate kg/s 0.202 0.140 0.312 0.255 0.111 0.105
Total Temperature Blower Inlet °C 131.49 60.99 72.67 110.37 50.00 50.00
Total Temperature Blower Outlet
°C 177.84 75.17 105.67 152.67 144.23 125.51
Blower Efficiency (η) - 65.16 64.99 46.41 62.60 58.52 59.15
Blower Bypass Mass Flow Rate kg/s 0.000 0.000 0.000 0.000 0.000 0.000
Blower Fluidic Power kW 9.53 2.00 10.42 10.93 10.60 8.03
Table 24: Calculated Sphere Terminal Velocities for Air Operation
Normal Circulation 100% Operation 58.5 mm Sphere 61 mm Sphere
Lift Line Terminal Velocity (m/s) 11.07 14.24
10° Brake Line Terminal Velocity (m/s) 1.65 0.50
Normal Circulation 2 m/s Lifting Operation 58.5 mm Sphere 61 mm Sphere
Lift Line Terminal Velocity (m/s) 2.00 4.84
10° Brake Line Terminal Velocity (m/s) 1.65 0.50
De-fuel 100% Operation 58.5 mm Sphere 61 mm Sphere
All Lift Lines Terminal Velocity (m/s) 1.13 4.00
10° Brake Lines Terminal Velocity (m/s) 1.65 0.50
33.4° Brake Lines Terminal Velocity (m/s) 2.56 0.50
Unload 100% Operation 58.5 mm Sphere 61 mm Sphere
Lift Line Terminal Velocity (m/s) 9.19 12.27
10° Brake Line Terminal Velocity (m/s) 1.65 0.50

THERMO-HYDRAULIC ANALYSIS OF THE PBMR FUEL HANDLING AND STORAGE SYSTEM PAGE 75
Figure 36: Summary of Blower Design Parameters for FHSS Air Operation
Maximum rate of normal circulation in air, results in an average sphere lift line velocity of
12.7 m/s.
De-fuel operation in air is possible (also representative for nitrogen) but with very slow lift
line sphere velocities.
Defuel operation in air is possible (also representative for nitrogen).
Gas piping diameters from the cleaning block to the three-way valves on the measurement
blocks were increased from 2½” (63.5 mm) ID piping to 3” (76.2 mm) ID piping and also the
return piping to the return manifold were increased by the same ratio. The inlet nozzles inside
the valve blocks connecting to the sphere conveying lines with the cleaning lines were also
increased from a 42 mm to a 47 mm ID hole. From the above results, it is evident that the
above changes mentioned had an 18 kPa decrease in the system pressure difference. If it is
assumed that a blower pressure ratio of 1.5 is a thermo-hydraulic solution in air and the
system is optimised some more for the minimum pressure difference achievable, cleaning line
section L57 will be achievable at the required velocity if the blower flow is bypassed. The
blower’s physical constraints such as torque limitation should however also be taken into
account and will be evaluated once the blower design matures.

THERMO-HYDRAULIC ANALYSIS OF THE PBMR FUEL HANDLING AND STORAGE SYSTEM PAGE 76
5. CONCLUSION AND RECOMMENDATIONS
The major objective of this study was to calculate the FHSS blower thermo-hydraulic design
parameters, specifically focusing on the impeller design input parameters. A sensitivity and
Monte Carlo study was done to compensate for some of the uncertainty input parameters
which the simulations would be based upon.
From the simulations done, the resultant input parameters for the impeller design were
calculated as follow:
Table 25: FHSS Blower Design Parameters for High Pressure Operation
Blower Parameters
Unit
Mode S&GC- M070103 Blower Mode S&GC- M030100
A B C D
100% MCR 100% MCRI% Forward
100% MCR 100% MCRI% Reverse
16% MCR 40% MCRI% Forward
16% MCR 40% MCRI% Reverse
Total Pressure Blower Inlet
kPa 3329 8852 8854 3330 8995 8995 3385 3386
Total Pressure Blower Outlet
kPa 3370 8914 8913 3370 9117 9117 3510 3510
FHSS Blower Volume Flow Rate
kg/m3
0.080 0.061 0.059 0.077 0.041 0.040 0.065 0.065
FHSS Blower Differential Pressure
kPa 41.36 61.99 59.53 39.78 121.88 122.35 124.70 124.20
FHSS Blower Pressure Ratio
- 1.012 1.007 1.007 1.012 1.014 1.014 1.037 1.037
FHSS Blower Corrected Mass Flow Rate kPa100
K
s
kg
⋅⋅ 0.199 0.148 0.142 0.192 0.099 0.099 0.167 0.166
FHSS Blower Mass Flow Rate
kg/s 0.345 0.675 0.652 0.334 0.464 0.463 0.305 0.304
Total Temperature Blower Inlet
°C 95.45 101.93 99.64 92.17 93.00 93.00 71.00 71.00
Total Temperature Blower Outlet
°C 100.82 104.96 102.47 97.17 96.60 96.61 80.24 80.20
Blower
Efficiency (η)
- 33.85 34.30 34.98 34.63 53.92 53.92 53.88 53.89
Blower Bypass Mass Flow Rate
kg/s 0.000 0.000 0.000 0.000 0.000 0.000 0.000 0.000

THERMO-HYDRAULIC ANALYSIS OF THE PBMR FUEL HANDLING AND STORAGE SYSTEM PAGE 77
0.98
1
1.02
1.04
1.06
1.08
1.1
1.12
1.14
1.16
0 0.05 0.1 0.15 0.2 0.25 0.3 0.35 0.4 0.45
Pre
ss
ure
Rati
o
Corrected Mass Flow
T2/F Impeller
100% MCR 100% MCRI% Forward 100% MCR 100% MCRI% Reverse 15% MCR 40% MCRI% Forward
15% MCR 40% MCRI% Reverse 15% MCR 40% MCRI -A 100% MCR 100% MCRI - B
Figure 37: FHSS Blower Design Parameters for High Pressure Operation
Table 26: FHSS Low Pressure Operation Blower Design Parameters
Blower Parameters
Unit
Refuelling Operation
Fuel Core Unloading Operation
Dust Cleaning Operation
Excluding continuous dust pocket cleaning
Including continuous dust pocket cleaning
Forward ≈≈≈≈32% TFB
Reverse ≈≈≈≈32% TFB
Forward Revised ≈≈≈≈32% TFB
Reverse Revised ≈≈≈≈32% TFB
Total Pressure Blower Inlet
kPa 962.95 989.26 978.58 971.07 950.36 973.24 954.65
Total Pressure Blower Outlet
kPa 1007.70 1141.61 1003.40 1046.43 1029.41 1041.36 1021.48
FHSS Blower Volume Flow Rate
m3/s
0.397 0.509 0.179 0.268 0.277 0.382 0.393
FHSS Blower Differential Pressure
kPa 44.74 152.36 24.82 75.36 79.05 68.13 66.83
FHSS Blower Pressure Ratio
- 1.046 1.154 1.025 1.078 1.083 1.070 1.070
FHSS Blower Corrected Mass Flow Rate kPa100
K
s
kg
⋅⋅ 0.924 1.119 0.443 0.707 0.730 1.015 1.042
FHSS Blower Mass Flow Rate
kg/s 0.432 0.507 0.224 0.378 0.382 0.547 0.551
Total Temperature Blower Inlet
°C 151.42 203.85 101.80 56.91 57.28 53.16 53.15
Total Temperature Blower Outlet
°C 163.75 250.00 108.03 75.94 77.73 66.97 67.02

THERMO-HYDRAULIC ANALYSIS OF THE PBMR FUEL HANDLING AND STORAGE SYSTEM PAGE 78
Blower Parameters
Unit
Refuelling Operation
Fuel Core Unloading Operation
Dust Cleaning Operation
Excluding continuous dust pocket cleaning
Including continuous dust pocket cleaning
Forward ≈≈≈≈32% TFB
Reverse ≈≈≈≈32% TFB
Forward Revised ≈≈≈≈32% TFB
Reverse Revised ≈≈≈≈32% TFB
Blower Efficiency
(η)
- 62.99 60.83 60.44 52.49 52.35 64.61 64.31
Blower Bypass Mass Flow Rate
kg/s 0.000 0.066 0.000 0.257 0.261 0.425 0.428
Blower Fluidic Power
kW 27.71 121.75 7.26 37.42 40.62 39.34 39.8
Figure 38: FHSS Low Pressure Operation Blower Design Parameters overlaid on the
HTF Impeller

THERMO-HYDRAULIC ANALYSIS OF THE PBMR FUEL HANDLING AND STORAGE SYSTEM PAGE 79
Table 27: Summary of Blower Design Parameters for FHSS Air Operation
Blower Parameters
Unit 100%
Circulation 2 m/s
Circulation De-fuel Unload
Minimum gas velocity
required
Revised Minimum
gas velocity required
Total Pressure Blower Inlet
kPa 87.71 95.91 94.91 88.95 100.80 100.84
Total Pressure Blower Outlet
kPa 113.23 105.52 110.57 112.65 175.64 159.05
FHSS Blower Volume Flow Rate
m3/s
0.267 0.140 0.327 0.316 0.102 0.097
FHSS Blower Differential Pressure
kPa 25.51 9.61 15.66 23.70 74.83 58.21
FHSS Blower Pressure Ratio
- 1.291 1.100 1.165 1.266 1.742 1.577
FHSS Blower Corrected Mass Flow Rate kPa100
K
s
kg
⋅⋅ 4.629 2.669 6.117 5.620 1.981 1.875
FHSS Blower Mass Flow Rate
kg/s 0.202 0.140 0.312 0.255 0.111 0.105
Total Temperature Blower Inlet
°C 131.49 60.99 72.67 110.37 50.00 50.00
Total Temperature Blower Outlet
°C 177.84 75.17 105.67 152.67 144.23 125.51
Blower Efficiency
(η)
- 65.16 64.99 46.41 62.60 58.52 59.15
Blower Bypass Mass Flow Rate
kg/s 0.000 0.000 0.000 0.000 0.000 0.000
Blower Fluidic Power
kW 9.53 2.00 10.42 10.93 10.60 8.03

THERMO-HYDRAULIC ANALYSIS OF THE PBMR FUEL HANDLING AND STORAGE SYSTEM PAGE 80
Figure 39: Summary of Blower Design Parameters for FHSS Air Operation
The thermo-hydraulic analysis of the FHSS system is only the first step in the development of
the FHSS blower.
The results generated should be a sufficient source of input design parameters to use for an
impeller selection that will be able to generate all the operating points simulated and
presented in this section of the report.
Once the impeller selected is completed a detail blower characteristic map must be generated.
The detail blower characteristic map should then be used to repeat all the simulations.
Once these simulations are complete, the generated results can be used as input to the system
pressure boundary design, as the entire operating range will have been simulated, with
temperatures, pressures and mass flow rates being available for the calculation of the pressure
boundary conditions in all the simulated FHSS process elements.
The FHSS blower characteristic map can also be used to simulate and fix the system control
philosophy. The next stage in the design process would be to complete the basic and detail
design for the blower. Once fabricated, the blower can be tested to determine if the design
characteristic map matches the actual performance map of the blower. If there are slight
differences the simulations can be updated to verify that the system operation and control
philosophy remains sufficient for the FHSS process.

THERMO-HYDRAULIC ANALYSIS OF THE PBMR FUEL HANDLING AND STORAGE SYSTEM PAGE 81
The final verification will be to compare the as build FHSS system operational results with
the simulation results. Variations can be investigated and resolved to ensure an accurate
simulation model is available that fully represents the operational system. This verified
simulation model can be used as part of a training simulator or to further develop and
optimise the FHSS system.

THERMO-HYDRAULIC ANALYSIS OF THE PBMR FUEL HANDLING AND STORAGE SYSTEM PAGE 82
6. REFERENCES
[1] Pebble Bed Modular Reactor Brochure, PBMR (Pty) Ltd, 2003
[2] Pebble Power, Popular mechanics 1 no.2 (2002) 78-81
[3] Koster, A, Matzner, H.D, Nicholsi, D.R, PBMR design for the future, Nuclear and
Design 222 (2003) 231-245
[4] Internet Web Site of the company PBMR, www.pbmr.co.za, 2002
[5] Modular Milestone, Popular Mechanics 1 no.7 (2002) 85
[6] Introduction to the Pebble Bed Modular Reactor, 009949-185, PBMR Document and
Data Control Centre, South Africa, 2003
[7] Rousseau, P.G, Advanced Thermal-Fluid Systems Course Notes, School of Mechanical
and Materials Engineering, PU for CHE, 2002
[8] Versteeg, H.K., Malalasekera, W., An Introduction to Computational Fluid Dynamics –
The Finite Volume method, Longman, 1995
[9] Flownex User Manual Part 1, FN6Man_2, PBMR Document and Data Control Centre,
South Africa, 2002
[10] FHSS Flownex System Model Report, MF000-002728-3110/4, PBMR Document and
Data Control Centre, South Africa, 2004
[11] Groenewald, Y., Mail & Guardian 2208 (2003)
[12] Internet Web Site of the company Rolls-Royce, www.rolls-royce.com, 2004
[13] Internet Web Site of the company PCA Engineers (USA), www.pcaeng.co.uk, 2004
[14] Internet Web Site of the company Concepts NECSA, www.conceptseti.com, 2004
[15] Internet Web Site of the company Mitsubishi Heavy Industries, www.mhi.co.jp, 2004
[16] Internet Web Site of the company Kobel Steel Ltd (Japan), www.kobelco.co.jp, 2004
[17] Internet Web Site of the academic institute Massachusetts Institute of Technology
(MIT), www.mit.edu, 2004
[18] Internet Web Site of the academic institute Cranfield University, www.cranfield.ac.uk,
2002
[19] Van der Merwe, PG, Method for the Thermo-Hydraulic analysis of the test facility for
the PBMR reserve shutdown system, 2004

THERMO-HYDRAULIC ANALYSIS OF THE PBMR FUEL HANDLING AND STORAGE SYSTEM PAGE 83
[20] M-Tech Procedure: Process for Verification and Validation of Software, MTQS-4.1_10,
PBMR Document and Data Control Centre, South Africa, 2003
[21] M-Tech Procedure: Project Management for the Design, Development and Maintenance
of Software, MTQS-4.1_5, PBMR Document and Data Control Centre, South Africa,
2003
[22] M-Tech Procedure: Configuration Management Process Definition for Software,
MTQS-4.1_9, PBMR Document and Data Control Centre, South Africa, 2003
[23] Flownex Nuclear Software Verification and Validation Plan, FNXVV-0001.1, PBMR
Document and Data Control Centre, South Africa, 2003
[24] Internet Web Site of GLOBALSPEC, the engineering search engine,
http://vacuumpumps.globalspec.com, 2005
[25] Internet Web Site of Industrial of Industrial Heating, http://www.industrialheating.com,
2002
[26] Internet Web Site of Tauon, educational document,
http://tauon.nuc.berkeley.edu/asia/1999/TPE99Xu.pdf
[27] Voss, G.M.,. Bond, A., Davis, S., Harte, M., Watson, R., The Cascading Pebble
Divertor for the Spherical Tokamak Power Plant, 2005
[28] Internet Web Site of Paxton Products, http://www.paxtonproducts.com/, 2005
[29] Sayers, A.T., Hydraulic and Compressible Flow Turbomachines, British Library
Cataloguing in Publication Data, 1946
[30] FHSS Required Gas Flow Rates, 008237-34, PBMR Document and Data Control
Centre, South Africa, 2002

THERMO-HYDRAULIC ANALYSIS OF THE PBMR FUEL HANDLING AND STORAGE SYSTEM PAGE 84
The following section specifically depicts the required input documents required for setting
up the Flownex thermo-hydraulic model of the FHSS:
[31] PBMR FHSS Triplex Flownex Model (work request) revision 1, PBMR Document and
Data Control Centre, South Africa, 2002
[32] FHSS UG Model, revision C, PBMR Document and Data Control Centre, South Africa,
2002
[33] FHSS (Triplex) Sphere Circulating, Conveying Gas & Cleaning Gas PFD, revision 1C,
PBMR Document and Data Control Centre, South Africa, 2002
[34] Quality Assurance Procedure: Calculations, QAP_0403N revision 2, PBMR Document
and Data Control Centre, South Africa, 2002
[35] Flownex Nuclear Users Manual, 019599 revision 2, PBMR Document and Data Control
Centre, South Africa, 2002
[36] PBMR FHSS Blower Characterisation for Flownex, 008217-34 revision 1, PBMR
Document and Data Control Centre, South Africa, 2002
[37] PBMR FHSS Filter Characterisation Report, MF000-022329-3180 revision 1, PBMR
Document and Data Control Centre, South Africa, 2002
[38] FHSS Trim Valve Characteristics, MF000-019420-3170 revision 1, PBMR Document
and Data Control Centre, South Africa, 2002
[39] Internal flow systems, Volume 5 in the BHRA Fluid Engineering series, D.S. Miller,
PBMR/1227, PBMR Document and Data Control Centre, South Africa, 2002
[40] PBMR Technical Guidelines for Thermo-Hydraulic Modelling, PP260-015066-4410
revision 1, PBMR Document and Data Control Centre, South Africa, 2002
[41] PBMR FHSS Venturi characterisation Report, MF000-022263-3180 revision 1, PBMR
Document and Data Control Centre, South Africa, 2002
[42] HRB-Bean-Thermal Insulation Rods/Blocks, PBMR/1938, PBMR Document and Data
Control Centre, South Africa, 2002
[43] Heat Transfer, JP Holman, 8th edition 1997, PBMR/1205, PBMR Document and Data
Control Centre, South Africa, 2002
[44] Flow Resistance: A Design Guide for Engineers, E Fried & IE Idelchik, 1989,
PBMR/2967, PBMR Document and Data Control Centre, South Africa, 2002

THERMO-HYDRAULIC ANALYSIS OF THE PBMR FUEL HANDLING AND STORAGE SYSTEM PAGE 85
[45] Interface Control Drawing: Sphere Conveying Pipe to Sphere, FH-A-313620-45
revision 1D, PBMR Document and Data Control Centre, South Africa, 2002
[46] ATL Ball Valve Characterisation, MF000-022762-3130 revision 1, PBMR Document
and Data Control Centre, South Africa, 2002
[47] FHSS Development Specification, MF000-016062-4325 revision 1, PBMR Document
and Data Control Centre, South Africa, 2002
[48] PBMR Flownet Reactor System Model Report, PP260-016065-3110 revision 2, PBMR
Document and Data Control Centre, South Africa, 2002
[49] PBMR MPS Flownet System Model Report, MS000-016213-3110 revision 2, PBMR
Document and Data Control Centre, South Africa, 2002
[50] PBMR Demonstration Module HVAC User Specification, MM350-015508-4300
revision 1, PBMR Document and Data Control Centre, South Africa, 2002
[51] PBMR FHSS Requirement Budgets for Services 400MW Baseline, FHD1-000000-80
revision C, PBMR Document and Data Control Centre, South Africa, 2002
[52] FHSS System Operating Description, FHD1-000000-225 revision B, PBMR Document
and Data Control Centre, South Africa, 2002
[53] HTF Blower Flownex System Model Report, PP150-018840-3110, PBMR Document
and Data Control Centre, South Africa, 2002
[54] Internet Web Site of Flownex, http://www.flownex.co.za
[55] Internet Web Site of Flownex , http://en.wikipedia.org/wiki/Critical_mass

THERMO-HYDRAULIC ANALYSIS OF THE PBMR FUEL HANDLING AND STORAGE SYSTEM PAGE 86
APPENDIX A
MONTE CARLO SIMULATIONS INPUT DISTRIBUTION
MONTE CARLO ANALYSIS INPUTS AT 1000 KPA AND 250 °°°°C
7.5 8 8.5 9 9.5 10 10.5 11 11.5 120
200
400
600
800
1000
1200
Pneumatic Brake Angle (°)
Nr
of
Variable
s D
istr
ibute
d
Pneumatic Brake Angle Normal Distribution between 9 - 11 °
0.32 0.34 0.36 0.38 0.4 0.42 0.44 0.46 0.480
100
200
300
400
500
600
700
800
900
1000
Free Flow Sphere Drag Coefficient
Nr
of
Variable
s D
istr
ibute
d
Free Flow Sphere Drag Coefficient Normal Distribution ± 10%
0.065 0.0655 0.066 0.0665 0.067 0.0675 0.068 0.06850
200
400
600
800
1000
1200
Pipe Diameter (m)
Nr
of
Variable
s D
istr
ibute
d
Pipe Diameter Normal Distribution ± 1%
58.8 59 59.2 59.4 59.6 59.8 60 60.2 60.4 60.6 60.80
200
400
600
800
1000
1200
Sphere Diameter (mm)
Nr
of
Variable
s D
istr
ibute
d
Sphere Diameter Normal Distribution between 59.3 - 60.3 mm
0.88 0.89 0.9 0.91 0.92 0.93 0.94 0.95 0.960
200
400
600
800
1000
1200
Gas Density (kg/m3)
Nr
of
Variable
s D
istr
ibute
d
Gas Density Distribution ± 2%
1.7 1.72 1.74 1.76 1.78 1.8 1.82 1.84 1.86 1.88 1.90
100
200
300
400
500
600
700
800
900
1000
Sphere Density (g/cm3)
Nr
of
Variable
s D
istr
ibute
d
Sphere Density Normal Distribution between 1.75 - 1.85 g/cm3
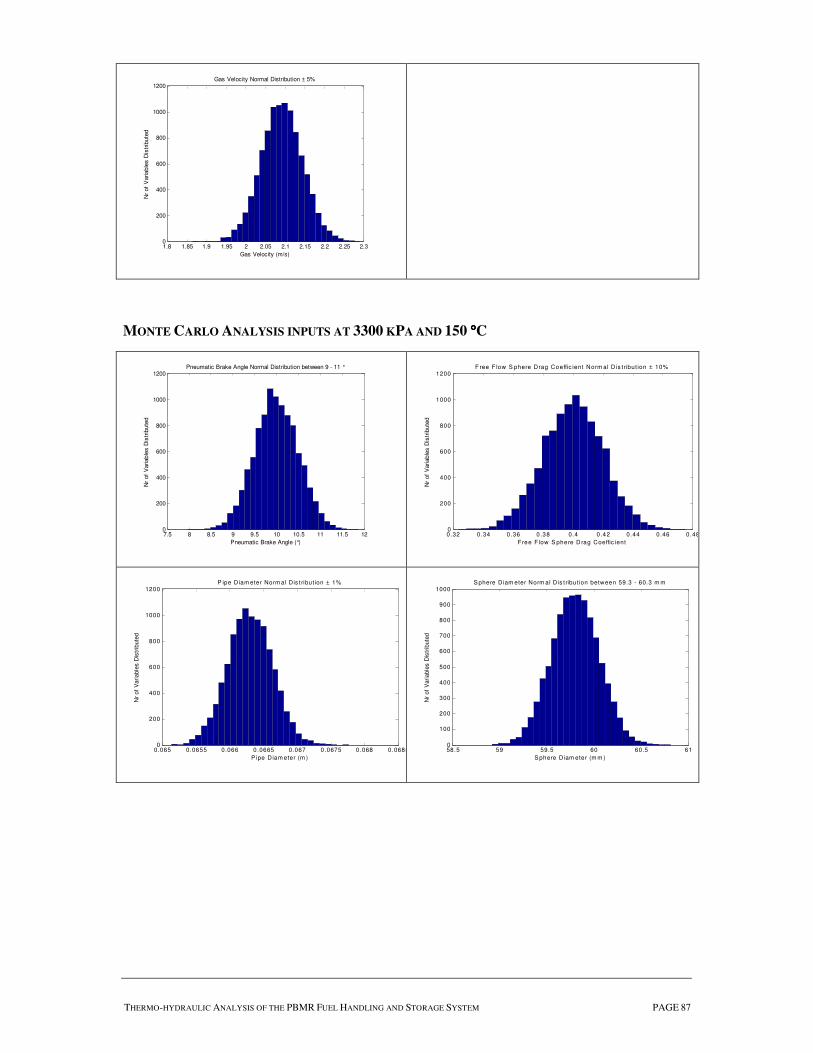
THERMO-HYDRAULIC ANALYSIS OF THE PBMR FUEL HANDLING AND STORAGE SYSTEM PAGE 87
1.8 1.85 1.9 1.95 2 2.05 2.1 2.15 2.2 2.25 2.30
200
400
600
800
1000
1200
Gas Velocity (m/s)
Nr
of
Variable
s D
istr
ibute
d
Gas Velocity Normal Distribution ± 5%
MONTE CARLO ANALYSIS INPUTS AT 3300 KPA AND 150 °°°°C
7.5 8 8.5 9 9.5 10 10.5 11 11.5 120
200
400
600
800
1000
1200
Pneumatic Brake Angle (°)
Nr
of
Variable
s D
istr
ibute
d
Pneumatic Brake Angle Normal Distribution between 9 - 11 °
0.32 0.34 0.36 0.38 0.4 0.42 0.44 0.46 0.480
200
400
600
800
1000
1200
Free F low S phere D rag Coeffic ient
Nr
of
Variable
s D
istr
ibute
d
F ree F low S phere Drag Coeffic ient Norm al D is tribut ion ± 10%
0.065 0.0655 0.066 0.0665 0.067 0.0675 0.068 0.06850
200
400
600
800
1000
1200
P ipe Diam eter (m )
Nr
of
Variable
s D
istr
ibute
d
P ipe Diam eter Norm al Dis tribut ion ± 1%
58.5 59 59.5 60 60.5 610
100
200
300
400
500
600
700
800
900
1000
S phere Diam eter (m m )
Nr
of
Variable
s D
istr
ibute
d
S phere Diam eter Norm al D is tribut ion between 59.3 - 60.3 m m

THERMO-HYDRAULIC ANALYSIS OF THE PBMR FUEL HANDLING AND STORAGE SYSTEM PAGE 88
3.55 3.6 3.65 3.7 3.75 3.8 3.85 3.9 3.950
200
400
600
800
1000
1200
G as Dens ity (k g/m 3)
Nr
of
Variable
s D
istr
ibute
d
G as Dens ity D is tribut ion ± 2%
1.7 1.72 1.74 1.76 1.78 1.8 1.82 1.84 1.86 1.88 1.90
200
400
600
800
1000
1200
S phere Dens ity (g/c m 3)
Nr
of
Variable
s D
istr
ibute
d
S phere Dens ity Norm al D is tribut ion between 1.75 - 1.85 g/c m3
0.45 0.5 0.55 0.60
200
400
600
800
1000
1200
G as V eloc ity (m /s )
Nr
of
Variable
s D
istr
ibute
d
G as V eloc ity Norm al D is tribution ± 5%
MONTE CARLO ANALYSIS INPUTS AT 9000 KPA AND 150 °°°°C
8 8.5 9 9.5 10 10.5 11 11.5 120
100
200
300
400
500
600
700
800
900
1000
P neum atic B rak e A ngle (°)
Nr
of
Variable
s D
istr
ibute
d
P neum atic B rak e A ngle Norm al Dis tribut ion between 9 - 11 °
0.32 0.34 0.36 0.38 0.4 0.42 0.44 0.46 0.480
200
400
600
800
1000
1200
Free F low S phere Drag Coeffic ient
Nr
of
Variable
s D
istr
ibute
d
F ree F low S phere Drag Coeffic ient Norm al Dis tribution ± 10%

THERMO-HYDRAULIC ANALYSIS OF THE PBMR FUEL HANDLING AND STORAGE SYSTEM PAGE 89
0.0645 0.065 0.0655 0.066 0.0665 0.067 0.0675 0.068 0.06850
200
400
600
800
1000
1200
P ipe Diam eter (m )
Nr
of
Variable
s D
istr
ibute
d
P ipe Diam eter N orm al D is tribut ion ± 1%
58.5 59 59.5 60 60.5 610
200
400
600
800
1000
1200
S phere Diam eter (m m )
Nr
of
Variable
s D
istr
ibute
d
S phere Diam eter Norm al D is tribut ion between 59.3 - 60.3 m m
9.5 9.6 9.7 9.8 9.9 10 10.1 10.2 10.3 10.4 10.50
200
400
600
800
1000
1200
G as Dens ity (k g/m 3)
Nr
of
Variable
s D
istr
ibute
d
G as Dens ity D is tribut ion ± 2%
1.65 1.7 1.75 1.8 1.85 1.90
200
400
600
800
1000
1200
S phere Dens ity (g/c m 3)
Nr
of
Variable
s D
istr
ibute
d
S phere Dens ity Norm al D is tribut ion between 1.75 - 1.85 g/c m3
-0.068 -0.066 -0.064 -0.062 -0.06 -0.058 -0.056 -0.0540
200
400
600
800
1000
1200
G as V eloc ity (m /s )
Nr
of
Variable
s D
istr
ibute
d
G as V eloc ity Norm al D is tribution ± 5%

THERMO-HYDRAULIC ANALYSIS OF THE PBMR FUEL HANDLING AND STORAGE SYSTEM PAGE 90
APPENDIX B
FHSS FLOWNEX MODEL DESCRIPTION
The following numbering convention was extracted from [52]:
Line numbers as indicated on the PFD e.g. He01 or L02a.
For block inserts the following:
E.g. ABB-CCC-DEE (Comments)
Table 28: Element Numbering Convention
Field Name Description Value Value Description
ABB Line As per line number
As per PFD
- Delimiter
CCC Block Identifier 000 Place holders where device is not associated with a block
CB Conveying Block
CLD Core Loading Device
CLIB Charge Lock Inlet Block
CLOB Charge Lock Outlet Block
CUD Core Unloading Device
DLOB Discharge Lock Outlet Block
GRB Gas Return Block
GSB Gas Supply Block
IB Isolation Block
MB Measurement Block
SBA Sample Block
SSB Sphere Sensor Block
TUD Tank Unloading Device
- Delimiter
D Device Identifier A AMS or BUMS
B Buffer
C Collector
D Diverter
E Exchanger (Combined collector and diverter)
F Flow Transmitter
G Block Pitch Length
H Differential Pressure Transmitter
I Indexer
R FRI
P Pressure Transmitter
S Sphere Counter
T Temperature Transmitter
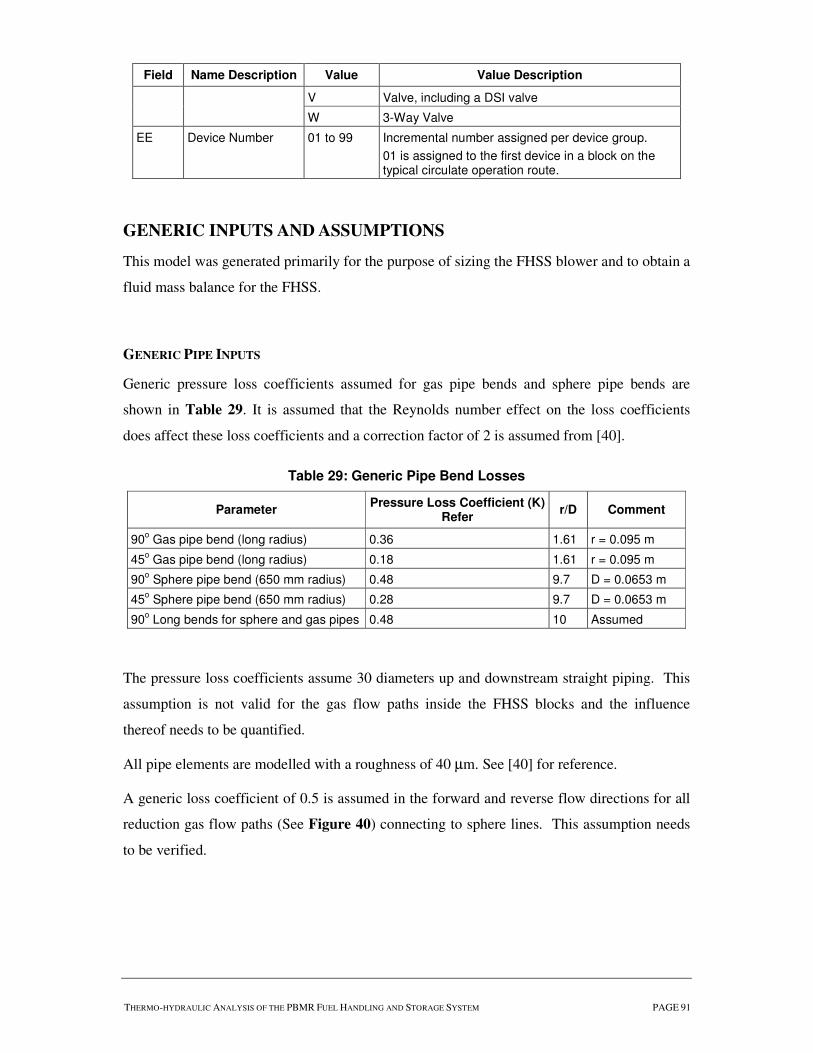
THERMO-HYDRAULIC ANALYSIS OF THE PBMR FUEL HANDLING AND STORAGE SYSTEM PAGE 91
Field Name Description Value Value Description
V Valve, including a DSI valve
W 3-Way Valve
EE Device Number 01 to 99 Incremental number assigned per device group.
01 is assigned to the first device in a block on the typical circulate operation route.
GENERIC INPUTS AND ASSUMPTIONS
This model was generated primarily for the purpose of sizing the FHSS blower and to obtain a
fluid mass balance for the FHSS.
GENERIC PIPE INPUTS
Generic pressure loss coefficients assumed for gas pipe bends and sphere pipe bends are
shown in Table 29. It is assumed that the Reynolds number effect on the loss coefficients
does affect these loss coefficients and a correction factor of 2 is assumed from [40].
Table 29: Generic Pipe Bend Losses
Parameter Pressure Loss Coefficient (K)
Refer r/D Comment
90o Gas pipe bend (long radius) 0.36 1.61 r = 0.095 m
45o Gas pipe bend (long radius) 0.18 1.61 r = 0.095 m
90o Sphere pipe bend (650 mm radius) 0.48 9.7 D = 0.0653 m
45o Sphere pipe bend (650 mm radius) 0.28 9.7 D = 0.0653 m
90o Long bends for sphere and gas pipes 0.48 10 Assumed
The pressure loss coefficients assume 30 diameters up and downstream straight piping. This
assumption is not valid for the gas flow paths inside the FHSS blocks and the influence
thereof needs to be quantified.
All pipe elements are modelled with a roughness of 40 µm. See [40] for reference.
A generic loss coefficient of 0.5 is assumed in the forward and reverse flow directions for all
reduction gas flow paths (See Figure 40) connecting to sphere lines. This assumption needs
to be verified.

THERMO-HYDRAULIC ANALYSIS OF THE PBMR FUEL HANDLING AND STORAGE SYSTEM PAGE 92
Figure 40: Reduction Gas Flow Path
A pressure loss coefficient of 1 is assumed for a dump loss and 0.5 for a sudden reduction in
diameter [39].
GENERIC JUNCTION LOSS FACTORS
Junctions are simplified by introducing secondary pressure loss coefficients. Although these
loss coefficients do not account for different main and branch flow ratios, it is a conservative
approach and simplifies the model. Table 30 presents the assumed loss coefficients for the
junctions. From [39] p.221 the same correction factor for Reynolds number effects used in
pipe bends can be used for junctions, hence the same strategy as described in 0 for Reynolds
number correction is used.
The pressure loss coefficients assumed for modelling junctions are conservative and need to
be updated for detailed analyses where more accurate losses are required.
Table 30: Implemented Junction Losses
Parameter Pressure Loss Coefficient (K)
Refer Area Ratio
90o Branch Loss 2.4 (p.232) 1
60o Branch Loss 1.4 (p.225) 1
120o Branch Loss 3.5 (p.227) 1
Straight Loss 0.8 (p.239) 1
HEAT TRANSFER TO AMBIENT ASSUMPTIONS
The model includes heat transfer to ambient through insulated piping. Elements not included
because of their insignificant influence on the system temperature are: process blocks, gravity
conveying sphere pipes and short gas pipes. Heat transfer for these elements can be included
in later versions of the model to accommodate temperature profile analyses.
Reduction

THERMO-HYDRAULIC ANALYSIS OF THE PBMR FUEL HANDLING AND STORAGE SYSTEM PAGE 93
The following assumptions were made about the insulation used:
Standard SA335 P1 steel is assumed for piping and pipe insulation property information was
obtained from [42].
Figure 41: Cross Section of Insulated Pipe
Figure 42: 3D Section of Insulated Pipe
Pipe: 7.5mm
Foil: 0.1mm
Insulation: 60 mm
Steel Sheet: 1mm

THERMO-HYDRAULIC ANALYSIS OF THE PBMR FUEL HANDLING AND STORAGE SYSTEM PAGE 94
Heat transfer parameters as shown in Table 31 were chosen such that heat loss from the
FHSS would be conservatively low.
Table 31: Generic values for insulated pipe elements.
Parameter Unit Value Reference:
Conductivity for Pipe with Insulation W/mK 0.1 -
Convection Coefficient for pipe outside wall W/m2K 0.5 Assumed
Ambient Temperature provided by HVAC °C 45 Assumed
The heat transfer from the outside of the pipes is assumed to comprise convection only, which
implies that heat radiation is neglected. All pipes are assumed to reside in HVAC conditions
and a convection coefficient of 0.5 W/m2 K is assumed.
Table 32 describes the elements with heat transfer to ambient. "Outside Area" is the outer
surface area of the element. Only one layer for each element has been specified. For pipes
with insulation, the different layer properties have been combined to simplify the model.
Table 32: Elements presented with Heat Transfer to Ambient
Number Description Length
[m]
Wall Thickness
[m]
Inner Diameter
[m]
Outside Area [m
2]
Insulation
2002 He06 66.7 0.06701 0.05898 40.442 yes
2012 He14 10.9 0.06701 0.05898 6.609 yes
2020 CL12 51.1 0.06455 0.01 22.330 yes
2028 He13 12.8 0.06701 0.05898 7.761 yes
2032 L03b 46.1 0.0675 0.067 29.255 yes
2034 L01b 46.1 0.0675 0.067 29.255 yes
2042 He05 66.1 0.06701 0.05898 40.078 yes
2048 L08b+L08a+L24+TD+SRP1+SUP1 65.3 0.0675 0.067 41.439 yes
2050 CO05 63.8 0.06701 0.05898 38.684 yes
2052 CO11 28.6 0.06701 0.05898 17.341 yes
2054 CO07 63.8 0.06701 0.05898 38.684 yes
2056 CO09 63.7 0.06701 0.05898 38.623 yes
2064 CL08 12.5 0.06701 0.05898 7.579 yes
2066 CO03 11.9 0.06701 0.05898 7.215 yes
2076 L01a 11.8 0.0675 0.067 7.488 yes
2080 CO06 51.3 0.06701 0.05898 31.105 yes
2086 L02a 12.3 0.0675 0.067 7.806 yes
2088 L17a+L17b+L17c+L23+TD+SLP2 12.2 0.0675 0.067 7.742 yes
2090 CL13 15.1 0.06455 0.01 6.599 yes
2092 CL10 51.1 0.06455 0.01 22.330 yes
2098 CO14 67.5 0.06701 0.05898 40.927 yes

THERMO-HYDRAULIC ANALYSIS OF THE PBMR FUEL HANDLING AND STORAGE SYSTEM PAGE 95
Number Description Length
[m]
Wall Thickness
[m]
Inner Diameter
[m]
Outside Area [m
2]
Insulation
2100 CO19+CO19/5 32.5 0.06701 0.05898 19.706 yes
2120 CO20 47.9 0.06701 0.05898 29.043 yes
2128 He11a 14.7 0.06701 0.05898 8.913 yes
2130 CO16 67.7 0.06701 0.05898 41.048 yes
2132 CO12 28.4 0.06701 0.05898 17.220 yes
2134 CO18 67.8 0.06701 0.05898 41.109 yes
2140 CL09 15.8 0.06701 0.05898 9.580 yes
2154 CL11 51.1 0.06455 0.01 22.330 yes
2156 CO10 28.9 0.06701 0.05898 17.523 yes
2160 L16a+L16b+L16c+L22+TD+SLP1 11.8 0.0675 0.067 7.488 yes
2162 L03a 13.1 0.0675 0.067 8.313 yes
2174 L18/12+L18i+L18b+L18a+SLP 12.7 0.0675 0.067 8.059 yes
2180 L03d+L03e 12.2 0.0675 0.067 7.742 yes
2190 L55 13.3 0.0675 0.067 8.440 yes
2192 L02b 46.2 0.0675 0.067 29.319 yes
2206 CL07 11.6 0.06701 0.05898 7.033 yes
2208 L57 10.7 0.0675 0.067 6.790 yes
2210 CO02 14.6 0.06701 0.05898 8.852 yes
2216 CO21+CO24 46.3 0.06701 0.05898 28.073 yes
2230 CL15 15.1 0.06455 0.01 6.599 yes
2232 L56 10.5 0.0675 0.067 6.663 yes
2234 L02d+L02e 15.2 0.0675 0.067 9.646 yes
2236 CL14 15.1 0.06455 0.01 6.599 yes
2238 CO01 15.1 0.06701 0.05898 9.156 yes
2246 L10d+L13 12.6 0.0675 0.067 7.996 yes
2260 CO15 55.3 0.06701 0.05898 33.530 yes
2262 L19/6+L19j+L19b+L19a+SLP 12.5 0.0675 0.067 7.933 yes
2268 He16 11.8 0.06701 0.05898 7.155 yes
2276 L29/5+L30a+L30b+L30c+L30e+L19a +L29e+L29m+L29n+SRP+SUP
37.4 0.0675 0.067 23.734 yes
2278 He07b 16.7 0.06701 0.05898 10.126 yes
2282 CO13 55.6 0.06701 0.05898 33.712 yes
2284 CO17 54.9 0.06701 0.05898 33.287 yes
2292 L09b+L09a+L25+TD+SRP3+SUP3 65.8 0.0675 0.067 41.757 yes
2294 CO04 51.4 0.06701 0.05898 31.165 yes
2306 He15 13.8 0.06701 0.05898 8.367 yes
2312 L10b+L10a+L28/11+L28e+L28l +L28m+SRP2+SUP2
67.3 0.0675 0.067 42.709 yes
2553 He07a 50.0 0.06455 0.0243 24.096 yes
2594 CO32/6 19.2 0.06701 0.05898 11.641 yes
2628 CO32/12 21.1 0.06701 0.05898 12.794 yes
2630 CO08 51.1 0.06701 0.05898 30.983 yes
THERMO-HYDRAULIC ANALYSIS OF THE PBMR FUEL HANDLING AND STORAGE SYSTEM PAGE 96
COMPONENT ASSUMPTIONS
FHSS VENTURI
The venturi used in the FHSS for flow measurement is described in [37]. This venturi is
currently based on the ATL venturi since no better information is available.
FHSS FILTER
The primary filter used in the FHSS is described in [7]. This filter is based on conceptual
design information and was characterised for the FHSS Flownex model as described in [7].
The document referenced in [7] is not yet an approved document but is regarded as
sufficiently accurate for blower sizing and gas mass balance calculations since the filter
pressure loss is a very small portion of the total system resistance.
FHSS BLOWER NON-RETURN VALVE
This valve is situated in the gas line connecting the blower to the gas supply manifold.
Physically the valve might form part of the gas supply block assembly. The valve is not
modelled in this version of the model due to a lack of information, but is represented through
a pipe element with a restriction in the gas supply manifold.
The restriction is modelled as follows:
A pressure loss coefficient of 50 is added to the first pitch of the gas supply block assembly.
This will cause a pressure drop of ±1.5 kPa when 0.719 kg/s helium gas (approximately the
required gas flow rate to lift one sphere at 2 m/s in three lift lines at 9MPa) flow through the
pipe section.
The valve was modelled using the check valve option in Flownex in order to simulate the
closing of the valve for reverse flow. Although this is not the ideal approach for simulating
the non-return valve, it is nevertheless regarded as an acceptable first attempt to simulate the
valve in the absence of more accurate valve characteristic information.
FHSS HEAT EXCHANGER
The FHSS heat exchanger is located in the blower bypass line and is modelled as a pipe
element with a fixed exit temperature, for the time being until more detailed information
becomes available. This assumption can be justified if it is assumed that the heat exchanger
pressure loss will never exceed the circuit pressure loss, which is a reasonable assumption if
only a small amount of bypass flow is required. The constant exit temperature can be justified
if it is assumed that the heat exchanger has sufficient capacity to remove the required heat at
all times. This is not a realistic assumption and needs to be verified.

THERMO-HYDRAULIC ANALYSIS OF THE PBMR FUEL HANDLING AND STORAGE SYSTEM PAGE 97
The following assumed characteristics are applicable:
Table 33: Heat Exchanger Input Parameters (element 2320)
Parameter Unit Value Comments
Diameter m 0.6 Assumed
Length m 0.1 Assumed
Secondary Loss Coefficient - 1.5 Assumed
Exit Temperature °C 50 Assumed 15 °C higher than the worst specified coolant temperature. See [52].
With the inputs as in Table 33, the heat exchanger pressure drop for the 9MPa operating
pressure case is presented in Figure 43.
The characteristic shown in Figure 43 is only an assumption and needs to be verified.
FHSS Heat Exchanger Differential Pressure @ 9MPa Helium
0
0.1
0.2
0.3
0.4
0.5
0.6
0.7
0.8
0.9
1
0 0.2 0.4 0.6 0.8 1 1.2
Mass Flow Rate [kg/s]
Dif
fere
nti
al
Pre
ss
ure
[k
Pa
]
Figure 43: FHSS Heat Exchanger Characteristic
FHSS FLOW RESTRICTING INDEXER
The purpose of the FRI in the FHSS is to index spheres without allowing a full flow gas flow
path. Only a small gas leak flow path exits which is modelled in Flownex and described in
this section. Figure 44 shows a picture of the FRI with labyrinths to restrict the leak flow.

THERMO-HYDRAULIC ANALYSIS OF THE PBMR FUEL HANDLING AND STORAGE SYSTEM PAGE 98
Labyrinth Seals Smooth Centre line to prevent filing Dust Pocket Stop for accurate positioning
Figure 44: View of the FRI Head
The flow restricting indexers (FRI) used in the FHSS are modelled using user specified
elements. The characteristic curve of the FRI is shown in Figure 45. No valid reference for
the characteristic, which was obtained from THTR literature, is available and the data should
therefore be verified. The proposed FRI design for the PBMR FHSS differs from the THTR
design and should be characterised for implementation in Flownex to increase the credibility
of the thermo-hydraulic model. This valve is expected to have a significant impact on the
FHSS performance. The characteristic for helium and air can be found in [52].

THERMO-HYDRAULIC ANALYSIS OF THE PBMR FUEL HANDLING AND STORAGE SYSTEM PAGE 99
FHSS FRI Assumed characteristic for Helium
0.995
1
1.005
1.01
1.015
1.02
1.025
1.03
1.035
0 0.0005 0.001 0.0015 0.002 0.0025 0.003 0.0035 0.004 0.0045
Corrected Mass Flow Rate [kg/s·sqrt(K)/(100·kPa)
Pre
ss
ure
Ra
tio
[P
02/P
01]
Figure 45: FHSS FRI Characteristic for Helium
The characteristic curve of the FRI for use in air, as shown in Figure 46, was obtained by
multiplying the characteristic for use in helium with the gas constant ratio of helium and air.
This is necessary since the corrected mass flow rate characteristic does not account for
different fluids.
Constant Gas FluidR
RateFlow Mass Correctedc
m
with
airR
HeR
Hec,m
airc,m
=
=
⋅=
&
&&
The use of this correlation for fluid scaling of the FRI characteristic curve needs to be
verified.

THERMO-HYDRAULIC ANALYSIS OF THE PBMR FUEL HANDLING AND STORAGE SYSTEM PAGE 100
FHSS FRI Assumed characteristic for Air
0.995
1
1.005
1.01
1.015
1.02
1.025
1.03
1.035
0 0.002 0.004 0.006 0.008 0.01 0.012
Corrected Mass Flow Rate [kg/s·sqrt(K)/(100·kPa)
Pre
ss
ure
Ra
tio
[P
02/P
01]
Figure 46: FHSS FRI Characteristic for Air
FHSS THREE WAY VALVE
The three-way valve in the FHSS is modelled using the same pressure loss characteristic as
that used for the FRI discussed in 0, but with 20% more flow at the same pressure ratio. The
20% added to the flow rate is to account for the differences in geometry to that of the FRI.
No formal reference for adding 20% is available and this is only an assumption, which needs
to be verified.
The three way valve is modelled using five elements. Three of the elements represent the leak
flow paths while two elements represent the full flow path if the valve is open.
FHSS DIVERTER
The diverter in the FHSS is modelled using the same pressure loss characteristic philosophy
as described in 0 for the three way valve, hence the same characteristic curve is used than that
used for the three way valve.
This characteristic is applicable to the restricted gas flow path in the diverter. For the free
flow path of the diverter or the path conveying spheres, a gas flow pressure loss coefficient of:
K=0.28 is used for a diverting path (ref. 0 for 45o bend) and
K=0.01 is used for a straight through path (assumed).

THERMO-HYDRAULIC ANALYSIS OF THE PBMR FUEL HANDLING AND STORAGE SYSTEM PAGE 101
FHSS GAS FLOW VALVES
The FHSS makes use of various gas valves to control, isolate and divert gas inside the FHSS.
At present, no valve characteristic information is available for any of the valves to be used in
the FHSS and the following assumptions were made for modelling purposes:
a. The three-way valve is discussed in 0.
b. The Double Seat Isolation (DSI) valves used to isolate the FHSS from the MPS are
assumed to have the same flow characteristics than that of a ball valve. These valves are
modelled as valve elements in Flownex using the experimentally derived characteristic
curve of the FHSS ATL ball valve. It is assumed that the valve characteristics will not
have a significant impact on operating modes where the valve is fully open or fully
closed, because of the low flow resistance of the valve. For the analysis of transient
events where the valve closes in a finite period during the transient, the assumed
characteristic needs to be verified.
c. Trim valves, isolation valves and flow control valves are all modelled in Flownex as
valve elements with a valve characteristic curve. This characteristic curve described in
[52] is obtained from a CFD analysis compiled on a THTR designed needle and seat
valve.
The xT values assumed for these valves are 0.7. No valid reference exists for this
assumption and this needs to be verified.
FHSS BLOWER
The FHSS blower will be described in [53]. No blower is currently available. The purpose of
the model described in this document is to size the FHSS blower. To achieve this, the blower
is modelled using a pipe element. The pipe element used to model the blower is described in
section 0 and is used by specifying a mass flow rate through the pipe with an assumed heat
input to the transported fluid. The results will be a pressure rise over the pipe element and an
exit temperature.
TANK UNLOADING DEVICE
The tank unloading device (TUD) unloading spheres from the used fuel storage tank (and the
graphite storage tank) is thermo-hydraulically connected to the sphere conveying lines. This
causes a shortcut for the gas flow from one sphere lifting line to the other. The TUD is
designed to minimise this cross flow by implementing very small gas flow paths. These small
flow paths are modelled in Flownex using pipe elements with small flow areas. No reference
exists for the flow path geometry and the geometry should be verified.

THERMO-HYDRAULIC ANALYSIS OF THE PBMR FUEL HANDLING AND STORAGE SYSTEM PAGE 102
Table 34: Elements Representing the TUD
Number Description Circumference
[m] Area [m
2]
Length [m]
2110 L24-TUD-Flow_Restriction 0.606 0.0006 0.3
2314 L25-TUD-Flow_Restriction 0.606 0.0006 0.3
2316 L28/11-TUD-Flow_Restriction 0.606 0.0006 0.3
GENERAL ASSUMPTIONS
In modelling the FHSS the following general assumptions were made:
a. All gas piping is assumed 2½" NB schedule 80 piping, which results in a pipe with a 59
mm inner diameter. The reasoning behind this assumption is that in order to prevent dust
settling in gas pipes, the gas velocity needs to be at least as high or higher than the
velocity needed to clean the sphere piping. Thus, the gas pipe diameter should be equal or
smaller than the sphere pipe diameter. To reduce the pressure drop through gas piping,
the gas pipe diameter should in turn be as large as possible. With this taken into account,
the 2½" NB schedule 80 pipe is the closest standard pipe to the sphere pipe with a 65.3
mm hydraulic diameter, with regards to hydraulic diameter.
b. The gas supply block assembly main gas flow path, gas return block assembly main gas
flow path and the piping preceding and following the FHSS filter and blower are assumed
to be 0.194m ID. This corresponds to 8" NB schedule 80 piping. The 0.194m ID pipe
contradicts the philosophy described in (a) above and needs to be investigated.
c. All gas paths in blocks are assumed bored to a 0.065m diameter. All bored gas paths
connecting onto sphere lines are reduced to a 0.043m diameter at the point where it
connects to the sphere line.
d. Sphere conveying lines inside blocks are assumed to be round (not ribbed) with a
diameter of 0.065m.
e. The model boundary nodes are:
The MPS manifold – the FHSS is connected to the high pressure compressor outlet (node
nr. 78)
The void above the reactor core (node nr. 98)
The reactor defueling chute (node nr. 2)
The RSS gas supply and return lines (node nr. 2535 and 2537)
Used fuel storage tank assembly (node nr. 2449)
Graphite storage tank assembly (node nr. 2095)
AGS for the dust extraction lines (node nr. 2277)
Note that the gas supply and return lines to and from the RSS are not modelled. The
FHSS boundaries to the RSS are modelled as the isolation valves at the FHSS heat
exchanger and the mixing chamber.
The FRI dust pocket cleaning lines situated in the conveying block unit beneath the reactor
THERMO-HYDRAULIC ANALYSIS OF THE PBMR FUEL HANDLING AND STORAGE SYSTEM PAGE 103
are modelled such that these lines do not return to the GRBA but to a system thermo-
hydraulically independent from the FHSS. This system is modelled by use of a node.
The reason for this modelling approach is to be able to obtain a higher negative pressure
in relation to the gas return block assembly, using the node as a mass sink.
Pipe lengths do not include block pitches although the pipes are modelled to run to the first
gas flow obstruction or junction in a block. Pipe elements may sometimes include loss
factors for bends inside a block.
The FHSS Spent-fuel Storage System (SFSS) can have physically different layouts for
different modes of operation. This model is created to accommodate the refuelling
operating mode and redistribution of spent-fuel from spent-fuel tank 5 to 6. Since the
layout for refuelling does not differ much thermo-hydraulically from the defueling
operating mode, only modelling the refuelling mode will not have a significant impact on
blower analyses. For component specific or very detailed analyses, the model might have
to be updated to accommodate for all operating modes.
In the Discharge Lock Outlet Block (DLOB), diverters and collectors connect the three
different sphere lines. Since the system is designed to have no significant gas flow inside
these lines that cause pressure differences between the lines, the leak flow paths between
these lines are not modelled. This is an effort to keep the model as simple yet
comprehensive as possible.
Ribbed sphere conveying pipes are modelled using the cross flow area and the inner
circumference from which Flownex calculates a hydraulic diameter.
Note that for sphere conveying calculations the hydraulic diameter will not provide the
correct gas flow velocity, to simulate sphere conveying if the pipe is ribbed.
Heat transfer is assumed as discussed in section 0. It is assumed that the HVAC system can
remove all the heat dissipated by the FHSS piping.
Secondary pressure loss coefficients for pipes assume low Reynolds number flow conditions
at all times.
The height of pipes is not included in the model and although this is not foreseen to have a
significant impact on foreseen analyses, the effect of this assumption needs to be
quantified.
Only one indexer was modelled with a flow restriction. The indexer holding the sphere for
burn-up measurement was modelled for the three measurement blocks. The pressure
loss coefficient assumed for this indexer is K=0.1.
Note: The gas flow through this indexer is to be verified and has to be a magnitude that
will keep the sphere stable in the indexer without movement, so that the burn-up
measurement is not influenced.
Element Numbering: Dust pocket cleaning lines are currently not numbered on the FHSS
PFD [33]. Numbers assumed for modelling are:
i. CL10 for L55-IB-R01 pocket cleaning
ii. CL11 for L56-IB-R01 pocket cleaning
iii. CL12 for L57-IB-R01 pocket cleaning

THERMO-HYDRAULIC ANALYSIS OF THE PBMR FUEL HANDLING AND STORAGE SYSTEM PAGE 104
iv. CL13 for L01-CB-R01 pocket cleaning
v. CL14 for L03-CB-R01 pocket cleaning
vi. CL15 for L02-CB-R01 pocket cleaning

THERMO-HYDRAULIC ANALYSIS OF THE PBMR FUEL HANDLING AND STORAGE SYSTEM PAGE 105
DETAILED ELEMENTS DESCRIPTION
In this section, all Flownex elements will be described in detail. The section is divided into smaller sections describing functional and physical
identical elements.
GAS FLOW VALVE ELEMENTS
This section describes the Flownex elements used as valve elements. All valves are modelled as control valves with loss coefficients (Flownex
Type CLC).
No. Description Valve Diameter
[m] Fraction Open
[/]
Pipe Inlet Diameter
[m]
Pipe Outlet Diameter
[m]
xT Forward
[/]
xT Backward
[/] Valve Chart
2518 He07-GRB-V01 0.065 0 0.065 0.065 1E+30 1E+30 ATL Ball Valve_2004-03-10.vl2
2526 He12-GRB-V01 0.065 0 0.065 0.065 1E+30 1E+30 ATL Ball Valve_2004-03-10.vl2
2554 He10-GSB-V01 0.065 0 0.065 0.065 1E+30 1E+30 ATL Ball Valve_2004-03-10.vl2
2690 L01-CUD-V01 0.065 1 0.065 0.065 1E+30 1E+30 ATL Ball Valve_2004-03-10.vl2
2692 L03-CUD-V01 0.065 1 0.065 0.065 1E+30 1E+30 ATL Ball Valve_2004-03-10.vl2
2694 L02-CUD-V01 0.065 1 0.065 0.065 1E+30 1E+30 ATL Ball Valve_2004-03-10.vl2
2696 L55-IB-V01 0.065 1 0.065 0.065 1E+30 1E+30 ATL Ball Valve_2004-03-10.vl2
2698 L56-IB-V01 0.065 1 0.065 0.065 1E+30 1E+30 ATL Ball Valve_2004-03-10.vl2
2700 L57-IB-V01 0.065 1 0.065 0.065 1E+30 1E+30 ATL Ball Valve_2004-03-10.vl2
2186 CL11-000-V01 0.065 0 0.065 0.065 0.7 0.7 FHSS German Trim Valve Rev B
2512 CO02-GSB-V01 0.065 0.34 0.065 0.065 0.7 0.7 FHSS German Trim Valve Rev B
2514 CO13-GRB-V01 0.065 0.9 0.065 0.065 0.7 0.7 FHSS German Trim Valve Rev B
2516 CO21-GRB-V01 0.065 0 0.065 0.065 0.7 0.7 FHSS German Trim Valve Rev B
2520 CO06-GRB-V01 0.065 0.9 0.065 0.065 0.7 0.7 FHSS German Trim Valve Rev B
2522 CL12-000-V01 0.065 0 0.065 0.065 0.7 0.7 FHSS German Trim Valve Rev B

THERMO-HYDRAULIC ANALYSIS OF THE PBMR FUEL HANDLING AND STORAGE SYSTEM PAGE 106
No. Description Valve Diameter
[m] Fraction Open
[/]
Pipe Inlet Diameter
[m]
Pipe Outlet Diameter
[m]
xT Forward
[/]
xT Backward
[/] Valve Chart
2524 CO04-GRB-V01 0.065 0.9 0.065 0.065 0.7 0.7 FHSS German Trim Valve Rev B
2528 CO17-GRB-V01 0.065 0.9 0.065 0.065 0.7 0.7 FHSS German Trim Valve Rev B
2534 CO03-GSB-V01 0.065 0.34 0.065 0.065 0.7 0.7 FHSS German Trim Valve Rev B
2536 CO05-GSB-V01 0.065 0.027 0.065 0.065 0.7 0.7 FHSS German Trim Valve Rev B
2538 CO15-GRB-V01 0.065 0.9 0.065 0.065 0.7 0.7 FHSS German Trim Valve Rev B
2540 CO18-GSB-V01 0.065 0.022 0.065 0.065 0.7 0.7 FHSS German Trim Valve Rev B
2542 CO07-GSB-V01 0.065 0.032 0.065 0.065 0.7 0.7 FHSS German Trim Valve Rev B
2544 CO20-GSB-V01 0.065 0 0.065 0.065 0.7 0.7 FHSS German Trim Valve Rev B
2546 CO01-GSB-V01 0.065 0.29 0.065 0.065 0.7 0.7 FHSS German Trim Valve Rev B
2548 CO14-GSB-V01 0.065 0.0146 0.065 0.065 0.7 0.7 FHSS German Trim Valve Rev B
2550 CO12-GSB-V01 0.065 0.9 0.065 0.065 0.7 0.7 FHSS German Trim Valve Rev B
2552 CO11-GSB-V01 0.065 0.9 0.065 0.065 0.7 0.7 FHSS German Trim Valve Rev B
2555 He07A-000-V01 0.065 0 0.065 0.065 0.7 0.7 FHSS German Trim Valve Rev B
2556 CO10-GSB-V01 0.065 0.9 0.065 0.065 0.7 0.7 FHSS German Trim Valve Rev B
2558 He11-000-V01 0.065 0 0.065 0.065 0.7 0.7 FHSS German Trim Valve Rev B
2560 CO19-GSB-V01 0.065 0 0.065 0.065 0.7 0.7 FHSS German Trim Valve Rev B
2562 CO09-GSB-V01 0.065 0.034 0.065 0.065 0.7 0.7 FHSS German Trim Valve Rev B
2564 He03-GSB-V01 0.065 0 0.065 0.065 0.7 0.7 FHSS German Trim Valve Rev B
2566 CO16-GSB-V01 0.065 0.0179 0.065 0.065 0.7 0.7 FHSS German Trim Valve Rev B
2568 CL02-CUD-V01 0.065 0 0.065 0.065 0.7 0.7 FHSS German Trim Valve Rev B
2570 CL03-CUD-V01 0.065 0 0.065 0.065 0.7 0.7 FHSS German Trim Valve Rev B
2572 CL01-CUD-V01 0.065 0 0.065 0.065 0.7 0.7 FHSS German Trim Valve Rev B
2574 L02-CB-V01 0.065 0 0.065 0.065 0.7 0.7 FHSS German Trim Valve Rev B
2576 L03-CB-V01 0.065 0 0.065 0.065 0.7 0.7 FHSS German Trim Valve Rev B
2578 L02-CB-V01 0.065 0 0.065 0.065 0.7 0.7 FHSS German Trim Valve Rev B
2580 L55-IB-V01 0.065 0 0.065 0.065 0.7 0.7 FHSS German Trim Valve Rev B

THERMO-HYDRAULIC ANALYSIS OF THE PBMR FUEL HANDLING AND STORAGE SYSTEM PAGE 107
No. Description Valve Diameter
[m] Fraction Open
[/]
Pipe Inlet Diameter
[m]
Pipe Outlet Diameter
[m]
xT Forward
[/]
xT Backward
[/] Valve Chart
2582 L56-IB-V01 0.065 0 0.065 0.065 0.7 0.7 FHSS German Trim Valve Rev B
2584 L57-IB-V01 0.065 0 0.065 0.065 0.7 0.7 FHSS German Trim Valve Rev B
2586 CL10-000-V01 0.065 0 0.065 0.065 0.7 0.7 FHSS German Trim Valve Rev B
2638 He04-GRB-V01 0.065 0 0.065 0.065 0.7 0.7 FHSS German Trim Valve Rev B
2640 CO08-GRB-V01 0.065 0.9 0.065 0.065 0.7 0.7 FHSS German Trim Valve Rev B
2702 He09-000-V01 0.065 0 0.065 0.065 0.7 0.7 FHSS German Trim Valve Rev B
2704 He17-000-V01 0.065 0 0.065 0.065 0.7 0.7 FHSS German Trim Valve Rev B

THERMO-HYDRAULIC ANALYSIS OF THE PBMR FUEL HANDLING AND STORAGE SYSTEM PAGE 108
VENTURI ELEMENTS
This section describes the elements used to model the FHSS venturis
No Description Chart
2382 CO01-000-F01 fhss_venturi_he_rev1.usp
2384 CO17-000-F01 fhss_venturi_he_rev1.usp
2386 CO02-000-F01 fhss_venturi_he_rev1.usp
2388 CO18-000-F01 fhss_venturi_he_rev1.usp
2392 He03-000-F01 fhss_venturi_he_rev1.usp
2396 CO21-000-F01 fhss_venturi_he_rev1.usp
2400 CO04-000-F01 fhss_venturi_he_rev1.usp
2402 He12-000-F01 fhss_venturi_he_rev1.usp
2406 CO12-000-F01 fhss_venturi_he_rev1.usp
2410 He10-000-F01 fhss_venturi_he_rev1.usp
2412 CO14-000-F01 fhss_venturi_he_rev1.usp
2414 CO20-000-F01 fhss_venturi_he_rev1.usp
2420 CO06-000-F01 fhss_venturi_he_rev1.usp
2422 CO16-000-F01 fhss_venturi_he_rev1.usp
2460 CO03-000-F01 fhss_venturi_he_rev1.usp
2462 He07-000-F01 fhss_venturi_he_rev1.usp
2480 CO11-000-F01 fhss_venturi_he_rev1.usp
2482 CO05-000-F01 fhss_venturi_he_rev1.usp
2484 CO09-000-F01 fhss_venturi_he_rev1.usp
2490 CO10-000-F01 fhss_venturi_he_rev1.usp
2498 CO13-000-F01 fhss_venturi_he_rev1.usp
2500 CO15-000-F01 fhss_venturi_he_rev1.usp
2502 CO07-000-F01 fhss_venturi_he_rev1.usp
2504 CO19-000-F01 fhss_venturi_he_rev1.usp
2632 CO08-000-F01 fhss_venturi_he_rev1.usp
2642 He04-000-F01 fhss_venturi_he_rev1.usp

THERMO-HYDRAULIC ANALYSIS OF THE PBMR FUEL HANDLING AND STORAGE SYSTEM PAGE 109
THREE WAY VALVE AND DIVERTER ELEMENTS
This section describes the elements used to model the three way valves and diverter leak flow
paths.
No. Description Chart
2374 L11 to L55 (Restricted) 3_way_valve_v00.usp
2376 L12 to L56 (Restricted) 3_way_valve_v00.usp
2378 L13 to L57 (Restricted) 3_way_valve_v00.usp
2394 CL06-MB-W01 (LP to CL06 Leak) 3_way_valve_v00.usp
2408 L02 to L57 (Restricted) 3_way_valve_v00.usp
2418 L03e to L56 (Restricted) 3_way_valve_v00.usp
2424 CL02-CLB-W01 (HP to CL02 Leak) 3_way_valve_v00.usp
2426 CL06-MB-W01 (HP to CL06 Leak) 3_way_valve_v00.usp
2428 CL01-CLB-W01 (HP to LP Leak) 3_way_valve_v00.usp
2430 CL01-CLB-W01 (HP to CL01 Leak) 3_way_valve_v00.usp
2432 CL01-CLB-W01 (LP to CL01 Leak) 3_way_valve_v00.usp
2434 CL05-MB-W01 (HP to LP Leak) 3_way_valve_v00.usp
2436 CL05-MB-W01 (HP to CL05 Leak) 3_way_valve_v00.usp
2438 CL05-MB-W01 (LP to CL05 Leak) 3_way_valve_v00.usp
2440 CL02-CLB-W01 (HP to LP Leak) 3_way_valve_v00.usp
2442 L01e to L55 (Restricted) 3_way_valve_v00.usp
2446 CL03-CLB-W01 (LP to CL03 Leak) 3_way_valve_v00.usp
2448 CL02-CLB-W01 (LP to CL02 Leak) 3_way_valve_v00.usp
2450 CL04-MB-W01 (HP to LP Leak) 3_way_valve_v00.usp
2452 CL04-MB-W01 (HP to CL04 Leak) 3_way_valve_v00.usp
2454 CL04-MB-W01 (LP to CL04 Leak) 3_way_valve_v00.usp
2456 CL03-CLB-W01 (HP to LP Leak) 3_way_valve_v00.usp
2458 CL03-CLB-W01 (HP to CL03 Leak) 3_way_valve_v00.usp
2464 CL06-MB-W01 (HP to LP Leak) 3_way_valve_v00.usp
2468 L03e to L05 (Restricted) 3_way_valve_v00.usp
2472 CL07-MB-W01 (HP to LP Leak) 3_way_valve_v00.usp
2474 CL07-MB-W01 (HP to CL07 Leak) 3_way_valve_v00.usp
2476 L01e to L04 (Restricted) 3_way_valve_v00.usp
2478 L02e to L06 (Restricted) 3_way_valve_v00.usp
2486 CL08-MB-W01 (HP to LP Leak) 3_way_valve_v00.usp
2488 CL08-MB-W01 (HP to CL08 Leak) 3_way_valve_v00.usp
2494 CL07-MB-W01 (LP to CL07 Leak) 3_way_valve_v00.usp
2496 CL08-MB-W01 (LP to CL08 Leak) 3_way_valve_v00.usp
2506 CL09-MB-W01 (LP to CL09 Leak) 3_way_valve_v00.usp
2508 CL09-MB-W01 (HP to CL09 Leak) 3_way_valve_v00.usp
2510 CL09-MB-W01 (HP to LP Leak) 3_way_valve_v00.usp

THERMO-HYDRAULIC ANALYSIS OF THE PBMR FUEL HANDLING AND STORAGE SYSTEM PAGE 110
FLOW RESTRICTING INDEXER ELEMENTS
This section describes the elements used to model the flow restricting indexers.
No. Description Chart
2390 L57-IB-R01 Drucksperr.usp
2398 L56-IB-R01 Drucksperr.usp
2404 L02-CB-R01 Drucksperr.usp
2416 L55-IB-R01 Drucksperr.usp
2444 L01-CB-R01 Drucksperr.usp
2466 L03-CB-R01 Drucksperr.usp

THERMO-HYDRAULIC ANALYSIS OF THE PBMR FUEL HANDLING AND STORAGE SYSTEM PAGE 111
GSBA AND GRBA
This section describes the elements making up the GSBA and GRBA internal gas flow paths.
No. Description Length
[m] Diameter
[m]
Mass Flow Rate
"NS"=Not Specified
[kg/s]
Loss Coefficient = 90
o x 0.36 + 45
o x 0.18 + Sharp x 2.4 + Other (ref. 0 and 0)
Kfw Kbw 90o 45
o Sharp Other Fw Other Bw Comments
2338 CO04-GRB-V01 (to He19) 0.06 0.065 NS 2.4 2.4 0 0 1 0.0 0.0
2336 CO06-GRB-V01 (to He19) 0.06 0.065 NS 2.4 2.4 0 0 1 0.0 0.0
2644 CO08-GRB-V01 (to He19) 0.06 0.065 NS 2.4 2.4 0 0 1 0.0 0.0
2344 CO13-GRB-V01 (to He19) 0.06 0.065 NS 2.4 2.4 0 0 1 0.0 0.0
2342 CO15-GRB-V01 (to He19) 0.06 0.065 NS 2.4 2.4 0 0 1 0.0 0.0
2340 CO17-GRB-V01 (to He19) 0.06 0.065 NS 2.4 2.4 0 0 1 0.0 0.0
2368 CO21-GRB-V01 (to He19) 0.06 0.065 NS 2.4 2.4 0 0 1 0.0 0.0
2636 He04-GRB-V01 (to He19) 0.06 0.065 NS 2.4 2.4 0 0 1 0.0 0.0
2370 He07-GRB-V01 (to He19) 0.06 0.065 NS 2.4 2.4 0 0 1 0.0 0.0
2366 He12-GRB-V01 (to He19) 0.06 0.065 NS 2.4 2.4 0 0 1 0.0 0.0
2200 He19-GRB-G01 0.16 0.194 NS 0.8 0.8 0 0 0 0.8 0.8 Straight junction loss
2240 He19-GRB-G02 0.32 0.194 NS 0.8 0.8 0 0 0 0.8 0.8 Straight junction loss
2184 He19-GRB-G03 0.32 0.194 NS 0.8 0.8 0 0 0 0.8 0.8 Straight junction loss
2188 He19-GRB-G04 0.32 0.194 NS 0.8 0.8 0 0 0 0.8 0.8 Straight junction loss
2196 He19-GRB-G05 0.32 0.194 NS 0.8 0.8 0 0 0 0.8 0.8 Straight junction loss
2222 He19-GRB-G06 0.32 0.194 NS 0.8 0.8 0 0 0 0.8 0.8 Straight junction loss
2646 He19-GRB-G07 0.32 0.194 NS 0.8 0.8 0 0 0 0.8 0.8 Straight junction loss
2592 He19-GRB-G08 0.32 0.194 NS 0.8 0.8 0 0 0 0.8 0.8 Straight junction loss
2590 He19-GRB-G09 0.32 0.194 NS 0.8 0.8 0 0 0 0.8 0.8 Straight junction loss

THERMO-HYDRAULIC ANALYSIS OF THE PBMR FUEL HANDLING AND STORAGE SYSTEM PAGE 112
No. Description Length
[m] Diameter
[m]
Mass Flow Rate
"NS"=Not Specified
[kg/s]
Loss Coefficient = 90
o x 0.36 + 45
o x 0.18 + Sharp x 2.4 + Other (ref. 0 and 0)
Kfw Kbw 90o 45
o Sharp Other Fw Other Bw Comments
2358 CO01-GSB-V01 (to He01) 0.06 0.065 NS 2.4 2.4 0 0 1 0.0 0.0
2360 CO02-GSB-V01 (to He01) 0.06 0.065 NS 2.4 2.4 0 0 1 0.0 0.0
2220 CO03-GSB-V01 (to He01) 0.06 0.065 NS 2.4 2.4 0 0 1 0.0 0.0
2352 CO05-GSB-V01 (to He01) 0.06 0.065 NS 2.4 2.4 0 0 1 0.0 0.0
2354 CO07-GSB-V01 (to He01) 0.06 0.065 NS 2.4 2.4 0 0 1 0.0 0.0
2356 CO09-GSB-V01 (to He01) 0.06 0.065 NS 2.4 2.4 0 0 1 0.0 0.0
2326 CO10-GSB-V01 (to He01) 0.06 0.065 NS 2.4 2.4 0 0 1 0.0 0.0
2328 CO11-GSB-V01 (to He01) 0.06 0.065 NS 2.4 2.4 0 0 1 0.0 0.0
2330 CO12-GSB-V01 (to He01) 0.06 0.065 NS 2.4 2.4 0 0 1 0.0 0.0
2346 CO14-GSB-V01 (to He01) 0.06 0.065 NS 2.4 2.4 0 0 1 0.0 0.0
2348 CO16-GSB-V01 (to He01) 0.06 0.065 NS 2.4 2.4 0 0 1 0.0 0.0
2350 CO18-GSB-V01 (to He01) 0.06 0.065 NS 2.4 2.4 0 0 1 0.0 0.0
2296 CO19-GSB-V01 (to He01) 0.06 0.065 NS 2.4 2.4 0 0 1 0.0 0.0
2332 CO20-GSB-V01 (to He01) 0.06 0.065 NS 2.4 2.4 0 0 1 0.0 0.0
2286 He01-GSB-G01 0.16 0.194 NS 50.8 0.0 0 0 0 50.8 0.0 Non-Return Valve (ref. section 0) & Straight junction loss
2288 He01-GSB-G02 0.32 0.194 NS 0.8 0.8 0 0 0 0.8 0.8 Straight junction loss
2310 He01-GSB-G03 0.32 0.194 NS 0.8 0.8 0 0 0 0.8 0.8 Straight junction loss
2324 He01-GSB-G04 0.32 0.194 NS 0.8 0.8 0 0 0 0.8 0.8 Straight junction loss
2304 He01-GSB-G05 0.32 0.194 NS 0.8 0.8 0 0 0 0.8 0.8 Straight junction loss
2302 He01-GSB-G06 0.32 0.194 NS 0.8 0.8 0 0 0 0.8 0.8 Straight junction loss
2214 He01-GSB-G07 0.32 0.194 NS 0.8 0.8 0 0 0 0.8 0.8 Straight junction loss
2244 He01-GSB-G08 0.32 0.194 NS 0.8 0.8 0 0 0 0.8 0.8 Straight junction loss
2274 He03-GSB-V01 (to He01) 0.06 0.065 NS 2.4 2.4 0 0 1 0.0 0.0

THERMO-HYDRAULIC ANALYSIS OF THE PBMR FUEL HANDLING AND STORAGE SYSTEM PAGE 113
No. Description Length
[m] Diameter
[m]
Mass Flow Rate
"NS"=Not Specified
[kg/s]
Loss Coefficient = 90
o x 0.36 + 45
o x 0.18 + Sharp x 2.4 + Other (ref. 0 and 0)
Kfw Kbw 90o 45
o Sharp Other Fw Other Bw Comments
2334 He10-GSB-V01 (to He01) 0.06 0.065 NS 2.4 2.4 0 0 1 0.0 0.0
FILTER AND BLOWER ASSEMBLY
This section describes the elements presenting the FHSS blower, filter and the piping connecting these components.
No. Description Length
[m] Diameter
[m]
Mass Flow Rate
"NS"=Not Specified
[kg/s]
Loss Coefficient = 90
o x 0.36 + 45
o x 0.18 + Sharp x 2.4 + Other (ref. 0 and 0)
Kfw Kbw 90o 45
o Sharp Other Fw Other Bw Comments
2202 He19 5.4 0.194 NS 1.44 1.44 4 0 0 0 0
2258 He20 3.3 0.194 NS 0.72 0.72 2 0 0 0 0
2000 FHSS Blower 0.1 1.000 0.42 0.00 0.00 0 0 0 0 0 Including 14kW **
2256 He01 7 0.194 NS 1.44 1.44 3 2 0 0 0
** � Refer [47] p.173 equation 8.25. Assumed blower efficiency of 70%.
Details for the FHSS filter are as follows:
No. Description Chart
2380 FHSS Filter FHSS_Filter_He_RevA.usp

THERMO-HYDRAULIC ANALYSIS OF THE PBMR FUEL HANDLING AND STORAGE SYSTEM PAGE 114
BLOWER BYPASS
This section describes the blower bypass line and heat exchanger.
No. Description Length
[m] Diameter
[m]
Mass Flow Rate
"NS"=Not Specified
[kg/s]
Loss Coefficient = 90
o x 0.36 + 45
o x 0.18 + Sharp x 2.4 + Other (ref. 0 and 0)
Kfw Kbw 90o 45
o Sharp Other Fw Other Bw Comments
2108 He10 3.2 0.05898 NS 1.44 1.44 4 0 0 0.0 0.0
2320 FHSS Heat-Exchanger 0.1 0.60000 NS 1.50 1.50 0 0 0 1.5 1.5 Refer section 0
2128 He11a 14.7 0.05898 NS 1.98 1.98 5 1 0 0.0 0.0
2648 He11b 4.0 0.05898 NS 3.48 3.48 3 0 1 0.0 0.0
2242 He12 1.0 0.05898 NS 0.72 0.72 2 0 0 0.0 0.0

THERMO-HYDRAULIC ANALYSIS OF THE PBMR FUEL HANDLING AND STORAGE SYSTEM PAGE 115
MEASUREMENT BLOCK INTERNALS
The measurement block (MBA) internals comprise of the gas flow paths through the diverter in the MBA and the dust cleaning paths.
No. Description Length
[m] Diameter
[m]
Mass Flow Rate
"NS"=Not Specified
[kg/s]
Loss Coefficient = 90
o x 0.36 + 45
o x 0.18 + Sharp x 2.4 + Other (ref. 0 and 0)
Kfw Kbw 90o 45
o Sharp Other Fw Other Bw Comments
2470 CL04-MB-E01 (Gas_Inlet) 0.10 0.043 NS 2.90 2.90 0 0 1 0.50 0.50 Reduction (Ref. 0)
2030 CL04-MB-W01 (to He05) 0.01 0.065 NS 2.40 2.40 0 0 1 0.00 0.00
2022 CL04-MB-W01 (to He14) 0.01 0.065 NS 2.40 2.40 0 0 1 0.00 0.00
2530 CL05-MB-E01 (Gas_Inlet) 0.10 0.043 NS 2.90 2.90 0 0 1 0.50 0.50 Reduction (Ref. 0)
2068 CL05-MB-W01 (to He13) 0.01 0.065 NS 2.40 2.40 0 0 1 0.00 0.00
2270 CL05-MB-W01 (to He16) 0.01 0.065 NS 2.40 2.40 0 0 1 0.00 0.00
2588 CL06-MB-E01 (Gas_Inlet) 0.10 0.043 NS 2.90 2.90 0 0 1 0.50 0.50 Reduction (Ref. 0)
2272 CL06-MB-W01 (to He15) 0.01 0.065 NS 2.40 2.40 0 0 1 0.00 0.00
2264 CL06-MB-W01 (to He16) 0.01 0.065 NS 2.40 2.40 0 0 1 0.00 0.00
2018 CL07-MB-W01 (to He05) 0.01 0.065 NS 2.40 2.40 0 0 1 0.00 0.00
2024 CL07-MB-W01 (to He14) 0.01 0.065 NS 2.40 2.40 0 0 1 0.00 0.00
2026 CL08-MB-W01 (to He13) 0.01 0.065 NS 2.40 2.40 0 0 1 0.00 0.00
2074 CL08-MB-W01 (to He16) 0.01 0.065 NS 2.40 2.40 0 0 1 0.00 0.00
2280 CL09-MB-W01 (to He15) 0.01 0.065 NS 2.40 2.40 0 0 1 0.00 0.00
2290 CL09-MB-W01 (to He16) 0.01 0.065 NS 2.40 2.40 0 0 1 0.00 0.00
2004 He05-MB-G02 0.32 0.065 NS 0.80 0.80 0 0 0 0.80 0.80 Straight junction loss
2014 He13-MB-G02 0.32 0.065 NS 0.80 0.80 0 0 0 0.80 0.80 Straight junction loss
2040 He14-MB-G02 0.32 0.065 NS 0.80 0.80 0 0 0 0.80 0.80 Straight junction loss
2016 He15-MB-G02 0.32 0.065 NS 0.80 0.80 0 0 0 0.80 0.80 Straight junction loss

THERMO-HYDRAULIC ANALYSIS OF THE PBMR FUEL HANDLING AND STORAGE SYSTEM PAGE 116
No. Description Length
[m] Diameter
[m]
Mass Flow Rate
"NS"=Not Specified
[kg/s]
Loss Coefficient = 90
o x 0.36 + 45
o x 0.18 + Sharp x 2.4 + Other (ref. 0 and 0)
Kfw Kbw 90o 45
o Sharp Other Fw Other Bw Comments
2266 He16-MB2-G02 0.32 0.065 NS 0.80 0.80 0 0 0 0.80 0.80 Straight junction loss
2322 He16-MB-G02 0.32 0.065 NS 0.80 0.80 0 0 0 0.80 0.80 Straight junction loss
2010 L01 to L04 (Open) 0.64 0.065 0 0.01 0.01 0 0 0 0.01 0.01 Assumed for straight diverter
2070 L01 to L55 (Open) 0.64 0.065 NS 0.28 0.28 0 1 0 0.00 0.00 Sphere line loss factor
2250 L01-MB-I01 0.10 0.065 NS 0.10 0.10 0 0 0 0.10 0.10 Assumed for indexer
2006 L02 to L06 (Open) 0.64 0.065 0 0.01 0.01 0 0 0 0.01 0.01 Assumed for straight diverter
2038 L02e to L57 (Open) 0.64 0.065 NS 0.28 0.28 0 1 0 0.00 0.00 Sphere line loss factor
2114 L02-MB-I01 0.10 0.065 NS 0.10 0.10 0 0 0 0.10 0.10 Assumed for indexer
2008 L03 to L05 (Open) 0.64 0.065 0 0.01 0.01 0 0 0 0.01 0.01 Assumed for straight diverter
2078 L03 to L56 (Open) 0.64 0.065 NS 0.28 0.28 0 1 0 0.00 0.00 Sphere line loss factor
2148 L03-MB-I01 0.10 0.065 NS 0.10 0.10 0 0 0 0.10 0.10 Assumed for indexer
2228 L11 to L55 (Open) 0.64 0.065 NS 0.01 0.01 0 0 0 0.01 0.01 Assumed for straight diverter
2226 L12 to L56 (Open) 0.64 0.065 NS 0.01 0.01 0 0 0 0.01 0.01 Assumed for straight diverter
2144 L13 to L57 (Open) 0.64 0.065 NS 0.01 0.01 0 0 0 0.01 0.01 Assumed for straight diverter
.

THERMO-HYDRAULIC ANALYSIS OF THE PBMR FUEL HANDLING AND STORAGE SYSTEM PAGE 117
CONVEYING BLOCK INTERNALS
No. Description Length
[m] Diameter
[m]
Mass Flow Rate
"NS"=Not Specified
[kg/s]
Loss Coefficient = 90
o x 0.36 + 45
o x 0.18 + Sharp x 2.4 + Other (ref. 0 and 0)
Kfw Kbw 90o 45
o Sharp Other Fw Other Bw Comments
2072 L01-CB-R01 (Bypass) 1.28 0.065 NS 4.8 4.8 0 0 2 0.0 0.0
2596 L01-CB-R01 (Bypass_Exit) 0.10 0.043 NS 2.9 2.9 0 0 1 0.5 0.5 Reduction (Ref. 0)
2598 L01-CB-R01 (Bypass_Inlet) 0.10 0.043 NS 2.9 2.9 0 0 1 0.5 0.5 Reduction (Ref. 0)
2084 L02-CB-R01 (Bypass) 1.28 0.065 NS 4.8 4.8 0 0 2 0.0 0.0
2606 L02-CB-R01 (Bypass_Exit) 0.10 0.043 NS 2.9 2.9 0 0 1 0.5 0.5 Reduction (Ref. 0)
2602 L02-CB-R01 (Bypass_Inlet) 0.10 0.043 NS 2.9 2.9 0 0 1 0.5 0.5 Reduction (Ref. 0)
2096 L03-CB-R01 (Bypass) 1.28 0.065 NS 4.8 4.8 0 0 2 0.0 0.0
2604 L03-CB-R01 (Bypass_Exit) 0.10 0.043 NS 2.9 2.9 0 0 1 0.5 0.5 Reduction (Ref. 0)
2600 L03-CB-R01 (Bypass_Inlet) 0.10 0.043 NS 2.9 2.9 0 0 1 0.5 0.5 Reduction (Ref. 0)
2547 CO01-CB-G1 (Gas Inlet) 0.10 0.043 NS 1.9 1.9 0 0 0 1.9 1.9 60o Junction + Reduction
2549 CO02-CB-G1 (Gas Inlet) 0.10 0.043 NS 1.9 1.9 0 0 0 1.9 1.9 60o Junction + Reduction
2551 CO03-CB-G1 (Gas Inlet) 0.10 0.043 NS 1.9 1.9 0 0 0 1.9 1.9 60o Junction + Reduction

THERMO-HYDRAULIC ANALYSIS OF THE PBMR FUEL HANDLING AND STORAGE SYSTEM PAGE 118
ISOLATION BLOCK INTERNALS
Loss Coefficient =
90o
x 0.36 + 45o
x 0.18 + Sharp x 2.4 + Other (ref. 0 and 0)
No. Description Length
[m] Diameter
[m] Kfw Kbw 90
o 45
o Sharp Other Fw Other Bw Comments
2364 CL07-IB-R01 (Gas_Inlet) 0.10 0.065 0.00 0.00 0 0 0 0.0 0.0
2492 CL08-IB-R01 (Gas_Inlet) 0.10 0.065 0.00 0.00 0 0 0 0.0 0.0
2532 CL09-IB-R01 (Gas_Inlet) 0.10 0.065 0.00 0.00 0 0 0 0.0 0.0
2152 L55-IB-R01 (Bypass) 0.64 0.065 2.40 2.40 0 0 1 0.0 0.0
2614 L55-IB-R01 (Bypass_Exit) 0.10 0.043 2.90 2.90 0 0 1 0.5 0.5 Reduction (Ref. 0)
2608 L55-IB-R01 (Bypass_Inlet) 0.32 0.043 5.80 5.80 0 0 2 1.0 1.0 2xReduction (Ref. 0)
2122 L56-IB-R01 (Bypass) 0.64 0.065 2.40 2.40 0 0 1 0.0 0.0
2616 L56-IB-R01 (Bypass_Exit) 0.10 0.043 2.90 2.90 0 0 1 0.5 0.5 Reduction (Ref. 0)
2610 L56-IB-R01 (Bypass_Inlet) 0.32 0.043 5.80 5.80 0 0 2 1.0 1.0 2xReduction (Ref. 0)
2124 L57-IB-R01 (Bypass) 0.64 0.065 2.40 2.40 0 0 1 0.0 0.0
2618 L57-IB-R01 (Bypass_Exit) 0.10 0.043 2.90 2.90 0 0 1 0.5 0.5 Reduction (Ref. 0)
2612 L57-IB-R01 (Bypass_Inlet) 0.32 0.043 5.80 5.80 0 0 2 1.0 1.0 2xReduction (Ref. 0)

THERMO-HYDRAULIC ANALYSIS OF THE PBMR FUEL HANDLING AND STORAGE SYSTEM PAGE 119
CLEANING BLOCK INTERNALS
No. Description Length
[m] Diameter
[m]
Mass Flow Rate
"NS"=Not Specified
[kg/s]
Loss Coefficient = 90
o x 0.36 + 45
o x 0.18 + Sharp x 2.4 + Other (ref. 0 and 0)
Kfw Kbw 90o 45
o Sharp Other Fw Other Bw Comments
2654 CL01-CLB-W01 (HP Open) 0.2 0.065 0 0.36 0.36 1 0 0 0.0 0.0
2656 CL01-CLB-W01 (LP Open) 0.2 0.065 0 0.36 0.36 1 0 0 0.0 0.0
2118 CL01-CLB-W01 (to He03) 0.01 0.065 NS 2.40 2.40 0 0 1 0.0 0.0
2166 CL01-CLB-W01 (to He06) 0.01 0.065 NS 2.40 2.40 0 0 1 0.0 0.0
2658 CL02-CLB-W01 (HP Open) 0.2 0.065 0 0.36 0.36 1 0 0 0.0 0.0
2660 CL02-CLB-W01 (LP Open) 0.2 0.065 0 0.36 0.36 1 0 0 0.0 0.0
2172 CL02-CLB-W01 (to He03) 0.01 0.065 NS 2.40 2.40 0 0 1 0.0 0.0
2164 CL02-CLB-W01 (to He06) 0.01 0.065 NS 2.40 2.40 0 0 1 0.0 0.0
2662 CL03-CLB-W01 (HP Open) 0.2 0.065 0 0.36 0.36 1 0 0 0.0 0.0
2664 CL03-CLB-W01 (LP Open) 0.2 0.065 0 0.36 0.36 1 0 0 0.0 0.0
2168 CL03-CLB-W01 (to He03) 0.01 0.065 NS 2.40 2.40 0 0 1 0.0 0.0
2158 CL03-CLB-W01 (to He06) 0.01 0.065 NS 2.40 2.40 0 0 1 0.0 0.0
2668 CL04-CLB-W01 (HP Open) 0.2 0.065 0 0.36 0.36 1 0 0 0.0 0.0
2680 CL04-CLB-W01 (LP Open) 0.2 0.065 0 0.36 0.36 1 0 0 0.0 0.0
2672 CL05-CLB-W01 (HP Open) 0.2 0.065 0 0.36 0.36 1 0 0 0.0 0.0
2684 CL05-CLB-W01 (LP Open) 0.2 0.065 0 0.36 0.36 1 0 0 0.0 0.0
2676 CL06-CLB-W01 (HP Open) 0.2 0.065 0 0.36 0.36 1 0 0 0.0 0.0
2688 CL06-CLB-W01 (LP Open) 0.2 0.065 0 0.36 0.36 1 0 0 0.0 0.0
2666 CL07-CLB-W01 (HP Open) 0.2 0.065 0 0.36 0.36 1 0 0 0.0 0.0
2678 CL07-CLB-W01 (LP Open) 0.2 0.065 0 0.36 0.36 1 0 0 0.0 0.0
2670 CL08-CLB-W01 (HP Open) 0.2 0.065 0 0.36 0.36 1 0 0 0.0 0.0

THERMO-HYDRAULIC ANALYSIS OF THE PBMR FUEL HANDLING AND STORAGE SYSTEM PAGE 120
No. Description Length
[m] Diameter
[m]
Mass Flow Rate
"NS"=Not Specified
[kg/s]
Loss Coefficient = 90
o x 0.36 + 45
o x 0.18 + Sharp x 2.4 + Other (ref. 0 and 0)
Kfw Kbw 90o 45
o Sharp Other Fw Other Bw Comments
2682 CL08-CLB-W01 (LP Open) 0.2 0.065 0 0.36 0.36 1 0 0 0.0 0.0
2674 CL09-CLB-W01 (HP Open) 0.2 0.065 0 0.36 0.36 1 0 0 0.0 0.0
2686 CL09-CLB-W01 (LP Open) 0.2 0.065 0 0.36 0.36 1 0 0 0.0 0.0
2116 He03-CLB-G01 0.32 0.065 NS 0.80 0.80 0 0 0 0.8 0.8 Straight junction loss
2176 He03-CLB-G02 0.32 0.065 NS 0.80 0.80 0 0 0 0.8 0.8 Straight junction loss
2170 He03-CLB-G03 0.32 0.065 NS 0.80 0.80 0 0 0 0.8 0.8 Straight junction loss
2178 He06-CLB-G01 0.32 0.065 NS 0.80 0.80 0 0 0 0.8 0.8 Straight junction loss
2372 He06-CLB-G02 0.32 0.065 NS 0.80 0.80 0 0 0 0.8 0.8 Straight junction loss
2138 He06-CLB-G03 0.32 0.065 NS 0.80 0.80 0 0 0 0.8 0.8 Straight junction loss
.
CORE UNLOADING DEVICE INTERNALS
No. Description Length
[m] Diameter
[m]
Loss Coefficient = 90
o x 0.36 + 45
o x 0.18 + Sharp x 2.4 + Other (ref. 0 and 0)
Kfw Kbw 90o 45
o Sharp Other Fw Other Bw Comments
2104 CL01-CUD-V01 (Gas_Inlet to L1) 0.10 0.043 2.90 2.90 0 0 1 0.5 0.5 Reduction (Ref. 0)
2362 CL02-CUD-V01 (Gas_Inlet to L3) 0.10 0.043 2.90 2.90 0 0 1 0.5 0.5 Reduction (Ref. 0)
2150 CL03-CUD-V01 (Gas_Inlet to L2) 0.10 0.043 2.90 2.90 0 0 1 0.5 0.5 Reduction (Ref. 0)
2198 L01-CUD-G01 0.64 0.065 2.40 2.40 0 0 1 0.0 0.0
2318 L02-CUD-G01 0.64 0.065 2.40 2.40 0 0 1 0.0 0.0

THERMO-HYDRAULIC ANALYSIS OF THE PBMR FUEL HANDLING AND STORAGE SYSTEM PAGE 121
No. Description Length
[m] Diameter
[m]
Loss Coefficient = 90
o x 0.36 + 45
o x 0.18 + Sharp x 2.4 + Other (ref. 0 and 0)
Kfw Kbw 90o 45
o Sharp Other Fw Other Bw Comments
2194 L03-CUD-G01 0.64 0.065 2.40 2.40 0 0 1 0.0 0.0
CONVEYING LINES
No. Description Length
[m] Circumference
[m] Area [m
2]
Loss Coefficient = 90
o x 0.48 + 45
o x 0.28 + Other (ref. 0)
Kfw Kbw 90o 45
o Other Fw Other Bw Comments
2076 L01a 11.8 0.211488 0.003452184 2.40 2.40 5 0 0.00 0.00
2034 L01b 46.1 0.211488 0.003452184 1.24 1.24 2 1 0.00 0.00
2046 L01c 1.704 0.211488 0.003452184 0.00 0.00 0 0 0.00 0.00
2204 L01d+L01e 8.8 0.211488 0.003452184 2.40 2.40 5 0 0.00 0.00
2086 L02a 12.3 0.211488 0.003452184 2.40 2.40 5 0 0.00 0.00
2192 L02b 46.2 0.211488 0.003452184 1.24 1.24 2 1 0.00 0.00
2224 L02c 1.7 0.211488 0.003452184 0.00 0.00 0 0 0.00 0.00
2234 L02d+L02e 15.2 0.211488 0.003452184 1.44 1.44 3 0 0.00 0.00
2162 L03a 13.1 0.211488 0.003452184 2.40 2.40 5 0 0.00 0.00
2032 L03b 46.1 0.211488 0.003452184 1.24 1.24 2 1 0.00 0.00
2044 L03c 1.704 0.211488 0.003452184 0.00 0.00 0 0 0.00 0.00
2180 L03d+L03e 12.2 0.211488 0.003452184 2.40 2.40 5 0 0.00 0.00
2252 L04 15.2 0.211488 0.003452184 2.40 2.40 5 0 0.00 0.00
2254 L05 14.9 0.211488 0.003452184 2.40 2.40 5 0 0.00 0.00
2126 L06 12.1 0.211488 0.003452184 1.44 1.44 3 0 0.00 0.00
2048 L08b+L08a+L24+TD+SRP1+SUP1 65.3 0.211488 0.003452184 5.16 5.16 8 3 0.48 0.48 1xLong Bend

THERMO-HYDRAULIC ANALYSIS OF THE PBMR FUEL HANDLING AND STORAGE SYSTEM PAGE 122
No. Description Length
[m] Circumference
[m] Area [m
2]
Loss Coefficient = 90
o x 0.48 + 45
o x 0.28 + Other (ref. 0)
Kfw Kbw 90o 45
o Other Fw Other Bw Comments
2082 L08c 1.9 0.211488 0.003452184 0.00 0.00 0 0 0.00 0.00
2058 L08d+L11 7.3 0.211488 0.003452184 1.80 1.80 2 3 0.00 0.00
2292 L09b+L09a+L25+TD+SRP3+SUP3 65.8 0.211488 0.003452184 5.16 5.16 8 3 0.48 0.48 1xLong Bend
2182 L09c 2.183 0.211488 0.003452184 0.00 0.00 0 0 0.00 0.00
2248 L09d+L12 9.2 0.211488 0.003452184 1.04 1.04 1 2 0.00 0.00
2312 L10b+L10a+L28/11+L28e+L28l +L28m+SRP2+SUP2
67.3 0.211488 0.003452184 4.28 4.28 6 5 0.00 0.00
2218 L10c 2.465 0.211488 0.003452184 0.00 0.00 0 0 0.00 0.00
2246 L10d+L13 12.6 0.211488 0.003452184 2.00 2.00 3 2 0.00 0.00
2102 L15a+L15b+L30b+L18a 12.7 0.211488 0.003452184 1.44 1.44 3 0 0.00 0.00
2136 L16a 11.45 0.211488 0.003452184 1.44 1.44 3 0 0.00 0.00
2160 L16a+L16b+L16c+L22+TD+SLP1 11.8 0.211488 0.003452184 3.48 2.98 4 2 1.00 0.50 Line entrance into tank
2112 L17a 10.6 0.211488 0.003452184 1.44 1.44 3 0 0.00 0.00
2088 L17a+L17b+L17c+L23+TD+SLP2 12.2 0.211488 0.003452184 3.48 2.98 4 2 1.00 0.50 Line entrance into tank
2174 L18/12+L18i+L18b+L18a+SLP 12.7 0.211488 0.003452184 3.68 3.18 5 1 1.00 0.50 Line entrance into tank
2262 L19/6+L19j+L19b+L19a+SLP 12.5 0.211488 0.003452184 3.48 2.98 4 2 1.00 0.50 Line entrance into tank
2276 L29/5+L30a+L30b+L30c+L30e +L19a+L29e+L29m+L29n+SRP+SUP
37.4 0.211488 0.003452184 3.44 3.44 6 2 0.00 0.00
2190 L55 13.3 0.211488 0.003452184 2.00 2.00 3 2 0.00 0.00
2232 L56 10.5 0.211488 0.003452184 1.52 1.52 2 2 0.00 0.00
2208 L57 10.7 0.211488 0.003452184 1.32 1.32 1 3 0.00 0.00
2142 L58 9.3 0.211488 0.003452184 0.56 0.56 0 2 0.00 0.00
2094 L59 9.7 0.211488 0.003452184 0.56 0.56 0 2 0.00 0.00

THERMO-HYDRAULIC ANALYSIS OF THE PBMR FUEL HANDLING AND STORAGE SYSTEM PAGE 123
No. Description Length
[m] Circumference
[m] Area [m
2]
Loss Coefficient = 90
o x 0.48 + 45
o x 0.28 + Other (ref. 0)
Kfw Kbw 90o 45
o Other Fw Other Bw Comments
2146 L60 6.6 0.211488 0.003452184 0.28 0.28 0 1 0.00 0.00

THERMO-HYDRAULIC ANALYSIS OF THE PBMR FUEL HANDLING AND STORAGE SYSTEM PAGE 124
CLEANING LINES
No. Description Length
[m] Diameter
[m]
Loss Coefficient = 90
o x 0.36 + 45
o x 0.18 + Sharp x 2.4 + Other (ref. 0 and 0)
Kfw Kbw 90o 45
o Sharp Other Fw Other Bw Comments
2060 CL01 4.1 0.05898 0.72 0.72 2 0 0 0 0
2212 CL02 7 0.05898 1.26 1.26 3 1 0 0 0
2308 CL03 7.1 0.05898 1.44 1.44 4 0 0 0 0
2300 CL04 1 0.05898 0.72 0.72 2 0 0 0 0
2036 CL05 1 0.05898 0.72 0.72 2 0 0 0 0
2062 CL06 1 0.05898 0.72 0.72 2 0 0 0 0
2206 CL07 11.6 0.05898 1.80 1.80 5 0 0 0 0
2064 CL08 12.5 0.05898 1.80 1.80 5 0 0 0 0
2140 CL09 15.8 0.05898 1.44 1.44 4 0 0 0 0
2090 CL13 15.1 0.01 2.16 2.16 6 0 0 0 0
2230 CL15 15.1 0.01 2.16 2.16 6 0 0 0 0
2236 CL14 15.1 0.01 2.16 2.16 6 0 0 0 0
2092 CL10 51.1 0.01 2.34 2.34 6 1 0 0 0
2154 CL11 51.1 0.01 2.34 2.34 6 1 0 0 0
2020 CL12 51.1 0.01 2.34 2.34 6 1 0 0 0

THERMO-HYDRAULIC ANALYSIS OF THE PBMR FUEL HANDLING AND STORAGE SYSTEM PAGE 125
GAS SUPPLY AND RETURN LINES FOR SPHERE LIFTING AND BRAKING
Loss Coefficient =
90o
x 0.36 + 45o
x 0.18 + Sharp x 2.4 + Other (ref. 0 and 0)
No. Description Length
[m] Diameter
[m] Kfw Kbw 90
o 45
o Sharp Other Fw Other Bw Comments
2238 CO01 15.1 0.05898 2.16 2.16 6 0 0 0.00 0.00
2210 CO02 14.6 0.05898 2.16 2.16 6 0 0 0.00 0.00
2066 CO03 11.9 0.05898 2.16 2.16 6 0 0 0.00 0.00
2294 CO04 51.4 0.05898 2.70 2.70 7 1 0 0.00 0.00
2050 CO05 63.8 0.05898 2.76 2.76 5 0 0 0.96 0.96 Including 2 long bends (ref. Table 29)
2080 CO06 51.3 0.05898 2.70 2.70 7 1 0 0.00 0.00
2054 CO07 63.8 0.05898 2.76 2.76 5 0 0 0.96 0.96 Including 2 long bends (ref. Table 29)
2630 CO08 51.1 0.05898 2.34 2.34 6 1 0 0.00 0.00
2056 CO09 63.7 0.05898 2.64 2.64 6 0 0 0.48 0.48 Including 1 long bend (ref. Table 29)
2156 CO10 28.9 0.05898 5.28 5.28 8 0 1 0.00 0.00
2052 CO11 28.6 0.05898 5.28 5.28 8 0 1 0.00 0.00
2132 CO12 28.4 0.05898 5.28 5.28 8 0 1 0.00 0.00
2282 CO13 55.6 0.05898 2.70 2.70 7 1 0 0.00 0.00
2098 CO14 67.5 0.05898 2.94 2.94 5 1 0 0.96 0.96 Including 2 long bends (ref. Table 29)
2260 CO15 55.3 0.05898 2.52 2.52 6 2 0 0.00 0.00
2130 CO16 67.7 0.05898 2.94 2.94 5 1 0 0.96 0.96 Including 2 long bends (ref. Table 29)
2284 CO17 54.9 0.05898 2.52 2.52 6 2 0 0.00 0.00
2134 CO18 67.8 0.05898 2.94 2.94 5 1 0 0.96 0.96 Including 2 long bends (ref. Table 29)
2100 CO19+CO19/5 32.5 0.05898 8.40 8.40 10 0 2 0.00 0.00
2120 CO20 47.9 0.05898 6.36 6.36 9 4 1 0.00 0.00
2216 CO21+CO24 46.3 0.05898 3.42 3.42 6 7 0 0.00 0.00

THERMO-HYDRAULIC ANALYSIS OF THE PBMR FUEL HANDLING AND STORAGE SYSTEM PAGE 126
Loss Coefficient =
90o
x 0.36 + 45o
x 0.18 + Sharp x 2.4 + Other (ref. 0 and 0)
No. Description Length
[m] Diameter
[m] Kfw Kbw 90
o 45
o Sharp Other Fw Other Bw Comments
2650 CO22 4.6 0.05898 0.54 0.54 1 1 0 0.00 0.00
2106 CO23 2.9 0.05898 0.72 0.72 2 0 0 0.00 0.00
2652 CO24 3.5 0.05898 3.66 3.66 3 1 1 0.00 0.00
2628 CO32/12 21.1 0.05898 10.18 9.68 5 1 3 1.00 0.50 Line entrance into tank
2594 CO32/6 19.2 0.05898 9.64 9.14 3 2 3 1.00 0.50 Line entrance into tank
GENERAL GAS LINES
No. Description Length
[m] Diameter
[m]
Loss Coefficient = 90
o x 0.36 + 45
o x 0.18 + Sharp x 2.4 + Other (ref. 0 and 0)
Kfw Kbw 90o 45
o Sharp Other Fw Other Bw Comments
2298 He03 3.9 0.05898 0.72 0.72 2 0 0 0 0
2634 He04 2.4 0.05898 0.36 0.36 0 2 0 0 0
2042 He05 66.1 0.05898 4.32 4.32 10 4 0 0 0
2002 He06 66.7 0.05898 3.96 3.96 10 2 0 0 0
2278 He07b 16.7 0.05898 2.52 2.52 7 0 0 0 0
2553 He07a 50.0 0.0243 4.50 4.50 10 5 0 0 0 Assumed All Line Details
2028 He13 12.8 0.05898 2.16 2.16 6 0 0 0 0
2012 He14 10.9 0.05898 2.16 2.16 6 0 0 0 0
2306 He15 13.8 0.05898 2.16 2.16 6 0 0 0 0
2268 He16 11.8 0.05898 2.16 2.16 6 0 0 0 0
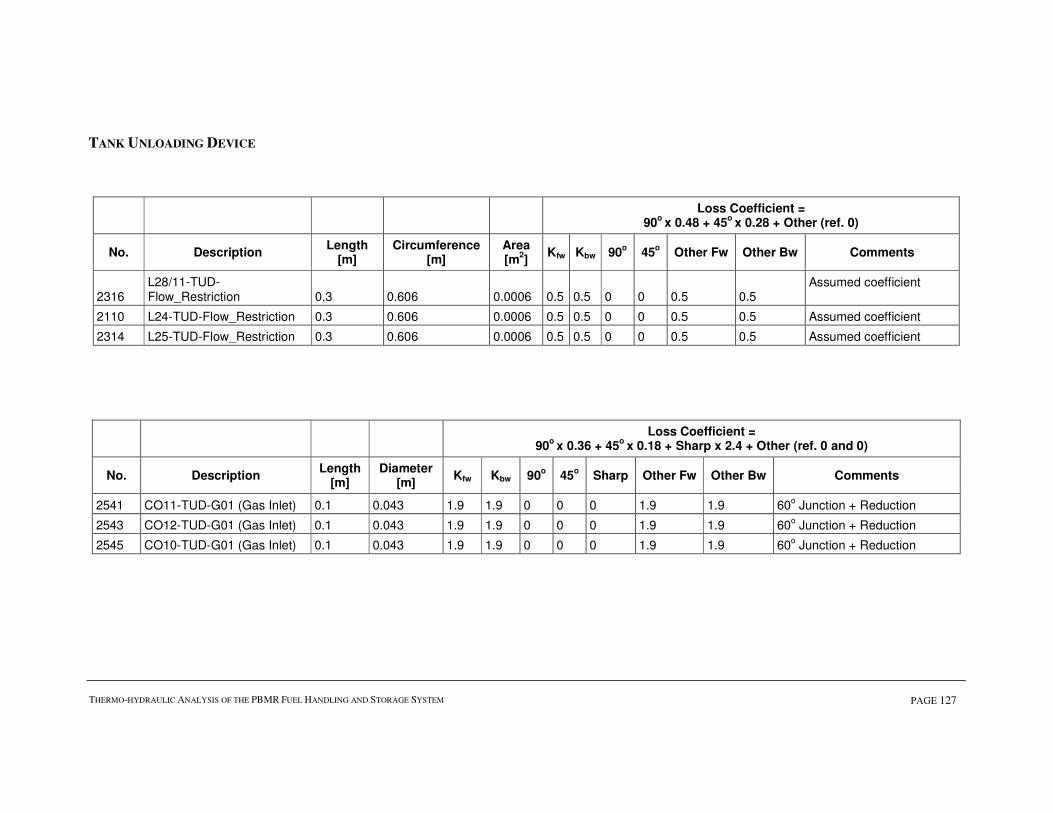
THERMO-HYDRAULIC ANALYSIS OF THE PBMR FUEL HANDLING AND STORAGE SYSTEM PAGE 127
TANK UNLOADING DEVICE
Loss Coefficient =
90o
x 0.48 + 45o
x 0.28 + Other (ref. 0)
No. Description Length
[m] Circumference
[m] Area [m
2]
Kfw Kbw 90o 45
o Other Fw Other Bw Comments
2316 L28/11-TUD-Flow_Restriction 0.3 0.606 0.0006 0.5 0.5 0 0 0.5 0.5
Assumed coefficient
2110 L24-TUD-Flow_Restriction 0.3 0.606 0.0006 0.5 0.5 0 0 0.5 0.5 Assumed coefficient
2314 L25-TUD-Flow_Restriction 0.3 0.606 0.0006 0.5 0.5 0 0 0.5 0.5 Assumed coefficient
Loss Coefficient =
90o
x 0.36 + 45o
x 0.18 + Sharp x 2.4 + Other (ref. 0 and 0)
No. Description Length
[m] Diameter
[m] Kfw Kbw 90
o 45
o Sharp Other Fw Other Bw Comments
2541 CO11-TUD-G01 (Gas Inlet) 0.1 0.043 1.9 1.9 0 0 0 1.9 1.9 60o Junction + Reduction
2543 CO12-TUD-G01 (Gas Inlet) 0.1 0.043 1.9 1.9 0 0 0 1.9 1.9 60o Junction + Reduction
2545 CO10-TUD-G01 (Gas Inlet) 0.1 0.043 1.9 1.9 0 0 0 1.9 1.9 60o Junction + Reduction

THERMO-HYDRAULIC ANALYSIS OF THE PBMR FUEL HANDLING AND STORAGE SYSTEM PAGE 128
NODES
No. Description Volume
[m3]
Pressure [kPa]
Temperature
[°°°°C]
2 Reactor Core Outlet 5.203 1000 100
78 Manifold 96.736 1000 100
98 Void Above Reactor Core 5.875 1000 100
2095 Graphite Tank Assembly 140 Not Specified Not Specified
2449 Used Fuel Tank Assembly 140 Not Specified Not Specified

THERMO-HYDRAULIC ANALYSIS OF THE PBMR FUEL HANDLING AND STORAGE SYSTEM PAGE - 129 -
OUTSTANDING ISSUES
a. The pressure loss characteristics of the FRI, three way valve, diverter and indexer are
currently assumed and need to be verified for both helium and air.
b. The pressure loss characteristics of the filter need to be verified for both helium and air.
c. The heat exchanger pressure loss and heat transfer characteristics are outstanding and
assumptions need to be verified.
d. Pressure losses in the gas flow paths inside the FHSS Cleaning Block, Conveying Block,
Measurement Block, Isolation Block and CUD are assumed and need to be verified.
e. Flow characteristics for the trim valve, double seat isolation valve, isolation valve, flow
control valve, three way valve and diverter are assumed and need be verified.
f. Assumed xT values for valves need to be verified.
g. Pressure loss characteristics for the venturis used for flow measurement are assumed and
need to be verified.
h. The blower non-return valve characteristics are assumed and need to be verified.
i. No blower characteristics are available for the FHSS blower and assumptions need to be
verified.
j. Pressure losses in the GRBA and GSBA are assumed and need to be verified.
k. Information on the HVAC system is outstanding and it is assumed that HVAC can
remove all heat dissipated from the piping. It is further assumed that the HVAC system
can provide a convection coefficient of at least 0.5 W/m2K on the outer surface of the
piping.
l. Insulation on the FHSS piping needs to be verified regarding the piping, which should be
insulated if any at all.
m. The insulation characteristics are assumed and need to be verified.
n. Heat transfer to ambient is currently modelled for piping longer than 10m only. No heat
transfer is modelled for gravity lines and sphere buffers. The heat transfer to ambient
should be updated and refined before detailed temperature distribution analyses can be
conducted.
o. Heat radiation to ambient is not included and the effect should be verified.
p. Heat transfer to ambient does not account for thermal capacitance and heat transfer
elements need to be updated with conductive heat transfer elements before heat transfer
transient analyses can be conducted.
q. The dust pocket cleaning lines servicing the CBA are modelled to connect to a node
representing the Auxiliary Gas system. The characteristics of this system represented by
a single node in the model still need to be established.
r. The gas brake inlet and outlet slots are not modelled, and although not regarded as major
pressure loss components, need to be verified.

THERMO-HYDRAULIC ANALYSIS OF THE PBMR FUEL HANDLING AND STORAGE SYSTEM PAGE - 130 -
s. The tank-unloading device is expected to cause some gas leak flow between the sphere
conveying lines. This leak path is assumed and needs to be verified.
t. The influence of not including pressure losses due to flanges and connection points needs
to be investigated.
u. The sphere storage tanks pressure relieve system is not modelled.
v. The cross flow stemming from leak flow over the diverters in the discharge lock outlet
unit is not modelled. This is acceptable for normal operation since no flow is expected in
these lines. For special analyses on upset or fault conditions, it might be necessary to
include these cross flow paths.
w. Junction losses are modelled conservatively concerning pressure loss. Detailed and
accurate junction losses need to be investigated and included for detailed analyses.
x. Fluid scaling from air to helium for the filter characteristic and helium to air for the FRI
characteristic (the FRI characteristic influences both the three-way valve and the diverter
characteristic) needs to be verified. This outstanding issue is not foreseen to influence the
blower performance drastically since these components account for a very small portion
of the total system resistance and is therefore acceptable for blower sizing calculations.
y. User specified element characteristics are assumed applicable to all pressures and
temperatures and this assumption needs to be verified.
z. The effect of ignoring physical height in the model needs to be verified.
MODEL LIMITATIONS
This section elaborates on the Flownex model limitations. Most of the limitations to the
model are discussed in the assumptions to this document.
A summary of some of the most important model limitations with regard to analyses accuracy
is presented:
The US elements used to model the characteristics of the venturis, FRI, three way valve and
diverter, are limited to an applicable operating envelope for the component. The acceptable
operating range for each of the components can be found in the characteristic data, i.e. the
corrected mass flow rate and pressure ratio.
Note that it is assumed that the corrected mass flow rate pressure ratio relationship for the US
elements is applicable to all operating pressures and temperatures.
Conductive capacitance for heat transfer to ambient is not included and limits the model to
steady state analyses with reference to heat transfer to ambient.
The effect of the heat exchanger effectiveness cannot be simulated with this model.

THERMO-HYDRAULIC ANALYSIS OF THE PBMR FUEL HANDLING AND STORAGE SYSTEM PAGE - 131 -
The applicable operating envelope as discussed in (a) above is such that high pressure ratios
above approximately 1.03, as will be found during chocking conditions for the FRI, is not
included.
The controllability of control valves in the FHSS is not included in this model and it is
assumed that any valve condition is controllable.


![[email protected] - PBMR](https://img.pdfslide.net/doc/110x75/6206218f8c2f7b173004c5ff/emailprotected-pbmr.jpg)