Embed Size (px)
Citation preview
i
EPA/600/R-15/080|May 2015 | www.epa.gov/research
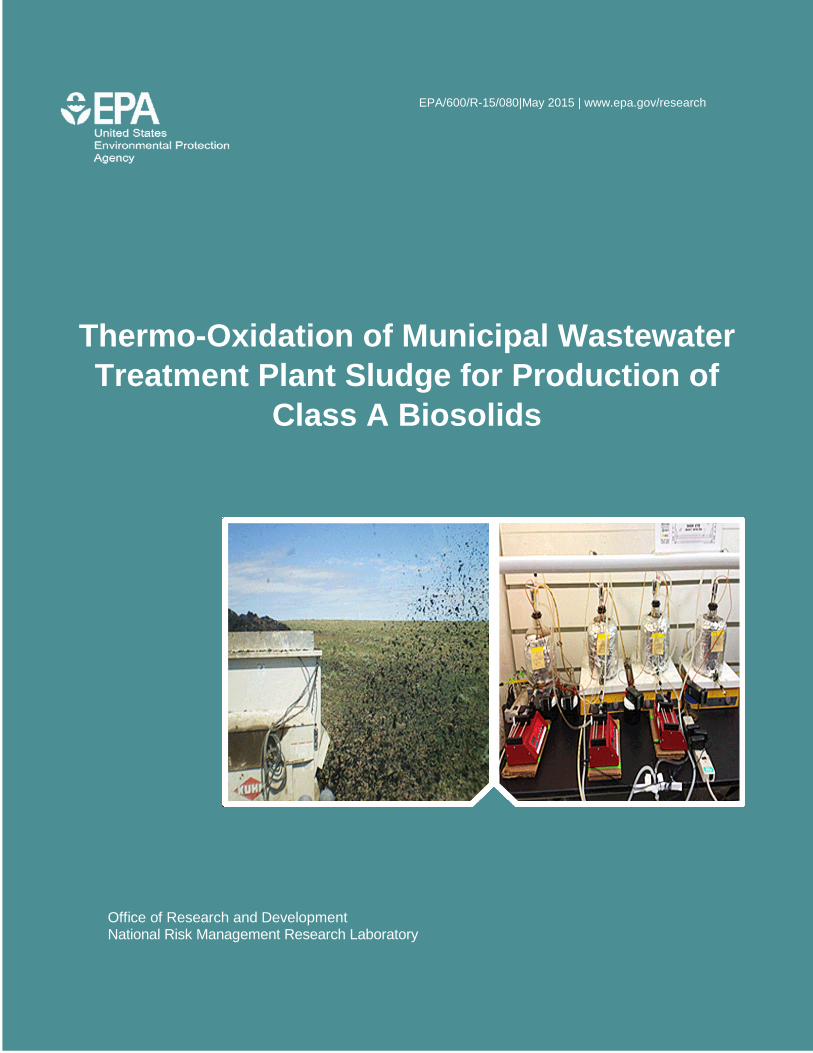
Thermo-Oxidation of Municipal Wastewater Treatment Plant Sludge for Production of
Class A Biosolids
Office of Research and Development National Risk Management Research Laboratory
i
EPA/600/R-15/080
May 2015 Thermo-Oxidation of Municipal Wastewater Treatment Plant Sludge for Production of
Class A Biosolids
by
Edith L. Holder Robert J. Grosser
Ann Dougherty Pegasus Technical Services, Inc.
Cincinnati, OH 45219
Contract No. EP-C-11-006
Richard C. Brenner Work Assignment Manager
Land Remediation and Pollution Control Division National Risk Management Research Laboratory
Cincinnati, OH 45268
ii
Notice The U.S. Environmental Protection Agency (EPA), through its Office of Research and Development (ORD), funded and managed the research described herein under Contract No. EP-C-11-006. It has been subjected to the Agency’s peer and administrative review and has been approved for publication as an EPA document.
Any mention of trade names or commercial products does not constitute endorsement or recommendation for use by EPA.
iii
Abstract Bench-scale reactors were used to test a novel thermo-oxidation process on municipal wastewater treatment plant (WWTP) waste activated sludge (WAS) using hydrogen peroxide (H2O2) to achieve a Class A sludge product appropriate for land application. Reactor temperatures ranging from room temperature to 90oC were tested with doses of 0.05, 0.1, and 0.2 g H2O2/g volatile suspended solids (VSS) applied. Measurements included total suspended solids (TSS), VSS, fecal coliform counts, settling characteristics, and nutrient concentrations for chemical oxygen demand, total phosphorus, ammonia nitrogen, and total Kjeldahl nitrogen. The best results, in terms of volatile solids destruction, were obtained with an H2O2 dose of 0.2 g/g VSS at 90oC, but a temperature ≥ 65oC achieved fecal coliform removal without re-growth potential, and 0.1 g H2O2/g VSS yielded an acceptable product, albeit with less solids mass reduction.
A market analysis was performed including development of conceptual treatment trains and cost estimates. The preliminary conclusion of this analysis was that thermo-oxidation capital costs are much less than those for implementing existing technologies, although the operating cost of the thermo-oxidation process, per ton TSS, may be higher. Lower capital costs may place the process within the budgetary limitations of small municipalities. Accordingly, the most attractive target market for this process is believed to be smaller WWTPs with influent wastewater flows in the range of 1-6 million gallons per day (mgd) that utilize extended aeration activated sludge systems, e.g., oxidation ditches, producing 4,000-20,000 gallons per day (gpd) of WAS.
iv
Foreword The U.S. Environmental Protection Agency (EPA) is charged by Congress with protecting the Nation's land, air, and water resources. Under a mandate of national environmental laws, the Agency strives to formulate and implement actions leading to a compatible balance between human activities and the ability of natural systems to support and nurture life. To meet this mandate, EPA's research program is providing data and technical support for solving environmental problems today and building a science knowledge base necessary to manage our ecological resources wisely, understand how pollutants affect our health, and prevent or reduce environmental risks in the future.
The National Risk Management Research Laboratory (NRMRL) is the Agency's center for investigation of technological and management approaches for preventing and reducing risks from pollution that threaten human health and the environment. The focus of the Laboratory's research program is on methods and their cost-effectiveness for prevention and control of pollution to air, land, water, and subsurface resources; protection of water quality in public water systems; remediation of contaminated sites, sediments and ground water; prevention and control of indoor air pollution; and restoration of ecosystems. NRMRL collaborates with both public and private sector partners to foster technologies that reduce the cost of compliance and to anticipate emerging problems. NRMRL's research provides solutions to environmental problems by: developing and promoting technologies that protect and improve the environment, advancing scientific and engineering information to support regulatory and policy decisions, and providing the technical support and information transfer to ensure implementation of environmental regulations and strategies at the national, state, and community levels.
Safe and cost-effective treatment and disposal of waste sludges generated by municipal wastewater treatment plants (WWTPs) present numerous challenges and design options. Historically, most municipal WWTPs have produced both raw primary sludge and excess treated secondary sludge for processing and disposal. Frequently, these sludges have been processed together, resulting in the production of Class B biosolids for disposal in landfills or application to agricultural land. A myriad of problems can be associated with land applying Class B biosolids including unacceptable levels of vector attraction, nuisance and odor complaints, and claims of illness from nearby residents. In recent years, many municipalities, particularly smaller communities, have opted to construct WWTPs without primary clarifiers employing extended aeration activated sludge systems for secondary treatment that produce only highly oxidized waste activated sludge (WAS). This project has evaluated a novel WAS thermal-oxidation process employing a combination of heat and hydrogen peroxide for production of Class A biosolids. Class A biosolids are a highly preferable alternative to Class B biosolids for beneficial use of WWTP waste sludge products.
Cynthia Sonich-Mullin, Director National Risk Management Research Laboratory
v
Contents Notice ......................................................................................................................................... ii Abstract ..................................................................................................................................... iii Foreword .................................................................................................................................. iv Figures ..................................................................................................................................... vii Tables ..................................................................................................................................... viii Acronyms and Abbreviations .................................................................................................... ix Acknowledgments ...................................................................................................................... x 1.0 Description and Objectives ................................................................................................ 1
1.1 Introduction and Background ................................................................................ 1 1.2 Objectives ............................................................................................................. 2 1.3 Technology Description ......................................................................................... 2
2.0 Feed Waste Activated Sludge Selection ........................................................................... 4 2.1 Description of Wastewater Treatment Plants Considered ..................................... 4 2.2 Rationale for Selection of Mason Wastewater Treatment Plant ............................ 5
3.0 Experimental Design ......................................................................................................... 9 3.1 Description of Experimental Systems .................................................................... 9 3.2 Experimental Chronology and Conditions ........................................................... 11 3.3 Methods .............................................................................................................. 11 3.4 Quality Assurance/Quality Control Considerations ............................................. 12
4.0 Results and Discussion ................................................................................................... 13 4.1 Overview of Experiments .................................................................................... 13 4.2 Initial Experiments ............................................................................................... 13 4.3 Experiments at 90oC, 75oC, and 65oC ................................................................. 16 4.4 Summer Experiments on Mason Waste Activated Sludge .................................. 20 4.5 Testing Waste Activated Sludge from Other Wastewater Treatment Plants ....... 28 4.6 Summary of Results ............................................................................................ 29 4.7 Summary of Treatment and Discussion .............................................................. 31
5.0 Literature Review and Description of Competing Technologies ...................................... 33 6.0 Market Analysis, Conceptual Treatment Trains, and Cost Estimates .............................. 37
6.1 Background ......................................................................................................... 37 6.2 Market Analysis of Fertilizer ................................................................................ 37 6.3 A Global View of Three Trends ........................................................................... 38 6.4 Market Potential for Thermo-Oxidation Technology ............................................ 39 6.5 Cost Estimates .................................................................................................... 39
6.5.1 Methodology for Conceptual Design and Costs for Thermo-Oxidation Technology ............................................................................................... 40
6.5.2 Conceptual Treatment Trains ................................................................... 40
vi
Contents (continued)
6.6 Cost Comparison with Existing Systems ............................................................. 44 6.6.1 Landfilling ................................................................................................. 45 6.6.2 Mason Water Reclamation Plant, Mason, OH .......................................... 46 6.6.3 Morris Forman Water Quality Treatment Center, Louisville, KY ............... 46 6.6.4 Mill Creek Wastewater Treatment Plant, Cincinnati, OH .......................... 46
6.7 Summary of Market Analysis ............................................................................... 46 7.0 Summary and Conclusions ............................................................................................. 48
7.1 Project Summary ................................................................................................. 48 7.2 Project Conclusions ............................................................................................ 49
8.0 References ...................................................................................................................... 54 Appendix A Variations on Conceptual Treatment Trains ........................................................ 59 Appendix B Quality Assurance Project Plan #L18881-QP-1-0 ............................................... 60
vii
Figures 2.1 Flow Diagram of Mason Water Reclamation Plant ............................................................ 6 2.2 Aerial Photograph of Mason Water Reclamation Plant ..................................................... 7 3.1 Photograph of Aerobic Sludge Thermo-Oxidation Experimental System .......................... 9 3.2 Schematic of Aerobic Sludge Thermo-Oxidation Experimental System .......................... 10 4.1a TSS and VSS Reduction: Air vs. N2 in Headspace, H2O2 vs. No H2O2 ........................... 15 4.1b % VSS Removed at 60oC for Triplicate Runs .................................................................. 15 4.2 Fecal Coliform (MPN) Results, 60oC, Air vs. N2, 0.2 g H2O2/g VSS vs. No H2O2 ............ 15 4.3 pH Results, 60oC, Air vs. N2, 0.2 g H2O2/g VSS vs. No H2O2 .......................................... 16 4.4 % VSS Removed at 90oC for Triplicate Runs .................................................................. 17 4.5 % VSS Removed at 75oC for Triplicate Runs .................................................................. 17 4.6 pH Results at 90oC and 75oC for Triplicate Runs ............................................................ 18 4.7 Fecal Coliform (MPN) Results at 75oC for Triplicate Runs .............................................. 18 4.8 % VSS Removed at 65oC for Triplicate Runs .................................................................. 19 4.9 pH Results and NH4-N Concentrations at 65oC for Triplicate Runs ................................. 20 4.10 TSS and VSS Removals for Multi-Temperature Experiment ........................................... 21 4.11 pH Results for Multi-Temperature Experiment ................................................................ 21 4.12 NH4-N Results for Multi-Temperature Experiment .......................................................... 22 4.13 Soluble COD Results as a Percent of Total COD for Multi-Temp. Experiment ............... 23 4.14 TKN Results for Multi-Temperature Experiment .............................................................. 24 4.15 VSS Removal for Sequential Runs Using Mason WWTP Sludge ................................... 24 4.16 Composite Graph of % VSS Removal for Mason WWTP Showing Seasonal Effect ....... 26 4.17 Sludge Settleability after 24 hours at 90oC ...................................................................... 27 4.18 Settling Results of 1,000 mL of Reactor Contents ........................................................... 27 4.19 VSS Removal for Four Different WWTPs at 90oC, No H2O2 Control and 0.2 g H2O2/g
VSS Treated Triplicates ................................................................................................. 28 4.20 Regression Lines of % VSS Removal at 90oC for All 0.2g H2O2/g VSS Dosing
Experiments ................................................................................................................... 31 6.1 Treatment Train 1 with Table of Construction Cost Estimates ........................................ 41 6.2 Treatment Train 2 with Table of Construction Cost Estimates ........................................ 42
viii
Tables 2.1 Results of Preliminary Sampling of Five WWTPs in the Greater Cincinnati, OH Area ...... 5 2.2 Wastewater Characteristics for October 2012 for Five WWTPs in the Greater Cincinnati
Area ................................................................................................................................. 5 2.3 2013 Influent Wastewater Characteristics for the Mason Water Reclamation Plant .......... 7 2.4 2013 Plant Effluent Characteristics for the Mason Water Reclamation Plant .................... 8 3.1 Instrumentation and Equipment Used in Experimental System ....................................... 10 4.1 List of the Experiments with Operating Conditions and Analyses Performed .................. 14 4.2 Comparison of Filterability of Suspended Solids at T = Initial and T = 8 hours* in Multi-
Temperature Experiment ............................................................................................... 22 4.3 Additional Measurements Performed on Four WWTPs ................................................... 29 4.4 Averages of % VSS Removal and Increased Removal over Control by Treatment ........ 30 6.1 Estimated Operating Costs for Treatment Trains 1 and 2 for 20,000 gpd WAS .............. 43 6.2 Estimated Operating Costs for Treatment Trains 1 and 2 for 4,000 gpd WAS ................ 44 6.3 Summary of Capital and Operating Costs for Existing Sludge Treatment and Disposal
Options .......................................................................................................................... 45
ix
Acronyms and Abbreviations BOD5 5-day biochemical oxygen demand CFR Code of Federal Regulations CFU colony forming units COD chemical oxygen demand EPA U.S. Environmental Protection Agency EQ Exceptional Quality, refers to biosolids with low levels of specified metals FSS filterable suspended solids, solids passing through a filter gpd gallons per day gpm gallons per minute H2O2 hydrogen peroxide Louisville Green™ pelleted dried WAS from the Morris Forman Water Quality Treatment
Center, Louisville, KY MCRT mean cell residence time Milorganite™ pelleted dried WAS from the Milwaukee Metropolitan Sewerage District mgd million gallons per day mg/L milligrams per liter MPN most probable number NRMRL National Risk Management Research Laboratory NH4-N ammonia nitrogen QA/QC Quality Assurance/Quality Control ppm parts per million PFRP process to further reduce pathogens, from 40CFR Part 503 PTSI Pegasus Technical Services, Inc. SRT sludge retention time SVI sludge volume index TKN total Kjeldahl nitrogen TP total phosphorus TSS total suspended solids TWAS thickened waste activated sludge, 1.5%-2.5% solids UC University of Cincinnati VAR vector attraction reduction, from 40CFR Part 503 VSS volatile suspended solids WAS waste activated sludge WTIC Water Technology Innovation Cluster WWTP wastewater treatment plant

x
Acknowledgments This research project and the preparation of this final report have been conducted by the National Risk Management Research Laboratory (NRMRL) of the U.S. Environmental Protection Agency (EPA) under Contract No. EP-C-11-006, Work Assignments 2-77 and 3-77 with Pegasus Technical Services, Inc. (PTSI) from October 2012 through September 2014.
Funds for this project were provided by the Environmental Technology Innovative Clusters Program (ETIC), a program operating within the EPA’s Office of Research and Development (ORD). Appreciation is extended to ETIC for selecting and underwriting the cost of this project.
The EPA/NRMRL Work Assignment Manager was Richard C. Brenner and Alternate Work Assignment Manager was Paul T. McCauley.
The following PTSI staff designed and assembled the experimental apparatus, conducted the experimental trials, performed the laboratory analyses, and prepared the final report with NRMRL input: Makram T. Suidan, Raghuraman Venkatapathy, Edith L. Holder, Robert J. Grosser, Yonggui Shan, Joshua P. Kickish, Elisha J. Bryan.
Dr. Suidan directed prior research at the University of Cincinnati to evaluate thermal oxidation technology for the treatment of anaerobically digested wastewater treatment plant (WWTP) sludges, and he was instrumental in the development of the concept for this project to apply the thermal-oxidation process to the treatment of aerobic WWTP sludges. Dr. Venkatapathy provided valuable advice on chemical engineering principles and experimental design. Ms. Holder performed nutrient analyses and oversaw data recording, reduction, and interpretation. She also assumed primary responsibility for the preparation of this report. Dr. Grosser conducted microbiological analyses, performed a literature review, and contributed to the final report. Mr. Shan assembled and operated the experiment system, collected experimental samples, adjusted system component performance as needed, and assisted with data analysis. Mr. Kickish carried out the large majority of the solids analyses. Ms. Bryan assisted with nutrient analyses.
Ms. Ann Dougherty, Sustainability Coordinator for Xavier University (Cincinnati, OH), under contract to PTSI, visited several wastewater treatment plants, performed extensive market and cost analysis, and developed several conceptual designs for the thermo-oxidation process. She authored Section 6.0 (Market Analysis, Conceptual Treatment Trains, and Cost Estimates) of this report and also contributed to Section 7.0 (Conclusions). Her expertise in this specialized area of technology development and market penetration/niche analysis was critical to completion of this report.
Finally, we wish to acknowledge the cooperation and assistance of the entire staff of the Mason, OH Water Reclamation Plant, especially Mr. Keith B. Collins, Director of Public Utilities, and Mr. Robert A. Beyer, Plant Operator III, in obtaining waste activated sludge (WAS) on a weekly basis as reactor feedstock for our experimental runs.
1
1.0 Description and Objectives 1.1 Introduction and Background
The biological treatment of wastewater, with biological growth primarily fueled by organic carbon (human waste) in the incoming wastewater and oxygen added to the system, generates activated sludge. The major portion of the activated sludge inventory after gravity settling is continuously recycled to the head of the secondary treatment aeration tank as return sludge to act as a ‘starter’ for new biological activity, and a smaller excess portion is wasted or removed from the system to optimize process efficiency. This second portion is called waste activated sludge (WAS).
Municipal wastewater treatment plant (WWTP) sludge is typically composed of a combination of raw sludge from primary treatment and WAS that is digested, either anaerobically or aerobically, to achieve solids mass reduction, vector attraction reduction (VAR), and a reduction in microbial indicators of fecal contamination such as fecal coliforms. In most cases, the digested sludge is subjected to mechanical dewatering to produce a drier material that can be incinerated, disposed of in a sanitary landfill, or applied in bulk to agricultural land as biosolids. Some producers of biosolids further dry the processed material to the point where it can be bagged and sold as a commercial soil conditioner/fertilizer (e.g., Milorganite™ produced by the Milwaukee Metropolitan Sewerage District).
WWTP sludge is generally processed to levels where it can meet Federal Class B sludge regulations. The Class B regulations represent the minimum levels of pathogen reduction that are acceptable for land application of biosolids (i.e., treated WWTP sludge). These regulations specify that wastewater sludge must be treated by a process to further reduce pathogens (PFRP) that will achieve a VAR goal of 38% reduction in volatile suspended solids (VSS) concentrations or meet a fecal coliform level in the processed sludge ≤ 2,000,000 MPN (Most Probable Number)/g, or alternately ≤ 2,000,000 CFU (Colony Forming Units)/g, based on the geometric mean of seven samples. Some states require municipal WWTPs to meet both stipulations to achieve a Class B rating. PFRPs include, among others, anaerobic sludge digestion at a mean cell residence time (MCRT) of 15 days at a temperature of 35oC-55oC and aerobic sludge digestion at a MCRT of 40 days at 20oC.
Land application of Class B biosolids, although widely practiced in the United States, has been accompanied by numerous and ongoing public complaints over the years. These complaints range from emanation of malodors from the applied fields to claims of illnesses caused by volatilization of harmful compounds contained in the biosolids or direct contact with the biosolids. These complaints can be circumvented and most likely dispelled by the land application of biosolids treated to a higher level, namely Class A biosolids. The definition of Class A biosolids mandates the reduction of fecal coliforms to < 1,000 MPN/g total dry solids or reduction of Salmonella to < 3 MPN/4 g total dry solids in order to prevent regrowth of bacteria. This requirement can be met at one of these times: 1) when used for bulk application to
2
agricultural land or otherwise disposed, 2) when prepared for sale in bags or other containers for domestic gardening use, or 3) when prepared to meet the requirements for Exceptional Quality (EQ, refers to metal concentration limits).
1.2 Objectives
The objectives of this research project were to evaluate and optimize a new cost effective thermo-oxidation sludge treatment process that meets Class A regulations and to generate a reliable dataset that could substantiate these claims. Accomplishment of these objectives was expected to result in the filing of a process patent application for production of Class A biosolids for bulk spreading to agricultural land as a high-grade soil conditioner. A long-term goal of future studies would be the optimization of process variables and equipment selections (possibly through a licensing arrangement) and incorporation of additional sludge drying into the process for production of a combination soil conditioner/fertilizer that can be sold for home use in bags. Successful development of a dry, baggable soil conditioner/fertilizer would be anticipated to support the subsequent filing of a product patent application.
In addition to presenting the data generated on this project and evaluating the performance of the thermo-oxidation treatment process, this report includes a market niche evaluation of this process, a conceptual design for two operating scenarios, construction and operating cost estimates for the target market, and comparison with existing technologies. The rationale for including this information in this report is to provide the reader with an understanding of the potential applicability of this process in the real world.
1.3 Technology Description
The proposed thermo-oxidation process uses hydrogen peroxide (H2O2) addition at elevated temperatures to achieve increased levels of VSS destruction and VAR and disinfection of sludge that has been previously treated with some level of biological treatment, either anaerobic or aerobic. Previous research conducted at the University of Cincinnati (UC) has demonstrated reduction in fecal coliforms to non-detection levels on a combination of primary sludge and WAS treated in high-rate or short-term anaerobic digesters with a sludge retention time (SRT) of 5 days followed by thermo-oxidation (Cacho Rivero, 2005). It was postulated that the thermo-oxidation process would work equally well on aerobically digested sludge, highly oxidized aerobic sludge (mixed liquor) taken directly from an extended aeration or oxidation ditch activated sludge reactor, and possibly even mixed liquor taken from a lower-SRT conventional activated sludge aeration tank. The theory behind this mating of first-stage biological treatment with follow-on second stage thermo-oxidation (chemical) treatment is to use the microorganisms in the biological treatment stage to cost-effectively oxidize (aerobic treatment) or reduce (anaerobic treatment) most of the easy-to-degrade organics contained in the sludge matrix and to use the more expensive chemical (H2O2) treatment to oxidize the more recalcitrant organic compounds that are not easily degraded biologically. Using H2O2 to oxidize easy-to-degrade organics would substantially increase chemical dose requirements and cost. Likewise, using microorganisms to process the more difficult-to-degrade organics would result in long MCRTs and large reactors, again at increased cost. The proposed two-stage scenario optimizes what each stage of the sludge treatment train does best and most cost-effectively.
3
Because the thermo-oxidation step acts as a rigorous final treatment stage that oxidizes residual organics not removed in the preceding biological treatment phase, this stage does not have to be as large as typically designed for and installed in conventional WWTPs. Thus, short-term anaerobic or aerobic sludge digesters could be used instead of the conventional 15-day anaerobic digester SRT and the conventional 40-day aerobic digester SRT. These smaller digestion facilities represent significant potential capital and operating cost savings to the municipal WWTP. Given the potential ability of the H2O2 treatment reactor to cost-effectively handle a fairly broad range of incoming sludge feed characteristics, it was postulated that possibly no prior sludge digestion step may be required. Rather, the highly oxidized mixed liquor sludge produced in an extended aeration activated sludge plant and possibly even less oxidized conventional activated sludge mixed liquor (i.e., WAS) may be suitable for direct injection into the thermo-oxidation reactor. Under this scenario, the thermo-oxidation process would be able to accommodate undigested sludge feedstocks typically produced by municipal WWTPs, including settled mixed liquor from an extended aeration secondary treatment system and possibly settled mixed liquor produced by a conventional activated sludge system.
Another potential benefit of the thermo-oxidation process was that it was believed a fraction of the nitrogen (particularly ammonia nitrogen [NH4-N]) inventory in the H2O2 feed sludge would be solubilized during treatment in the thermo-oxidation reactor and recycled to the treatment plant headwords in the reactor supernatant. If this did not happen, the entire nutrient load would be transported to the application field in the biosolids. A significant fraction of this load, particularly the easily released NH4 component, would be rapidly solubilized and discharged into the soil, potentially exceeding the sorption capacity of the soil and contaminating ground and surface waters. By removing the easily released nutrient components in the WWTP, the nutrients more tightly bound to the biosolids would be released slowly as needed for soil conditioning and fertilization.
4
2.0 Feed Waste Activated Sludge Selection 2.1 Description of Wastewater Treatment Plants Considered
Five WWTPs in the Greater Cincinnati, OH area were visited, sampled, and considered as candidates from which WAS would be collected on a routine basis as the feed sludge for the thermo-oxidation project experimental runs. All five WWTPs use activated sludge for their secondary biological treatment process. Only activated sludge systems with extended or long SRTs were considered. None of the five utilize primary settling of raw influent sludge and, therefore, do not produce primary sludge. In all five cases, the entire excess sludge mass is generated as WAS withdrawn daily from their activated sludge aeration tanks and directed either to aerobic digesters or gravity or mechanical thickeners prior to sludge dewatering. Following dewatering, the WAS biosolids are either applied directly on agricultural land or, in one case, further dried to a pelletized form before land application.
The five WWTPs were the Harrison Wastewater Treatment Plant, the Lebanon Wastewater Treatment Plant, the Mason Water Reclamation Plant, the Sycamore Creek Wastewater Treatment Plant, and the Lesourdsville Upper Mill Creek Water Reclamation Facility. Four of the five WWTPs utilize oxidation ditch (continuously circulating in the mode of a race track) aeration tanks; the fifth (Sycamore Creek) employs conventional plug flow extended aeration tankage. The Mason WWTP utilizes the above-mentioned drying process to produce pelletized biosolids.
Raw wastewater samples were collected from four of the five WWTPs (all but Harrison). Aeration tank mixed liquor samples were taken from all five WWTPs. The Harrison, Lebanon, and Lesourdsville Upper Mill Creek WWTPs employ aerobic sludge digesters following secondary treatment. Samples of aerobically digested sludge from these three WWTPs were collected. The Mason WWTP routes its WAS in sequence through: 1) gravity thickeners, 2) aerated sludge holding tanks (that serve as abbreviated aerobic sludge digesters), 3) centrifugation dewatering, and 4) a Komline-Sanderson paddle dryer to produced dry (≥ 95%) biosolids. Samples were taken from the aerated sludge holding tanks for the Mason WWTP. WAS from the Sycamore WWTP is stored in holding tanks for a short period and then trucked to a large metropolitan WWTP in Cincinnati for final disposal. Therefore, mixed liquor from the secondary aeration tanks was the only type of sludge sample collected from the Sycamore WWTP.
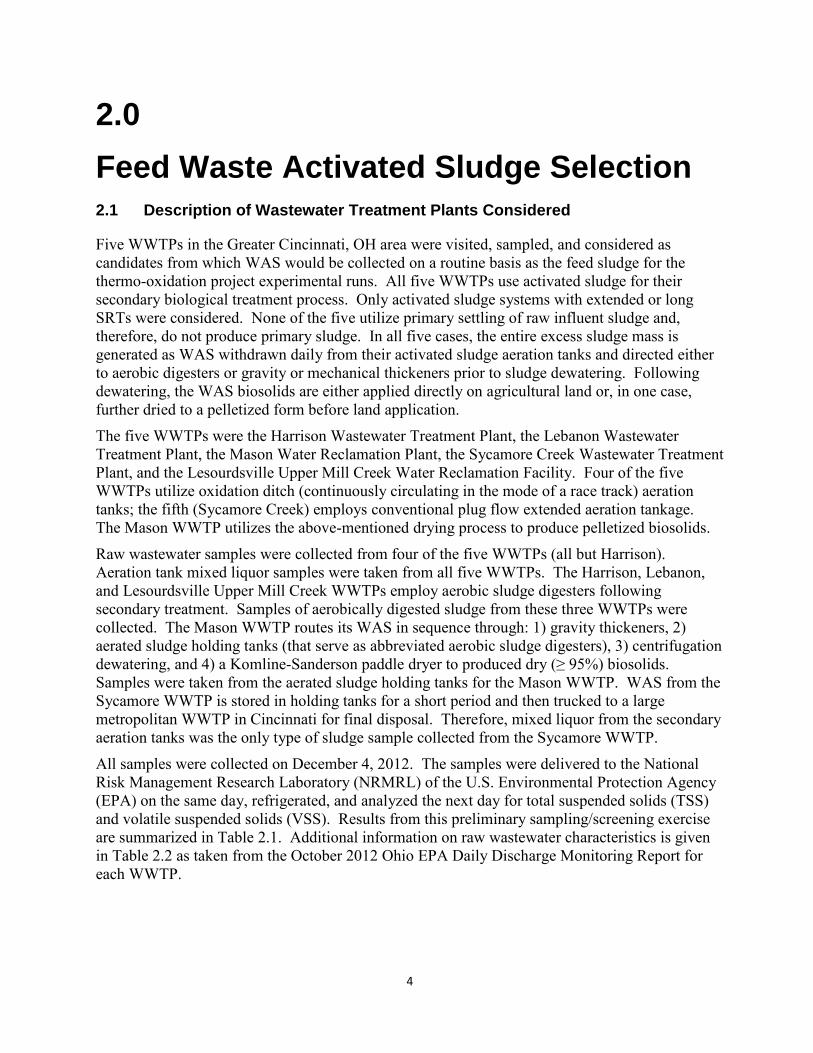
All samples were collected on December 4, 2012. The samples were delivered to the National Risk Management Research Laboratory (NRMRL) of the U.S. Environmental Protection Agency (EPA) on the same day, refrigerated, and analyzed the next day for total suspended solids (TSS) and volatile suspended solids (VSS). Results from this preliminary sampling/screening exercise are summarized in Table 2.1. Additional information on raw wastewater characteristics is given in Table 2.2 as taken from the October 2012 Ohio EPA Daily Discharge Monitoring Report for each WWTP.
5
Table 2.1. Results of Preliminary Sampling of Five WWTPs in the Greater Cincinnati, OH Area
Influent WW, mg/L Mixed Liquor, mg/L Aerobic Digester, mg/L
WWTP TSS VSS % VSS TSS VSS % VSS TSS VSS % VSS
Harrison * * * 1,681 1,432 85.3 11,002 9,142 83.1
Lebanon 117 107 91.5 2,863 2,443 85.3 13,880 11,400 82.1
Lesourdsville 468 395 84.4 2,558 2,193 85.7 13,573 11,463 84.5
Mason 227 202 89.2 2,069 1,650 79.6 19,510† 14,220† 72.9† Sycamore
Creek 166 157 95.4 3,713 3,060 82.4 ‡ ‡ ‡
* Not sampled † Sampled from sludge holding tank ‡ No aerobic digester available
Table 2.2. Wastewater Characteristics for October 2012 for Five WWTPs in the Greater Cincinnati Area
WWTP Influent Flow, mgd Raw WW Total BOD5, mg/L Raw WW TSS, mg/L
Harrison 0.91 349 349
Lebanon 2.07 159 157
Lesourdsville 6.76 143 328
Mason 4.96 238 349
Sycamore Creek 5.51 98 101
2.2 Rationale for Selection of Mason Wastewater Treatment Plant
The goal in screening several extended aeration WWTPs in the Greater Cincinnati area was to enable selection of a WWTP that best fit the application for which the thermo-oxidation sludge treatment process is envisioned, i.e., a WWTP with lower flows treating primarily domestic wastewater. Accordingly, the ideal WWTP would have an average monthly influent flow rate in the range of 2-10 million gallons per day (mgd) and similar raw wastewater five-day biochemical oxygen demand (BOD5) and TSS concentrations in the range of 150-350 mg/L. So that all experiments could be run with the same solids content of 1.5%, it was also important to locate a suitable sludge source with a concentration of at least 1.5% TSS. Feed sludge could then be diluted with secondary effluent from the same WWTP, but it would not have to be thickened using more cumbersome methodology such as porous pots to reach the feed goal.
The Mason WWTP best met the criteria. It is equipped with an Eimco Water Technologies Carrousel™ oxidation ditch with an activated sludge mixed liquor SRT of approximately 25 days. The nominal aeration detention time is 20-27 hours. With an average raw wastewater flow for October 2012 of approximately 5 mgd consisting mostly of domestic sewage, it met the target influent flow rate of 2-10 mgd. To eliminate the complicating factors of heavy metals or other
6
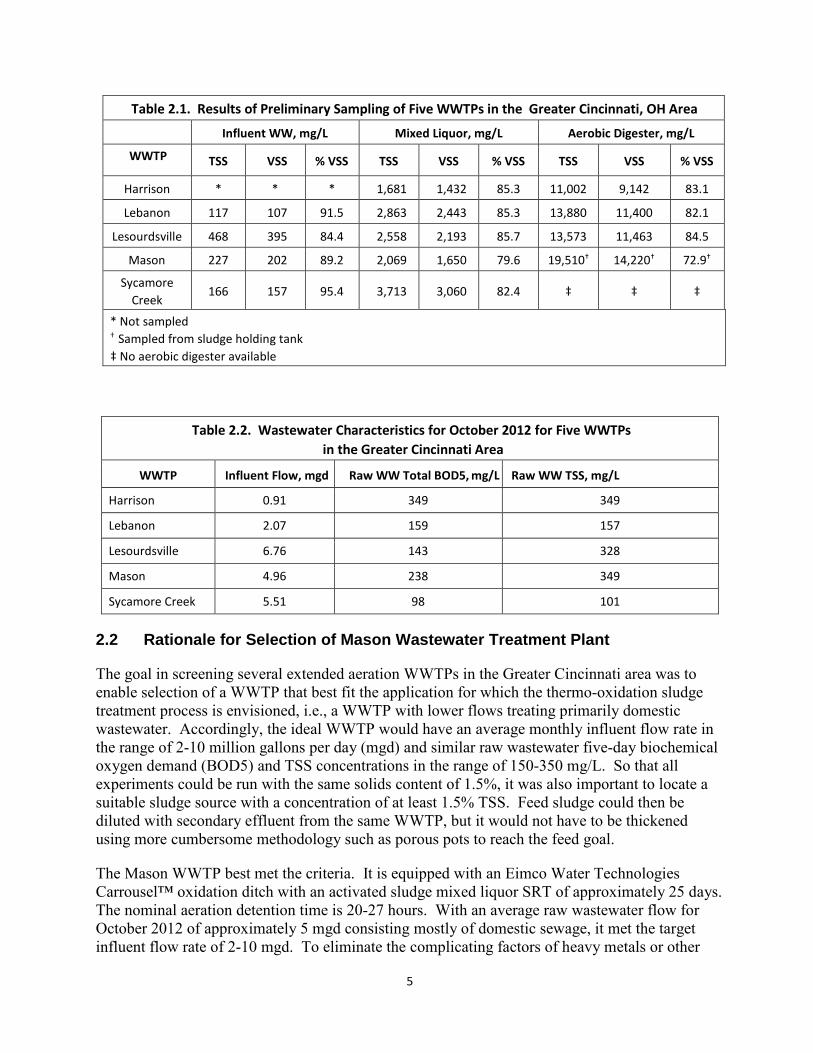
industrial chemicals, a WWTP with minimal industrial contribution, such as Mason’s was preferred. It met the target influent BOD5 concentration range for all months in 2012 (data not shown), and with two exceptions (358 mg/L in July and 386 mg/L in September), it also met the target TSS concentration range. Another favorable parameter in choosing Mason was that it was the only WWTP surveyed on December 4, 2012 that had a thickened WAS (TWAS) TSS concentration ≥ 1.5% or 15,000 mg/L (see first column under aerobic digester in Table 2.1). Finally, we were afforded easy access to the plant, and the plant management was very cooperative. It was, therefore, an easy choice as the feed sludge source. A flow diagram of the Mason WWTP is shown in Figure 2.1. An aerial photograph of the plant is given in Figure 2.2.
Figure 2.1. Flow Diagram of Mason Water Reclamation Plant
Average monthly influent flow, influent total BOD5, and influent TSS values are presented in Table 2.3 for 2013, the period during which TWAS samples were being collected from the Mason WWTP for experimental runs. These data provide additional validation in selecting the Mason plant as the sludge source. Monthly maximum/average flow ratios, with two exceptions, ranged from 1.5-1.8, indicating a tight (minimal leaks) sewer system. Average influent flow rates, average influent total BOD5, with one exception, and average influent TSS, with two exceptions, were all within the target ranges.
7
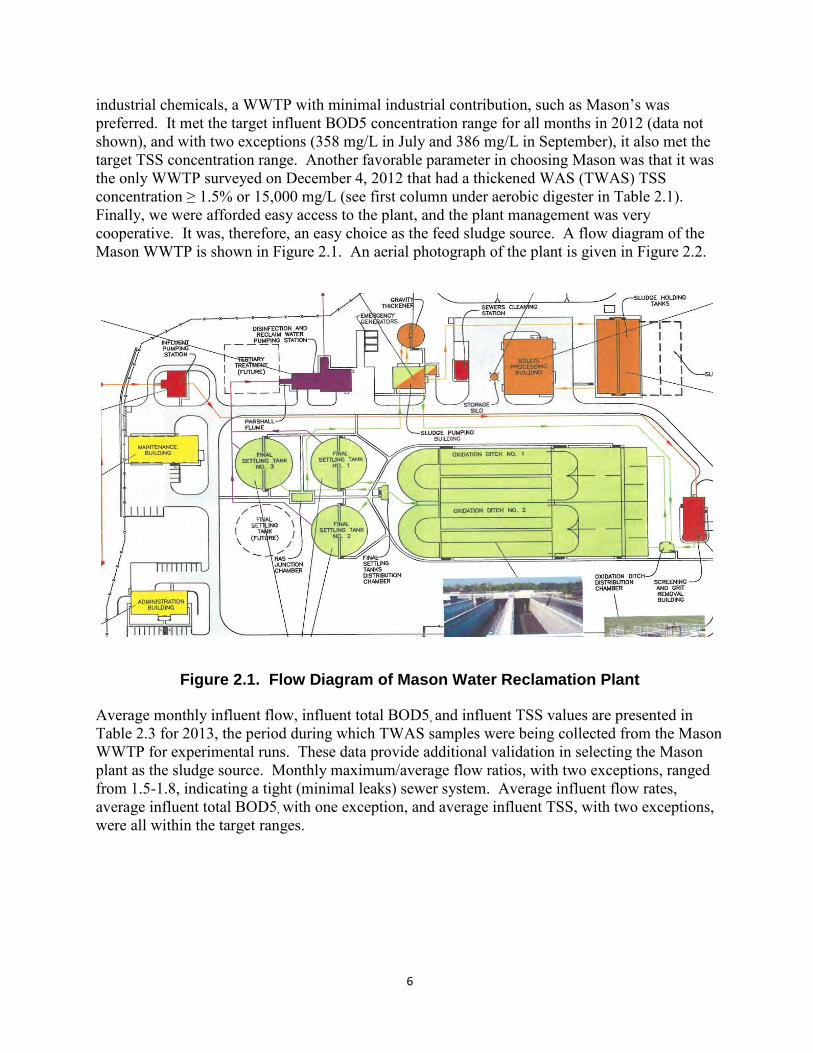
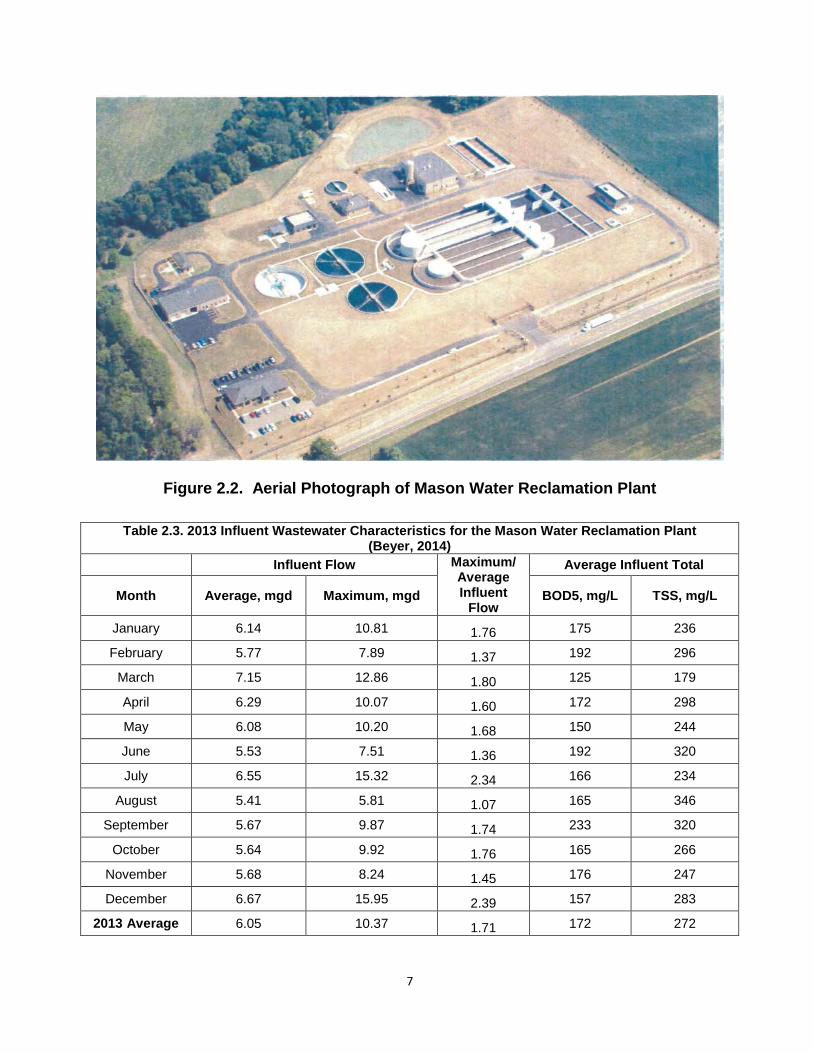
Figure 2.2. Aerial Photograph of Mason Water Reclamation Plant
Table 2.3. 2013 Influent Wastewater Characteristics for the Mason Water Reclamation Plant (Beyer, 2014)
Influent Flow Maximum/ Average Influent
Flow
Average Influent Total
Month Average, mgd Maximum, mgd BOD5, mg/L TSS, mg/L
January 6.14 10.81 1.76 175 236
February 5.77 7.89 1.37 192 296
March 7.15 12.86 1.80 125 179
April 6.29 10.07 1.60 172 298
May 6.08 10.20 1.68 150 244
June 5.53 7.51 1.36 192 320
July 6.55 15.32 2.34 166 234
August 5.41 5.81 1.07 165 346
September 5.67 9.87 1.74 233 320
October 5.64 9.92 1.76 165 266
November 5.68 8.24 1.45 176 247
December 6.67 15.95 2.39 157 283
2013 Average 6.05 10.37 1.71 172 272

8
In Table 2.4, average monthly plant effluent values are summarized. As indicated, effluent quality was excellent. Average monthly effluent total BOD5, TSS, NH4-N, and total Kjeldahl nitrogen (TKN) were all low. Some fraction of the oxidized nitrogen was denitrified in the aeration tank anoxic zone, while the remainder appeared in the plant effluent as nitrite/nitrate nitrogen (NO2-N + NO3-N).
Table 2.4. 2013 Final Effluent Characteristics for the Mason Water Reclamation Plant (Beyer, 2014)
Month Total
BOD5, mg/L
TSS, mg/L
Temperature, °C
NH4-N, mg/L
TKN, mg/L
NO2-N + NO3-N, mg/L
Total P, mg/L
January 2.0 3.0 12.9 ND 2.0 5.0 2.0
February 3.2 4.1 12.5 ND 0.9 5.9 1.8
March 2.7 3.9 12.6 ND 0.8 4.7 2.1
April 2.1 4.6 16.3 ND 1.2 5.0 1.7
May 0.6 2.7 20.4 ND 0.5 9.8 2.0
June 0.2 2.4 22.4 ND 1.2 4.4 0.5
July 0.7 5.3 23.2 ND 0.9 4.5 0.4
August 1.1 3.0 24.3 0.8 0.8 4.4 0.4
September ND 3.0 26.0 ND 0.7 4.6 0.4
October 0.6 3.6 20.3 ND ND 6.1 0.6
November 0.4 3.3 16.6 ND 1.1 5.4 1.2
December 0.4 4.2 14.1 ND 1.3 6.5 2.3 2013
Average 1.2 3.6 18.5 NA 1.0 5.5 1.3
ND = not detected; NA = not applicable
9
3.0 Experimental Design 3.1 Description of Experimental System
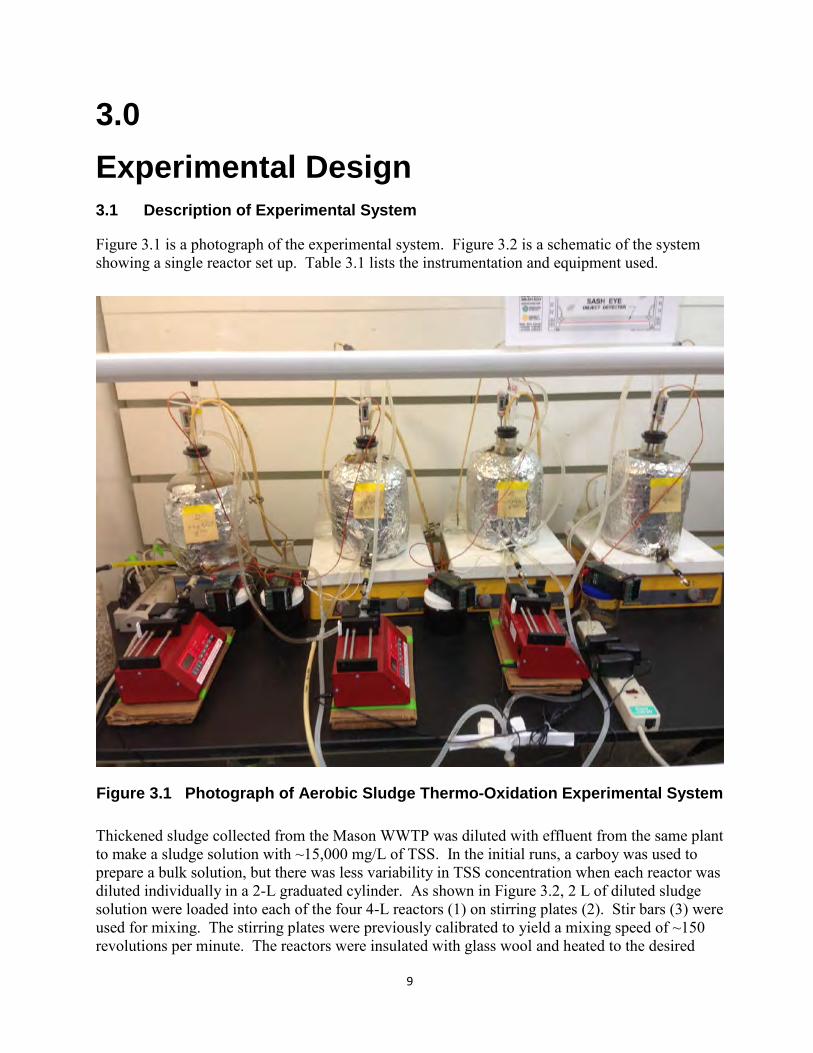
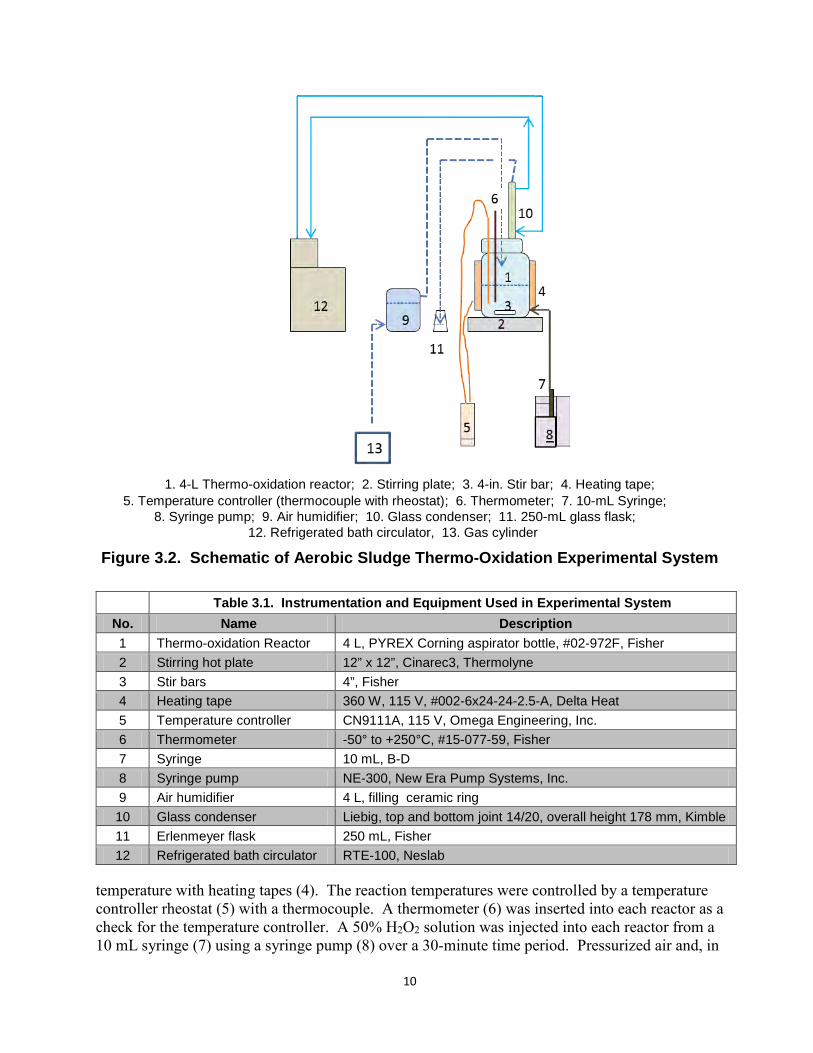
Figure 3.1 is a photograph of the experimental system. Figure 3.2 is a schematic of the system showing a single reactor set up. Table 3.1 lists the instrumentation and equipment used.
Figure 3.1 Photograph of Aerobic Sludge Thermo-Oxidation Experimental System
Thickened sludge collected from the Mason WWTP was diluted with effluent from the same plant to make a sludge solution with ~15,000 mg/L of TSS. In the initial runs, a carboy was used to prepare a bulk solution, but there was less variability in TSS concentration when each reactor was diluted individually in a 2-L graduated cylinder. As shown in Figure 3.2, 2 L of diluted sludge solution were loaded into each of the four 4-L reactors (1) on stirring plates (2). Stir bars (3) were used for mixing. The stirring plates were previously calibrated to yield a mixing speed of ~150 revolutions per minute. The reactors were insulated with glass wool and heated to the desired
10
1. 4-L Thermo-oxidation reactor; 2. Stirring plate; 3. 4-in. Stir bar; 4. Heating tape;5. Temperature controller (thermocouple with rheostat); 6. Thermometer; 7. 10-mL Syringe;
8. Syringe pump; 9. Air humidifier; 10. Glass condenser; 11. 250-mL glass flask;12. Refrigerated bath circulator, 13. Gas cylinder
Figure 3.2. Schematic of Aerobic Sludge Thermo-Oxidation Experimental System
Table 3.1. Instrumentation and Equipment Used in Experimental System No. Name Description 1 Thermo-oxidation Reactor 4 L, PYREX Corning aspirator bottle, #02-972F, Fisher 2 Stirring hot plate 12” x 12”, Cinarec3, Thermolyne 3 Stir bars 4”, Fisher 4 Heating tape 360 W, 115 V, #002-6x24-24-2.5-A, Delta Heat 5 Temperature controller CN9111A, 115 V, Omega Engineering, Inc. 6 Thermometer -50° to +250°C, #15-077-59, Fisher 7 Syringe 10 mL, B-D 8 Syringe pump NE-300, New Era Pump Systems, Inc. 9 Air humidifier 4 L, filling ceramic ring 10 Glass condenser Liebig, top and bottom joint 14/20, overall height 178 mm, Kimble 11 Erlenmeyer flask 250 mL, Fisher 12 Refrigerated bath circulator RTE-100, Neslab
temperature with heating tapes (4). The reaction temperatures were controlled by a temperature controller rheostat (5) with a thermocouple. A thermometer (6) was inserted into each reactor as a check for the temperature controller. A 50% H2O2 solution was injected into each reactor from a 10 mL syringe (7) using a syringe pump (8) over a 30-minute time period. Pressurized air and, in
11
some early experiments nitrogen from a cylinder, was passed through an air humidifier (9) and then distributed into the head space of each reactor through an inlet valve at ~ 200 mL/min. Purged air exited out of the reactors through a condenser (10) to limit evaporation and allow the condensate to flow back into each of the reactors. A small restrictor was installed in each condenser outlet, and the gas exited through an Erlenmeyer flask (11) containing 200 mL water to monitor direction of gas flow and to prevent back flow. Cooling water for the condensers was pumped through a refrigerated bath (12).
An experimental run consisted of an initial period of approximately 1 hour for the reactors to reach operating temperature. Time 0 was the initiation of H2O2 addition. Later sampling times were designated in hours after Time 0. The usual time points were 1, 2, 4, 6 or 8, and 24 hours. Since in an actual application, the sludge would be held probably no more than 4 hours, the later time points were sometimes eliminated.
3.2 Experimental Chronology and Conditions
Experimental trials were conducted from early December 2012 through September 2013. After initial measurements were conducted on samples collected from the five extended aeration WWTPs and selection of the Mason WWTP as our plant of choice for reactor feed WAS, a series of trials were performed from January 2013 through July 2013 at reactor temperatures ranging from 60°C to 90°C. The initial runs utilized reactor purging with air vs. nitrogen gas. After no observable difference, air was used as the purge gas for all subsequent trials. At the conclusion of the trials, in August and early September 2013, test runs were conducted using sludge from four other local WWTPs (two of the five WWTPs surveyed during our preliminary sludge selection study plus two others in the local area) at the reactor temperature and H2O2 dosage determined to be optimal in the Mason WWTP trials.
3.3 Methods
Measurements of TSS and VSS, fecal coliform MPN, COD, nutrients (NH4-N, TP, and for some runs TKN) and sludge settleability were performed using the following methods:
Hach Company, Methods for measuring nutrients, http://www.hach.com/ Ammonia Nitrogen, Salicylate Method # 10031 Total Kjeldahl Nitrogen, Nessler Method # 8075 Chemical Oxygen Demand, Reactor Digestion Method # 8000 Total Phosphorus, Acid Persulfate Digestion Method # 10127
IDEXX Inc., Colilert 18 Fecal Coliform Protocol, http://www.idexx.com/resourcelibrary/water/colilert-18-procedure-en.pdf and http://www.idexx.com/resourcelibrary/water/water-reg-article5CV-v2.pdf
TSS and VSS: SOP: Determination of Total Suspended Solids (TSS) and Volatile Suspended Solids (VSS) in Water, Wastewater, Activated Sludge, and Aqueous Extracts, Pegasus Technical Services for U.S. Environmental Agency Contract EP-C-11-006, Revision 2. July 27, 2011.
Sludge Volume Index (SVI) and Settling: Standard Methods for the Examination of Water and Wastewater. 20th Ed. American Public Health Association, American Water Works Association, Water Environment Federation. Method # 2710
12
The guidance document for this project is U.S. EPA Quality Assurance Project Plan, Category III Measurement Project, QAPP ID # L18881-QP-1-0, Thermo-Oxidation of Municipal Wastewater Treatment Plant Sludge for Production of Class A Biosolids, approved on April 26, 2013 and is attached as Appendix B.
The U. S. EPA Health and Safety Plan for this project is HASP ID # 2012-086, Rev. 1, approved January 11, 2013.
3.4 Quality Assurance/Quality Control Considerations
The transformations that must take place to produce a Class A biosolids from an untreated WAS source stream involve the mass reduction of VSS, a reduction in vector attraction, an increase in sludge stability, and destruction of pathogenic microorganisms. A chemical oxidant and heat (i.e., elevated temperature less than boiling) were added to untreated WAS within a confined reactor to effect these transformations. H2O2 due to its predictable properties, ease of handling, and relatively low cost was selected as the oxidant of choice.
Although H2O2 and heat are known oxidants by themselves, they had not previously been applied in combination to WAS to synergistically enhance sludge oxidation/destruction and stabilization. Four H2O2 doses were selected for evaluation: no H2O2 (control) and 0.05, 0.1, and 0.2 g H2O2/g applied VSS. Reactor temperatures evaluated ranged from 60°C to 90°C. It was decided to operate at temperatures below the boiling point of water as this would simplify possible future full-scale operation and maintenance requirements and lower construction costs.
While H2O2 dose and applied heat were the two independent variables selected for examination, two dependent variables, time of reaction and WAS characteristics, required consideration in the experimental design. It was not known a priori how much reaction time would be required to reach an acceptable level of WAS treatment. A decision was made to use VSS destruction as the measurement metric to define degree of treatment achieved as a function of time. It was expected that VSS destruction would approach an asymptotic maximum with increasing reaction time beyond which further treatment would have no additional oxidative potential. Consequently, the experimental design included WAS sample collection from the reactors at detention times of 1, 2, 4, 8, and 24 hours to define the VSS die-off or destruction curve.
The use of sequential replicate experiments was the primary quality assurance/quality control (QA/QC) mechanism built into our experimental design protocol to achieve consistent performance and minimal deviation of results. Accuracy checks, precision calculations, calibration of instrumentation, and determination of detection limits were used to ensure acceptable QC and confidence levels for the obtained results. Precise, documented, and validated data were needed to support the ultimate decisions made. To ensure the quality of the data, all instruments were regularly calibrated and QA/QC checks were routinely performed. All TSS and VSS measurements were performed in triplicate.
13
4.0 Results and Discussion 4.1 Overview of Experiments
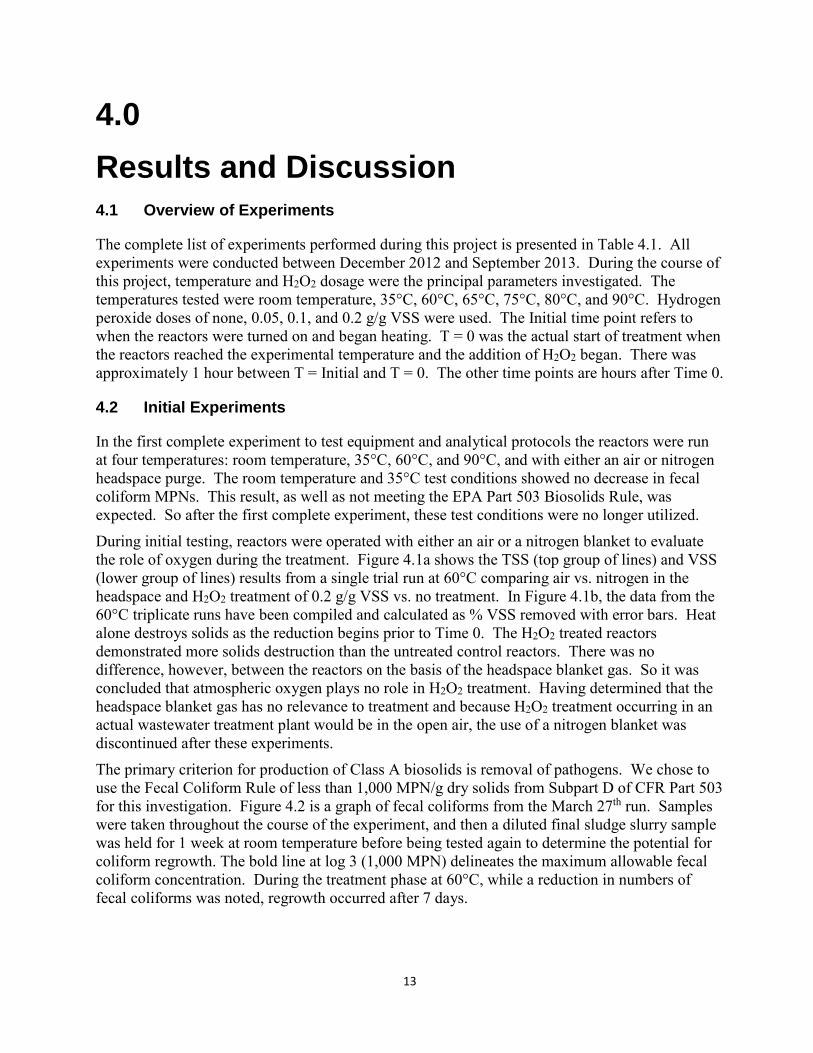
The complete list of experiments performed during this project is presented in Table 4.1. All experiments were conducted between December 2012 and September 2013. During the course of this project, temperature and H2O2 dosage were the principal parameters investigated. The temperatures tested were room temperature, 35°C, 60°C, 65°C, 75°C, 80°C, and 90°C. Hydrogen peroxide doses of none, 0.05, 0.1, and 0.2 g/g VSS were used. The Initial time point refers to when the reactors were turned on and began heating. T = 0 was the actual start of treatment when the reactors reached the experimental temperature and the addition of H2O2 began. There was approximately 1 hour between T = Initial and T = 0. The other time points are hours after Time 0.
4.2 Initial Experiments
In the first complete experiment to test equipment and analytical protocols the reactors were run at four temperatures: room temperature, 35°C, 60°C, and 90°C, and with either an air or nitrogen headspace purge. The room temperature and 35°C test conditions showed no decrease in fecal coliform MPNs. This result, as well as not meeting the EPA Part 503 Biosolids Rule, was expected. So after the first complete experiment, these test conditions were no longer utilized.
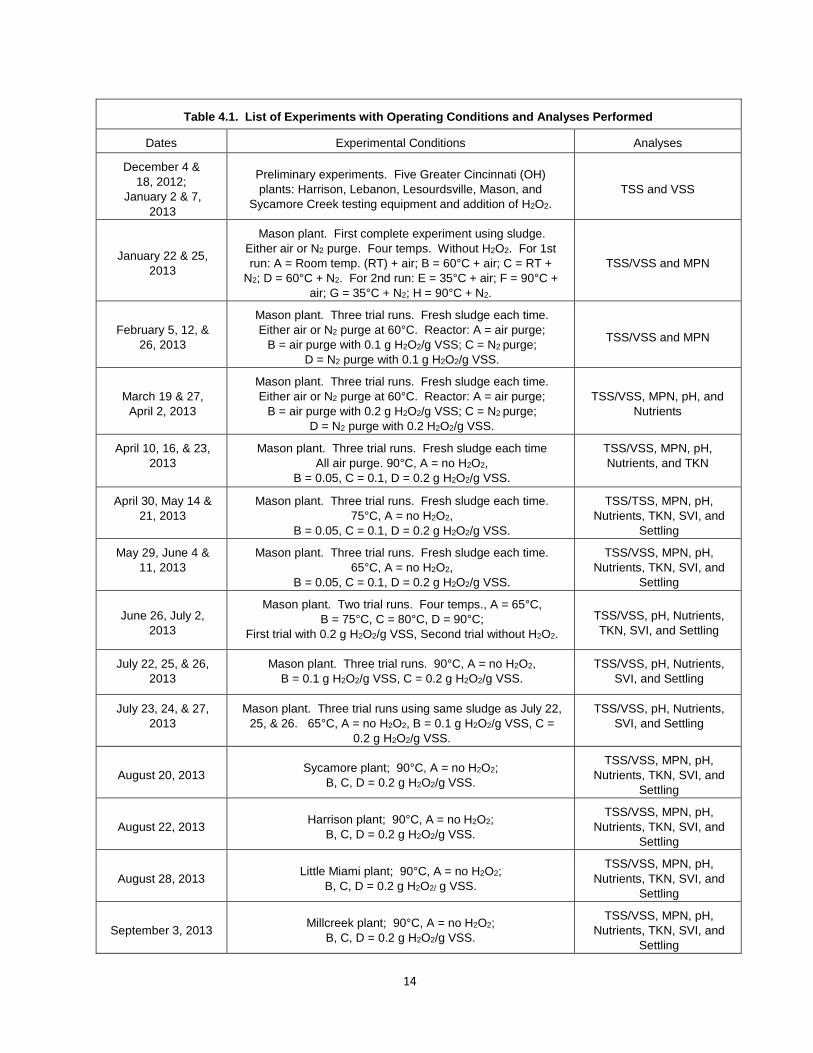
During initial testing, reactors were operated with either an air or a nitrogen blanket to evaluate the role of oxygen during the treatment. Figure 4.1a shows the TSS (top group of lines) and VSS (lower group of lines) results from a single trial run at 60°C comparing air vs. nitrogen in the headspace and H2O2 treatment of 0.2 g/g VSS vs. no treatment. In Figure 4.1b, the data from the 60°C triplicate runs have been compiled and calculated as % VSS removed with error bars. Heat alone destroys solids as the reduction begins prior to Time 0. The H2O2 treated reactors demonstrated more solids destruction than the untreated control reactors. There was no difference, however, between the reactors on the basis of the headspace blanket gas. So it was concluded that atmospheric oxygen plays no role in H2O2 treatment. Having determined that the headspace blanket gas has no relevance to treatment and because H2O2 treatment occurring in an actual wastewater treatment plant would be in the open air, the use of a nitrogen blanket was discontinued after these experiments.
The primary criterion for production of Class A biosolids is removal of pathogens. We chose to use the Fecal Coliform Rule of less than 1,000 MPN/g dry solids from Subpart D of CFR Part 503 for this investigation. Figure 4.2 is a graph of fecal coliforms from the March 27th run. Samples were taken throughout the course of the experiment, and then a diluted final sludge slurry sample was held for 1 week at room temperature before being tested again to determine the potential for coliform regrowth. The bold line at log 3 (1,000 MPN) delineates the maximum allowable fecal coliform concentration. During the treatment phase at 60°C, while a reduction in numbers of fecal coliforms was noted, regrowth occurred after 7 days.
14
Table 4.1. List of Experiments with Operating Conditions and Analyses Performed
Dates Experimental Conditions Analyses
December 4 & 18, 2012;
January 2 & 7, 2013
Preliminary experiments. Five Greater Cincinnati (OH) plants: Harrison, Lebanon, Lesourdsville, Mason, and
Sycamore Creek testing equipment and addition of H2O2. TSS and VSS
January 22 & 25, 2013
Mason plant. First complete experiment using sludge. Either air or N2 purge. Four temps. Without H2O2. For 1st run: A = Room temp. (RT) + air; B = 60°C + air; C = RT +
N2; D = 60°C + N2. For 2nd run: E = 35°C + air; F = 90°C + air; G = 35°C + N2; H = 90°C + N2.
TSS/VSS and MPN
February 5, 12, & 26, 2013
Mason plant. Three trial runs. Fresh sludge each time. Either air or N2 purge at 60°C. Reactor: A = air purge;
B = air purge with 0.1 g H2O2/g VSS; C = N2 purge; D = N2 purge with 0.1 g H2O2/g VSS.
TSS/VSS and MPN
March 19 & 27, April 2, 2013
Mason plant. Three trial runs. Fresh sludge each time. Either air or N2 purge at 60°C. Reactor: A = air purge;
B = air purge with 0.2 g H2O2/g VSS; C = N2 purge; D = N2 purge with 0.2 H2O2/g VSS.
TSS/VSS, MPN, pH, and Nutrients
April 10, 16, & 23, 2013
Mason plant. Three trial runs. Fresh sludge each time All air purge. 90°C, A = no H2O2,
B = 0.05, C = 0.1, D = 0.2 g H2O2/g VSS.
TSS/VSS, MPN, pH, Nutrients, and TKN
April 30, May 14 & 21, 2013
Mason plant. Three trial runs. Fresh sludge each time. 75°C, A = no H2O2,
B = 0.05, C = 0.1, D = 0.2 g H2O2/g VSS.
TSS/TSS, MPN, pH, Nutrients, TKN, SVI, and
Settling
May 29, June 4 & 11, 2013
Mason plant. Three trial runs. Fresh sludge each time. 65°C, A = no H2O2,
B = 0.05, C = 0.1, D = 0.2 g H2O2/g VSS.
TSS/VSS, MPN, pH, Nutrients, TKN, SVI, and
Settling
June 26, July 2, 2013
Mason plant. Two trial runs. Four temps., A = 65°C, B = 75°C, C = 80°C, D = 90°C;
First trial with 0.2 g H2O2/g VSS, Second trial without H2O2. TSS/VSS, pH, Nutrients, TKN, SVI, and Settling
July 22, 25, & 26, 2013
Mason plant. Three trial runs. 90°C, A = no H2O2, B = 0.1 g H2O2/g VSS, C = 0.2 g H2O2/g VSS.
TSS/VSS, pH, Nutrients, SVI, and Settling
July 23, 24, & 27, 2013
Mason plant. Three trial runs using same sludge as July 22, 25, & 26. 65°C, A = no H2O2, B = 0.1 g H2O2/g VSS, C =
0.2 g H2O2/g VSS.
TSS/VSS, pH, Nutrients, SVI, and Settling
August 20, 2013 Sycamore plant; 90°C, A = no H2O2; B, C, D = 0.2 g H2O2/g VSS.
TSS/VSS, MPN, pH, Nutrients, TKN, SVI, and
Settling
August 22, 2013 Harrison plant; 90°C, A = no H2O2; B, C, D = 0.2 g H2O2/g VSS.
TSS/VSS, MPN, pH, Nutrients, TKN, SVI, and
Settling
August 28, 2013 Little Miami plant; 90°C, A = no H2O2; B, C, D = 0.2 g H2O2/ g VSS.
TSS/VSS, MPN, pH, Nutrients, TKN, SVI, and
Settling
September 3, 2013 Millcreek plant; 90°C, A = no H2O2; B, C, D = 0.2 g H2O2/g VSS.
TSS/VSS, MPN, pH, Nutrients, TKN, SVI, and
Settling
15
Figure 4.1a. TSS and VSS Reduction: Air vs. N2 in Headspace, H2O2 vs. No H2O2 Figure 4.1b. % VSS Removed at 60°C for Triplicate Runs
Figure 4.2. Fecal Coliform (MPN) Results, 60°C, Air vs. N2, 0.2 g H2O2/g VSS vs. No H2O2
16
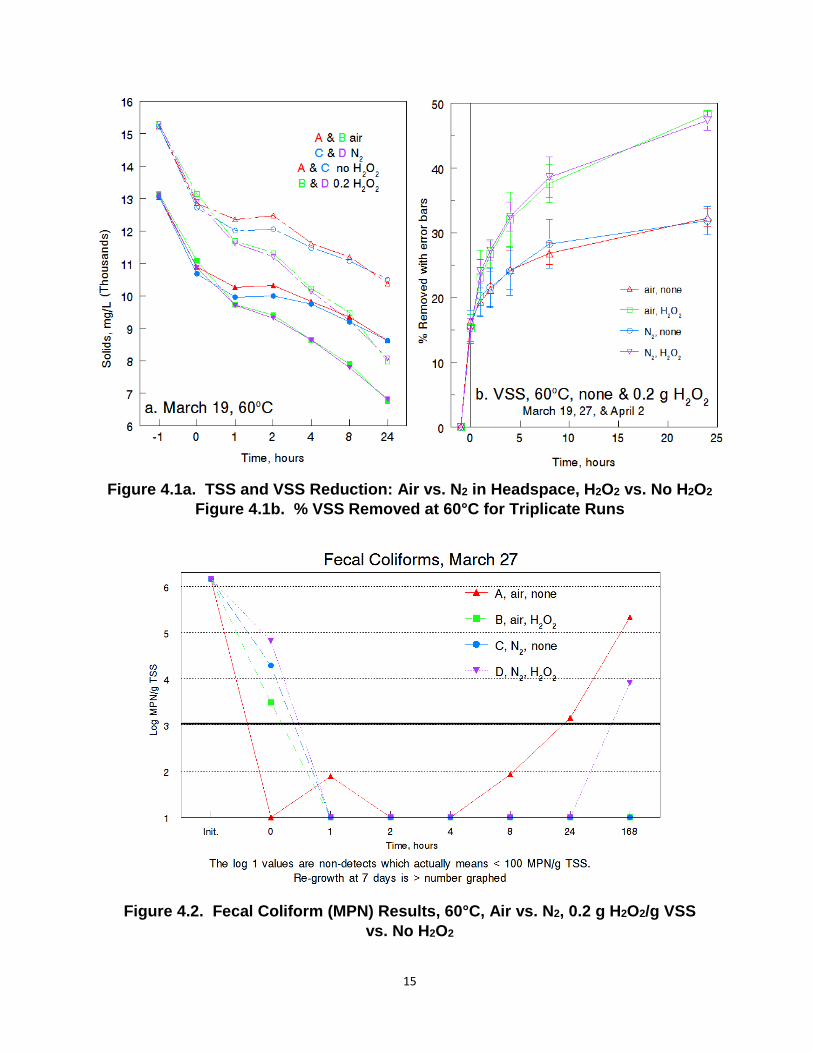
Another parameter tracked during this experiment was pH. It decreased with H2O2 treatment while remaining essentially unchanged without added H2O2. Figure 4.3 shows the trend in these triplicate runs. This result correlated with an increase in NH4-N. On average, NH4-N changed from 28 mg/L at the initial sample time to 108 mg/L in the control reactors to 400 mg/L in the H2O2 treated reactors at 24 hours. Measurements for COD and TP indicated little change (data not shown).
Figure 4.3. pH Results, 60°C, Air vs N2, 0.2 g H2O2/g VSS vs. No Added H2O2
4.3 Experiments at 90°C, 75°C, and 65°C
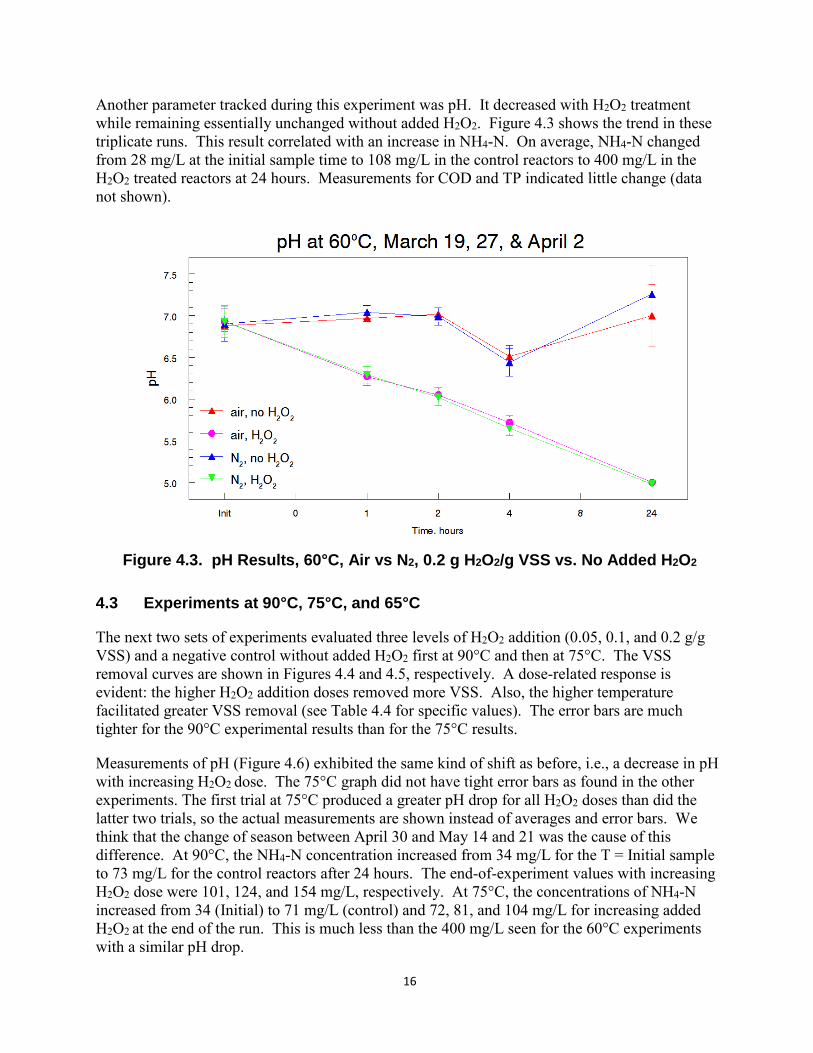
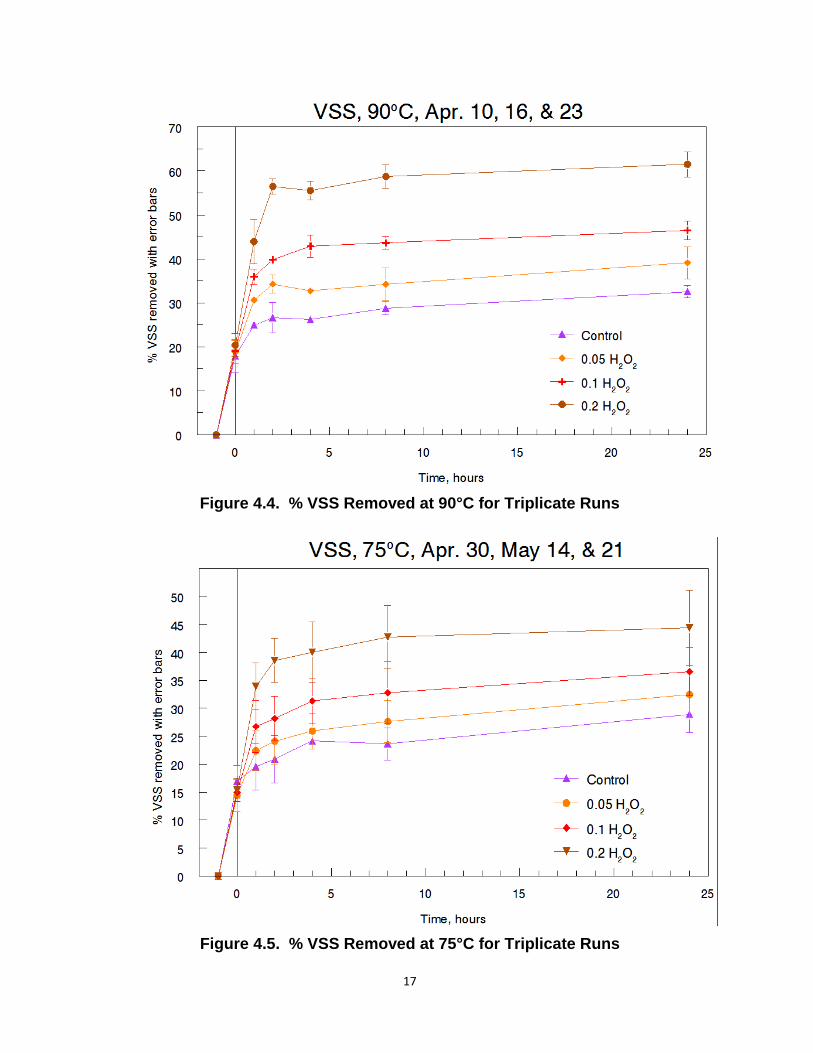
The next two sets of experiments evaluated three levels of H2O2 addition (0.05, 0.1, and 0.2 g/g VSS) and a negative control without added H2O2 first at 90°C and then at 75°C. The VSS removal curves are shown in Figures 4.4 and 4.5, respectively. A dose-related response is evident: the higher H2O2 addition doses removed more VSS. Also, the higher temperature facilitated greater VSS removal (see Table 4.4 for specific values). The error bars are much tighter for the 90°C experimental results than for the 75°C results.
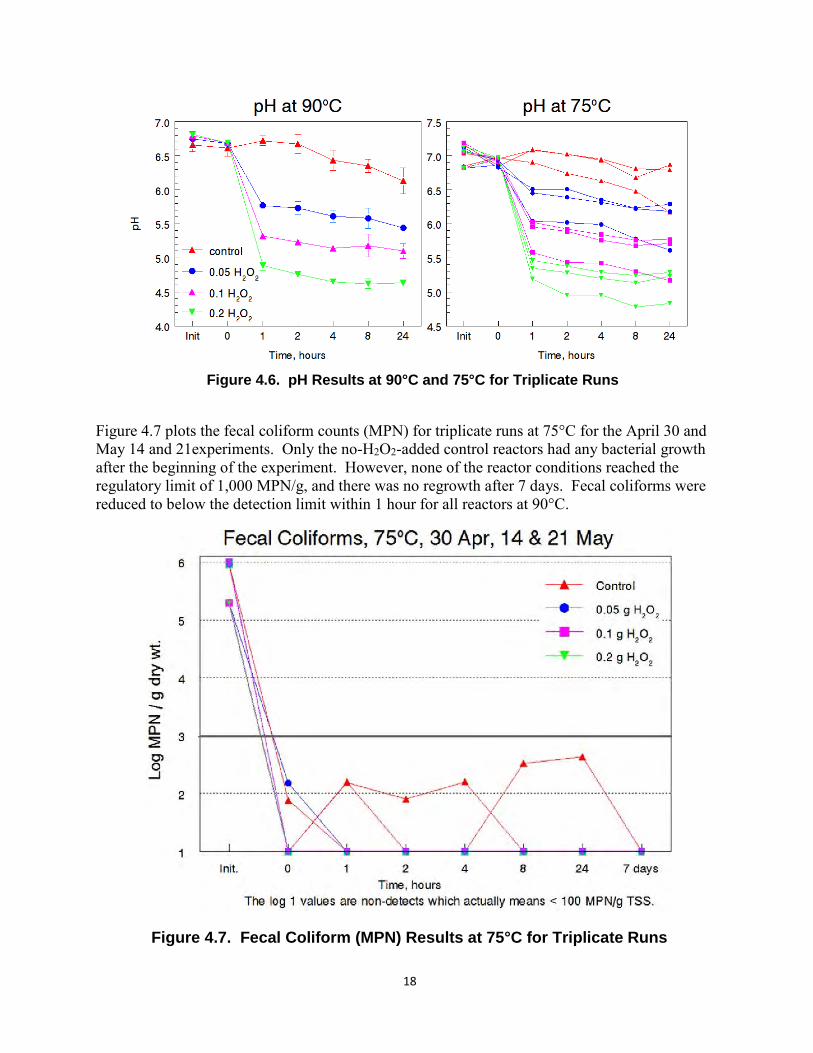
Measurements of pH (Figure 4.6) exhibited the same kind of shift as before, i.e., a decrease in pH with increasing H2O2 dose. The 75°C graph did not have tight error bars as found in the other experiments. The first trial at 75°C produced a greater pH drop for all H2O2 doses than did the latter two trials, so the actual measurements are shown instead of averages and error bars. We think that the change of season between April 30 and May 14 and 21 was the cause of this difference. At 90°C, the NH4-N concentration increased from 34 mg/L for the T = Initial sample to 73 mg/L for the control reactors after 24 hours. The end-of-experiment values with increasing H2O2 dose were 101, 124, and 154 mg/L, respectively. At 75°C, the concentrations of NH4-N increased from 34 (Initial) to 71 mg/L (control) and 72, 81, and 104 mg/L for increasing added H2O2 at the end of the run. This is much less than the 400 mg/L seen for the 60°C experiments with a similar pH drop.
17
Figure 4.4. % VSS Removed at 90°C for Triplicate Runs
Figure 4.5. % VSS Removed at 75°C for Triplicate Runs
18
Figure 4.6. pH Results at 90°C and 75°C for Triplicate Runs
Figure 4.7 plots the fecal coliform counts (MPN) for triplicate runs at 75°C for the April 30 and May 14 and 21experiments. Only the no-H2O2-added control reactors had any bacterial growth after the beginning of the experiment. However, none of the reactor conditions reached the regulatory limit of 1,000 MPN/g, and there was no regrowth after 7 days. Fecal coliforms were reduced to below the detection limit within 1 hour for all reactors at 90°C.
Figure 4.7. Fecal Coliform (MPN) Results at 75°C for Triplicate Runs
19
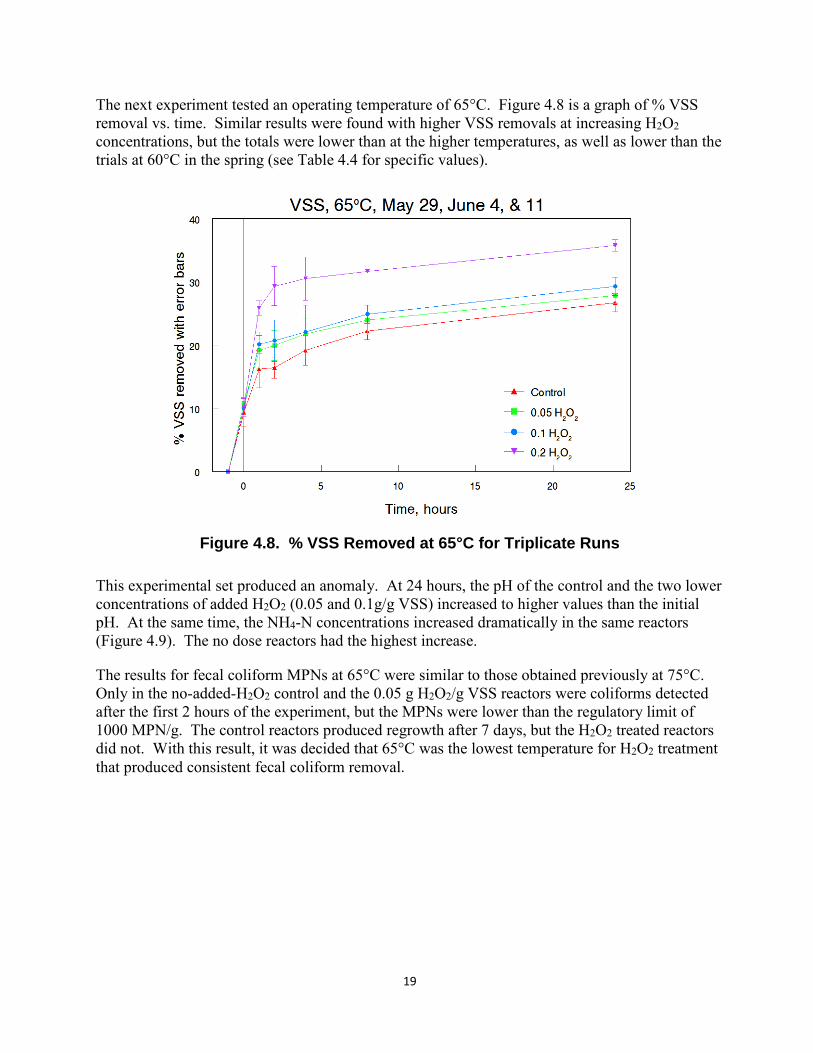
The next experiment tested an operating temperature of 65°C. Figure 4.8 is a graph of % VSS removal vs. time. Similar results were found with higher VSS removals at increasing H2O2 concentrations, but the totals were lower than at the higher temperatures, as well as lower than the trials at 60°C in the spring (see Table 4.4 for specific values).
Figure 4.8. % VSS Removed at 65°C for Triplicate Runs
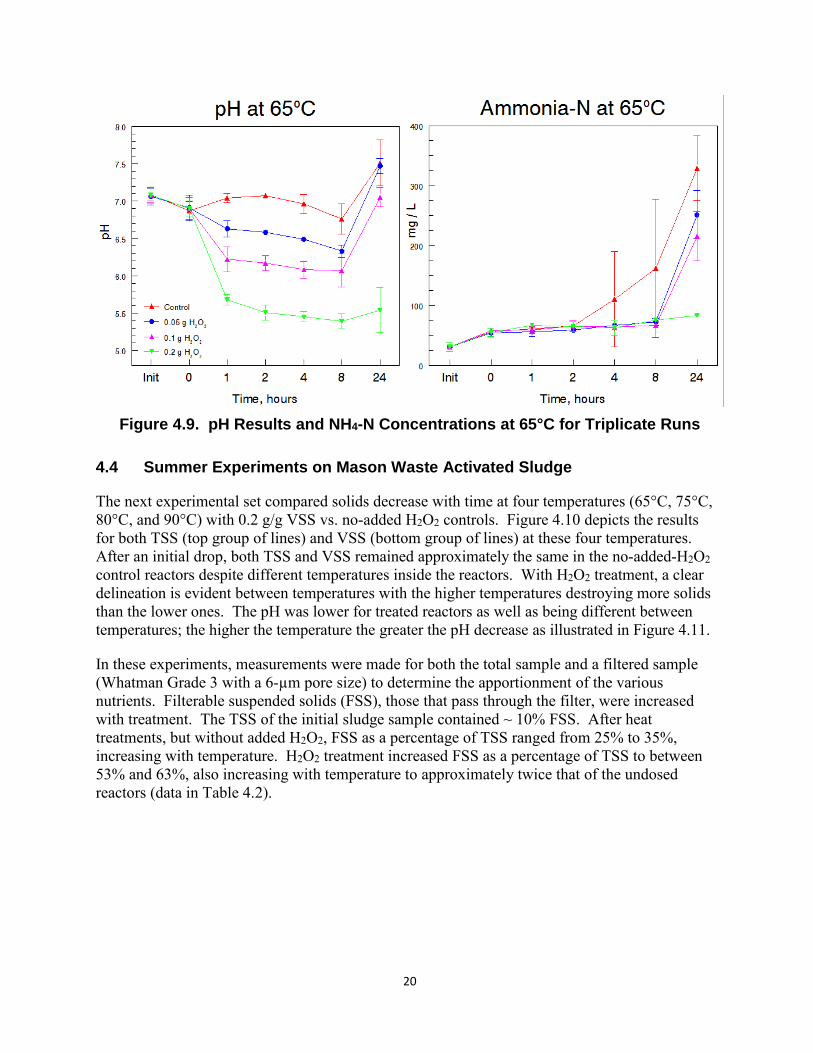
This experimental set produced an anomaly. At 24 hours, the pH of the control and the two lower concentrations of added H2O2 (0.05 and 0.1g/g VSS) increased to higher values than the initial pH. At the same time, the NH4-N concentrations increased dramatically in the same reactors (Figure 4.9). The no dose reactors had the highest increase.
The results for fecal coliform MPNs at 65°C were similar to those obtained previously at 75°C. Only in the no-added-H2O2 control and the 0.05 g H2O2/g VSS reactors were coliforms detected after the first 2 hours of the experiment, but the MPNs were lower than the regulatory limit of 1000 MPN/g. The control reactors produced regrowth after 7 days, but the H2O2 treated reactors did not. With this result, it was decided that 65°C was the lowest temperature for H2O2 treatment that produced consistent fecal coliform removal.
20
Figure 4.9. pH Results and NH4-N Concentrations at 65°C for Triplicate Runs
4.4 Summer Experiments on Mason Waste Activated Sludge
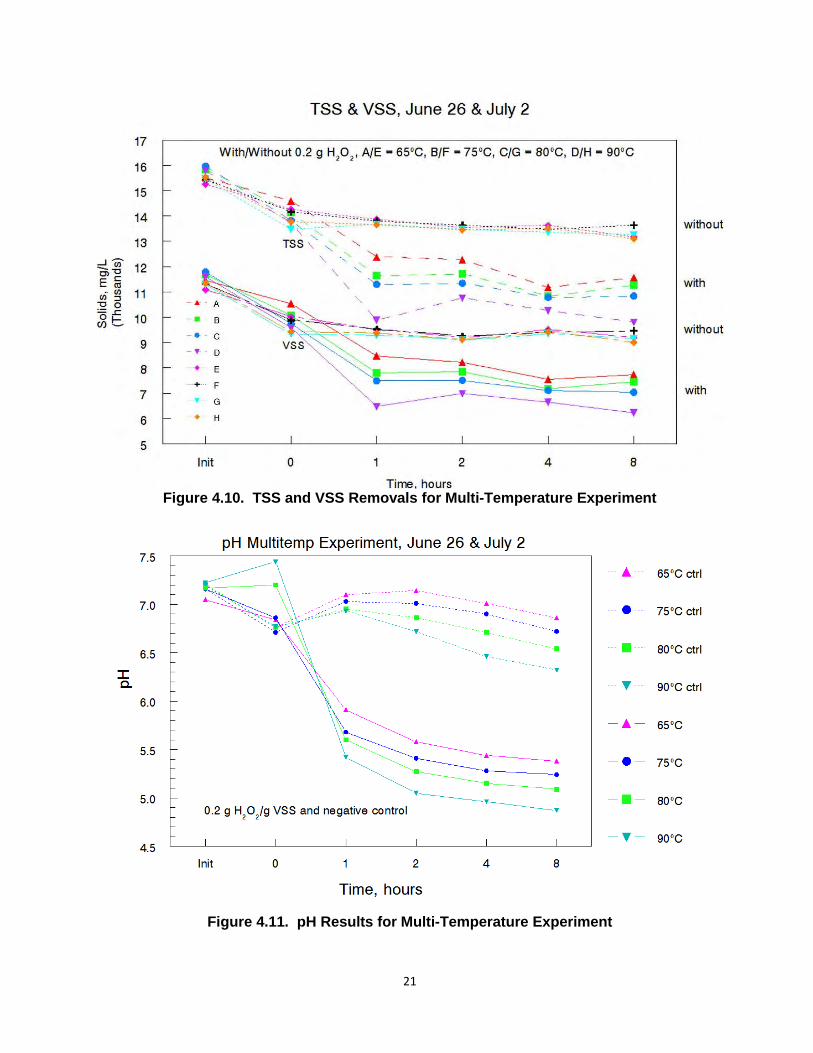
The next experimental set compared solids decrease with time at four temperatures (65°C, 75°C, 80°C, and 90°C) with 0.2 g/g VSS vs. no-added H2O2 controls. Figure 4.10 depicts the results for both TSS (top group of lines) and VSS (bottom group of lines) at these four temperatures. After an initial drop, both TSS and VSS remained approximately the same in the no-added-H2O2 control reactors despite different temperatures inside the reactors. With H2O2 treatment, a clear delineation is evident between temperatures with the higher temperatures destroying more solids than the lower ones. The pH was lower for treated reactors as well as being different between temperatures; the higher the temperature the greater the pH decrease as illustrated in Figure 4.11.
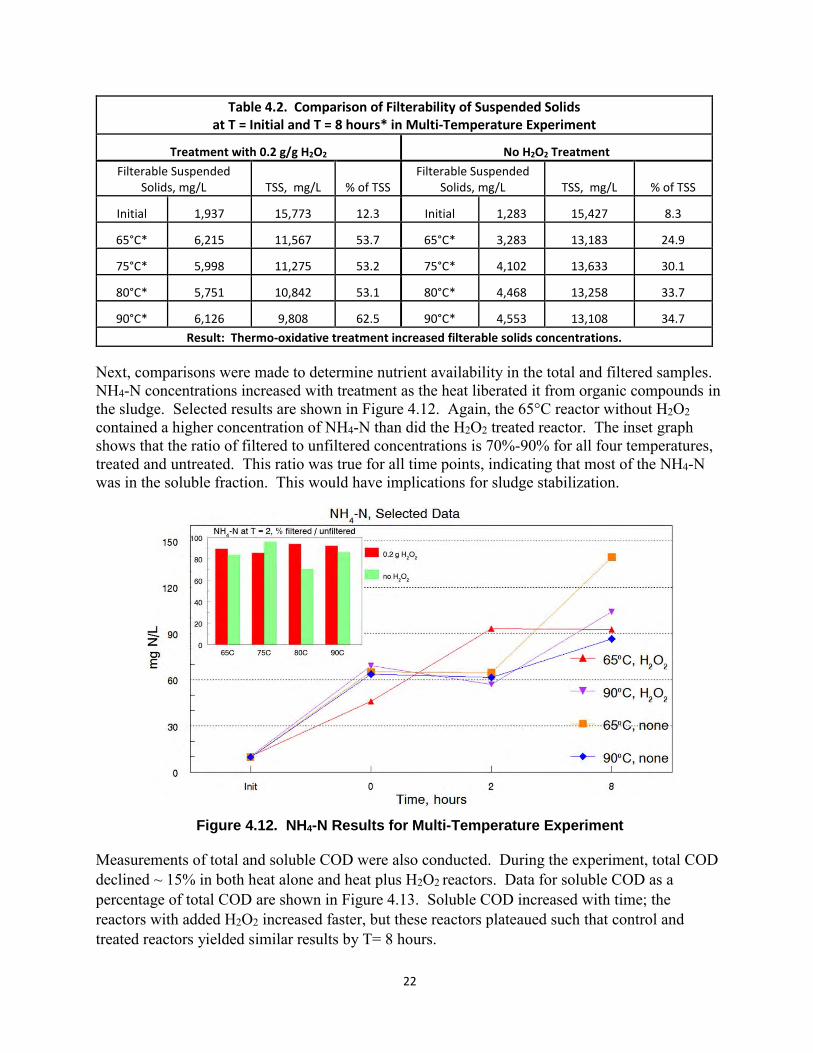
In these experiments, measurements were made for both the total sample and a filtered sample (Whatman Grade 3 with a 6-µm pore size) to determine the apportionment of the various nutrients. Filterable suspended solids (FSS), those that pass through the filter, were increased with treatment. The TSS of the initial sludge sample contained ~ 10% FSS. After heat treatments, but without added H2O2, FSS as a percentage of TSS ranged from 25% to 35%, increasing with temperature. H2O2 treatment increased FSS as a percentage of TSS to between 53% and 63%, also increasing with temperature to approximately twice that of the undosed reactors (data in Table 4.2).
21
Figure 4.10. TSS and VSS Removals for Multi-Temperature Experiment
Figure 4.11. pH Results for Multi-Temperature Experiment
22
Table 4.2. Comparison of Filterability of Suspended Solids at T = Initial and T = 8 hours* in Multi-Temperature Experiment
Treatment with 0.2 g/g H2O2 No H2O2 Treatment Filterable Suspended
Solids, mg/L TSS, mg/L % of TSS Filterable Suspended
Solids, mg/L TSS, mg/L % of TSS
Initial 1,937 15,773 12.3 Initial 1,283 15,427 8.3
65°C* 6,215 11,567 53.7 65°C* 3,283 13,183 24.9
75°C* 5,998 11,275 53.2 75°C* 4,102 13,633 30.1
80°C* 5,751 10,842 53.1 80°C* 4,468 13,258 33.7
90°C* 6,126 9,808 62.5 90°C* 4,553 13,108 34.7 Result: Thermo-oxidative treatment increased filterable solids concentrations.
Next, comparisons were made to determine nutrient availability in the total and filtered samples. NH4-N concentrations increased with treatment as the heat liberated it from organic compounds in the sludge. Selected results are shown in Figure 4.12. Again, the 65°C reactor without H2O2 contained a higher concentration of NH4-N than did the H2O2 treated reactor. The inset graph shows that the ratio of filtered to unfiltered concentrations is 70%-90% for all four temperatures, treated and untreated. This ratio was true for all time points, indicating that most of the NH4-N was in the soluble fraction. This would have implications for sludge stabilization.
Figure 4.12. NH4-N Results for Multi-Temperature Experiment
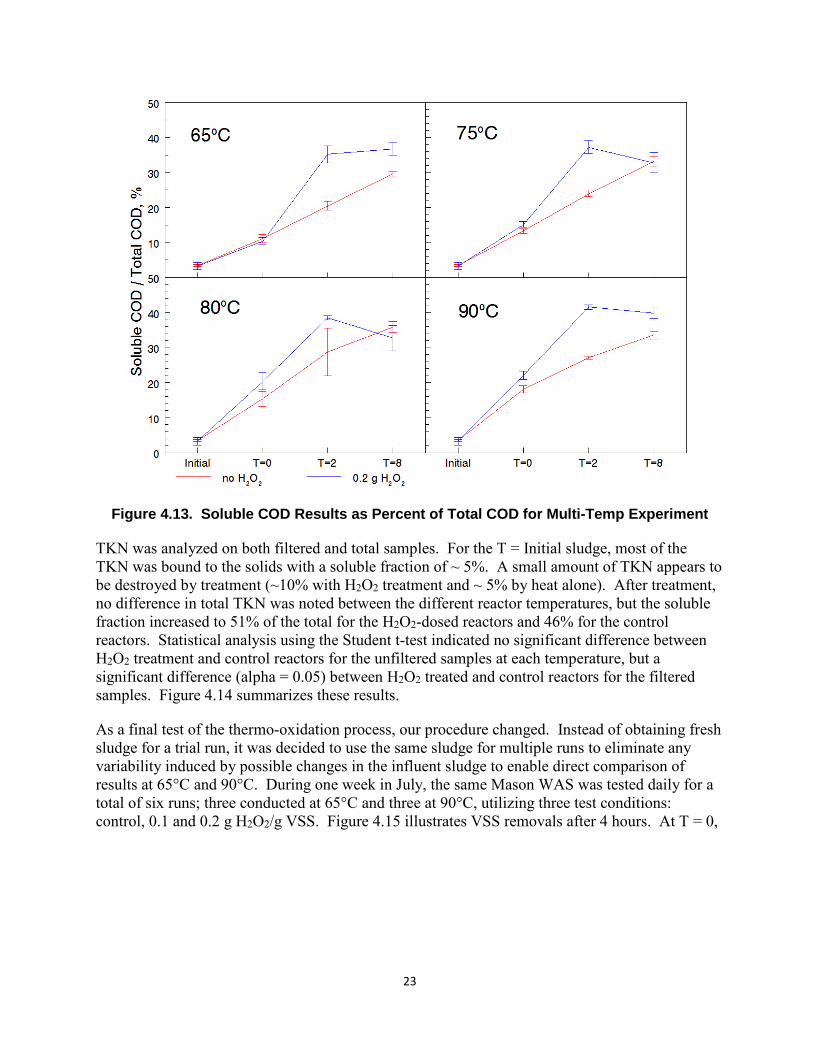
Measurements of total and soluble COD were also conducted. During the experiment, total COD declined ~ 15% in both heat alone and heat plus H2O2 reactors. Data for soluble COD as a percentage of total COD are shown in Figure 4.13. Soluble COD increased with time; the reactors with added H2O2 increased faster, but these reactors plateaued such that control and treated reactors yielded similar results by T= 8 hours.
23
Figure 4.13. Soluble COD Results as Percent of Total COD for Multi-Temp Experiment
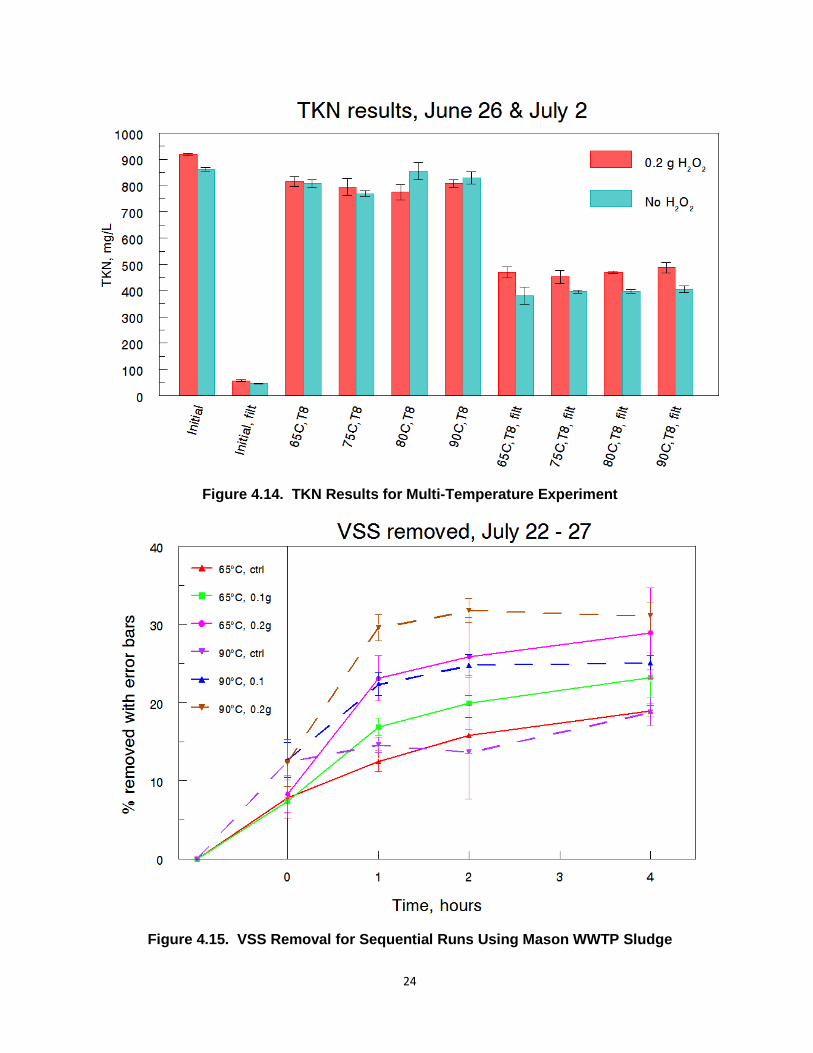
TKN was analyzed on both filtered and total samples. For the T = Initial sludge, most of the TKN was bound to the solids with a soluble fraction of ~ 5%. A small amount of TKN appears to be destroyed by treatment (~10% with H2O2 treatment and ~ 5% by heat alone). After treatment, no difference in total TKN was noted between the different reactor temperatures, but the soluble fraction increased to 51% of the total for the H2O2-dosed reactors and 46% for the control reactors. Statistical analysis using the Student t-test indicated no significant difference between H2O2 treatment and control reactors for the unfiltered samples at each temperature, but a significant difference (alpha = 0.05) between H2O2 treated and control reactors for the filtered samples. Figure 4.14 summarizes these results.
As a final test of the thermo-oxidation process, our procedure changed. Instead of obtaining fresh sludge for a trial run, it was decided to use the same sludge for multiple runs to eliminate any variability induced by possible changes in the influent sludge to enable direct comparison of results at 65°C and 90°C. During one week in July, the same Mason WAS was tested daily for a total of six runs; three conducted at 65°C and three at 90°C, utilizing three test conditions: control, 0.1 and 0.2 g H2O2/g VSS. Figure 4.15 illustrates VSS removals after 4 hours. At T = 0,
24
Figure 4.14. TKN Results for Multi-Temperature Experiment
Figure 4.15. VSS Removal for Sequential Runs Using Mason WWTP Sludge
25
the 90°C reactors already had achieved a greater % VSS removal than did the 65°C reactors. However, by T = 2 and T = 4 hours, the control reactors were similar for both temperatures. For the same H2O2 dose, a greater % VSS removal was achieved at 90°C than at 65°C, but this difference was greater at 1 and 2 hours than at 4 hours when the 65°C reactors had achieved a similar % VSS removal. The temperature difference affected the rate of the reaction more than it impacted the total extent of VSS removal. Due to this change in protocol, the results obtained in this experiment are perhaps only comparable to a single repetition of earlier experiments where a fresh WAS influent was collected for each separate run. However, the VSS destruction results described above do not corroborate test data produced on Mason WAS in April and May experiments (see Figures 4.4 and 4.8). In the earlier trials, VSS destruction for the 0.1 and 0.2 g H2O2/g VSS dosages was consistently 20% to 25% higher for the 90°C runs than the 65°C runs from 2 to 24 hours, i.e., the extent of the lower temperature VSS destruction remained consistently different along the run time.
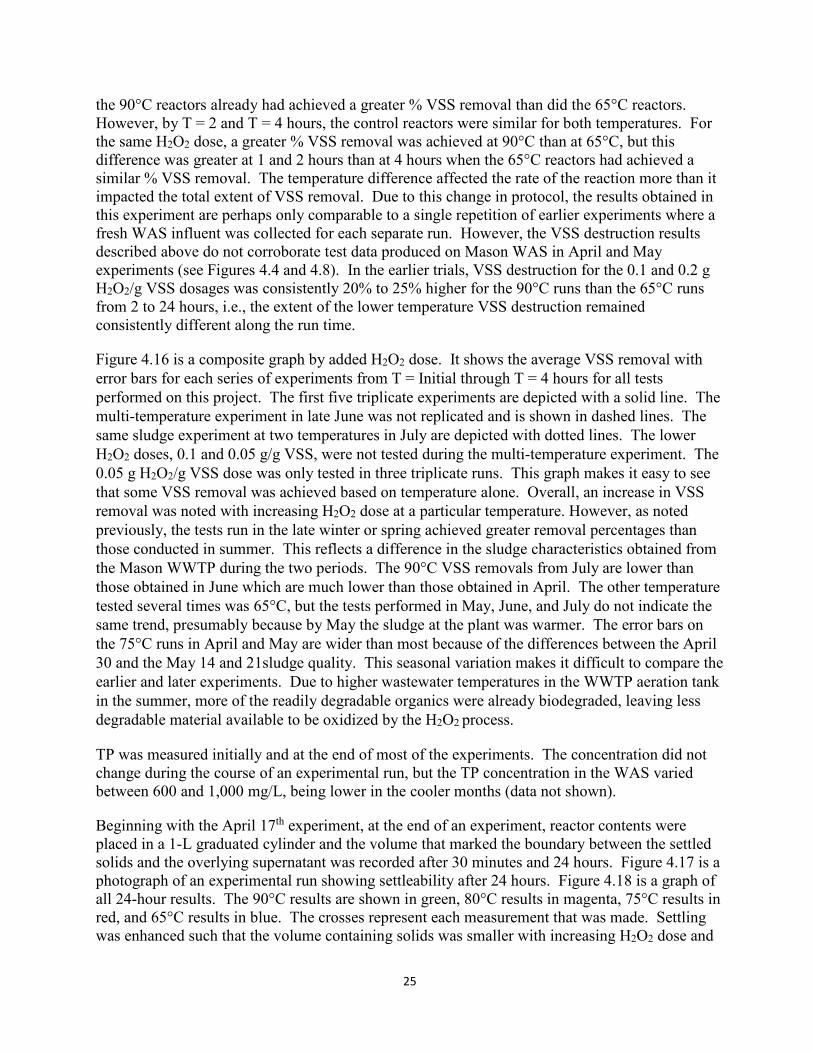
Figure 4.16 is a composite graph by added H2O2 dose. It shows the average VSS removal with error bars for each series of experiments from T = Initial through T = 4 hours for all tests performed on this project. The first five triplicate experiments are depicted with a solid line. The multi-temperature experiment in late June was not replicated and is shown in dashed lines. The same sludge experiment at two temperatures in July are depicted with dotted lines. The lower H2O2 doses, 0.1 and 0.05 g/g VSS, were not tested during the multi-temperature experiment. The 0.05 g H2O2/g VSS dose was only tested in three triplicate runs. This graph makes it easy to see that some VSS removal was achieved based on temperature alone. Overall, an increase in VSS removal was noted with increasing H2O2 dose at a particular temperature. However, as noted previously, the tests run in the late winter or spring achieved greater removal percentages than those conducted in summer. This reflects a difference in the sludge characteristics obtained from the Mason WWTP during the two periods. The 90°C VSS removals from July are lower than those obtained in June which are much lower than those obtained in April. The other temperature tested several times was 65°C, but the tests performed in May, June, and July do not indicate the same trend, presumably because by May the sludge at the plant was warmer. The error bars on the 75°C runs in April and May are wider than most because of the differences between the April 30 and the May 14 and 21sludge quality. This seasonal variation makes it difficult to compare the earlier and later experiments. Due to higher wastewater temperatures in the WWTP aeration tank in the summer, more of the readily degradable organics were already biodegraded, leaving less degradable material available to be oxidized by the H2O2 process.
TP was measured initially and at the end of most of the experiments. The concentration did not change during the course of an experimental run, but the TP concentration in the WAS varied between 600 and 1,000 mg/L, being lower in the cooler months (data not shown).
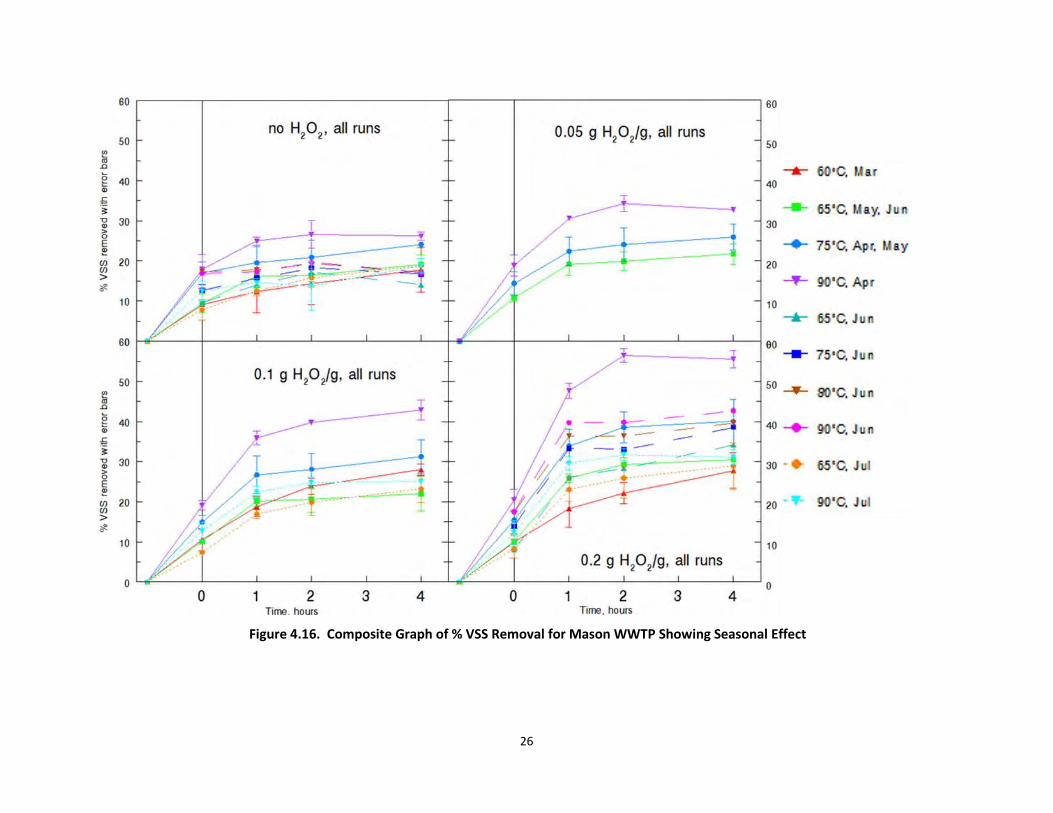
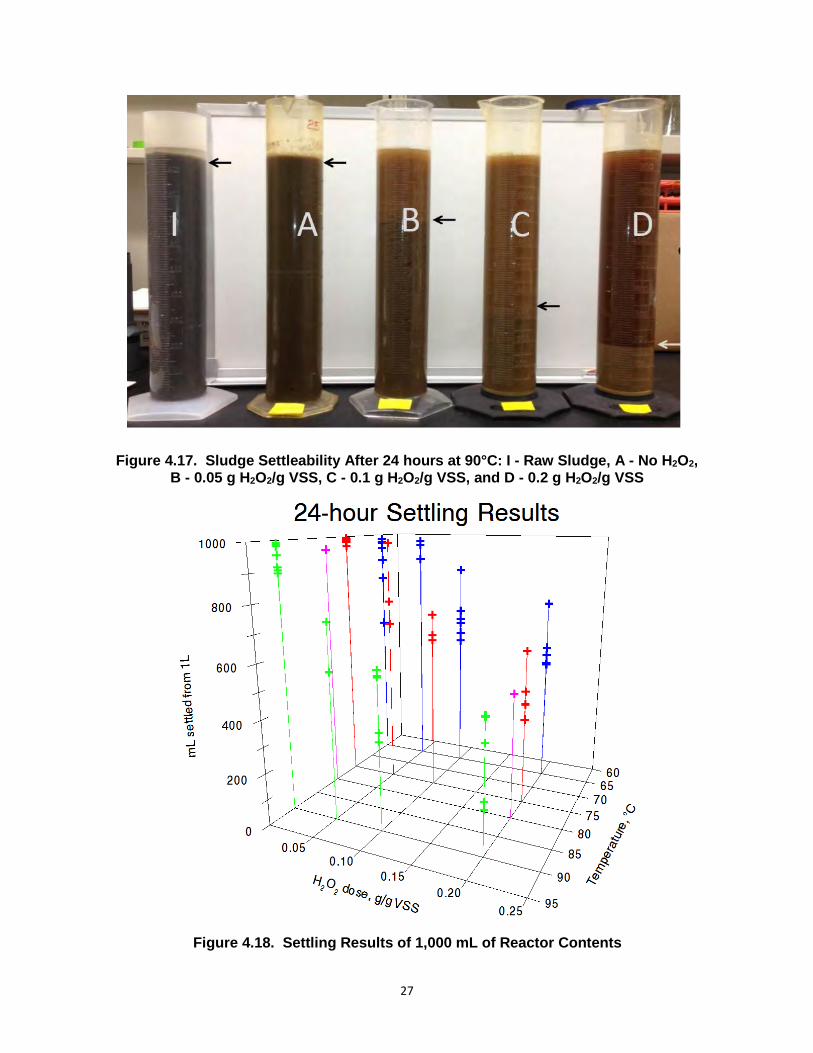
Beginning with the April 17th experiment, at the end of an experiment, reactor contents were placed in a 1-L graduated cylinder and the volume that marked the boundary between the settled solids and the overlying supernatant was recorded after 30 minutes and 24 hours. Figure 4.17 is a photograph of an experimental run showing settleability after 24 hours. Figure 4.18 is a graph of all 24-hour results. The 90°C results are shown in green, 80°C results in magenta, 75°C results in red, and 65°C results in blue. The crosses represent each measurement that was made. Settling was enhanced such that the volume containing solids was smaller with increasing H2O2 dose and
26
Figure 4.16. Composite Graph of % VSS Removal for Mason WWTP Showing Seasonal Effect
27
Figure 4.17. Sludge Settleability After 24 hours at 90°C: I - Raw Sludge, A - No H2O2, B - 0.05 g H2O2/g VSS, C - 0.1 g H2O2/g VSS, and D - 0.2 g H2O2/g VSS
Figure 4.18. Settling Results of 1,000 mL of Reactor Contents
28
increasing temperature. Also, the settled solids occupied less volume for the experiments performed in the spring as compared to the summer. This explains the variance along each line for a particular experimental condition. The 30-minute results (data not graphed) exhibited a similar difference, albeit smaller, between temperatures and treatments.
In some of the later experiments, solids concentrations were measured in the two fractions, settled and supernatant. In summer, at 90°C and 0.2 g H2O2/g VSS, after settling for 24 hours, the bottom fraction contained > 2% TSS whereas the top fraction contained only 0.06% TSS.
4.5 Testing Waste Activated Sludge from Other Wastewater Treatment Plants
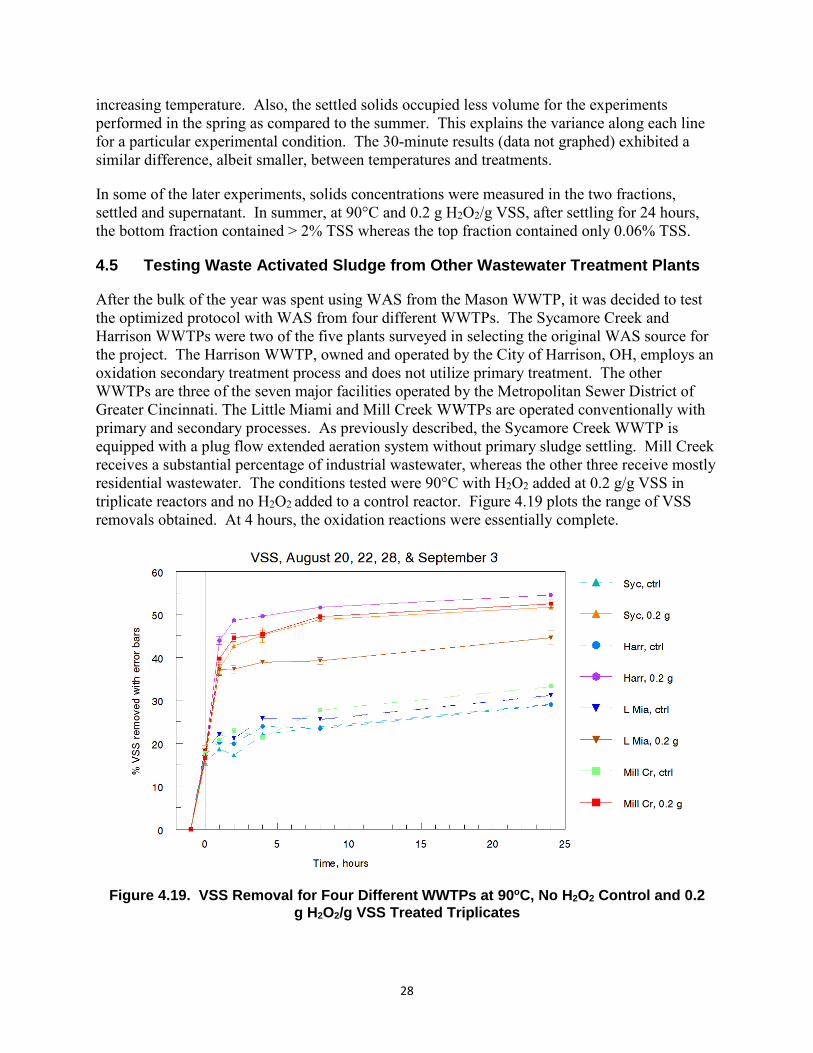
After the bulk of the year was spent using WAS from the Mason WWTP, it was decided to test the optimized protocol with WAS from four different WWTPs. The Sycamore Creek and Harrison WWTPs were two of the five plants surveyed in selecting the original WAS source for the project. The Harrison WWTP, owned and operated by the City of Harrison, OH, employs an oxidation secondary treatment process and does not utilize primary treatment. The other WWTPs are three of the seven major facilities operated by the Metropolitan Sewer District of Greater Cincinnati. The Little Miami and Mill Creek WWTPs are operated conventionally with primary and secondary processes. As previously described, the Sycamore Creek WWTP is equipped with a plug flow extended aeration system without primary sludge settling. Mill Creek receives a substantial percentage of industrial wastewater, whereas the other three receive mostly residential wastewater. The conditions tested were 90°C with H2O2 added at 0.2 g/g VSS in triplicate reactors and no H2O2 added to a control reactor. Figure 4.19 plots the range of VSS removals obtained. At 4 hours, the oxidation reactions were essentially complete.
Figure 4.19. VSS Removal for Four Different WWTPs at 90oC, No H2O2 Control and 0.2 g H2O2/g VSS Treated Triplicates
29
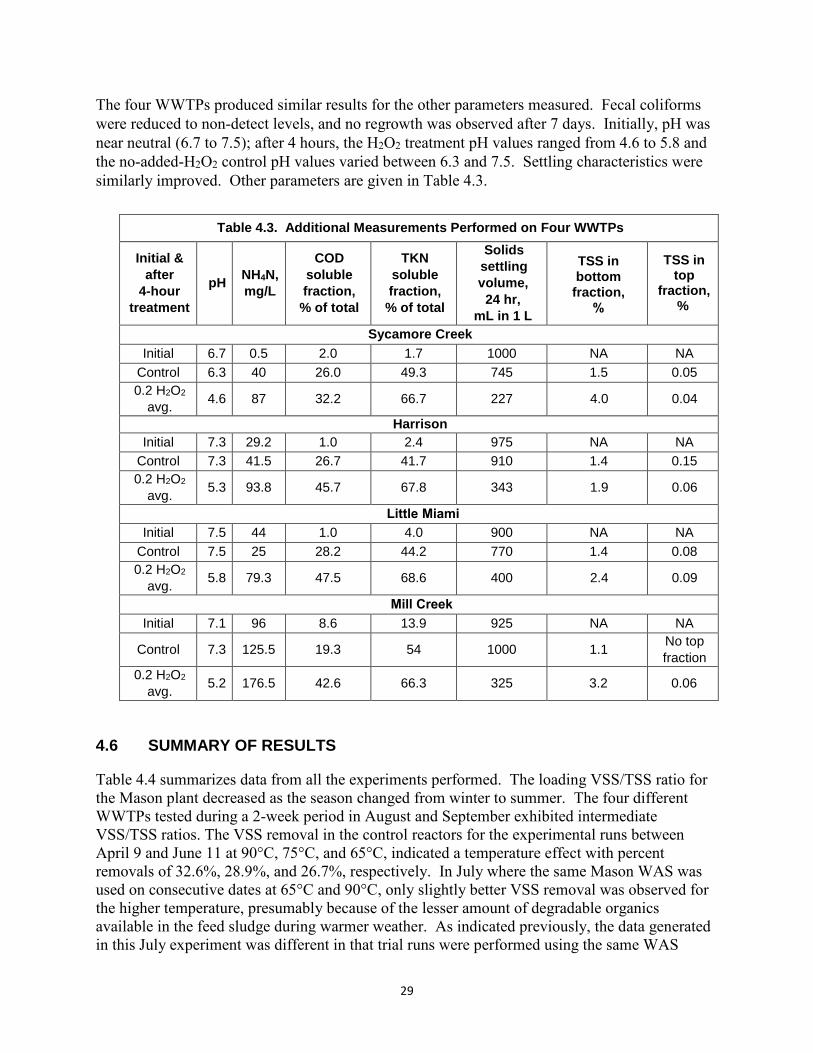
The four WWTPs produced similar results for the other parameters measured. Fecal coliforms were reduced to non-detect levels, and no regrowth was observed after 7 days. Initially, pH was near neutral (6.7 to 7.5); after 4 hours, the H2O2 treatment pH values ranged from 4.6 to 5.8 and the no-added-H2O2 control pH values varied between 6.3 and 7.5. Settling characteristics were similarly improved. Other parameters are given in Table 4.3.
Table 4.3. Additional Measurements Performed on Four WWTPs
Initial & after
4-hour treatment
pH NH4N, mg/L
COD soluble fraction, % of total
TKN soluble fraction, % of total
Solids settling volume, 24 hr,
mL in 1 L
TSS in bottom
fraction,%
TSS in top
fraction, %
Sycamore Creek Initial 6.7 0.5 2.0 1.7 1000 NA NA
Control 6.3 40 26.0 49.3 745 1.5 0.05 0.2 H2O2
avg. 4.6 87 32.2 66.7 227 4.0 0.04
Harrison Initial 7.3 29.2 1.0 2.4 975 NA NA
Control 7.3 41.5 26.7 41.7 910 1.4 0.15 0.2 H2O2
avg. 5.3 93.8 45.7 67.8 343 1.9 0.06
Little Miami Initial 7.5 44 1.0 4.0 900 NA NA
Control 7.5 25 28.2 44.2 770 1.4 0.08 0.2 H2O2
avg. 5.8 79.3 47.5 68.6 400 2.4 0.09
Mill Creek Initial 7.1 96 8.6 13.9 925 NA NA
Control 7.3 125.5 19.3 54 1000 1.1 No top fraction
0.2 H2O2 avg. 5.2 176.5 42.6 66.3 325 3.2 0.06
4.6 SUMMARY OF RESULTS
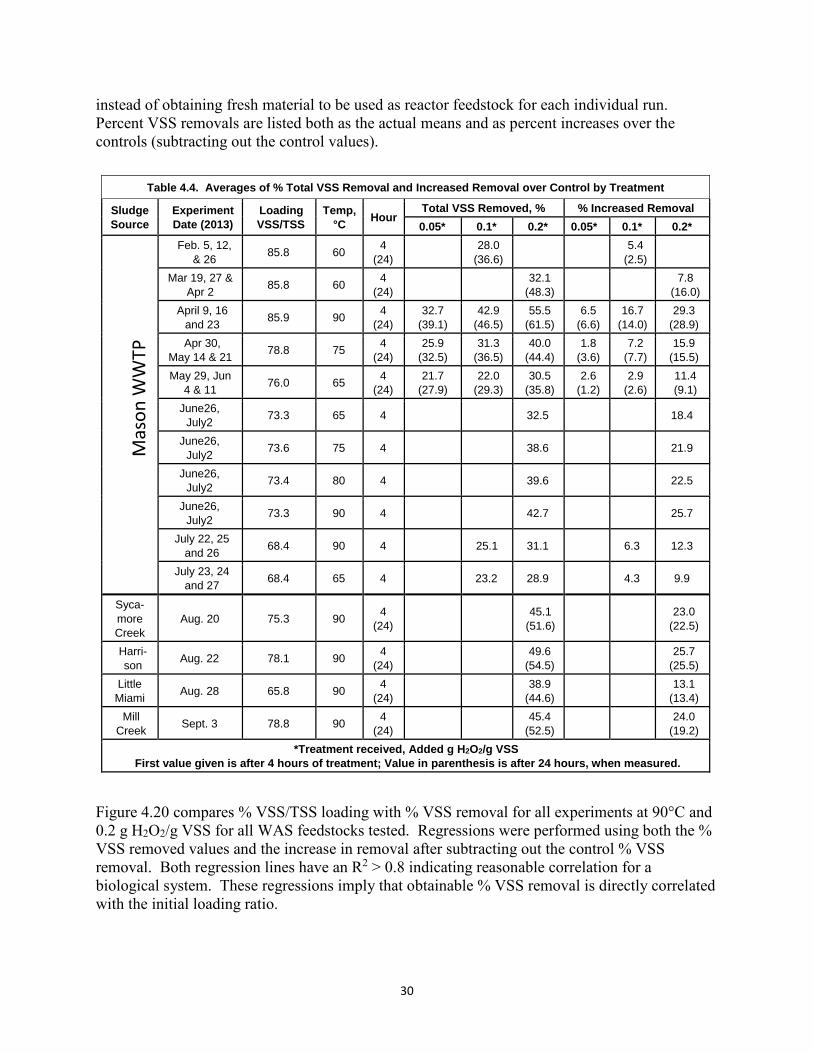
Table 4.4 summarizes data from all the experiments performed. The loading VSS/TSS ratio for the Mason plant decreased as the season changed from winter to summer. The four different WWTPs tested during a 2-week period in August and September exhibited intermediate VSS/TSS ratios. The VSS removal in the control reactors for the experimental runs between April 9 and June 11 at 90°C, 75°C, and 65°C, indicated a temperature effect with percent removals of 32.6%, 28.9%, and 26.7%, respectively. In July where the same Mason WAS was used on consecutive dates at 65°C and 90°C, only slightly better VSS removal was observed for the higher temperature, presumably because of the lesser amount of degradable organics available in the feed sludge during warmer weather. As indicated previously, the data generated in this July experiment was different in that trial runs were performed using the same WAS
30
instead of obtaining fresh material to be used as reactor feedstock for each individual run. Percent VSS removals are listed both as the actual means and as percent increases over the controls (subtracting out the control values).
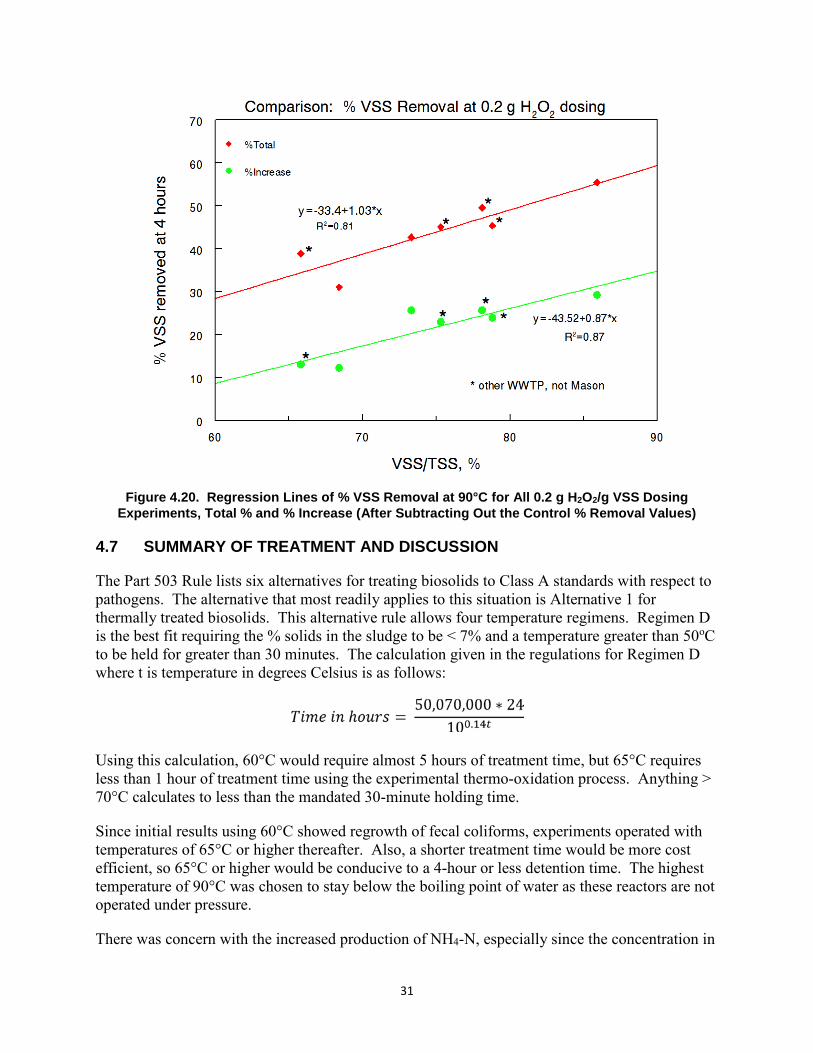
Figure 4.20 compares % VSS/TSS loading with % VSS removal for all experiments at 90°C and 0.2 g H2O2/g VSS for all WAS feedstocks tested. Regressions were performed using both the % VSS removed values and the increase in removal after subtracting out the control % VSS removal. Both regression lines have an R2 > 0.8 indicating reasonable correlation for a biological system. These regressions imply that obtainable % VSS removal is directly correlated with the initial loading ratio.
Table 4.4. Averages of % Total VSS Removal and Increased Removal over Control by Treatment
Sludge Source
Experiment Date (2013)
Loading VSS/TSS
Temp, °C Hour
Total VSS Removed, % % Increased Removal 0.05* 0.1* 0.2* 0.05* 0.1* 0.2*
Feb. 5, 12, & 26 85.8 60 4
(24) 28.0 (36.6) 5.4
(2.5)
Mar 19, 27 & Apr 2 85.8 60 4
(24) 32.1 (48.3) 7.8
(16.0) April 9, 16
and 23 85.9 90 4 (24)
32.7 (39.1)
42.9 (46.5)
55.5 (61.5)
6.5 (6.6)
16.7 (14.0)
29.3 (28.9)
Apr 30, May 14 & 21 78.8 75 4
(24) 25.9
(32.5) 31.3
(36.5) 40.0
(44.4) 1.8
(3.6) 7.2
(7.7) 15.9
(15.5) May 29, Jun
4 & 11 76.0 65 4 (24)
21.7 (27.9)
22.0 (29.3)
30.5 (35.8)
2.6 (1.2)
2.9 (2.6)
11.4 (9.1)
June26, July2 73.3 65 4 32.5 18.4
June26, July2 73.6 75 4 38.6 21.9
June26, July2 73.4 80 4 39.6 22.5
June26, July2 73.3 90 4 42.7 25.7
July 22, 25 and 26 68.4 90 4 25.1 31.1 6.3 12.3
July 23, 24 and 27 68.4 65 4 23.2 28.9 4.3 9.9
Syca-more Creek
Aug. 20 75.3 90 4 (24) 45.1
(51.6) 23.0 (22.5)
Harri-son Aug. 22 78.1 90 4
(24) 49.6 (54.5) 25.7
(25.5) Little Miami Aug. 28 65.8 90 4
(24) 38.9 (44.6) 13.1
(13.4) Mill
Creek Sept. 3 78.8 90 4 (24) 45.4
(52.5) 24.0 (19.2)
*Treatment received, Added g H2O2/g VSS First value given is after 4 hours of treatment; Value in parenthesis is after 24 hours, when measured.
31
Figure 4.20. Regression Lines of % VSS Removal at 90°C for All 0.2 g H2O2/g VSS Dosing Experiments, Total % and % Increase (After Subtracting Out the Control % Removal Values)
4.7 SUMMARY OF TREATMENT AND DISCUSSION
The Part 503 Rule lists six alternatives for treating biosolids to Class A standards with respect to pathogens. The alternative that most readily applies to this situation is Alternative 1 for thermally treated biosolids. This alternative rule allows four temperature regimens. Regimen D is the best fit requiring the % solids in the sludge to be < 7% and a temperature greater than 50oC to be held for greater than 30 minutes. The calculation given in the regulations for Regimen D where t is temperature in degrees Celsius is as follows:
Using this calculation, 60°C would require almost 5 hours of treatment time, but 65°C requires less than 1 hour of treatment time using the experimental thermo-oxidation process. Anything > 70°C calculates to less than the mandated 30-minute holding time.
Since initial results using 60°C showed regrowth of fecal coliforms, experiments operated with temperatures of 65°C or higher thereafter. Also, a shorter treatment time would be more cost efficient, so 65°C or higher would be conducive to a 4-hour or less detention time. The highest temperature of 90°C was chosen to stay below the boiling point of water as these reactors are not operated under pressure.
There was concern with the increased production of NH4-N, especially since the concentration in
32
the reactor was lower at 90°C than at the lower temperatures tested. A literature search revealed that, “The reason for such high NH4
+ formation in H2O2 added sludge is the extraction of the amine groups from the protein molecules. These are formed by the degradation of the organic nitrogen in digestion process by the OH• radicals formed as a result of H2O2 degradation” (Genç et al., 2002). Also, apparently at 90°C, NH3 is outgassed more efficiently than at 65°C.
Another significant finding was that VSS removal varies with the season. The Mason wastewater temperature was 3oC to 7°C higher in July than in April and May (see Table 2.4). The higher July temperatures would be expected to promote more VSS biological degradation in the oxidation ditch aeration tank than in April and May, thereby lowering the VSS fraction available for destruction in the thermo-oxidation process in July compared to the colder months. The VSS fraction for the aeration tank mixed liquor suspended solids decreased from 86% in April to 76%-79% in May to 69% in July. This finding increased the difficulty of making absolute comparisons between reactor operating temperatures as they were tested in different months and, therefore, different seasons. The seasonal variation observed in VSS destruction in the thermo-oxidation process was apparently due to the changing quality of the feed WAS, being more oxidized in warmer weather. When WAS is more oxidized prior to sludge treatment, there is less potential additional removal possible by thermo-oxidation treatment. It can be said that, in general, higher operating temperatures and larger doses of H2O2 result in greater percent removal of VSS.
Sludge settling characteristics also improved with increasing operating temperature and added H2O2 dose, with the best results obtained at the highest dose and temperature regime. The thermo-oxidation process can improve sludge settling properties sufficiently such that it may reduce the cost of sludge dewatering. The solubilization of COD and TKN serves to remove the most readily available carbon and nitrogen so that these nutrients can be recycled back to the head of the treatment plant hypothetically resulting in a more stable end product, i.e., a biosolids soil amendment that because it will leach nutrients more slowly, will be less likely to cause contamination via seepage to groundwater and runoff to rivers, streams, and lakes.
At the end of the study, other WWTP sludges were tested with similar results achieved at all sites. This finding imparts confidence to the hypothesis that the thermo-oxidation process is a potential treatment method applicable across the board to a wide variety of aerobic sludges.
33
5.0 Literature Review and Description of Competing Technologies A literature review using the search terms thermo-oxidation and sludge was performed. Nothing was found in the literature to prevent filing for a patent to further this technology. The following discussion describes competing technologies from the literature search.
Municipal WWTPs generate sludge as a by-product of the physical, chemical and biological processes used during treatment. Over 95% of sludge is water, and the solids portion is composed of 59%-88% organic matter, which is decomposable and produces offensive odors (Tyagi and Lo, 2011). Many processes can be used to handle sewage sludge produced at WWTPs, the treatment of which can add up to 35% to 60% of a plant’s treatment costs (Appels et al., 2008). It has been estimated that about 10 million dry tons of sewage sludge are produced every year in the United States (Bandosz and Block, 2006). The cost of sludge treatment is highly dependent on the overall volume and water content of the produced sludge. Commonly used disposal practices include incineration, landfilling, and land application. For sludge/biosolids management, the current practice of anaerobic digestion followed by land application is the most economical and environmentally sensible practice used (Murray et al., 2008). Increasing sludge production can cause problems for both the WWTP operator and the community, so more efficient treatments to reduce sludge production at the WWTP are needed (Nah et al., 2000). Enhanced anaerobic digestion processes of particular interest are those that have the potential to reduce the overall amount of biosolids to be disposed, while maximizing the acceptability of the biosolids by increased pathogen inactivation and reduced biosolids odors. By enhancing the rate limiting step of organic matter hydrolysis, reduction of solids and methanization of sewage sludge can be improved (Li and Noike, 1992; Liu et al., 2009). Lysis treatments can be considered mechanical, thermal, chemical, or biological, all of which solubilize organic compounds making them more biodegradable. The literature contains methods for sludge minimization such as acidic and basic thermal hydrolysis, ozonation, ultrasound, microwave irradiation, Fenton’s peroxidation, wet air oxidation, and advanced thermal hydrolysis that utilizes heat and H2O2 addition (described below).
In thermochemical hydrolysis methods, acid or base are added that solubilizes the sludge. These processes are generally carried out at ambient or moderate temperatures because the addition of the acid or base does most of the stabilization. The use of acidic or basic thermal hydrolysis is limited because of the need for extremes in pH and the subsequent need for the sludge to be re-neutralized. Other major drawbacks of this method are noxious odor generation, corrosion, and fouling of the equipment.
Wet air oxidation is a destructive technology based on the oxidation of pollutants at high temperature and high pressure in the liquid phase. Wet air oxidation promotes waste oxidation under pressure (2-15 MPa) and temperature (180°C-315°C) with addition of oxidant such as pure oxygen or air (Luck, 1999). The degree of oxidation is primarily a function of temperature,
34
oxygen partial pressure, and residence time; actual operating conditions depend on the treatment objectives. Products of the process are carbon dioxide, water, and low-molecular-weight organic compounds with COD destruction efficiencies of 75%-90% (Khan et al., 1999). Sludge treatment under relatively mild conditions (< 300°C) can reduce COD at a rate between 5% and 15% and significantly improve sterility, filterability, and dewatering properties (Kolaczkowski et al., 1999). High capital and operating costs are associated with the elevated pressures and temperatures used, long residence times, and use of construction materials that must be resistant to high corrosion rates that occur under severe operating conditions (Mantzavinos et al., 1999).
Compared to conventional wet air oxidation, use of catalysts can enhance the reaction rate and produce higher oxidation efficiencies or allow for reduced temperature resulting in a reduction of capital costs. The catalytic process can be used for effluent pre-treatment prior to a biological step or as a complete destruction process. Fenton’s peroxidation is a wet air oxidation process conducted at low temperature (20°C-55°C), atmospheric pressure, and a pH of 3, where H2O2 is activated by iron salts (Erden and Flibeli, 2010). The process has been shown to significantly reduce sludge volume, increase solubilization of organic matter, and improve sludge dewaterability (Neyens and Baeyens, 2003), but it requires the addition of the catalyst and a separation step such as precipitation to remove catalyst ions from the final effluent. This method is also very corrosive due to the necessity of bringing sludge to a very low pH, and operation and maintenance costs can be quite high.
Ozone (O3) is a powerful oxidant that has been used to aid in the destruction of cellular material in WAS. During sludge ozonation, because of the complex composition of sludge, ozone decomposes into radicals and reacts with the entire material: soluble and particulate fractions; organic and mineral fractions. Using O3 for sludge reduction has been widely studied. Optimal consumed O3 doses range from 0.05 to 0.5 g O3/g of total solids with optimum dosage dependent on the type and concentration of sludge. It has been shown there is a phenomenon of mineralization for higher O3 doses, and the optimum dosage for any operation depends on the type of sludge (Elliott and Mahmood, 2007). Moreover, ozonation modifies viscosity and settlement of sludge (Bougrier et al., 2006) by stabilizing surface charges that disperses sludge particles. Studies have shown a dependent relationship between O3 dosage and released COD where the oxidative treatment destroys floc structure and disrupts cell membranes of the microorganisms (Weemaes et al., 2000). The limited solubility of O3 in water makes it applicable essentially to diluted solutions. Ozonation involves high capital and operational costs because it requires high energy consumption for O3 production, transfer to the sludge, and production of liquid oxygen.
Ultrasonic treatment is influenced by three factors: supplied energy, ultrasonic frequency, and nature of the influent (Bougrier et al., 2005; Aldin et al., 2010). The ultrasonic process leads to the formation of cavitational bubbles in the liquid phase (Tiehm et al., 2001) where bubbles grow and then collapse violently when they reach critical size. Generally, the most useful frequencies are in the range of 20-200 kHz (Hua and Thompson, 2000). Extreme local heating and high pressures at the liquid-gas interface are produced during the cavitational collapse of the bubbles. Also, turbulence and high shearing phenomena occur in the liquid phase and highly reactive radicals (H˙, HO2˙ and OH˙) and H2O2 can be formed that facilitate chemical reactions for destroying organic compounds. Tiehm et al. (2001) showed that excess sludge can be degraded more efficiently at low frequencies where mechanical effects facilitate solubilization of particles.
35
The work of Bougrier et al. (2005) showed optimum ultrasonic energy was about 7000 kJ/kg TS to obtain maximum biogas production and sludge solubilization. High capital and operating costs of ultrasound units with high energy consumption by the equipment are major limitations of this technique, and full-scale applications are rare.
Hydrogen peroxide addition has been shown to reduce sludge volume by the oxidation process. The work of Kim et al. (2009) used H2O2 for excess sludge reduction and an alkaline pre-treatment method to enhance the efficiency of H2O2 oxidation of the sludge. The solubility of sludge was increased (Soluble COD/Total COD) and viscosity was decreased with improved settleability of the sludge.
Thermal hydrolysis utilizes relatively low temperatures (100°C-175°C) and low pressure to destroy cell walls allowing for cell contents to be available for degradation, but it also decreases sludge viscosity and increases dewaterability. At near neutral pH, optimal conditions for thermal hydrolysis have been shown to be 170°C and operation times between 30 and 60 minutes, where hydrolysis temperature appears to be more important than contact time for sludge disintegration to occur (Li and Noike, 1992). Thermal treatment results in the breakdown of the gel structure of the sludge and the release of intracellular bound water (Weemaes and Verstraete, 1998). Microwave irradiation is a thermal hydrolytic method receiving increased use because the desired temperature can be reached more rapidly than conventional heating and energy consumption is lower than conventional heating (Coelho et al., 2010). Bougrier et al. (2007) found improved filterability and greater than 30% reduction in sludge production using thermal hydrolysis treatment. Thermal hydrolysis has the potential to produce Class A biosolids because it can be used on both primary sludge and WAS. As described in Abelleira et al. (2012), the advanced thermal hydrolysis process depends on H2O2 addition and direct steam injection under mild conditions with no catalyst added. At optimal conditions with oxygen at 30% of stoichiometric balance, 115°C, and 24-minute reaction time, increased solubilization and dewaterability levels of the solids were found. Camacho et al. (2002) found a synergistic effect between temperature and H2O2 addition (at temperatures of 60°C and 95°C) for released TOC and a linear relationship between the two parameters.
According to Bougrier et al. (2007) and Zhang et al. (2010), the energy required to perform the process of heating the sludge for thermal treatment can be positively balanced by biogas production. In order to form a complete calculation of cost, it is necessary to take into account thermal losses, technological problems (pressure, materials, and exchanger fouling), investment costs, maintenance costs, and integration in the whole wastewater treatment process.
To stabilize sludge, this study utilized thermal hydrolysis and H2O2 addition in a synergistic effect operating under temperatures of 90°C and lower, without the addition of a catalyst, and at ambient sludge pH. This work was based on the previous studies of Cacho Rivero et al. (2006a, 2006b) that investigated the use of combined oxidative and/or thermal treatments to enhance anaerobic digestion of excess municipal sludge. Their results showed that this co-treatment increased VSS destruction ranging between 27.2% and 29.0%. Class A biosolids were obtained with all H2O2 dosages used in the study (0.5, 1.0, and 2.0 g H2O2/g VSS) (Cacho Rivero et al., 2006a, 2006b). In continuing work, they tested lower doses of H2O2 (0.1, 0.25, and 0.5g/g influent VSS) demonstrating increased solids destruction as well (Cacho Rivero et al., 2006c). The lower dosage also produced Class A biosolids. For this study, dosages of H2O2 similar to
36
and slightly lower than those used in this last study were investigated (0.05, 0.1, and 0.2 g H2O2/g influent VSS) to determine if a more cost effective regimen would be effective for the production of Class A biosolids from aerobic sludge.
Unlike conventional inorganic oxidizing agents such as chlorine and hypochlorite, H2O2 yields no noxious or polluting byproducts. The only byproducts of the oxidant are water and dissolved oxygen that can stimulate the activity of aerobic microorganisms. These conditions, which are less harsh than other processes, would imply potential energy savings and the use of cost-reducing technologies. H2O2 cost has been progressively decreasing over the last decade, and, therefore, there are increasing incentives to expand its use in environment protection applications (Perathoner and Centi, 2005).
37
6.0 Market Analysis, Conceptual Treatment Trains, and Cost Estimates 6.1 Background
More than 10,000 oxidation ditch WWTPs have been built in the United States since the 1970s. This technology is used mainly in small to medium-sized communities, i.e., with populations of 5,000 to 50,000, and to treat wastewater flows of 1,900 to 19,000 cu m/day (0.5-5.0 mgd) although there are also some oxidation ditch plants larger than 5 mgd. The advantages of the technology are simple operation, reliable performance, and cost effectiveness (WEF, 2010).
Vendors selling package oxidation ditch plants today include Yokogawa (Japan); Veolia Water Technologies (France); and Eimco, Parkson, WesTech, and Evoqua Water Technologies (United States). Newer oxidation ditch designs incorporate multiple treatment zones to promote biological phosphorus and nitrogen removal in addition to oxidizing particulate and soluble organics.
6.2 Market Analysis of Fertilizer
Fertilizer production was a $56.2 billion business globally in 2008 and has grown by 10-15% annually since then. This growth has been driven by global demand for food and higher standards of living (Fertilizer Mixtures Market, 2009). More than 90% of fertilizer is inorganic, manufactured from mined materials such as phosphorus, potassium, etc. Of the organic portion of fertilizer, less than 3% is supplied by municipal waste sludge. In the European Union, the land application and use of human waste as fertilizer is regulated through the Fertilizer’s Regulation, EC No. 2003/2003, promulgated in 2003. In the United States, these uses are regulated by EPA through 40 CFR, Part 503, promulgated on February 19, 1993. Part 503 contains concentration limits for metals in biosolids, pathogen reduction standards, site restrictions, crop harvesting restrictions and monitoring, record keeping, and reporting requirements for land applied biosolids as well as similar requirements for biosolids that are land applied or incinerated.
In the United States, popular lawn care products are made in part from reconstituted sewage sludge or biosolids that are sold through brokers to fertilizer manufacturers. Some municipalities have created their own products, including Milorganite™ from the Milwaukee, WI Metropolitan Sewerage District and Louisville Green™ from the Morris Forman Water Quality Treatment Center in Louisville, KY. One of the benefits of organic fertilizers is that the inorganic nutrients (phosphorus, nitrogen, and potassium) are released slowly in bioavailable forms. Both leachate runoff and plant burn are less likely when using organic products vs. chemical products. Organic fertilizers made from WWTP sludge are provided to customers in bags or in bulk as dry pellets. The pellets have little odor, are safe for animal exposure, and are easy to apply.
38
Another segment of the organic fertilizer market demonstrating high growth, particularly in the organic-market gardener segment, is fish fertilizer. Fish fertilizer products come in the form of meals, emulsions, and enzymatically digested fish matter. Fish meal is ground, generally dried at high heat, and used in soil applications. Fish emulsion, a popular product used in organic agriculture, is applied as a soluble fertilizer. Enzymatic digestion of fish allows minerals and amino acids to become readily available to plants and makes those nutrients water soluble, but requires the extra odorous digestion step at the processing plant (groworganic.com).
6.3 A Global View of Three Trends
Three trends currently are combining to create enhanced market opportunities for organic fertilizers.
First, the ‘energy-water nexus’ is being studied worldwide. Large quantities of energy are consumed by the water supply and wastewater treatment industries. Energy generation itself requires large quantities of water. Waste is removed from homes on a water carrier. Globally, many are asking if there is a way to eliminate some of the energy used in separating water from waste and to re-use both, clean water and waste products, more effectively. And a third node can be added to create an ‘energy-waste-food production nexus’. Energy is required to produce fertilizers for farmland, and water is needed for irrigating farmland. Products that close this loop to create fertilizer and use water more efficiently for food production will be in demand.
Second, the supply of inorganic phosphorus is a limited resource. The scientific literature since the 1950s (Asimov, 1974) has predicted that inorganic phosphorus deposits will be exhausted by the end of the century, i.e., by 2100. In some countries, including the United States, supplies are estimated for 15-35 years, or until 2030 to 2050. Additionally, the remaining inorganic phosphate inventory contains cadmium and metals (Lougheed, 2011). When rock phosphate is exhausted, organic phosphates that have not been rendered unsafe by mixing with hazardous or nuclear wastes will remain. In the phosphorus cycle, this means that the trace amounts present in human waste sludge constitute a valuable nutrient that will be needed to rebuild soils as soon as they are generated. The future shortage of phosphorus is a strong incentive to not incinerate or landfill waste sludge, but instead to treat it as a valuable product “to produce a health-friendly fertilizer…for farmers who lack the means to purchase them” (Wanzala and Roy, 2006).
Third, more than one-third of the earth is now under water stress; either the quality or quantity of water is not sufficient for society’s needs, or the absence of water has already affected the environment and human health. Approximately one-third of the United States currently is experiencing water stress, primarily in the western regions (UNEP, 2008). The use of wet organic fertilizer could provide a mechanism in some regions to return water directly to the land in slow-releasing sludge complexes and relieve some of this stress.
The primary questions that must be addressed for the thermo-oxidation technology to be considered a candidate for full-scale application are:
• Is there a way to use this treatment concept to supply liquid nutrients to farmers legally, safely, and with minimal odor?
39
• What regions and demographic areas would be the most likely markets for this material?
• What would be acceptable capital equipment and operating costs?
6.4 Market Potential for Thermo-Oxidation Technology
The basic premise for assessing market penetration potential for the thermo-oxidation process is that it can be used most beneficially in treating low concentration WAS streams. Concentrations equivalent to 1%-2% TSS were treated effectively in EPA bench-scale tests on this project, meeting Part 503 requirements for Class A biosolids.
The analysis of most likely markets for this technology is based on the number of small WWTPs (primarily plants equipped with oxidation ditches) that could benefit from this sludge treatment method and would be likely customers based on demographics, environmental conditions, and plant size. Approximately 10,000 oxidation ditch systems have been installed in the United States since 1973 (WEF, 2010). For the purposes of this exercise, we assumed that 20% will upgrade their sludge treatment system during the period 2015-2025, 75% are located in rural areas, and 50% have capacities of 2 mgd or less. Further, we assumed that half are located in western, plains, or southern states experiencing water stress:
• Possible customers = 10,000 oxidation ditches in United States x 20% to upgrade = 2,000
• Most likely customers = 2,000 possible customers x 75% rural x 50% in water stressed regions x 50% small plants ≤ 2 mgd = 375
The construction and operating cost estimates to follow for the thermo-oxidation process have been developed to maximize the potential benefits for small capacity plants in small towns and rural regions of the United States. This analysis assumes that municipalities in western, southern, and plains states will be more receptive to the concept of re-using the water contained in their waste sludge products. It further assumes that small towns and rural municipalities will have greater incentive to upgrade to a simple system, and it follows from this assumption that capital costs will be a limiting factor in choosing technologies.
6.5 Cost Estimates
The costs for the thermo-oxidation process have been estimated below in two ways. First, order-of-magnitude estimates of heat requirements and chemical (H2O2) usage are estimated from the results of the bench-scale tests reported herein. These values were used to estimate annual operating costs for a system based on a defined wastewater profile. Second, estimates for construction and annual operating costs for the conceptualized systems were compared with construction and operating costs for two existing sludge treatment systems that produce a marketable fertilizer product and also with costs for incineration and landfilling.
No attempt was made in these estimates to cost out post thermo-oxidation treatment dewatering operations such as centrifugation or a belt filter press as the WWTP would have these costs regardless of the sludge treatment process used. These dewatering processes would increase the H2O2 treated biosolids concentration from 1.5%-3% solids to 18%-22% solids, producing a material with the consistency of loam. Another possibility that might be considered, especially
40
in water stressed areas, is trucking the Class A treated material directly to fields without water removal. Dewatered biosolids could be land applied with a spreader or slinger, while the un-dewatered biosolids would be applied as a slurry.
6.5.1 Methodology for Conceptual Design and Costs for Thermo-Oxidation Technology
Two chemical treatment regimens have been considered in developing conceptual designs and capital and operating cost estimates for the thermo-oxidation process. These two regimens are the two higher dosage rates evaluated in the experimental trials, i.e., 0.1 and 0.2 g H2O2/g VSS or alternately 10% and 20% treatment of VSS in the WAS. VSS concentrations are assumed to be approximately 80% of TSS.
The lower H2O2 dose results in less chemical cost at the expense of achieving lower VSS destruction. The higher dose will produce 10%-15% greater VSS destruction at twice the chemical cost. Each potential user will be required to make an independent evaluation and decision on dose vs. VSS destruction trade-off that best fits the needs of their facility.
In order to calculate energy requirements, a basic treatment train was conceptualized to approximate a possible system with two variations for comparison. For clarification, it should be noted that neither of these treatment trains is recommended for construction; rather, each presents a combination of heating, mixing, and energy delivery alternatives that could be considered when designing an actual system. Energy requirements were calculated for these conceptual treatment trains. First approximation construction cost estimates were also prepared for these trains consisting of a chemical feed system, a mixing tank, and, for one of the two trains, a heat transfer mechanism. Engineering cost estimating construction curves (McGivney and Kawamura, 2008), conceptual design level estimates from vendors, and information from three interviewed wastewater treatment plants were used to approximate construction costs for the two sludge treatment trains for two capacities:
• 6 mgd average influent wastewater flow with 20,000 gpd of WAS generation, as per the Mason plant
• 1.2 mgd average influent wastewater flow with 4,000 gpd of WAS generation, i.e., one-fifth the size of Mason’s plant
6.5.2 Conceptual Treatment Trains
Two sludge treatment trains have been analyzed and costed, a simple large tank system with steam heat and a more advanced system with smaller tanks and multiple heat exchangers with steam heat. Each system includes an H2O2 injection system and jacketed tanks heated by a steam boiler. Treatment Train 1 and Treatment Train 2 schematics along with construction cost estimates are shown in Figures 6.1 and 6.2, respectively. Additional treatment train variations and layouts, including the re-use of heat from the system elsewhere in the WWTP and an in-line heat exchanger treatment unit, are shown in Appendix A.
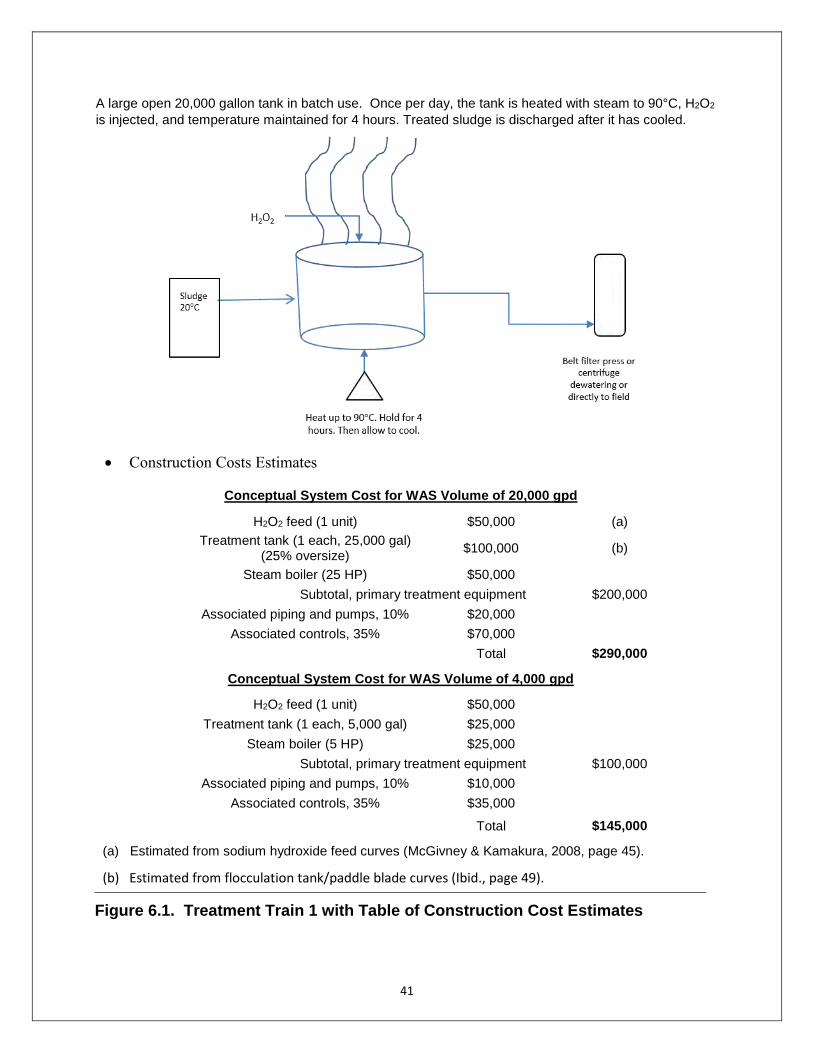
41
A large open 20,000 gallon tank in batch use. Once per day, the tank is heated with steam to 90°C, H2O2 is injected, and temperature maintained for 4 hours. Treated sludge is discharged after it has cooled.
• Construction Costs Estimates
Conceptual System Cost for WAS Volume of 20,000 gpd
H2O2 feed (1 unit) $50,000 (a)
Treatment tank (1 each, 25,000 gal) (25% oversize) $100,000 (b)
Steam boiler (25 HP) $50,000 Subtotal, primary treatment equipment $200,000
Associated piping and pumps, 10% $20,000 Associated controls, 35% $70,000 Total $290,000
Conceptual System Cost for WAS Volume of 4,000 gpd
H2O2 feed (1 unit) $50,000 Treatment tank (1 each, 5,000 gal) $25,000 Steam boiler (5 HP) $25,000
Subtotal, primary treatment equipment $100,000 Associated piping and pumps, 10% $10,000 Associated controls, 35% $35,000
Total $145,000
(a) Estimated from sodium hydroxide feed curves (McGivney & Kamakura, 2008, page 45).
(b) Estimated from flocculation tank/paddle blade curves (Ibid., page 49).
Figure 6.1. Treatment Train 1 with Table of Construction Cost Estimates
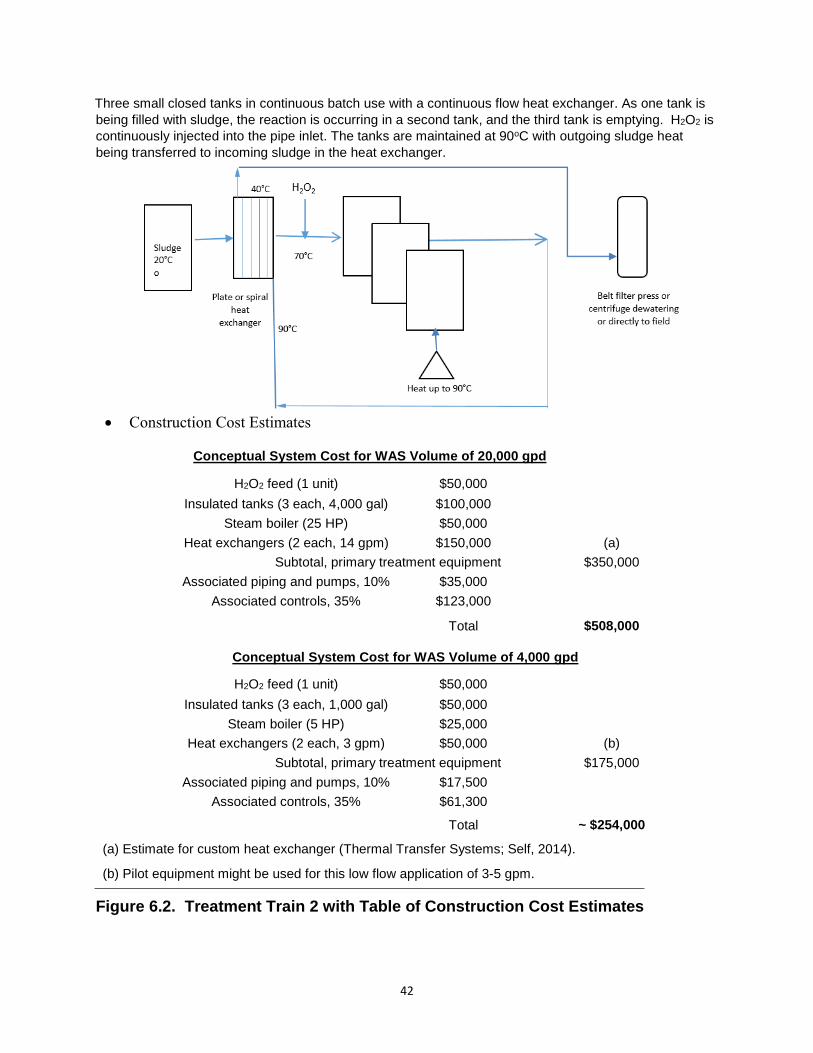
42
Three small closed tanks in continuous batch use with a continuous flow heat exchanger. As one tank is being filled with sludge, the reaction is occurring in a second tank, and the third tank is emptying. H2O2 is continuously injected into the pipe inlet. The tanks are maintained at 90oC with outgoing sludge heat being transferred to incoming sludge in the heat exchanger.
• Construction Cost Estimates
Conceptual System Cost for WAS Volume of 20,000 gpd
H2O2 feed (1 unit) $50,000 Insulated tanks (3 each, 4,000 gal) $100,000 Steam boiler (25 HP) $50,000 Heat exchangers (2 each, 14 gpm) $150,000 (a)
Subtotal, primary treatment equipment $350,000 Associated piping and pumps, 10% $35,000 Associated controls, 35% $123,000
Total $508,000
Conceptual System Cost for WAS Volume of 4,000 gpd
H2O2 feed (1 unit) $50,000 Insulated tanks (3 each, 1,000 gal) $50,000 Steam boiler (5 HP) $25,000 Heat exchangers (2 each, 3 gpm) $50,000 (b)
Subtotal, primary treatment equipment $175,000 Associated piping and pumps, 10% $17,500 Associated controls, 35% $61,300
Total ~ $254,000
(a) Estimate for custom heat exchanger (Thermal Transfer Systems; Self, 2014).
(b) Pilot equipment might be used for this low flow application of 3-5 gpm.
Figure 6.2. Treatment Train 2 with Table of Construction Cost Estimates

43
Estimated operating costs for the two conceptual treatment trains are shown in Tables 6.1 and 6.2 for influent flows of 20,000 gpd and 4,000 gpd, respectively. The higher flow rate corresponds roughly to the wastewater throughput at the Mason, OH WWTP and represents a large oxidation ditch system. WAS production for Mason is approximately 550 dry tons VSS and 700 dry tons TSS per year for the 20,000 gpd system and, by calculation, 110 dry tons VSS and 140 dry tons for the smaller system. In Treatment Train 1, energy costs are based on no recovery of heat from the treatment tank, i.e., 100% loss from the open tank. In Treatment Train 2, losses of 20% in the heat exchangers and 5% in the tanks are assumed as reasonable estimates. Mixing energy is not included in the estimates. Labor costs are not included in these estimates and are assumed to be similar to the operation of other sludge treatment systems in a WWTPs of corresponding size. Other units and assumptions include:
Ambient water temperature 20°C Specific heat of sludge 4.19 J/g °C Cost of electricity $0.10/kWh H2O2 (50% purity) cost $500/ton
To summarize Figures 6.1 and 6.2, estimated construction costs for the 20,000 gpd WAS flow rate range from $290,000 for Treatment Train 1 to $508,000 for Treatment Train 2. Capital costs for the 4000 gpd WAS flow rate system range from $145,000 to $254,000. The estimated capital costs for the smaller system are approximately one-half of those for the larger system.
Table 6.1. Estimated Operating Costs for Treatment Trains 1 and 2 for 20,000 gpd WAS
Mass of influent sludge = 77,000 kg/day @ 2.25% TSS Train 1 Train 2, Flow Velocity = 14 gpm Energy needed (kJ/day) 22.6 million 5.6 million kWh/day 6,300 1,600 Cost/day ($) $630 $160 Annual calculated cost ($) $164,000 $41,000 10% Energy distribution loss $16,400 $4,100
Total $ $180,000 $45,000
Assumptions for each system: Energy losses 100% 5% thru insulation, 20% in Heat Exch.
Operation parameter 1 shift/day Continuous
H2O2 Dosage: 10% of VSS $55,000 $55,000
20% of VSS $110,000 $110,000 Annual operating cost ($)
10% of VSS $235,000 $100,000 20% of VSS $290,000 $155,000
Operating cost/dry ton (TSS)
10% of VSS $336 $144 20% of VSS $415 $222
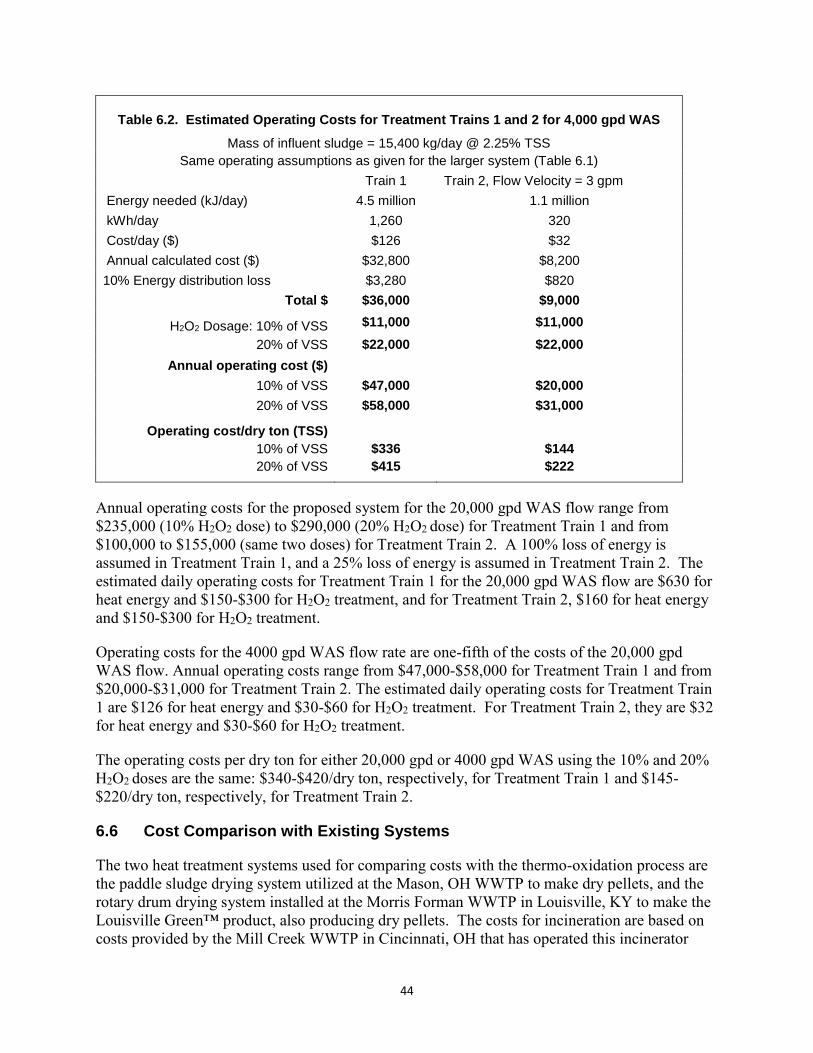
44
Table 6.2. Estimated Operating Costs for Treatment Trains 1 and 2 for 4,000 gpd WAS
Mass of influent sludge = 15,400 kg/day @ 2.25% TSS Same operating assumptions as given for the larger system (Table 6.1)
Train 1 Train 2, Flow Velocity = 3 gpm Energy needed (kJ/day) 4.5 million 1.1 million kWh/day 1,260 320 Cost/day ($) $126 $32 Annual calculated cost ($) $32,800 $8,200 10% Energy distribution loss $3,280 $820
Total $ $36,000 $9,000
H2O2 Dosage: 10% of VSS $11,000 $11,000 20% of VSS $22,000 $22,000
Annual operating cost ($) 10% of VSS $47,000 $20,000 20% of VSS $58,000 $31,000
Operating cost/dry ton (TSS) 10% of VSS $336 $144 20% of VSS $415 $222
Annual operating costs for the proposed system for the 20,000 gpd WAS flow range from $235,000 (10% H2O2 dose) to $290,000 (20% H2O2 dose) for Treatment Train 1 and from $100,000 to $155,000 (same two doses) for Treatment Train 2. A 100% loss of energy is assumed in Treatment Train 1, and a 25% loss of energy is assumed in Treatment Train 2. The estimated daily operating costs for Treatment Train 1 for the 20,000 gpd WAS flow are $630 for heat energy and $150-$300 for H2O2 treatment, and for Treatment Train 2, $160 for heat energy and $150-$300 for H2O2 treatment.
Operating costs for the 4000 gpd WAS flow rate are one-fifth of the costs of the 20,000 gpd WAS flow. Annual operating costs range from $47,000-$58,000 for Treatment Train 1 and from $20,000-$31,000 for Treatment Train 2. The estimated daily operating costs for Treatment Train 1 are $126 for heat energy and $30-$60 for H2O2 treatment. For Treatment Train 2, they are $32 for heat energy and $30-$60 for H2O2 treatment.
The operating costs per dry ton for either 20,000 gpd or 4000 gpd WAS using the 10% and 20% H2O2 doses are the same: $340-$420/dry ton, respectively, for Treatment Train 1 and $145-$220/dry ton, respectively, for Treatment Train 2.
6.6 Cost Comparison with Existing Systems
The two heat treatment systems used for comparing costs with the thermo-oxidation process are the paddle sludge drying system utilized at the Mason, OH WWTP to make dry pellets, and the rotary drum drying system installed at the Morris Forman WWTP in Louisville, KY to make the Louisville Green™ product, also producing dry pellets. The costs for incineration are based on costs provided by the Mill Creek WWTP in Cincinnati, OH that has operated this incinerator
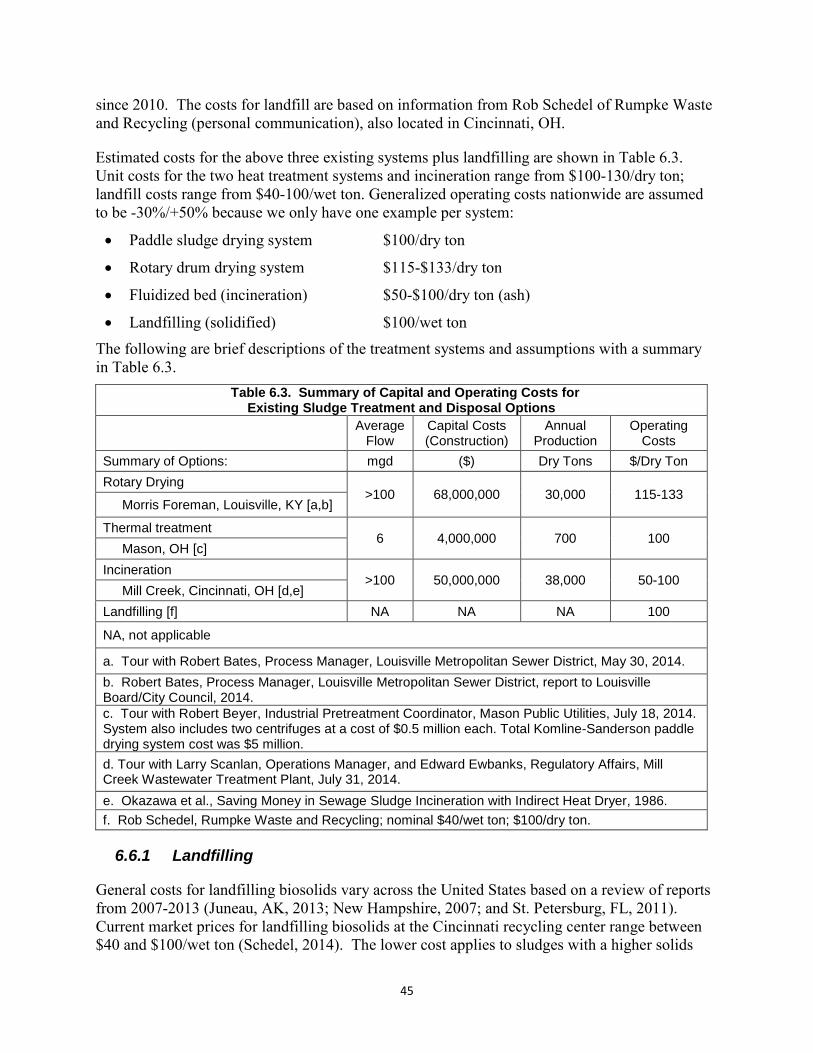
45
since 2010. The costs for landfill are based on information from Rob Schedel of Rumpke Waste and Recycling (personal communication), also located in Cincinnati, OH.
Estimated costs for the above three existing systems plus landfilling are shown in Table 6.3. Unit costs for the two heat treatment systems and incineration range from $100-130/dry ton; landfill costs range from $40-100/wet ton. Generalized operating costs nationwide are assumed to be -30%/+50% because we only have one example per system:
• Paddle sludge drying system $100/dry ton
• Rotary drum drying system $115-$133/dry ton
• Fluidized bed (incineration) $50-$100/dry ton (ash)
• Landfilling (solidified) $100/wet ton
The following are brief descriptions of the treatment systems and assumptions with a summary in Table 6.3.
Table 6.3. Summary of Capital and Operating Costs for Existing Sludge Treatment and Disposal Options
Average
Flow Capital Costs (Construction)
Annual Production
Operating Costs
Summary of Options: mgd ($) Dry Tons $/Dry Ton Rotary Drying
>100 68,000,000 30,000 115-133 Morris Foreman, Louisville, KY [a,b]
Thermal treatment 6 4,000,000 700 100
Mason, OH [c] Incineration
>100 50,000,000 38,000 50-100 Mill Creek, Cincinnati, OH [d,e]
Landfilling [f] NA NA NA 100
NA, not applicable
a. Tour with Robert Bates, Process Manager, Louisville Metropolitan Sewer District, May 30, 2014. b. Robert Bates, Process Manager, Louisville Metropolitan Sewer District, report to Louisville Board/City Council, 2014. c. Tour with Robert Beyer, Industrial Pretreatment Coordinator, Mason Public Utilities, July 18, 2014. System also includes two centrifuges at a cost of $0.5 million each. Total Komline-Sanderson paddle drying system cost was $5 million. d. Tour with Larry Scanlan, Operations Manager, and Edward Ewbanks, Regulatory Affairs, Mill Creek Wastewater Treatment Plant, July 31, 2014. e. Okazawa et al., Saving Money in Sewage Sludge Incineration with Indirect Heat Dryer, 1986. f. Rob Schedel, Rumpke Waste and Recycling; nominal $40/wet ton; $100/dry ton.
6.6.1 Landfilling
General costs for landfilling biosolids vary across the United States based on a review of reports from 2007-2013 (Juneau, AK, 2013; New Hampshire, 2007; and St. Petersburg, FL, 2011). Current market prices for landfilling biosolids at the Cincinnati recycling center range between $40 and $100/wet ton (Schedel, 2014). The lower cost applies to sludges with a higher solids
46
content as determined using the Paint Filter Liquids Test (EPA Solid Waste Method 9095B). The higher cost is for “wet” sludge that requires solidification prior to landfilling. These costs were found to be representative throughout the country, but it is assumed that costs for landfill disposal may vary from -30%/+50% nationally from the Cincinnati market prices.
6.6.2 Mason Water Reclamation Plant, Mason, OH
Our contacts were Robert Beyer, Industrial Pretreatment Coordinator, and Keith Collins, Director. This plant has two oxidation ditches, a race track configuration with anoxic and anaerobic areas for phosphorus and nitrate-nitrogen removal. The TWAS is fed to two centrifuges for dewatering, followed by thermal drying in a Komline-Sanderson Paddle Dryer that uses indirect, heated oil in the paddles and surrounding the treatment tank to dry the biosolids to 95% dry pellets. The system includes solids handling equipment.
Mason distributes the dry product to local farmers at no cost who transport the material and authorize that they have removed Exceptional Quality Class A Biosolids from the facility.
6.6.3 Morris Forman Water Quality Treatment Center, Louisville, KY
Our contact was Robert Bates, Operations Manager. This plant utilizes a conventional activated sludge system. The TWAS, after dewatering, is fed through a Rotary Drum Dryer to produce 95% dry pellets. The system includes a Venturi scrubber and solids handling equipment.
Previously, Louisville Green™ was sold to turf industries and donated to local community parks. Currently, the municipality contracts with a local marketing company for blending and sale to bulk agricultural fertilizer manufacturers and for packaged distribution. The marketing company pays Morris Forman $16.50/ton of biosolids.
6.6.4 Mill Creek Wastewater Treatment Plant, Cincinnati, OH
Our contacts were Larry Scanlan, Operations Manager, and Edward Ewbanks, Regulatory Affairs. The TWAS is fed to a fluidized bed incinerator system. Mill Creek operates two of three incinerators at a time under permit, with each incinerator requiring one operator. The system includes tube sheet heat exchangers, Venturi scrubbers, and ash handling equipment.
The Mill Creek facility does not measure operating costs of this system. Material has been accepted previously from local treatment plants at no charge. The capital cost of the system was approximately $50 million. Annually, 38,000 dry tons are processed, and the system has an estimated 30-year life. With an estimated 1.2 million total tonnage processed over the life of the facility, prorated capital costs equate to $45/dry ton feed sludge.
Ash from the incineration process is stored for eventual disposal to landfill.
6.7 Summary of Market Analysis
The capital cost for WAS flow of 20,000 gpd at Mason, OH WWTP for the existing heat treatment system was $4 million excluding the centrifuges. Capital cost, obviously, was much higher to handle the greater flows for the larger systems at Morris Foreman, Louisville, KY and
47
Mill Creek, Cincinnati, OH. Incineration systems cost estimates for lower WAS flow rates (i.e., 4000 gpd) are both prohibitively high, and smaller systems are not commercially available. WAS treatment operating costs for existing systems range from $50-133/dry ton at the larger municipalities (see Table 6.3).
Capital costs for the proposed thermo-oxidation system for the 20,000 gpd WAS and 4000 gpd WAS flows range from $290,000 to $508,000 and from $145,000 to $254,000, respectively, depending on the treatment train selected. The estimated capital costs of the proposed system are an order-of-magnitude lower than for the existing system at Mason. In contrast, WAS treatment operating costs using the proposed thermo-oxidation system at $145 to $420/dry ton range from 1.5 to four times higher than for existing systems shown in Table 6.3 and three to four times higher than for landfilling.
The bench-scale configuration most approximates Treatment Train 1. Treatment Train 2, while adding capital cost with inclusion of a heat exchanger, will be more attractive in terms of reducing operating costs. However, because it is a more complex system and would require more operator time and expertise, it may be more suited to the 6 mgd than the 1.2 mgd plant size. Therefore, while it appears that Treatment Train 2 would be the logical system to install due to the operating cost savings, there may be a place for a version of Treatment Train 1. A small WWTP could pour an in-ground concrete tank or use an above-ground steel tank for use as a reaction vessel and operate it only during the day shift.
The market potential of the thermo-oxidation technology in the United States, based on an estimated installed cost of $150,000 to $500,000 per system and 375 likely customers, is $56 million to $188 million. This is a niche market with customers who will need to be educated about the future benefits of changing their current sludge disposal practices.
The enclosed estimates are based on laboratory/bench-scale studies. Next steps for development of the technology would be pilot plant testing with interested technology vendors using their products and equipment.
48
7.0 Summary and Conclusions 7.1 Project Summary
Thermal oxidation of WAS was evaluated at bench scale as a cost-effective and novel method for producing Class A biosolids. The thermo-oxidation process consists of two principal treatment components, elevated temperature and H2O2 addition. H2O2 is known to be a powerful oxidant, and elevated temperature has been used historically to inactivate or destroy microorganisms of fecal origin. The primary objectives of these experiments were to use the simultaneous imposition of chemical oxidation and heat on WAS to:
1) Enhance sludge stability and reduce vector attraction via oxidation of a portion of the VSS inventory, and
2) Reduce fecal coliform and/or Salmonella concentrations to levels required to meet Class A biosolids standards.
Although the thermal oxidation process has been shown to be capable of producing Class A biosolids when applied to anaerobically digested sludge (Cacho Rivero et al., 2005; 2006a; 2006b; and 2006c), it heretofore had not been evaluated on a feed sludge consisting of WAS. WWTPs employing conventional activated sludge secondary treatment systems typically produce both primary sludge and WAS. Anaerobic digestion is widely used to process a mixture of these two excess sludge streams. Because the goal of this project was to evaluate this process for the treatment of WAS only streams, WWTPs that either do not employ primary treatment (no production of raw or primary sludge) or plants that do utilize primary treatment but process WAS separately from their primary sludge were targeted. Those plants without primary settling of influent wastewater are primarily limited to smaller WWTPs (1-6 mgd capacities) that do not have land restrictions and frequently utilize extended aeration activated sludge systems with nominal aeration detention times of 24 hours or greater and SRTs in excess of 15 days. Recently, oxidation ditch technology has become the extended aeration system of choice for many small communities. WWTPs with primary clarification generally are larger facilities, are more likely to be land restricted, and are equipped with conventional activated sludge secondary treatment systems. Conventional activated sludge units, by definition, have significantly shorter nominal aeration detention times and SRTs, on the order of 4-8 hours and 4-6 days, respectively, than do extended aeration systems. As such, WAS from conventional aeration systems usually will be less oxidized than that from an extended aeration facility and, if not combined with primary sludge for anaerobic digestion, may require follow-on aerobic digestion to achieve an equivalent degree of oxidation as WAS taken directly from an extended aeration activated sludge system.
In assessing potential markets for the thermo-oxidation process for treatment of WAS, it was decided that the process would be best suited to handling feed streams that already are well oxidized to minimize H2O2 dose requirements. Most larger plants with conventional activated sludge systems (4-6 hours detention time) use anaerobic digestion or incineration of primary
49
sludge and WAS. The use of extended aeration systems, particularly oxidation ditches, is on the rise in smaller systems making this a good niche market for thermo-oxidation technology. This market already boasts more than 10,000 oxidation ditches with high potential for continued attractive growth.
Based on the above market priorities, a survey of extended aeration WWTPs in the Greater Cincinnati area was conducted. Samples of WAS, mixed liquor, and influent wastewater were collected and analyzed for five plants. The results of this preliminary survey indicated that WAS from the Mason, OH oxidation ditch WWTP best met the requirements as a process feedstock. The Mason WWTP operates a 6-mgd oxidation ditch facility in Warren County approximately 25 miles northeast of downtown Cincinnati. The Mason plant does not utilize primary settling of raw sludge. WAS is taken directly from the oxidation ditch channels, settled in a gravity thickener, and aerated in alternating fill-and-draw holding tanks. The TWAS is pumped from the aerated holding tanks at 2-3% TSS through centrifuges that increase the TSS concentration to 18%-20%. The dewatered sludge is then fed to a Komline-Sanderson paddle dryer that produces Class A biosolids pellets at 95%+ TSS in about 30 minutes of drying at 270°F-280°F.
A fresh batch of Mason TWAS was collected from the aerated holding tanks prior to centrifuge dewatering and transported to the EPA laboratories in Cincinnati for each experiment. During late August and early September, TWAS from four other WWTPs in the Greater Cincinnati area was collected and used as reactor feedstock as a final test of the thermo-oxidation process.
Reliable and predictable VSS destruction and fecal coliform reduction are two essential requirements for production of a high quality Class A biosolids product. VSS destruction is necessary to decrease sludge mass, enhance sludge stability, and reduce vector attraction. Fecal coliform reduction is an indicator of pathogen destruction and/or inactivation. The experimental system was designed primarily to evaluate these two parameters, but other attractive features of the thermo-oxidation process were uncovered and validated and are discussed below.
Reactor temperatures ranging from 60°C to 90°C and H2O2 dosages of 0, 0.05, 0.1, and 0.2 g/g feed VSS were evaluated over 9 months from early December 2012 through mid-September 2013. Four bench-scale reactors were operated in parallel utilizing magnetic stir bars for mixing (see Figure 3.2). Most trial runs were conducted over reaction periods of 24 hours. After the reactors had reached the desired test temperature, H2O2 was fed into the reactors during the first 0.5 hour of treatment. Our test data over the first several months revealed that VSS destruction was fairly well complete after 4 hours of reaction time with ~15% incremental destruction achieved over the next 20 hours of reactor detention time. Accordingly, in the latter stages of the experimental program, reactor detention times and sample collection periods were reduced to 4 hours. In subsequent process development and market penetration efforts, a reactor detention time of 4 hours will be used.
7.2 Project Conclusions
• Based on observed VSS destruction rates, the major portion (>85%) of VSS destruction was obtained in the first 4 hours of reaction time. Therefore, a design parameter of 4 hours detention time has been established for this technology.
50
• Compared to unheated WAS feedstock concentrations, substantial VSS destruction was achieved by the application of elevated temperatures only, on the order of 10%-25% depending on the applied temperature.
• Elevated temperature and H2O2 together increased VSS destruction substantially over that achievable with heat alone. At a given H2O2 dose, it is reactor temperature dependent. In the spring of 2013, at 90°C a 30% increase in VSS destruction (55% dosed with 0.2 H2O2 g/g VSS vs. 25% undosed) was noted after 4 hours reaction time. This increase dropped to 17% (40% vs. 23%) at 75°C.
• VSS destruction in the thermo-oxidation process is also dependent on plant wastewater temperature. As temperatures increased from spring (15°C-20°C) to July (23°C-24°C) in 2013, it was found that VSS destruction decreased. VSS destruction after 4 hours at a reactor temperature of 90°C and an H2O2 dose of 0.2 g/g VSS dropped from 55% to 30% and from 25% to 20% for the undosed reactor. This inverse relationship with wastewater temperature vs. VSS destruction was attributed to higher rates of microbiological activity in the oxidation ditch aeration system, resulting in less VSS available for destruction in the thermo-oxidation process reactors. This conclusion is supported by the VSS/TSS ratios in the activated sludge mixed liquor that decreased as a function of wastewater temperature from 86% in April 2013 at 16°C to 69% in July 2013 at 23°C.
• VSS destruction is directly related to H2O2 dose, i.e., the destruction increases with increasing dose. As noted in Table 4.4, the 0.2 g H2O2 dose increased VSS destruction by approximately 6% over 0.1 g dose in the summer and by roughly 12.5% in the spring. Of the three doses evaluated, 0.05, 0.1, and 0.2 g H2O2/g VSS, the two higher doses are recommended for practical application of the technology. Both of these doses will provide acceptable levels of improved stability and reduced vector attraction. A decision regarding dosage will be site specific, primarily determined by the degree of WAS minimization that best fits the needs of the facility.
• Fecal coliform reduction is also directly related to reactor temperature. At a reactor temperature of 90°C, fecal coliforms were reduced to below the detection limit of 100 MPN/g TSS after 1 hour of reaction time for all reactors. No regrowth was observed for any of the reactors after 7 days at room temperature. At 75°C, fecal coliforms were also reduced to below detection limits after 1 hour for the H2O2 treated reactors. Fecal coliforms were detected in the undosed reactors at levels below the Class A regulatory limit of 1000 MPN/g TSS, and no regrowth was seen after 7 days. A reactor temperature of 60°C resulted in die-off of fecal coliforms, but regrowth above the regulatory limit occurred for all reactors. At 65°C, fecal coliforms regrew in the undosed reactors, but not in the H2O2 treated reactors. Therefore, a thermo-oxidative treatment temperature of 65°C or greater is recommended.
• An unexpected attractive feature was the improved settleability achieved with H2O2 addition. Settling tests conducted over a 24-hour period in a 1-L graduated cylinder exhibited high levels of improved settleability to thickened zones of down to 200 mL (see Figure 4.17). Without H2O2 addition, essentially no settling was observed even at elevated temperatures. Therefore, it is concluded that the improved settleability of the post-treated WAS was due primarily to the presence of H2O2. In the presence of H2O2, higher temperatures do incrementally improve settleability (see Figure 4.18). In an experiment
51
conducted at 90°C with an H2O2 dose of 0.2 g/g VSS, the TSS in the bottom thickened zone of settled WAS was 2.2% compared to 0.05% for the upper decant zone. This observation suggests significant beneficial implications for any subsequent sludge dewatering operations (i.e., centrifugation or a belt filter press) that may be considered by an individual WWTP to increase biosolids concentrations.
• Another attractive feature of the thermo-oxidation process observed was the considerable increase in soluble nitrogen achieved for four temperatures between 65°C and 90°C. The soluble TKN fraction increased from 5% in the untreated sludge to 46% with heat alone and 51% for heat plus the 0.2 g H2O2 dose for all temperatures (see Figure 4.14). The hypothesis is that the treatment caused the release of the less-tightly bonded nitrogen species from the solids into the soluble fraction. This means that the more releasable organic and ammonia forms of nitrogen will be recycled back to the headworks of the plant in the dewatered supernatant rather than being released as a slug into the soil during land application. Premature release of a slug of nitrogen species could contaminate ground water via seepage or runoff to adjacent streams, rivers, and lakes. The more tightly bound fraction is retained on the biosolids for slow, measured release to the soil, thereby enhancing the soil conditioning and fertilization properties of the biosolids.
• After the Mason WWTP experiments concluded, trial runs were conducted on WAS from four other WWTPs in the Greater Cincinnati area. VSS destruction of 45%-50% was achieved after 4 hours of treatment (0.2 g H2O2/g VSS and 90°C) for three of the four plants and approximately 38% for the fourth plant (the plant containing the highest percentage of industrial wastes in its influent flow). These VSS destruction levels are contrasted to VSS removals of 20%-25% for no-added-H2O2 controls. The substantial increase in VSS destruction noted for Mason’s WAS was replicated for four other diverse plants (see Figure 4-19), indicating this technology is applicable to a wide range of WAS feedstocks.
• Conceptual order-of-magnitude cost estimates were prepared for two thermo-oxidation trains, one in which energy consumed in heating process reactor contents is not conserved and the other in which a large fraction of the heating energy is recovered by a heat exchanger and reused. The estimates were based on two smaller WWTP sizes, the first with a 6-mgd average influent flow and a WAS production rate of 20,000 gpd (Mason WWTP parameters) and the second for one-fifth these rates with an average influent flow of 1.2 mgd and a sludge production rate of 4000 gpd. These estimates assume the thermo-oxidation process train is paired with a long-SRT oxidation ditch WWTP that does not practice primary settling of raw sludge. Accordingly, the entire excess sludge production from this type of WWTP is contained within the plant’s WAS inventory. The capital cost of the heat exchanger train was estimated at approximately 1.75 times larger than that of the train that does not recover energy for both plant sizes. For the larger plant flow, the estimates range roughly from $300,000-500,000 and for the smaller plant flow from approximately $150,000-250,000.
• The penalty paid in capital cost for the heat exchanger train is offset by reduced operating costs. Based on a reactor temperature of 90°C, estimated annual operating costs for the heat exchanger train are about 40% of that for the energy non-recovered train at an assumed H2O2 dose of 0.1 g/g VSS for both size plants and approximately 55% at an assumed H2O2 dose of 0.2 g/g VSS for both size plants. These estimated annual operating costs equate to
52
unit operating costs of roughly $144-$336/dry ton for the smaller H2O2 dose for both size plants and $222-$415/dry ton for the larger H2O2 dose for both size plants. The larger unit cost applies to the energy non-recovered train and the smaller unit cost to the heat exchanger train.
• Estimated costs for the thermo-oxidation process were compared to estimated or published costs for four sludge disposal options: paddle dryer system (used at Mason), rotary dryer system (used at two large Midwest plants in Milwaukee, WI and Louisville, KY), incineration, and landfilling (see Table 6.3). The thermo-oxidation process, obviously, is most closely related to the dryer systems. Whereas the thermo-oxidation process treats WAS as a slurry before any subsequent mechanical dewatering, the dryer systems utilize dewatering prior to the treatment stage to create a sludge feedstock in the 20% range. As such, the dryer systems produce pelletized biosolids with a TSS concentration of at least 95%. In contrast, the thermo-oxidation process has the option of supplying a slurry biosolids product of 1.5%-3% solids or with second-stage mechanical dewatering a semi-dry loamy biosolids of approximately 20% solids. Either thermo-oxidation option allows transfer of water to the soil during land application, which becomes a distinct advantage in water-short areas of the country.
• It is believed the optimum market niche for this technology is smaller community or rural areas that increasingly are utilizing or switching to extended aeration systems, predominately oxidation ditches. These types of WWTPs minimize and simplify plant operations by eliminating the need to handle primary sludge and operate anaerobic digesters. The entire excess sludge inventory is comprised of a highly oxidized WAS stream that requires no further treatment prior to sludge processing. Long-SRT extended aeration systems can be manipulated to remove nitrogen and phosphorus as well as organics and solids and typically produce extremely high quality secondary effluents. With the anticipated low-tech operating requirements for the thermo-oxidation process, the technology would appear to be a perfect match for extended aeration WWTPs, particularly those that utilize oxidation ditches.
• For the larger oxidation ditch facilities of 5-6 mgd, the thermo-oxidation process could compete directly with the paddle dryer sludge drying system such as the one used at Mason. The capital cost of the Komline-Sanderson paddle dryer at Mason, designed to handle an average un-dewatered sludge flow of 20,000 gpd, was $4,000,000 excluding the cost of the first-stage centrifuges. The two centrifuges added another $1,000,000. This cost is contrasted to the capital cost of the thermo-oxidation train equipped with a heat exchanger of approximately $500,000, or about 12% of that for the paddle dryer. Post- centrifugation would add another $1,000,000. This cost difference could likely represent a strong incentive for communities that otherwise might have to float a bond issue or raise capital in some other manner. The final biosolids products for the two described technologies after dewatering are different: one produces a final TSS concentration in the range of > 95%, the other approximately 20%. Both products would be Class A biosolids transportable by the customer and suitable for land application, although different in final water content, the construction cost savings are valid.
• Annual operating costs for the thermo-oxidation process with a reactor temperature of 90°C at the 5-6 mgd plant scale will be higher than those for the paddle dryer system, i.e., an
53
estimated $144-$222/dry ton (0.1 g H2O2/g VSS for the former and 0.2 g H2O2 for the latter) compared to a reported $100/dry ton. The lower dose achieves coliform reduction equal to that for the higher dose at some sacrifice in VSS destruction. Operating at a reactor temperature of 75°C to save $10,000-$15,000 in heating costs (thereby lowering unit cost to roughly $130/dry ton for the lower H2O2 dose) would result in even less VSS destruction but still meet Class A standards for fecal coliforms.
• The thermo-oxidation option that does not include a heat exchanger is believed to be better suited to smaller plants in the 1-2 mgd flow range, even though operating costs would be roughly twice that of a system with a heat exchanger. At an estimated annual operating cost of approximately $50,000-$60,000, the unit cost is relatively high ($336-$415/dry ton), but the estimated capital cost of only $250,000 and not having to operate a heat exchanger could be very attractive to a small community with limited resources and personnel.
• The bottom line on thermo-oxidation process design is that options are available that will meet Class A biosolids standards under a variety of conditions based on individual community needs and preferences. VSS destruction percentages can be varied. Heating energy can be conserved or not recovered. Capital costs can be reduced at the expense of increased operating costs or increased to reduce operating costs. Capital cost is estimated to be almost an order-of-magnitude lower than for a system designed to produce pelletized biosolids in the target WWTP size range. Annual operating costs, while higher than that for the pelletized systems, can be reduced by choosing lower reactor operating temperatures and H2O2 doses.
• The potential domestic market for this technology is projected to be at least 375 facilities ≤ 2 mgd and a lesser but still substantial number for plant sizes > 2 mgd. Considering just a population of 375 facilities with an installed cost ranging from $150,000-500,000, the estimated market potential is a conservative $56 million to $188 million.
• Although the operating cost of the thermo-oxidation process is higher per ton of VSS treated, the capital cost is much less than for existing systems of comparable capacities. The lower capital cost may place the system within the budget of small municipalities. Although the life cycle cost of the system will be higher with higher treatment costs over time, the benefits to the water balance in these municipalities or regions yields an even higher life cycle benefit. There may also be a world market for the technology, depending on the use of oxidation ditch or extended aeration technologies for wastewater treatment globally. The applications would be different for developed and developing regions. In developed regions where oxidation ditches are the primary method currently used for wastewater treatment, thermo-oxidation systems could be added to increase the re-use of local water. The developing world is also a potential market, with newly built systems able to incorporate thermo-oxidation technology from the onset in cases where the simple oxidation ditch will be the first system to be constructed (whether a commercial package plant or locally built system) and high population growth is not predicted.
54
8.0 References Abelleira, J., S.I. Pérez-Elvira, J. Sánchez-Oneto, J. R. Portela, and E. Nebot. 2012. Advanced
thermal hydrolysis of secondary sewage sludge: a novel process combining thermal hydrolysis and hydrogen peroxide addition. Res. Conserv. Recycl. 59:52-57.
Aldin, S., E. Elbeshbishy, G. Nakhla, and M.B. Ray. 2010. Modeling the effect of sonication on the anaerobic digestion of biosolids. Energy Fuels 24: 4703-4711.
Appels, L., J. Baeyens, J. Degrève, and R. Dewil. 2008. Principles and potential of the anaerobic digestion of waste-activated sludge. Prog. Energy Combust. Sci. 34:755-781.
Asimov, I. 1974. Asimov on Chemistry. Garden City, NY, Doubleday.
Bandosz, T.J., and K. Block. 2006. Effect of pyrolysis temperature and time on catalytic performance of sewage sludge/industrial sludge-based composite absorbents. Appl. Catal. B: Environ. 67:77-85.
Bates, R. 2014. Louisville Metropolitan Sewer District Report to Louisville Board/City Council. Personal Communication, July 18, 2014.
Beyer, R.A. January – December 2013. Daily Monitoring Reports for Mason OH Water Reclamation Plant Submitted Monthly to Ohio Environmental Protection Agency. Personal Communication, April 10, 2014.
Bougrier, C., H. Carrère, and J.P. Delgenès. 2005. Solubilisation of waste-activated sludge by ultrasonic treatment. Chem. Eng. J. 106:163-169.
Bougrier, C., C. Albasi, J.P. Delgenès, and H. Carrère. 2006. Effect of ultrasonic, thermal and ozone pre-treatments on waste activated sludge solubilisation and anaerobic biodegradability. Chem. Eng. Process. 45:711-718.
Bougrier, C., J.P. Delgenès, and H. Carrère. 2007. Impacts of thermal pre-treatments on the semi-continuous anaerobic digestion of waste activated sludge. Biochem. Eng. J. 34:20-27.
Cacho Rivero, J.A. 2005. Anaerobic digestion of excess municipal sludge. Optimization for increased solid destruction. PhD. Thesis, University of Cincinnati, Cincinnati OH, USA.
Cacho Rivero, J.A., N. Madhavan, M.T. Suidan, P. Ginestet, and J.-M. Audic. 2006a. Enhancement of anaerobic digestion of excess municipal sludge with thermal and/or oxidative treatment. J. Environ. Eng. 132:638-644.
55
Cacho Rivero, J.A., N. Madhavan, M.T. Suidan, P. Ginestet, and J.-M. Audic. 2006b. Oxidative co-treatment using hydrogen peroxide with anaerobic digestion of excess municipal sludge. Water Environ. Res. 78:691-700.
Cacho Rivero, J.A. and M.T. Suidan. 2006c. Effect of H2O2 dose on the thermo-oxidative cotreatment with anaerobic digestion of excess municipal sludge. Water Sci. & Tech. 54:253-259.
Camacho, P., S. Deleris, V. Geaugey, P. Ginestet and E. Paul. 2002. A comparative study between mechanical, thermal and oxidative disintegration techniques of waste activated sludge. Water Sci. Technol. 46:79-87.
CFR: Code of Federal Regulations, Title 40: Protection of the Environment, Part 503 – Standards for the Use of Disposal of Sewage Sludge, Subpart D – Pathogen and Vector Attraction Reduction.
A Plain English Guide to the EPA Part 503 Biosolids Rule, especially Chapters 2 & 5. http://water.epa.gov/scitech/wastetech/biosolids/503pe_index.cfm
A Guide to the Biosolids Risk Assessments for the EPA Part 503 Rule. http://water.epa.gov/scitech/wastetech/biosolids/503rule_index.cfm
Coelho, N.M.G., R.L. Droste, and K.J. Kennedy. 2010. Evaluation of continuous mesophilic, thermophilic and temperature phased anaerobic digestion of microwaved activated sludge. Water Res. 45:2822-2834.
Elliott, A., and T. Mahmood. 2007. Pretreatment technologies for advancing anaerobic digestion of pulp and paper bio-treatment residues. Water Res. 41:4273-4286.
EPA Solid Waste Method 9095B: Paint Filter Liquids Test. http://www.epa.gov/solidwaste/hazard/testmethods/sw846/pdfs/9095b.pdf
Erden, G. and A. Flibeli. 2010. Improving anaerobic biodegradability of biological sludges by Fenton pre-treatment: effects on single stage and two-stage anaerobic digestion. Desalination 251: 58-63.
European Commission, Enterprise and Industry Directorate. 2012. General, Memo to the Members of Working Group 2 on Nutrient Content, Product Composition, Agronomic Efficacy, Brussels, ENTR G2/KB D(2012).
Fertilizer Mixtures Market. 2009. Global industry analysis, size, share, trends and forecast 2014-2020. http://www.transparencymarketresearch.com/fertilizer-mixtures-market.html
Genç, N., Ş. Yonsel, L. Dağaşan, and A.N. Onar. 2002. Wet oxidation: a pre-treatment procedure for sludge. Waste Manage. 22:611-616.
House Bill 699. 2007. Chapter 253, Laws of 2007. Final report of the commission to study methods and costs of sewage, sludge, and septage disposal. November 1, 2008.
56
Hua, I., and J.E. Thompson. 2000. Inactivation of Escherichia coli by sonication at discreet ultrasonic frequencies. Wat. Res. 34:3888-3893.
Juneau, AK. 2013. Request for Bids: Term contract for dewatered waste activated sludge disposal services. Bid #14-025. July 17, 2013.
Khan, Y., G.K. Anderson, and D.J. Elliot. 1999. Wet oxidation of activated sludge. Water Res. 33:1681-1687.
Kim, T.H., S.R. Lee, Y.K Nam, J. Yang, C. Park, and M. Lee. 2009. Disintegration of excess activated sludge by hydrogen peroxide oxidation. Desalination 246:275-284.
Kolaczkowski, S.T., P. Plucinski, F.J. Beltran, F.J. Rivas, and D.B. McLurgh. 1999. Wet air oxidation: a review of process technologies and aspects in reactor design. Chem. Eng. J. 73:143-160.
Li, Y.Y., and T. Noike. 1992. Upgrading of anaerobic digestion of waste activated sludge by thermal pretreatment. Water Sci. Technol. 26:857-866.
Liquid Fish: About liquid fish fertilizers http://www.groworganic.com/fertilizers/organicfertilizer/liquid-fish.html (accessed August 1, 2014.)
Liu, X.L., H. Liu, G.C. Du, J. Chen. 2009. Improved bioconversion of volatile fatty acids from waste activated sludge by pretreatment. Water Environ. Res. 81:13-20.
Lougheed, T. 2011. Phosphorus paradox scarcity and overabundance of a key nutrient. Environ. Health Perspect. 119: A208–A213.
Luck, F. 1999. Wet air oxidation: past, present and future. Catalysis Today 53:81-91.
Mantzavinos, D., M. Sahibzada, A.G. Linvingston, I.S. Metcalfe, and K. Hellgardt. 1999. Wastewater treatment: wet air oxidation as a precursor to biological treatment. Catalysis Today 53:93-106.
McGivney, W., and S. Kawamura. 2008. Cost estimating manual for water treatment facilities. John Wiley and Sons, Inc.
Milwaukee Metropolitan Sewerage District. 2014. Cost recover procedures manual. January 2014.
Murray, A., A. Horvath, and K.L. Nelson. 2008. Hybrid life-cycle environmental and cost inventory of sewage sludge treatment and end-use scenarios: a case study from China. Environ. Sci. Technol. 42:3163-3169.
Nah, I.W., Y. W. Kang, K.Y. Hwang, and W.K. Song. 2000. Mechanical pretreatment of waste activated sludge for anaerobic digestion process. Water Res. 34:2362-2368.
57
New Hampshire. 2007. Disposal cost summary per wet ton. Presentation slide accessed September 22, 2014.
Neyens, E., and J. Baeyens. 2003. A review of classic Fenton’s peroxidation as an advanced oxidation technique. J. Hazard Mat. B98:33-50.
Okazawa, K., M. Henmi, and K. Sota. 1986. Saving energy in sewage sludge incineration with indirect heat dryer. National Waste Processing Conference, 1986.
Perathoner, S., and G. Centi. 2005. Wet hydrogen peroxide catalytic oxidation (WHPCO) of organic waste in agro-food and industrial streams. Topics in Catalysis 33:207-224.
Regulation (EC) No. 2003/2003 of the European Parliament and of the Council of 13 October 2003 Relating to Fertilizers. Official Journal of the European Union. http://eurlex.europa.eu/LexUriServ/LexUriServ.do?uri=OJ:L:2003:304:0001:0194:en:PDF
St. Petersburg, FL City Council. 2011. Consent agenda, Meeting of February 17, 2011. Awarding a blanket purchase agreement to Sweetwater Environmental, Inc. for sludge removal and disposal for the Water Resources Department.
Schedel, R. 2014. Corporate Account Manager, Rumpke Waste and Recycling, Email communication, July 2, 2014.
Self, M. 2014. President, Thermal Transfer Systems, representatives for Alfa Laval. Teleconference, September 12, 2014.
Tiehm, A., K. Nickel, M. Zellhorn, and U. Neis. 2001. Ultrasonic waste activated sludge disintegration for improving anaerobic stabilization. Water Res. 35:2003-2009.
Transparency Market Research. 2009. Fertilizer mixtures market - global forecast, share, size, growth and industry analysis (2010-2017).
Tyagi, V.K., and S.L. Lo. 2011. Application of physico-chemical pretreatment methods to enhance the sludge disintegration and subsequent anaerobic digestion: an up to date review. Rev. Environ. Sci. Biotechnol. 10:215-242.
United Nations Environment Programme. 2008. An Overview of the State of the World’s Fresh and Marine Waters - 2nd Edition. http://www.unep.org/dewa/vitalwater/article77.html
Wanzala, M., and A. Roy. 2006. The Africa Fertilizer Summit. African Union Special Summit of the Heads of State and Government. http://www.nepad.org/system/files/Abuja%20Declaration%20on%20Fertilizers%20for%20an%20African%20Green%20Revolution.pdf
Waste Management, Inc. 2013. Term contract for dewatered waste activated sludge disposal services. Bid No. 14-025. August 28, 2013.
58
Weemaes, M., and W. Verstraete. 1998. Evaluation of current wet sludge disintegration techniques. J. Chem Technol. Biot. 73:83-92.
Weemaes, M., H. Grootaerd, F. Simoens, and W. Verstraete. 2000. Anaerobic digestion of ozonized solids. Water Res. 34:2330-2336.
WEF. 2010. Manual of Practice 8, ASCE Manual and Report on Engineering Practice No. 76, Fifth Edition. Design of Municipal Wastewater Treatment Plants. Vol. 2, pp 14-17.
Zhang, D., Y. Chen, Y. Zhao, and X. Zhu. 2010. New sludge pretreatment method to improve methane production in waste activated sludge digestion. Environ. Sci. Technol. 44: 4802-4808.
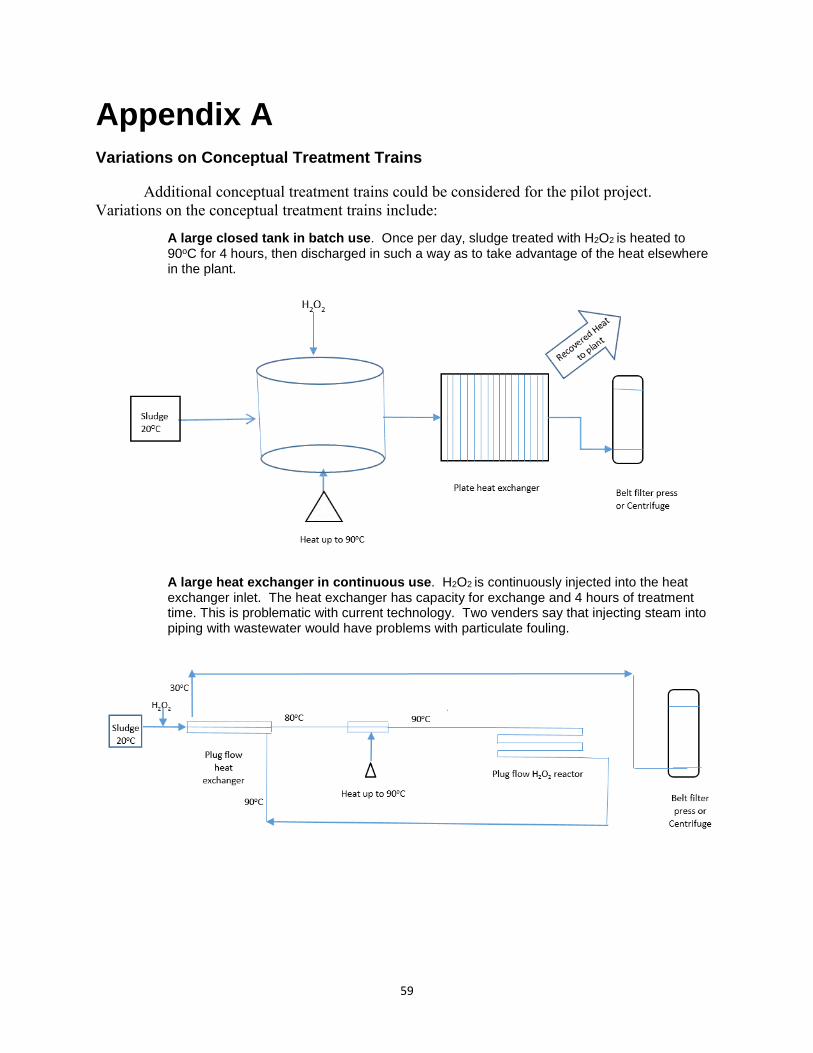
59
Appendix A Variations on Conceptual Treatment Trains
Additional conceptual treatment trains could be considered for the pilot project. Variations on the conceptual treatment trains include:
A large closed tank in batch use. Once per day, sludge treated with H2O2 is heated to 90oC for 4 hours, then discharged in such a way as to take advantage of the heat elsewhere in the plant.
A large heat exchanger in continuous use. H2O2 is continuously injected into the heat exchanger inlet. The heat exchanger has capacity for exchange and 4 hours of treatment time. This is problematic with current technology. Two venders say that injecting steam into piping with wastewater would have problems with particulate fouling.
Office of Research and Development
60
Appendix B
Quality Assurance Project Plan, L1881-QP-1-0 Category III Measurement Project
Thermo-Oxidation of Municipal Wastewater Treatment Plant Sludge for Production of Class A Biosolids
U.S. Environmental Protection Agency Contract No. EP-C-11-006
Work Assignment 2-77 Submitted to:
Richard C. Brenner Work Assignment Manager
U.S. Environmental Protection Agency Office of Research and Development
National Risk Management Research Laboratory Land Remediation and Pollution Control Division
Soils and Sediment Management Branch Cincinnati, OH 45268
Prepared by:
Robert Grosser, Ph.D. Pegasus Technical Services, Inc.
Cincinnati, OH 45219
Revision 4 April 26, 2013
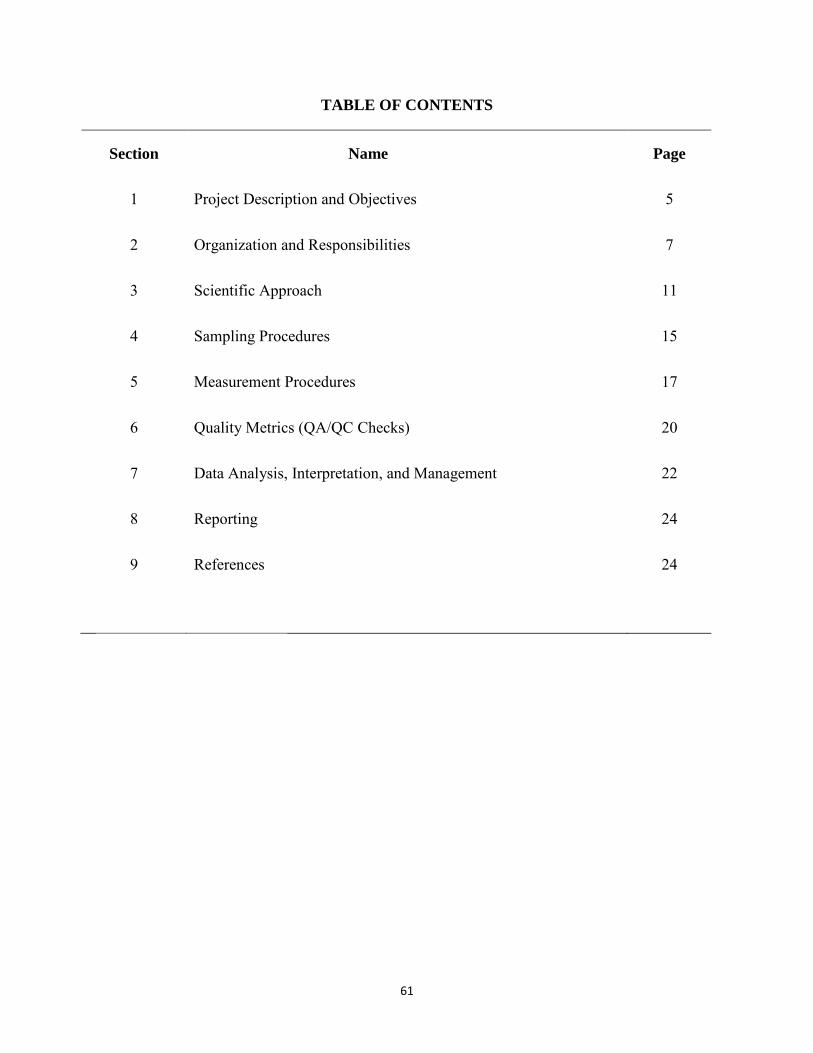
61
TABLE OF CONTENTS
Section Name Page
1 Project Description and Objectives 5
2 Organization and Responsibilities 7
3 Scientific Approach 11
4 Sampling Procedures 15
5 Measurement Procedures 17
6 Quality Metrics (QA/QC Checks) 20
7 Data Analysis, Interpretation, and Management 22
8 Reporting 24
9 References 24
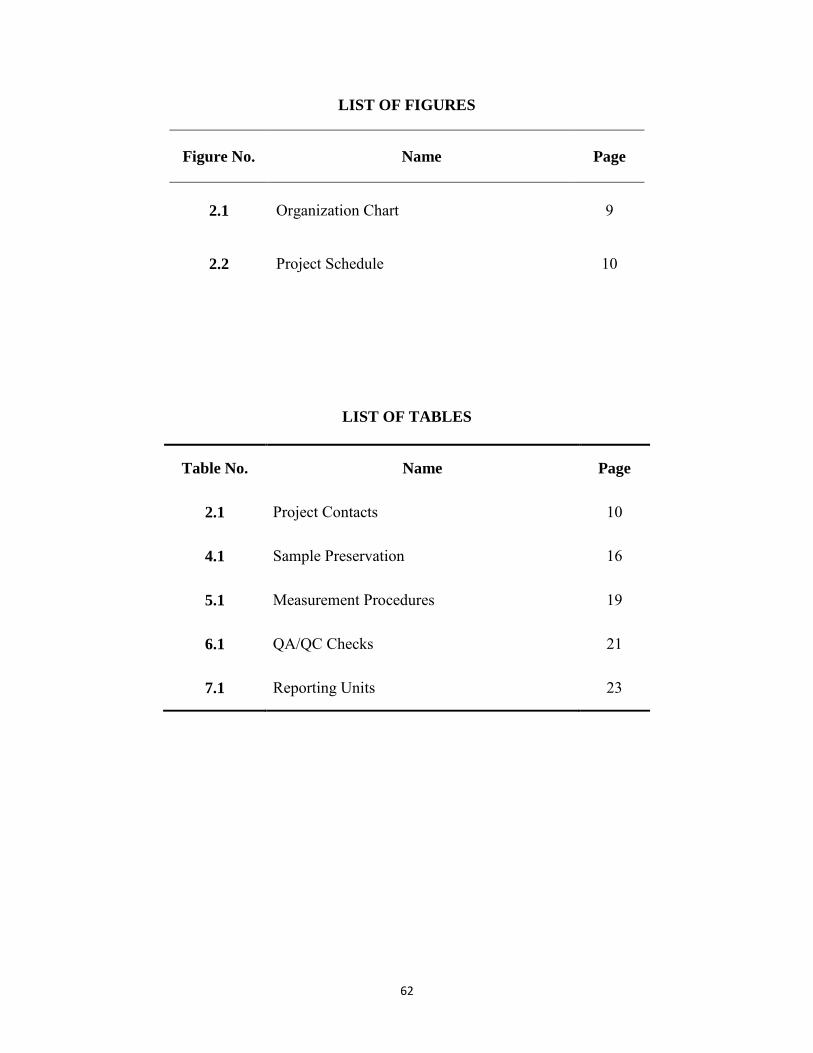
62
LIST OF FIGURES
Figure No. Name Page
2.1 Organization Chart
9
2.2 Project Schedule 10
LIST OF TABLES
Table No. Name Page
2.1 Project Contacts 10
4.1 Sample Preservation 16
5.1 Measurement Procedures 19
6.1 QA/QC Checks 21
7.1 Reporting Units 23
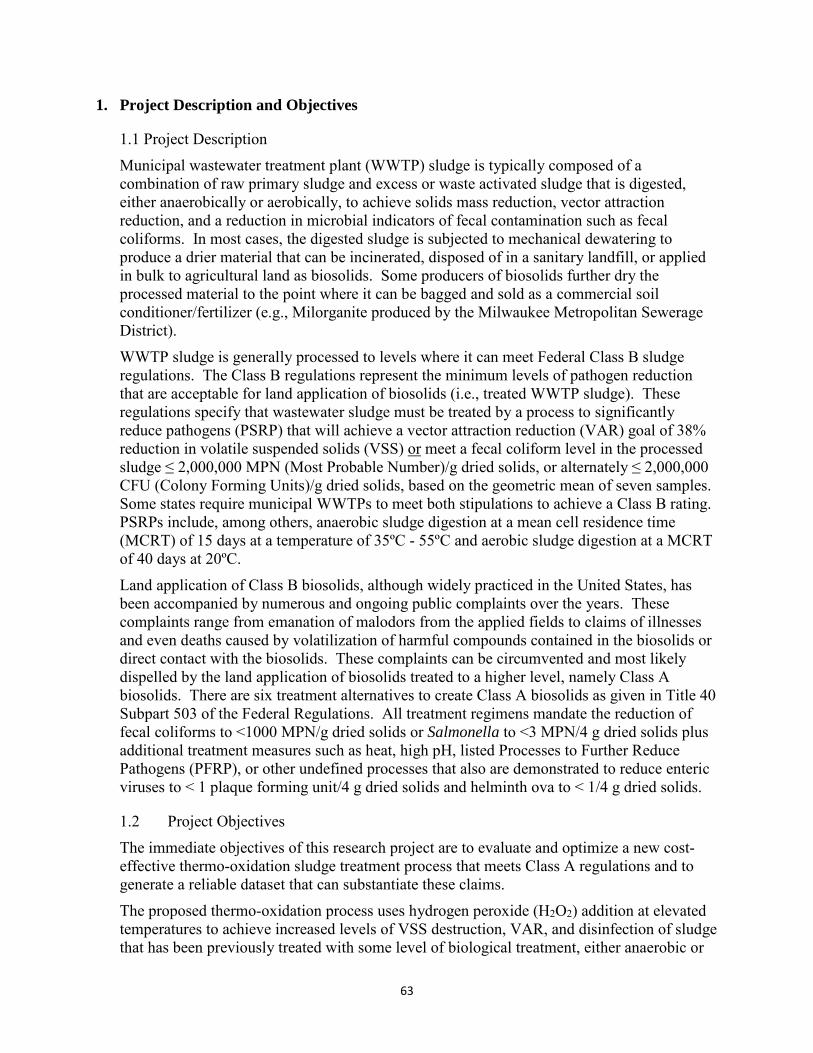
63
1. Project Description and Objectives
1.1 Project Description
Municipal wastewater treatment plant (WWTP) sludge is typically composed of a combination of raw primary sludge and excess or waste activated sludge that is digested, either anaerobically or aerobically, to achieve solids mass reduction, vector attraction reduction, and a reduction in microbial indicators of fecal contamination such as fecal coliforms. In most cases, the digested sludge is subjected to mechanical dewatering to produce a drier material that can be incinerated, disposed of in a sanitary landfill, or applied in bulk to agricultural land as biosolids. Some producers of biosolids further dry the processed material to the point where it can be bagged and sold as a commercial soil conditioner/fertilizer (e.g., Milorganite produced by the Milwaukee Metropolitan Sewerage District).
WWTP sludge is generally processed to levels where it can meet Federal Class B sludge regulations. The Class B regulations represent the minimum levels of pathogen reduction that are acceptable for land application of biosolids (i.e., treated WWTP sludge). These regulations specify that wastewater sludge must be treated by a process to significantly reduce pathogens (PSRP) that will achieve a vector attraction reduction (VAR) goal of 38% reduction in volatile suspended solids (VSS) or meet a fecal coliform level in the processed sludge ≤ 2,000,000 MPN (Most Probable Number)/g dried solids, or alternately ≤ 2,000,000 CFU (Colony Forming Units)/g dried solids, based on the geometric mean of seven samples. Some states require municipal WWTPs to meet both stipulations to achieve a Class B rating. PSRPs include, among others, anaerobic sludge digestion at a mean cell residence time (MCRT) of 15 days at a temperature of 35ºC - 55ºC and aerobic sludge digestion at a MCRT of 40 days at 20ºC.
Land application of Class B biosolids, although widely practiced in the United States, has been accompanied by numerous and ongoing public complaints over the years. These complaints range from emanation of malodors from the applied fields to claims of illnesses and even deaths caused by volatilization of harmful compounds contained in the biosolids or direct contact with the biosolids. These complaints can be circumvented and most likely dispelled by the land application of biosolids treated to a higher level, namely Class A biosolids. There are six treatment alternatives to create Class A biosolids as given in Title 40 Subpart 503 of the Federal Regulations. All treatment regimens mandate the reduction of fecal coliforms to <1000 MPN/g dried solids or Salmonella to <3 MPN/4 g dried solids plus additional treatment measures such as heat, high pH, listed Processes to Further Reduce Pathogens (PFRP), or other undefined processes that also are demonstrated to reduce enteric viruses to < 1 plaque forming unit/4 g dried solids and helminth ova to < 1/4 g dried solids.
1.2 Project Objectives
The immediate objectives of this research project are to evaluate and optimize a new cost-effective thermo-oxidation sludge treatment process that meets Class A regulations and to generate a reliable dataset that can substantiate these claims.
The proposed thermo-oxidation process uses hydrogen peroxide (H2O2) addition at elevated temperatures to achieve increased levels of VSS destruction, VAR, and disinfection of sludge that has been previously treated with some level of biological treatment, either anaerobic or
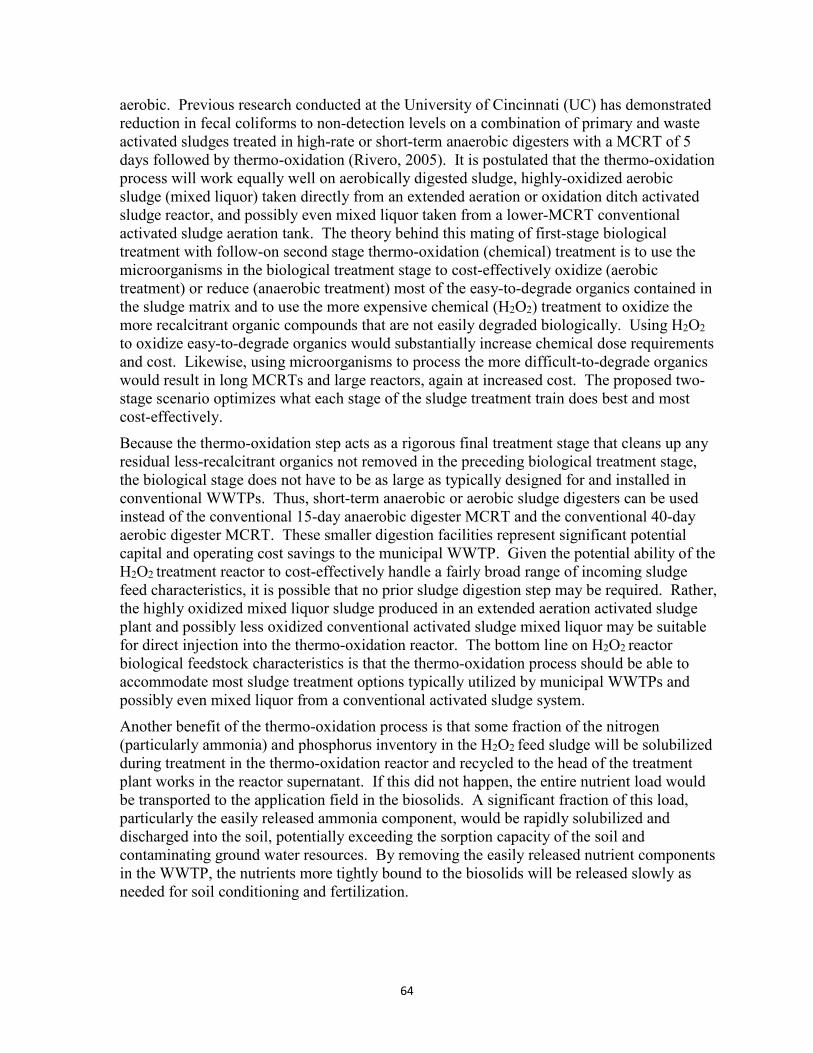
64
aerobic. Previous research conducted at the University of Cincinnati (UC) has demonstrated reduction in fecal coliforms to non-detection levels on a combination of primary and waste activated sludges treated in high-rate or short-term anaerobic digesters with a MCRT of 5 days followed by thermo-oxidation (Rivero, 2005). It is postulated that the thermo-oxidation process will work equally well on aerobically digested sludge, highly-oxidized aerobic sludge (mixed liquor) taken directly from an extended aeration or oxidation ditch activated sludge reactor, and possibly even mixed liquor taken from a lower-MCRT conventional activated sludge aeration tank. The theory behind this mating of first-stage biological treatment with follow-on second stage thermo-oxidation (chemical) treatment is to use the microorganisms in the biological treatment stage to cost-effectively oxidize (aerobic treatment) or reduce (anaerobic treatment) most of the easy-to-degrade organics contained in the sludge matrix and to use the more expensive chemical (H2O2) treatment to oxidize the more recalcitrant organic compounds that are not easily degraded biologically. Using H2O2 to oxidize easy-to-degrade organics would substantially increase chemical dose requirements and cost. Likewise, using microorganisms to process the more difficult-to-degrade organics would result in long MCRTs and large reactors, again at increased cost. The proposed two-stage scenario optimizes what each stage of the sludge treatment train does best and most cost-effectively.
Because the thermo-oxidation step acts as a rigorous final treatment stage that cleans up any residual less-recalcitrant organics not removed in the preceding biological treatment stage, the biological stage does not have to be as large as typically designed for and installed in conventional WWTPs. Thus, short-term anaerobic or aerobic sludge digesters can be used instead of the conventional 15-day anaerobic digester MCRT and the conventional 40-day aerobic digester MCRT. These smaller digestion facilities represent significant potential capital and operating cost savings to the municipal WWTP. Given the potential ability of the H2O2 treatment reactor to cost-effectively handle a fairly broad range of incoming sludge feed characteristics, it is possible that no prior sludge digestion step may be required. Rather, the highly oxidized mixed liquor sludge produced in an extended aeration activated sludge plant and possibly less oxidized conventional activated sludge mixed liquor may be suitable for direct injection into the thermo-oxidation reactor. The bottom line on H2O2 reactor biological feedstock characteristics is that the thermo-oxidation process should be able to accommodate most sludge treatment options typically utilized by municipal WWTPs and possibly even mixed liquor from a conventional activated sludge system.
Another benefit of the thermo-oxidation process is that some fraction of the nitrogen (particularly ammonia) and phosphorus inventory in the H2O2 feed sludge will be solubilized during treatment in the thermo-oxidation reactor and recycled to the head of the treatment plant works in the reactor supernatant. If this did not happen, the entire nutrient load would be transported to the application field in the biosolids. A significant fraction of this load, particularly the easily released ammonia component, would be rapidly solubilized and discharged into the soil, potentially exceeding the sorption capacity of the soil and contaminating ground water resources. By removing the easily released nutrient components in the WWTP, the nutrients more tightly bound to the biosolids will be released slowly as needed for soil conditioning and fertilization.
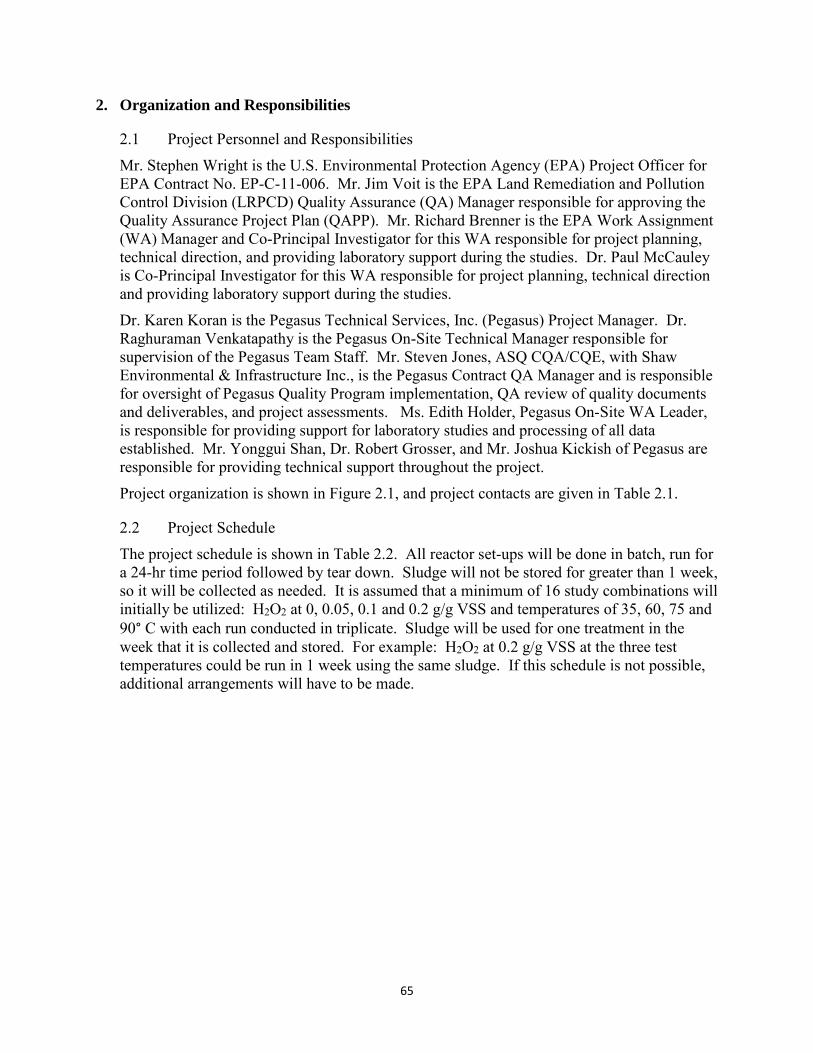
65
2. Organization and Responsibilities
2.1 Project Personnel and Responsibilities
Mr. Stephen Wright is the U.S. Environmental Protection Agency (EPA) Project Officer for EPA Contract No. EP-C-11-006. Mr. Jim Voit is the EPA Land Remediation and Pollution Control Division (LRPCD) Quality Assurance (QA) Manager responsible for approving the Quality Assurance Project Plan (QAPP). Mr. Richard Brenner is the EPA Work Assignment (WA) Manager and Co-Principal Investigator for this WA responsible for project planning, technical direction, and providing laboratory support during the studies. Dr. Paul McCauley is Co-Principal Investigator for this WA responsible for project planning, technical direction and providing laboratory support during the studies.
Dr. Karen Koran is the Pegasus Technical Services, Inc. (Pegasus) Project Manager. Dr. Raghuraman Venkatapathy is the Pegasus On-Site Technical Manager responsible for supervision of the Pegasus Team Staff. Mr. Steven Jones, ASQ CQA/CQE, with Shaw Environmental & Infrastructure Inc., is the Pegasus Contract QA Manager and is responsible for oversight of Pegasus Quality Program implementation, QA review of quality documents and deliverables, and project assessments. Ms. Edith Holder, Pegasus On-Site WA Leader, is responsible for providing support for laboratory studies and processing of all data established. Mr. Yonggui Shan, Dr. Robert Grosser, and Mr. Joshua Kickish of Pegasus are responsible for providing technical support throughout the project.
Project organization is shown in Figure 2.1, and project contacts are given in Table 2.1.
2.2 Project Schedule
The project schedule is shown in Table 2.2. All reactor set-ups will be done in batch, run for a 24-hr time period followed by tear down. Sludge will not be stored for greater than 1 week, so it will be collected as needed. It is assumed that a minimum of 16 study combinations will initially be utilized: H2O2 at 0, 0.05, 0.1 and 0.2 g/g VSS and temperatures of 35, 60, 75 and 90° C with each run conducted in triplicate. Sludge will be used for one treatment in the week that it is collected and stored. For example: H2O2 at 0.2 g/g VSS at the three test temperatures could be run in 1 week using the same sludge. If this schedule is not possible, additional arrangements will have to be made.
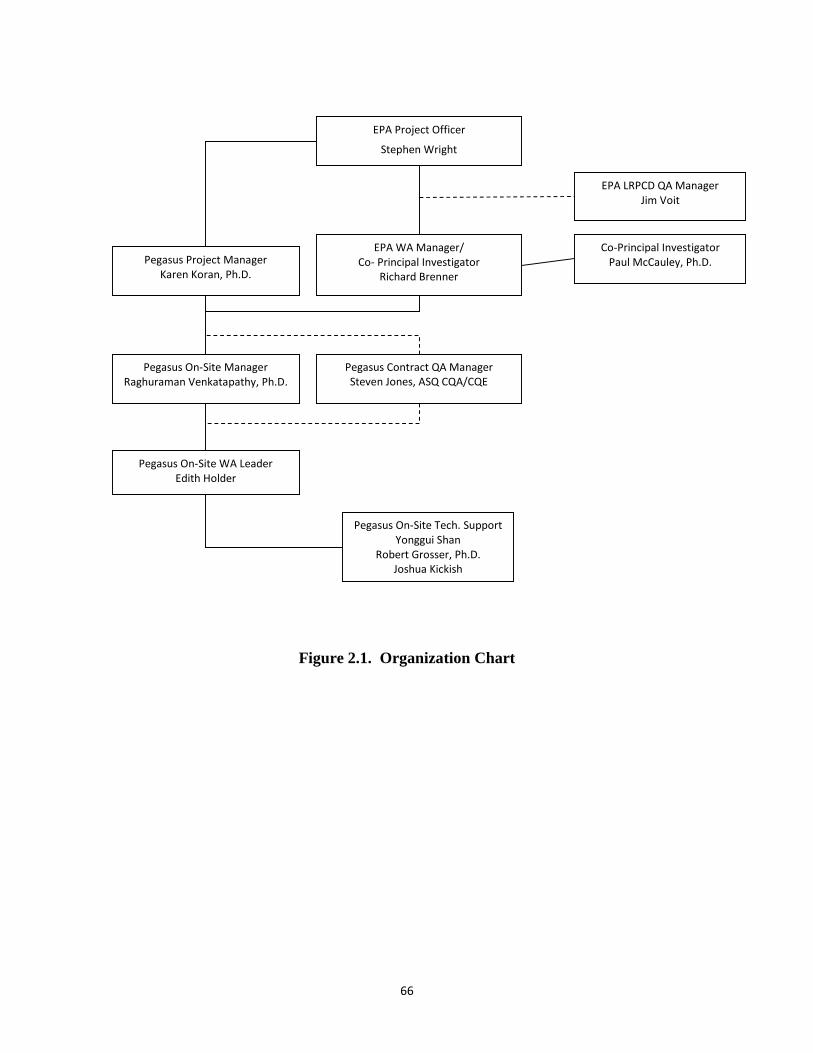
66
Figure 2.1. Organization Chart
EPA Project Officer
Stephen Wright
EPA WA Manager/ Co- Principal Investigator
Richard Brenner
EPA LRPCD QA Manager Jim Voit
Pegasus On-Site Manager Raghuraman Venkatapathy, Ph.D.
Pegasus Project Manager Karen Koran, Ph.D.
Pegasus On-Site WA Leader Edith Holder
Pegasus Contract QA Manager Steven Jones, ASQ CQA/CQE
Co-Principal Investigator Paul McCauley, Ph.D.
Pegasus On-Site Tech. Support Yonggui Shan
Robert Grosser, Ph.D. Joshua Kickish
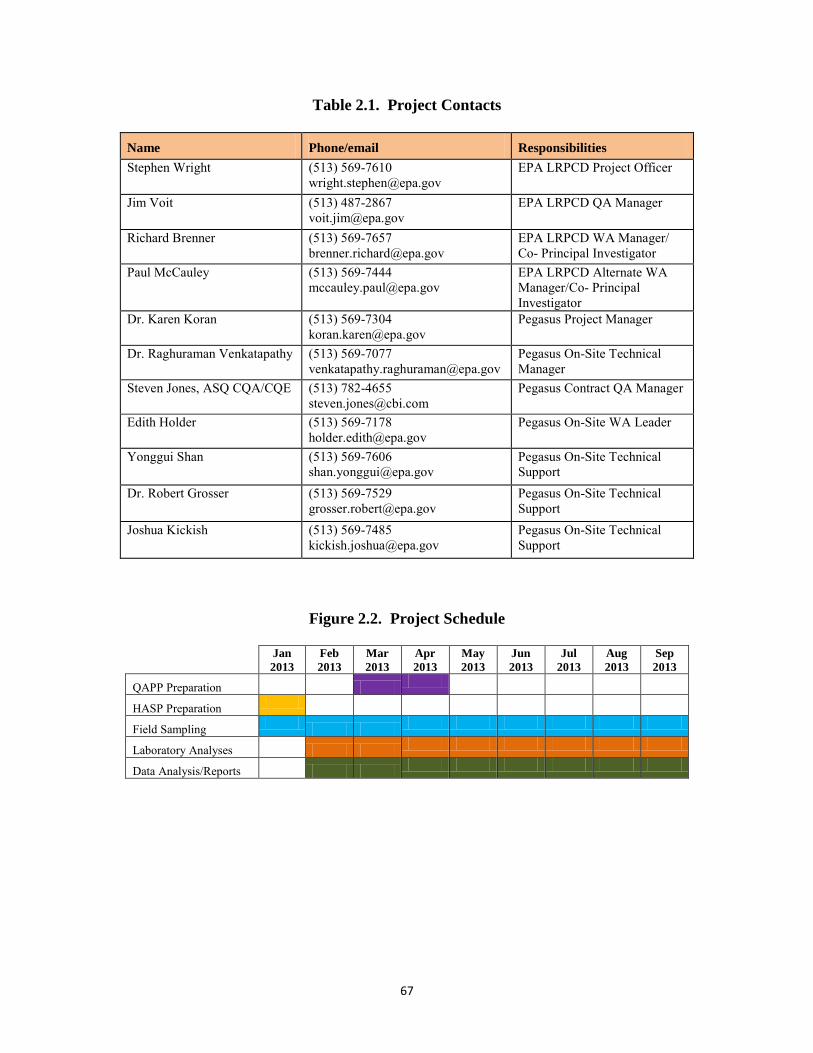
67
Table 2.1. Project Contacts
Name Phone/email Responsibilities Stephen Wright (513) 569-7610
[email protected] EPA LRPCD Project Officer
Jim Voit (513) 487-2867 [email protected]
EPA LRPCD QA Manager
Richard Brenner (513) 569-7657 [email protected]
EPA LRPCD WA Manager/ Co- Principal Investigator
Paul McCauley (513) 569-7444 [email protected]
EPA LRPCD Alternate WA Manager/Co- Principal Investigator
Dr. Karen Koran (513) 569-7304 [email protected]
Pegasus Project Manager
Dr. Raghuraman Venkatapathy (513) 569-7077 [email protected]
Pegasus On-Site Technical Manager
Steven Jones, ASQ CQA/CQE (513) 782-4655 [email protected]
Pegasus Contract QA Manager
Edith Holder (513) 569-7178 [email protected]
Pegasus On-Site WA Leader
Yonggui Shan (513) 569-7606 [email protected]
Pegasus On-Site Technical Support
Dr. Robert Grosser (513) 569-7529 [email protected]
Pegasus On-Site Technical Support
Joshua Kickish (513) 569-7485 [email protected]
Pegasus On-Site Technical Support
Figure 2.2. Project Schedule
Jan 2013
Feb 2013
Mar 2013
Apr 2013
May 2013
Jun 2013
Jul 2013
Aug 2013
Sep 2013
QAPP Preparation
HASP Preparation
Field Sampling
Laboratory Analyses
Data Analysis/Reports
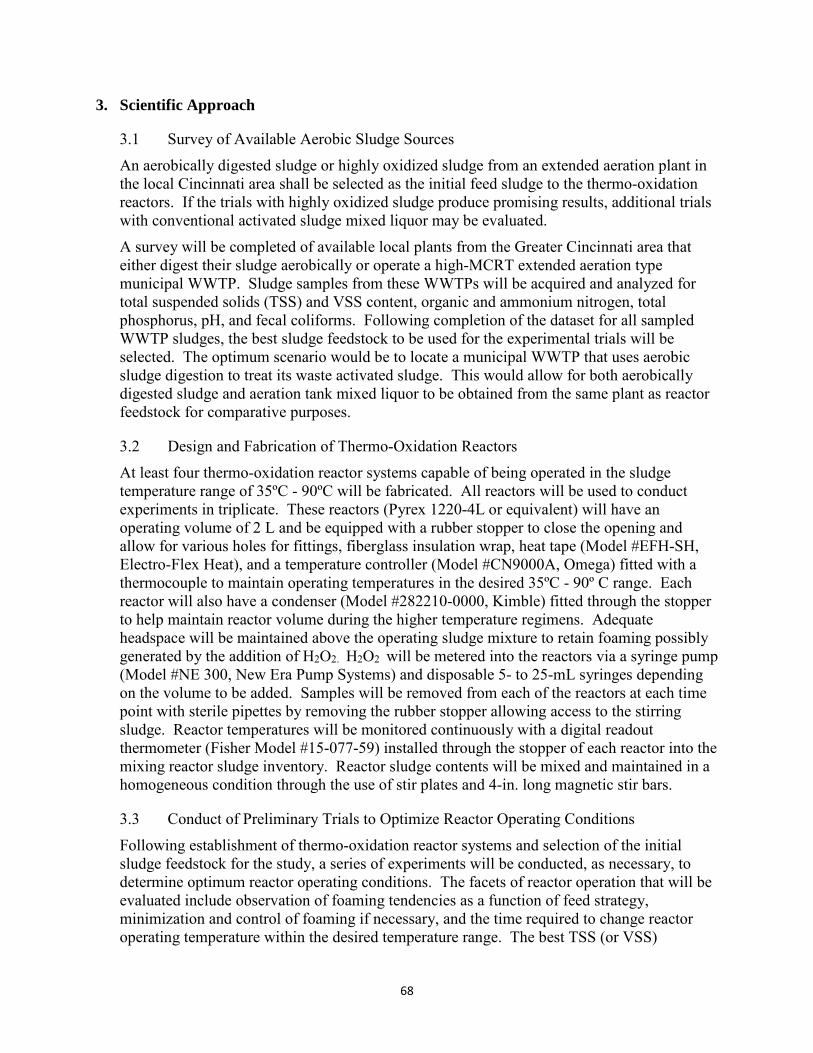
68
3. Scientific Approach
3.1 Survey of Available Aerobic Sludge Sources
An aerobically digested sludge or highly oxidized sludge from an extended aeration plant in the local Cincinnati area shall be selected as the initial feed sludge to the thermo-oxidation reactors. If the trials with highly oxidized sludge produce promising results, additional trials with conventional activated sludge mixed liquor may be evaluated.
A survey will be completed of available local plants from the Greater Cincinnati area that either digest their sludge aerobically or operate a high-MCRT extended aeration type municipal WWTP. Sludge samples from these WWTPs will be acquired and analyzed for total suspended solids (TSS) and VSS content, organic and ammonium nitrogen, total phosphorus, pH, and fecal coliforms. Following completion of the dataset for all sampled WWTP sludges, the best sludge feedstock to be used for the experimental trials will be selected. The optimum scenario would be to locate a municipal WWTP that uses aerobic sludge digestion to treat its waste activated sludge. This would allow for both aerobically digested sludge and aeration tank mixed liquor to be obtained from the same plant as reactor feedstock for comparative purposes.
3.2 Design and Fabrication of Thermo-Oxidation Reactors
At least four thermo-oxidation reactor systems capable of being operated in the sludge temperature range of 35ºC - 90ºC will be fabricated. All reactors will be used to conduct experiments in triplicate. These reactors (Pyrex 1220-4L or equivalent) will have an operating volume of 2 L and be equipped with a rubber stopper to close the opening and allow for various holes for fittings, fiberglass insulation wrap, heat tape (Model #EFH-SH, Electro-Flex Heat), and a temperature controller (Model #CN9000A, Omega) fitted with a thermocouple to maintain operating temperatures in the desired 35ºC - 90º C range. Each reactor will also have a condenser (Model #282210-0000, Kimble) fitted through the stopper to help maintain reactor volume during the higher temperature regimens. Adequate headspace will be maintained above the operating sludge mixture to retain foaming possibly generated by the addition of H2O2. H2O2 will be metered into the reactors via a syringe pump (Model #NE 300, New Era Pump Systems) and disposable 5- to 25-mL syringes depending on the volume to be added. Samples will be removed from each of the reactors at each time point with sterile pipettes by removing the rubber stopper allowing access to the stirring sludge. Reactor temperatures will be monitored continuously with a digital readout thermometer (Fisher Model #15-077-59) installed through the stopper of each reactor into the mixing reactor sludge inventory. Reactor sludge contents will be mixed and maintained in a homogeneous condition through the use of stir plates and 4-in. long magnetic stir bars.
3.3 Conduct of Preliminary Trials to Optimize Reactor Operating Conditions
Following establishment of thermo-oxidation reactor systems and selection of the initial sludge feedstock for the study, a series of experiments will be conducted, as necessary, to determine optimum reactor operating conditions. The facets of reactor operation that will be evaluated include observation of foaming tendencies as a function of feed strategy, minimization and control of foaming if necessary, and the time required to change reactor operating temperature within the desired temperature range. The best TSS (or VSS)
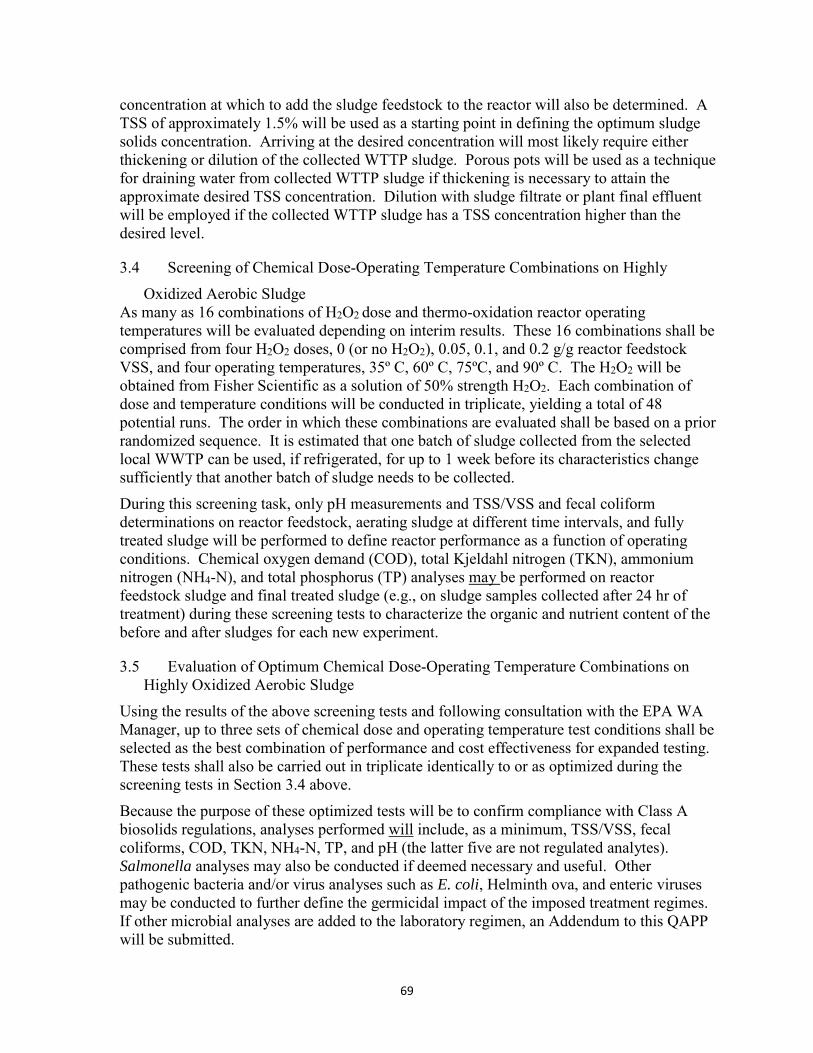
69
concentration at which to add the sludge feedstock to the reactor will also be determined. A TSS of approximately 1.5% will be used as a starting point in defining the optimum sludge solids concentration. Arriving at the desired concentration will most likely require either thickening or dilution of the collected WTTP sludge. Porous pots will be used as a technique for draining water from collected WTTP sludge if thickening is necessary to attain the approximate desired TSS concentration. Dilution with sludge filtrate or plant final effluent will be employed if the collected WTTP sludge has a TSS concentration higher than the desired level.
3.4 Screening of Chemical Dose-Operating Temperature Combinations on Highly
Oxidized Aerobic Sludge As many as 16 combinations of H2O2 dose and thermo-oxidation reactor operating temperatures will be evaluated depending on interim results. These 16 combinations shall be comprised from four H2O2 doses, 0 (or no H2O2), 0.05, 0.1, and 0.2 g/g reactor feedstock VSS, and four operating temperatures, 35º C, 60º C, 75ºC, and 90º C. The H2O2 will be obtained from Fisher Scientific as a solution of 50% strength H2O2. Each combination of dose and temperature conditions will be conducted in triplicate, yielding a total of 48 potential runs. The order in which these combinations are evaluated shall be based on a prior randomized sequence. It is estimated that one batch of sludge collected from the selected local WWTP can be used, if refrigerated, for up to 1 week before its characteristics change sufficiently that another batch of sludge needs to be collected.
During this screening task, only pH measurements and TSS/VSS and fecal coliform determinations on reactor feedstock, aerating sludge at different time intervals, and fully treated sludge will be performed to define reactor performance as a function of operating conditions. Chemical oxygen demand (COD), total Kjeldahl nitrogen (TKN), ammonium nitrogen (NH4-N), and total phosphorus (TP) analyses may be performed on reactor feedstock sludge and final treated sludge (e.g., on sludge samples collected after 24 hr of treatment) during these screening tests to characterize the organic and nutrient content of the before and after sludges for each new experiment.
3.5 Evaluation of Optimum Chemical Dose-Operating Temperature Combinations on Highly Oxidized Aerobic Sludge
Using the results of the above screening tests and following consultation with the EPA WA Manager, up to three sets of chemical dose and operating temperature test conditions shall be selected as the best combination of performance and cost effectiveness for expanded testing. These tests shall also be carried out in triplicate identically to or as optimized during the screening tests in Section 3.4 above.
Because the purpose of these optimized tests will be to confirm compliance with Class A biosolids regulations, analyses performed will include, as a minimum, TSS/VSS, fecal coliforms, COD, TKN, NH4-N, TP, and pH (the latter five are not regulated analytes). Salmonella analyses may also be conducted if deemed necessary and useful. Other pathogenic bacteria and/or virus analyses such as E. coli, Helminth ova, and enteric viruses may be conducted to further define the germicidal impact of the imposed treatment regimes. If other microbial analyses are added to the laboratory regimen, an Addendum to this QAPP will be submitted.
70
During these preliminary screening trials and subsequent tests, it is intended to sample reactor contents at regular intervals throughout a test run to define VSS destruction and fecal coliform disappearance rates. Each test run will be designed to operate for a period of at least 24 hr. Sampling will be conducted more frequently in the early portion of test run where reaction rates will be expected to be changing more rapidly. For example, a sampling schedule similar, but not necessarily identical, to the following sequence will most likely approximate the sampling schedule that will be used: 1) time (t) = initial time (i.e., immediately after the reactors have been charged with sludge feedstock at an approximate TSS concentration of 1.5% but before the temperature controllers have been turned on to increase reactor temperature to the target level; 2) t = 0 (i.e., immediately after the reactor sludge contents have reached their target temperature, a temperature rise period anticipated to range from 45 - 75 minutes, depending on temperature; 3) t = 1 hr; 4) t = 2 hr; 5) t = 4 hr; 6) t = 8 hr; and 7) t = 24 hr.
During the above sampling sequence, those reactors scheduled to receive H2O2 doses will not begin to receive them until immediately after the reactors have reached the target temperature. H2O2 doses will be delivered to the reactors at constant rates with syringe pumps (see Section 3.2) over a period of 15- 120 minutes. Initially, a dosing period of 30 minutes will be utilized. A review of screening test data may suggest that H2O2 effectiveness could be enhanced by delivering the selected dose by splitting into two or more fractional doses. In this event, sampling time points may be altered to accommodate the revised dosing schedule.
Reactor temperatures will be maintained at target levels with the use thermocouples driven by temperature controllers (see Section 3.2). All reactors will be wrapped with heat insulation to maximize heat retention. Digital readout thermometers (Fisher Model No. 15-077-59 or equivalent) calibrated from -50ºC to 300ºC will be permanently inserted through the reactor stoppers into the mixing reactor contents to assist in tweaking the controllers to maintain target temperatures within ±1ºC rather than relying solely on controller settings. Said digital readout thermometers will be calibrated against a NIST Traceable Calibrated thermometer (Model No. 210-621 or equivalent).
To assist in separating the oxidative effect of dissolved oxygen transferred into the reactor sludge from headspace atmospheric air, if any, from the oxidative impact derived from the added H2O2 , in some screening experiments two of the four reactors will be operated under a headspace air blanket and the other two under a headspace nitrogen gas blanket. In these experiments, all four reactors will be operated under a nitrogen blanket during the time it takes the reactor contents to reach their target temperature. At that time (t = 0), two of the reactors (one undosed control and one dosed with H2O2) will be switched to headspace air blanket environments and the other two (one undosed and one dosed) will continue to operate under a headspace nitrogen blanket environment.
3.6 Screening of Chemical Dose-Operating Temperature Combinations on Lesser Oxidized Mixed Liquor Sludge
If the above test runs using highly oxidized aerobic sludge produce Class A biosolids under cost-effective conditions and if time and budget constraints permit, the same or a smaller set of screening tests will be repeated on a lesser oxidized mixed liquor sludge from a conventionally operating activated sludge WWTP. Preferably, this mixed liquor reactor
71
feedstock can be collected from the same plant from which the highly oxidized sludge will be collected. If this situation is not available or feasible, mixed liquor sludge batches will be collected from a completely different municipal WWTP as determined in Section 3.1 above.
The most rigorous combination of H2O2 dose (0.2 g/g VSS) and reactor operating temperature (90º C) shall be evaluated first for compliance with Class A biosolids regulations. If these regulations are not met, either even more rigorous conditions shall be evaluated or this task may be terminated at this point (TBD by WA amendment). If compliance with Class A biosolids regulations is demonstrated in the first rigorous test run, the entire set of 16 test combinations shall be conducted and evaluated in triplicate as in Section 3.4 as time and budget resources permit.
3.7 Evaluation of Optimum Chemical Dose-Operating Temperature Combinations on Lesser Oxidized Mixed Liquor Sludge
Assuming the full complement of screening tests are carried to completion in Section 3.6 above, and further assuming that at least some of the chemical dose-operating temperature combinations evaluated therein demonstrate compliance with Class A biosolids regulations, more thorough evaluations will be conducted on up to three sets of optimized dose-temperature conditions as in Section 3.5 above, again as time and available resources dictate.
3.8 Evaluation of Optimum Chemical Dose-Operating Temperature Combinations on Biomass Concentrator Reactor (BCR) Sludge
A new activated sludge treatment process called the BCR has been developed by EPA National Risk Management Research Laboratory (NRMRL) researchers. This technology uses specially designed membranes to separate mixed liquor solids from treated effluent, thereby permitting operation under higher mixed liquor suspended solids (MLSS) concentrations and consequently higher MCRT levels than normally used in conventional activated sludge systems. This technology has been selected for evaluation in FY 2013 under the Water Technology Innovation Cluster (WTIC) Program. During the first portion of the FY 2013 test period, the EPA NRMRL researchers via a WA to be carried out at UC on this contract will be attempting to optimize performance on actual municipal wastewater in lieu of the synthetic wastewater feed employed in previous trials. At some point in their evaluation, said researchers will have optimized BCR operation and performance on actual wastewater. At this point and following completion of the sections summarized above for this WA, arrangements will be made with the staff conducting the BCR project to secure highly oxidized mixed liquor sludge batches from the BCR reactor. The BCR sludge will be subject to the same set of three optimized chemical dose-operating temperature combinations used in Section 3.7 above for highly oxidized sludge obtained from a local municipal WWTP, time and budget permitting.
3.9 Process Measurements
Process measurements for this study consist of critical measurements of TSS/VSS and fecal coliforms, and non-critical measurements of pH, NH4-N, TKN, COD, TP, and Salmonella.
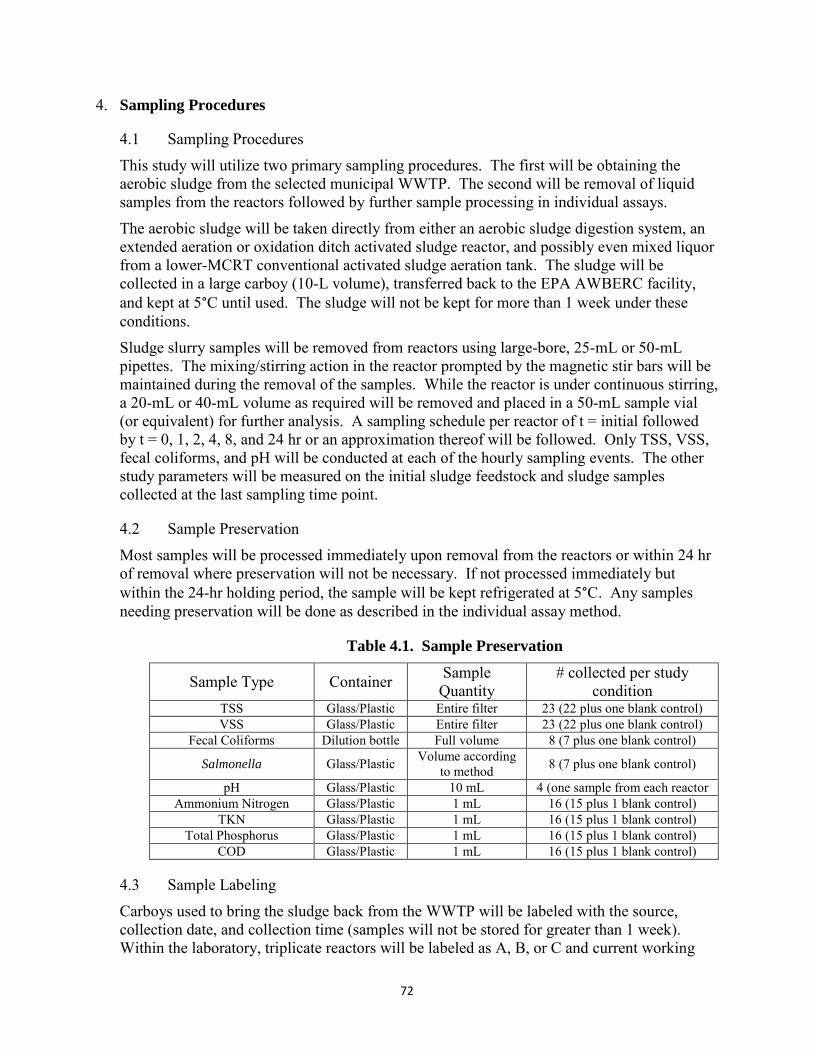
72
4. Sampling Procedures
4.1 Sampling Procedures
This study will utilize two primary sampling procedures. The first will be obtaining the aerobic sludge from the selected municipal WWTP. The second will be removal of liquid samples from the reactors followed by further sample processing in individual assays.
The aerobic sludge will be taken directly from either an aerobic sludge digestion system, an extended aeration or oxidation ditch activated sludge reactor, and possibly even mixed liquor from a lower-MCRT conventional activated sludge aeration tank. The sludge will be collected in a large carboy (10-L volume), transferred back to the EPA AWBERC facility, and kept at 5°C until used. The sludge will not be kept for more than 1 week under these conditions.
Sludge slurry samples will be removed from reactors using large-bore, 25-mL or 50-mL pipettes. The mixing/stirring action in the reactor prompted by the magnetic stir bars will be maintained during the removal of the samples. While the reactor is under continuous stirring, a 20-mL or 40-mL volume as required will be removed and placed in a 50-mL sample vial (or equivalent) for further analysis. A sampling schedule per reactor of t = initial followed by t = 0, 1, 2, 4, 8, and 24 hr or an approximation thereof will be followed. Only TSS, VSS, fecal coliforms, and pH will be conducted at each of the hourly sampling events. The other study parameters will be measured on the initial sludge feedstock and sludge samples collected at the last sampling time point.
4.2 Sample Preservation
Most samples will be processed immediately upon removal from the reactors or within 24 hr of removal where preservation will not be necessary. If not processed immediately but within the 24-hr holding period, the sample will be kept refrigerated at 5°C. Any samples needing preservation will be done as described in the individual assay method.
Table 4.1. Sample Preservation
Sample Type Container Sample Quantity
# collected per study condition
TSS Glass/Plastic Entire filter 23 (22 plus one blank control) VSS Glass/Plastic Entire filter 23 (22 plus one blank control)
Fecal Coliforms Dilution bottle Full volume 8 (7 plus one blank control)
Salmonella Glass/Plastic Volume according to method 8 (7 plus one blank control)
pH Glass/Plastic 10 mL 4 (one sample from each reactor Ammonium Nitrogen Glass/Plastic 1 mL 16 (15 plus 1 blank control)
TKN Glass/Plastic 1 mL 16 (15 plus 1 blank control) Total Phosphorus Glass/Plastic 1 mL 16 (15 plus 1 blank control)
COD Glass/Plastic 1 mL 16 (15 plus 1 blank control)
4.3 Sample Labeling
Carboys used to bring the sludge back from the WWTP will be labeled with the source, collection date, and collection time (samples will not be stored for greater than 1 week). Within the laboratory, triplicate reactors will be labeled as A, B, or C and current working
73
conditions (temperature and H2O2 concentration) noted on each. When samples are removed, the reactor letter or designation, reactor working conditions, and date and time of sample collection will be noted and recorded on a laboratory log sheet. For example:
A = reactor designation 90ºC = working temperature 0.2 g/g VSS = reactor H₂O₂ dose 6.95 = sample pH 2 hr = sampling time point
5/1/13 = sample collection date 40 mL = sample volume collected 1,880 mL = remaining reactor slurry volume after sample withdrawal 300 mL/min = air or nitrogen flow through reactor headspace
5. Measurement Procedures
5.1 Sample Analysis
The aerobically digested sludge (and/or activated sludge mixed liquor) collected in the field will be stored in a 5° C constant temperature room (CTR). The sludge will be concentrated to a TSS concentration of approximately 1.5% either by dilution with WTTP final effluent or thickening via the use of porous biopots. The collected sludge will be analyzed for TSS, VSS, pH, fecal coliforms, COD NH4-N, TKN, and TP. Copies of all methods may be found in the lab and on the L drive under L:\Public\NRMRL-PUB\Holder\Thermo-oxidative process\SOPS and Methods. SOPs are attached here for ease of the reviewer.
The thermo-oxidative test reactors are 2-L heat-tape-jacketed (insulated) bottles with glass ports at the bottom so that H2O2 can be added to the bottom of the reactor. All work involved with operating these reactors will be performed in a chemical fume hood. To run a test, aerobically digested sludge (and/or activated sludge mixed liquor) will be loaded into the reactor and brought to the desired temperature (35ºC to 90° C). After the temperature is stabilized, the desired dose of H2O2 (0.05-0.2 g/g VSS) will be added at the bottom of the reactor using a syringe pump. Samples will be taken and measured for pH, TSS, VSS, and fecal coliforms MPN routinely and for COD, nutrient species, and Salmonella MPN on selected samples. After operating conditions have been optimized, additional analyses may be added, and if so, an Addendum to this QAPP will be submitted.
5.1.1 pH Analysis
A pH probe will be calibrated with two pH standards to bracket the expected pH readings. After calibration, the probe will be submerged into a 5 - 10 mL subsample and the reading recorded after stabilization is achieved. pH will be measured at the beginning, during, and the end of any experimental run.
5.1.2 Analysis for TSS and VSS
A well-mixed sample aliquot will be filtered through a pre-weighed standard 47-mm glass-fiber filter. The residue retained on the filter is dried in an oven at 103ºC - 105°C until a constant mass is obtained. The mass of the residue on the filter represents the TSS. The residue from TSS analysis is ignited in a muffle furnace to constant weight at
74
550°C. The remaining solids represent the fixed suspended solids while the mass lost during ignition is the VSS (see Pegasus SOP PTS-TSS-VSS). Analysis of TSS/VSS will be done at every time point when sludge is removed from the reactors.
5.1.3 Analysis for Fecal Coliforms
Using the IDEXX Quanti-tray/2000® system, an MPN value for fecal coliforms is measured in water. The dehydrated medium (Colilert® ) will be dissolved in a 100-mL aliquot of water or reactor contents or a dilution thereof, poured into the Quanti-Tray®, heat sealed and incubated for 18 - 22 hr at 44.5°C + 0.2° C. A color reaction from colorless to yellow occurs if the target bacteria are present. Using the heat sealer, the media is divided between 49 large wells and 48 smaller wells. The number of positive wells is tallied and multiplied by the dilution factor to determine the MPN. See SOP for Analysis of Coliform Bacteria, Escherichia coli, and / or Enterococcus by IDEXX Bacterial Media and Colilert-18 Fecal Coliform Protocol Addendum. Fecal coliforms will be measured at the beginning, at all or selected sampling time points, and the end of any experimental run. Fecal coliform distruction or disappearance is a key requirement in establishing any treated sludge as a Class A product.
5.1.4 Analysis for Salmonella
The Rappaport-Vassiliadis agar medium-semisolid modification (MSRV) protocol in EPA Method 1682 provides enumeration of Salmonella in biosolids and sludge based on the MPN technique. The determination of Salmonella involves inoculating the enrichment medium, tryptic soy broth (TSB), with a measured amount of sample and incubating for 24 hr. After incubation, TSB is spotted onto the selective MSRV medium. The MSRV medium uses novobiocin and malachite green to inhibit non-Salmonella species, while allowing most Salmonella species to grow. Presumptively identified colonies are isolated on xylose-lysine desoxycholate agar (XLD) and confirmed using lysine-iron agar (LIA), triple sugar iron agar (TSI), and urease test medium, followed by positive serological typing using polyvalent O antisera. A total solids determination is performed on a representative biosolids and sludge sample and is used to calculate MPN/g dry weight. Salmonella density is reported as MPN/4g dry weight. 5.1.5 Nutrient Analyses
Hach Test Kits and Hach methods will be followed for the analysis of ammonium nitrogen (Method 10031), TKN (Method 8075), and total phosphorus (Method 8190). Dilution of the sample may be necessary to obtain results in the linear range of the Hach Test Kits.
In the ammonium nitrogen method, ammonia compounds combine with chlorine to form monochloramine. Monochloramine reacts with salicylate to form 5-aminosalicylate. 5-aminosalicylate is oxidized in the presence of a sodium nitroprusside catalyst to form a blue colored compound. The blue color is masked by the yellow color from the excess reagent present to give a green-colored solution. Test results are measured by spectrophotometer at 655 nm.
The TKN procedure involves digesting a sample with sulfuric acid and hydrogen peroxide to convert organic nitrogen to ammonium sulfate. Using a modified Nessler
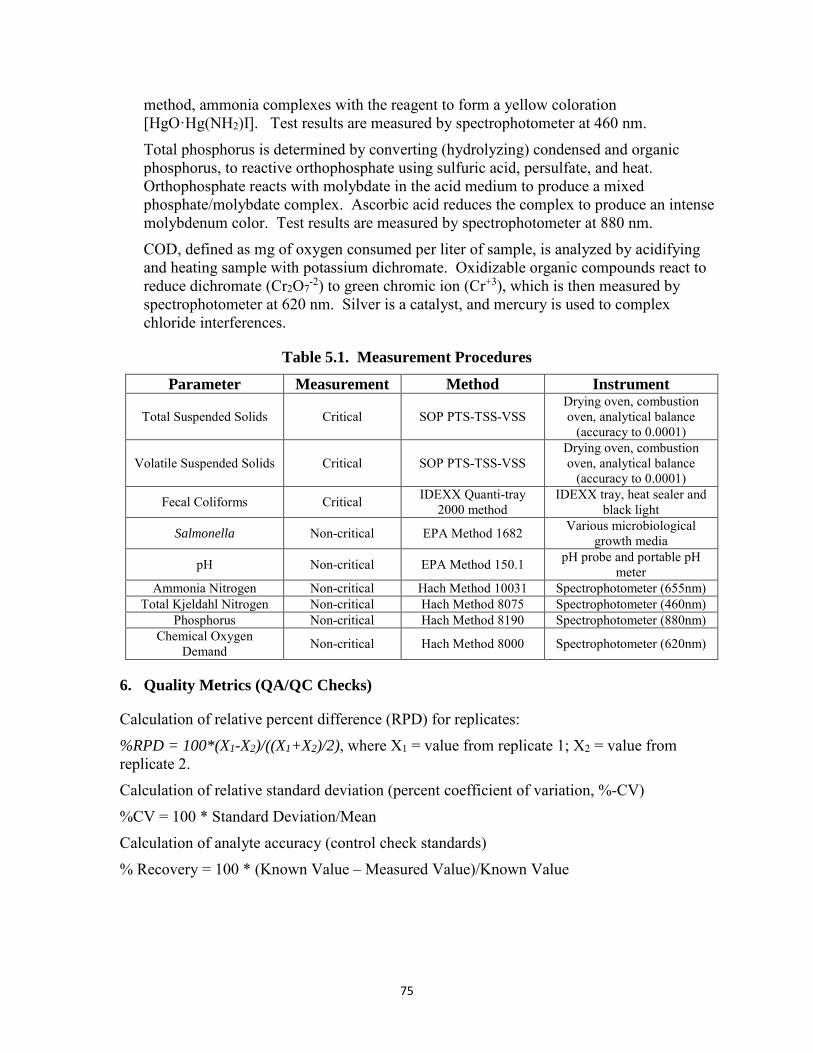
75
method, ammonia complexes with the reagent to form a yellow coloration [HgO·Hg(NH2)I]. Test results are measured by spectrophotometer at 460 nm.
Total phosphorus is determined by converting (hydrolyzing) condensed and organic phosphorus, to reactive orthophosphate using sulfuric acid, persulfate, and heat. Orthophosphate reacts with molybdate in the acid medium to produce a mixed phosphate/molybdate complex. Ascorbic acid reduces the complex to produce an intense molybdenum color. Test results are measured by spectrophotometer at 880 nm.
COD, defined as mg of oxygen consumed per liter of sample, is analyzed by acidifying and heating sample with potassium dichromate. Oxidizable organic compounds react to reduce dichromate (Cr2O7
-2) to green chromic ion (Cr+3), which is then measured by spectrophotometer at 620 nm. Silver is a catalyst, and mercury is used to complex chloride interferences.
Table 5.1. Measurement Procedures
Parameter Measurement Method Instrument
Total Suspended Solids Critical SOP PTS-TSS-VSS Drying oven, combustion oven, analytical balance
(accuracy to 0.0001)
Volatile Suspended Solids Critical SOP PTS-TSS-VSS Drying oven, combustion oven, analytical balance
(accuracy to 0.0001)
Fecal Coliforms Critical IDEXX Quanti-tray 2000 method
IDEXX tray, heat sealer and black light
Salmonella Non-critical EPA Method 1682 Various microbiological growth media
pH Non-critical EPA Method 150.1 pH probe and portable pH meter
Ammonia Nitrogen Non-critical Hach Method 10031 Spectrophotometer (655nm) Total Kjeldahl Nitrogen Non-critical Hach Method 8075 Spectrophotometer (460nm)
Phosphorus Non-critical Hach Method 8190 Spectrophotometer (880nm) Chemical Oxygen
Demand Non-critical Hach Method 8000 Spectrophotometer (620nm)
6. Quality Metrics (QA/QC Checks)
Calculation of relative percent difference (RPD) for replicates:
%RPD = 100*(X1-X2)/((X1+X2)/2), where X1 = value from replicate 1; X2 = value from replicate 2.
Calculation of relative standard deviation (percent coefficient of variation, %-CV)
%CV = 100 * Standard Deviation/Mean
Calculation of analyte accuracy (control check standards)
% Recovery = 100 * (Known Value – Measured Value)/Known Value
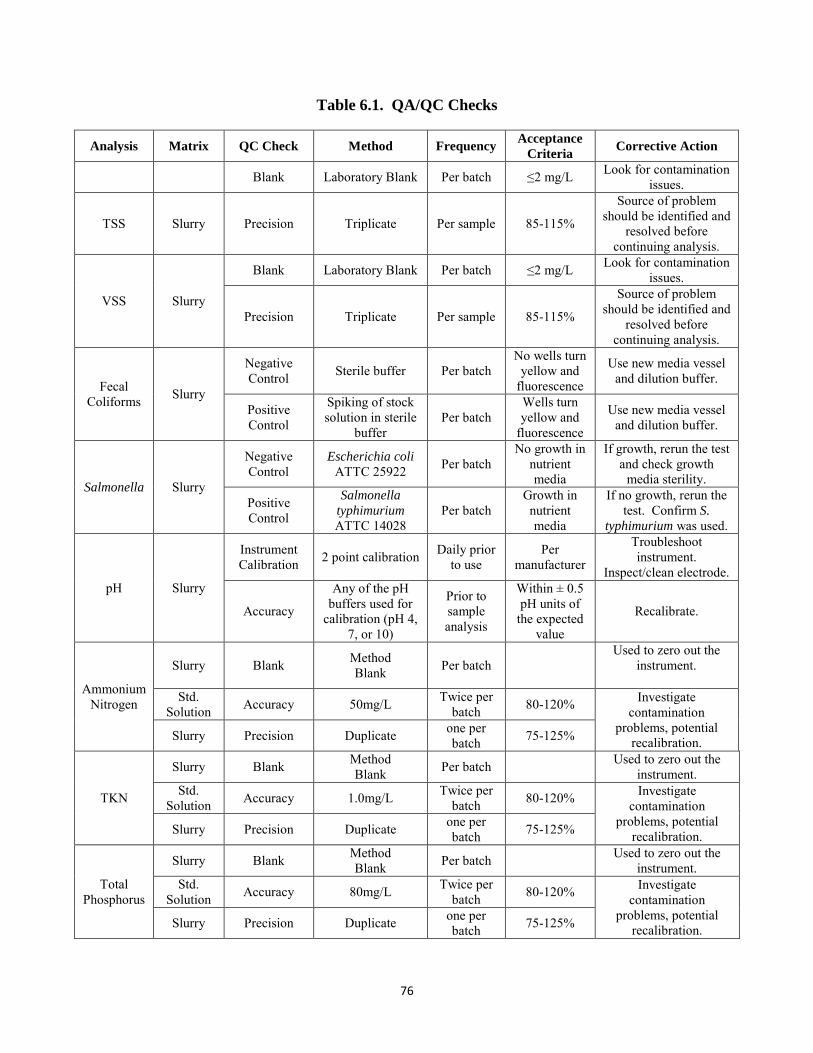
76
Table 6.1. QA/QC Checks
Analysis Matrix QC Check Method Frequency Acceptance Criteria Corrective Action
Blank Laboratory Blank Per batch ≤2 mg/L Look for contamination issues.
TSS Slurry Precision Triplicate Per sample 85-115%
Source of problem should be identified and
resolved before continuing analysis.
VSS Slurry
Blank Laboratory Blank Per batch ≤2 mg/L Look for contamination issues.
Precision Triplicate Per sample 85-115%
Source of problem should be identified and
resolved before continuing analysis.
Fecal Coliforms Slurry
Negative Control Sterile buffer Per batch
No wells turn yellow and
fluorescence
Use new media vessel and dilution buffer.
Positive Control
Spiking of stock solution in sterile
buffer Per batch
Wells turn yellow and
fluorescence
Use new media vessel and dilution buffer.
Salmonella Slurry
Negative Control
Escherichia coli ATTC 25922 Per batch
No growth in nutrient media
If growth, rerun the test and check growth
media sterility.
Positive Control
Salmonella typhimurium ATTC 14028
Per batch Growth in nutrient media
If no growth, rerun the test. Confirm S.
typhimurium was used.
pH Slurry
Instrument Calibration 2 point calibration Daily prior
to use Per
manufacturer
Troubleshoot instrument.
Inspect/clean electrode.
Accuracy
Any of the pH buffers used for
calibration (pH 4, 7, or 10)
Prior to sample analysis
Within ± 0.5 pH units of
the expected value
Recalibrate.
Ammonium Nitrogen
Slurry Blank Method Blank Per batch
Used to zero out the instrument.
Std.
Solution Accuracy 50mg/L Twice per batch 80-120% Investigate
contamination problems, potential
recalibration. Slurry Precision Duplicate one per batch 75-125%
TKN
Slurry Blank Method Blank Per batch Used to zero out the
instrument. Std.
Solution Accuracy 1.0mg/L Twice per batch 80-120% Investigate
contamination problems, potential
recalibration. Slurry Precision Duplicate one per batch 75-125%
Total Phosphorus
Slurry Blank Method Blank Per batch Used to zero out the
instrument. Std.
Solution Accuracy 80mg/L Twice per batch 80-120% Investigate
contamination problems, potential
recalibration. Slurry Precision Duplicate one per batch 75-125%
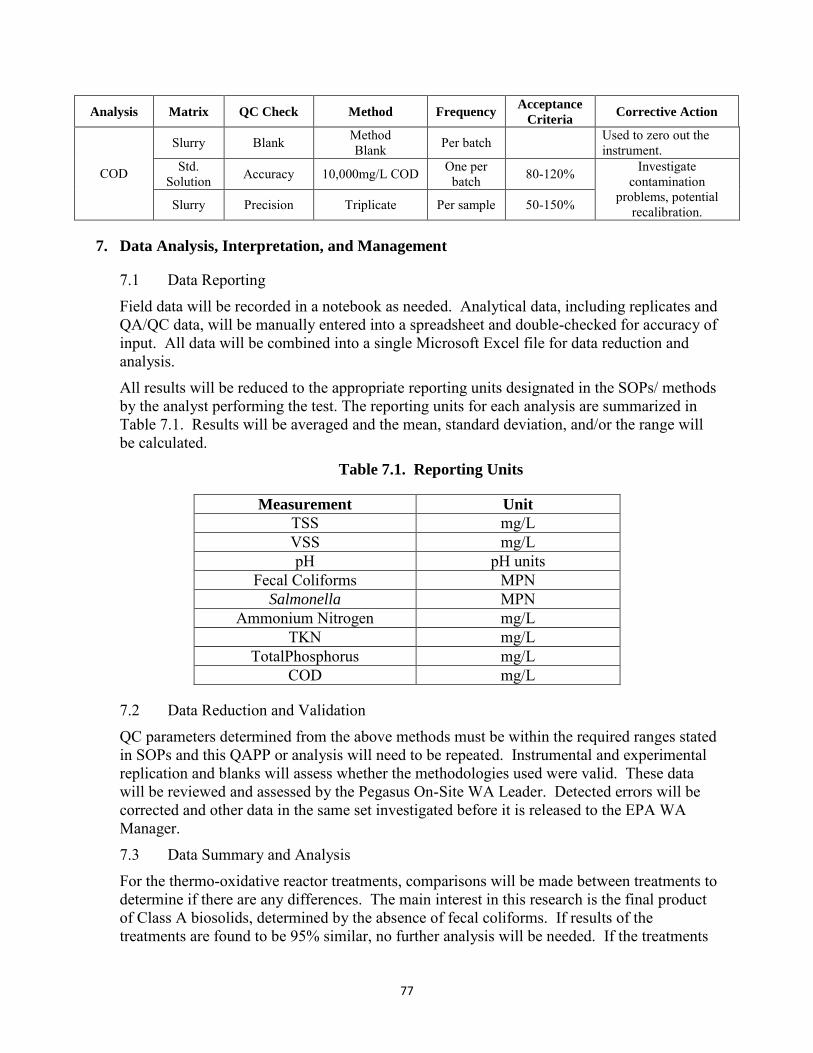
77
Analysis Matrix QC Check Method Frequency Acceptance Criteria Corrective Action
COD
Slurry Blank Method Blank Per batch Used to zero out the
instrument. Std.
Solution Accuracy 10,000mg/L COD One per batch 80-120% Investigate
contamination problems, potential
recalibration. Slurry Precision Triplicate Per sample 50-150%
7. Data Analysis, Interpretation, and Management
7.1 Data Reporting
Field data will be recorded in a notebook as needed. Analytical data, including replicates and QA/QC data, will be manually entered into a spreadsheet and double-checked for accuracy of input. All data will be combined into a single Microsoft Excel file for data reduction and analysis.
All results will be reduced to the appropriate reporting units designated in the SOPs/ methods by the analyst performing the test. The reporting units for each analysis are summarized in Table 7.1. Results will be averaged and the mean, standard deviation, and/or the range will be calculated.
Table 7.1. Reporting Units
Measurement Unit TSS mg/L VSS mg/L pH pH units
Fecal Coliforms MPN Salmonella MPN
Ammonium Nitrogen mg/L TKN mg/L
TotalPhosphorus mg/L COD mg/L
7.2 Data Reduction and Validation
QC parameters determined from the above methods must be within the required ranges stated in SOPs and this QAPP or analysis will need to be repeated. Instrumental and experimental replication and blanks will assess whether the methodologies used were valid. These data will be reviewed and assessed by the Pegasus On-Site WA Leader. Detected errors will be corrected and other data in the same set investigated before it is released to the EPA WA Manager.
7.3 Data Summary and Analysis
For the thermo-oxidative reactor treatments, comparisons will be made between treatments to determine if there are any differences. The main interest in this research is the final product of Class A biosolids, determined by the absence of fecal coliforms. If results of the treatments are found to be 95% similar, no further analysis will be needed. If the treatments
78
do not produce the final product of Class A biosolids, no further analysis will be needed. If it is found that the results are different due to treatment (temperature and/or H2O2 concentration), additional research may be initiated in an attempt to further minimize costs when the process is possibly utilized on a larger scale.
7.4 Data Storage
Field logs and laboratory records will be maintained in accordance with Section 13.2, Paper Laboratory Records, of the Office of Research and Development (ORD) Policies and Procedures Manual. Controlled access facilities that provide a suitable environment to minimize deterioration, tampering, damage, and loss will be used for the storage of records. Whenever possible, electronic records will be maintained on a secure network server that is backed up on a routine basis, such as L:\Public\NRMRL-Pub\Holder\ Thermo-oxidative process, which is currently in use. Electronic records that are not maintained on a secure network server will be periodically backed up to a secure second source storage media, transferred to an archive media (e.g., compact discs, optical discs, magnetic tape, or equivalent), or printed. Electronic records that are to be transferred for retention will be transferred to an archive media or printed, as directed by EPA.
8. Reporting
8.1 Monthly Reports
Monthly reports will be prepared by the Pegasus On-Site WA Leader, reviewed by the Pegasus On-Site Technical Manager and the Pegasus Project Manager, and submitted to EPA each month. Distribution of the monthly report to other agencies will be at the discretion of the EPA WA Manager.
8.2 Final Report
The expected final product of this research will be at least a final report and tentatively one journal article describing the results from the experimental conditions studied.
9. References
Cacho-Rivero, J.A. 2005. Anaerobic digestion of excess municipal sludge. Optimization for increased solids destruction. Doctor of Philosophy Dissertation, University of Cincinnati, Cincinnati, OH.

Office of Research and Development (8101R) Washington, DC 20460
Offal Business Penalty for Private Use $300
PRESORTED STANDARD POSTAGE & FEES PAID
EPA PERMIT NO. G-35