Embed Size (px)
Citation preview
Biopkysrcal Chemistry 40 (1991) 263-276 Elsevier Science Publishers B.V.. Amsterdam
263
BIOCHE 01576
Thermodynamics of the disproportionation of adenosine 5 ‘-diphosphate to adenosine 5 ‘-triphosphate and adenosine 5 ‘-monophosphate
II. Experimental data
Yadu B. Tewari and Robert N. Goldberg Ckemical Thermodynamics Divrsion, National lnsiifute of Standards and Technology, Gaiikersburg, Maryland 20899, USA
and
Javher V. Advani Ii. S. Fvod and Drug Adminislratwn, I600 Fisher’s Lane, Rockville, Muryland 20857. USA
Received 15 October 1990
Revised manuscript received 23 January 1991
Accepted 24 January 1991
Activity coefficients; Adenosine 5’.diphosphate; Adenosine 5’.monophosphate; Adenosine S’-triphosphate; Adenylate kinase;
enthalpy; Enzyme catalyzed reactions; Entropy; Equilibrium; Gibbs energy; Heat capacity; Thermodynamics
High-pressure liquid-chromatography and microcalorimetry have been used to determine equilibrium constants and enthalpies of
reaction for the disproportionation reaction of adenosine 5’-diphosphate (ADP) to adenosine 5’-triphosphate (ATP) and adenosine
5’-monophosphate (AMP). Adenylate kinase was used to catalyze tlus reaction. The measurements were carried out over the
temperature range 286 to 311 K, at ionic strengths varying from 0.06 to 0.33 mol kg-L, over the pH range 6.04 to 8.87, and over the
pMg range 2.22 to 7.16, where pMg = ~ log a(Mg’+ ). The equilibrium model developed by Goldberg and Tewari (see the previous
paper in this issue) was used for the analysis of the measurements. Thus, for the reference reaction: 2 ADP3- (ao) =+ AMP*-(ao)+
ATP4- (an), K ’ = 0.225&-0.010, AC” = 3.7OrtO.11 kJ mol-‘, AH” = -1Sf1.5 kJ mol-‘, AS0 = -17+5 J mol-I K-‘, and
ACpO = -46 J mol-’ K-’ at 298.15 K and 0.1 MPa. These results and the thermodynamic parameters for the auxiliary equilibria in
solution have been used to model the thermodynamics of the disproportionation reaction over a wide range of temperature, pH, ionic
strength, and magnesium ion molality. Under approximately physiological conditions (311.15 K, pH 6.94, [Mg*’ ] =1.35X 10m3 mol
kg-‘. and I = 0.23 mol kg-‘) the apparent equilibrium constant (K; = m(LAMP)m(CATP)/[m(XADP)]2) for the overall dispro-
portionation reaction is equal to 0.93 + 0.02. Thermodynamic data on the disproportionation reaction and literature values for this
apparent equilibrium constant in human red blood cells are used to calculate a molality of 1.94 X 1W4 mol kg-’ for free magnesium
ion in human red blood cells. The results are also discussed in relation to thermochemical cycles and compared with data on the
hydrolysis of the guanosine phosphates.
1. Introduction
In the preceding paper [l], an equilibrium model was developed to describe the thermodynamics of the disproportionation reaction of adenosine 5’- diphosphate (ADP) to adenosine 5’-triphosphate
(ATP) and adenosine 5’-monophosphate (AMP) ‘. As that model was being developed, the data from the literature [2-151 were also collected and then
’ The nomenclature, symbols, and abbreviations used herein
are the same as those in the preceding paper [l].
0X11-4622/91/$03.50 0 1991 - Elsevier Science Publishers B.V.
264 Y.B. Tewari et ai. / Thermodynamic data for the oden.ylrte kincue reaction, II
examined with an algorithm based upon that model. These data, for the most part, had not previously been subjected to this type of analysis. The calculations showed large discrepancies be- tween the results of different investigations. In particular, there were only two investigations [4,15] in which equilibrium data had been determined as a function of temperature. Indeed, these two in- vestigations differed with respect to the direction with which the equilibrium constant varied with temperature. Also, values of the equilibrium con- stant for the reference reaction:
2 ADP3-(ao) + AMP’-(ao) + ATP4-(ao) (A)
which were calculated from the original data varied over the range 0.2 to 2.0 at 298.15 K and 0.1 MPa. These discrepancies motivated this experimental investigation in which we used high-pressure liquid-chromatography (HPLC) for the determina- tion of apparent equilibrium constants. An en- thalpy change was also calculated from the tem- perature dependence of the equilibrium data and examined in relationship to the more accurate enthalpy change determined by direct calorimetry. This method allows for a good check on the accuracy of the overall set of measurements. We also performed experiments where pH, ionic strength, magnesium ion molality, and tempera- ture were varied systematically. These results can then be compared with the predictions of the equilibrium model developed in the preceding paper [l]. In this way, an overall picture of the thermodynamics of the disproportionation reac- tion of ADP can be obtained.
2. Experimental
The monosodium salt of AMP, the monopotas- sium salt of ADP, and the disodium salt of ATP, the adenylate kinase, and the TRIS buffer were obtained from Sigma Chemical Company 2, St. Louis, MO. Magnesium chloride hexahydrate was
’ Certain commercial materials and products art: identified in
this paper to specify adequately the experimental procedure.
Such identlfxatlon does not Imply recommendation or en-
dorsement by the National Institute of Standards and Tech- nology.
from Fisher Scientific Company. The potassium dihydrogen phosphate and disodium hydrogen phosphate used to prepare the standard “physio- logical” buffer and also in a few equilibrium measurements were, respectively, Standard Refer- ence Materials 186-I-d and 186-11-d from the Na- tional Institute of Standards and Technology. The nucleotides and the adenylate kinase were stored in desiccators at - 25 o C. The moisture contents of the nucleotides and of the magnesium chloride in mass percent, as determined by Karl Fischer titration, were: AMP, 15.9 k 0.3; ADP, 7.0 f 0.4; ATP, 10.7 + 0.5; and magnesium chloride, 54.2 + 1.5. The moisture content of the magnesium chlo- ride was also determined by drying it in an oven at 14O’C to constant weight. The result of this analysis was a moisture content of 53.5 * 0.9 mass percent in good agreement with the result ob- tained by the Karl Fischer method. However, the result obtained by drying to constant weight was judged to be more reliable than the result from the Karl Fischer determination and it was used in calculating the molalities of MgCl, in the various solutions. All of the nucleotides were assayed for impurities with the chromatographic procedures described below. From these assays it was found that the ATP contained 0.50 _t 0.02 mole percent ADP and that the ADP contained 0.39 i 0.02 mole percent AMP. The AMP was found to be chromatographically pure. The results of these assays and of the moisture determinations were applied as corrections to all of the measurements performed as a part of this study. The adenylate kinase as received from the vendor was in lyophi- lized form and had been obtained from rabbit muscle. The chromatographic analysis showed no evidence of any side reactions accompanying the disproportionation reaction. The average recovery of the nucleotides in the equilibrium measure- ments was 100.5 + 0.5 percent. Here the recovery is defined as the quantity:
100 x [total nucleotide determined
chromatographically]
/[total nucleotide weighed into solution].
This recovery is consistent with the absence of side reactions.
Y.B. Tewari er al. / Thermodynamic dara for the adenylate kinase reaction. II 265
I
! l. v
0.0 2.0 4.0 6.0 8.0 10.0
t/ minutes
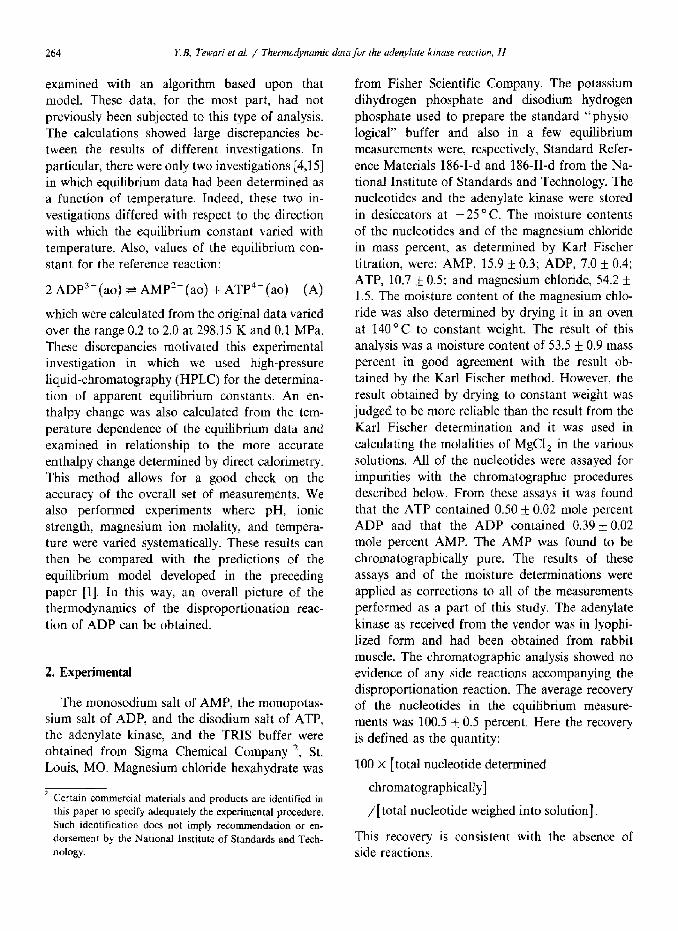
Fig. 1. Chromatogram showing the separation and quantitative
determination of AMP, ADP, and ATP. The chromatographic
analysis was done with a Hewlett-Packard 1090 HPLC with a
Serva DEAE Si 100 anion exchange column. The mobile phase
was a gradient of (A) 0.01 M phosphate at pH 2.9 and (B) 0.25
M phosphate at pH 7.3. At time zero the gradient was 85% (A)
and 15% (B). At 25.0 minutes the gradient was 100% (B). The
flow rate was 1.6 cm3 rnin-‘. A diode-array detector set at 254
run was used for detection. The retention times for AMP,
ADP, and ATP are 5.0, 7.1, and 9.4 minutes, respectively.
Chromatographic analyses were done with a Hewlett-Packard 1090 HPLC with a Serva DEAE Si 100 anion exchange column. The mobile phase was a gradient of (A) 0.01 mol dmm3 phosphate at pH 2.9 and (B) 0.25 mol dmp3 phosphate at pH 7.3. At time zero the gradient was 85% (A) and 15% (B). At 25.0 minutes the gradient was 100% (B). The flow rate of the mobile phase was 1.6 cm3 min-‘. A diode-array detector set at 254 nm was used for measurement of the amounts of nucleo- tides. All injections were done with a fixed-loop device. Typical retention times were 5.0, 7.1, and 9.4 minutes for the AMP, ADP, and ATP, respec- tively (see Fig. 1). The separation of the peaks for the nucleotides was complete in all cases. Re- sponse factors were determined on a daily basis and used to calculate the molalities of the nucleo- tides in solution.
Chromatographic data were recorded and analyzed with a Dionex AI-450 computer con-
trolled data acquisition system. This system makes use of an analog to digital conversion of the signal from, in this case, the diode-array detector. The digital data are recorded on hard disk and accu- rately integrated. These peaks can also be ex- amined more closely at any later time to de- termine whether there are any difficulties with the baseline and shoulders.
Solutions of the substrates in buffer containing the adenylate kinase and a known amount of magnesium chloride were allowed to equilibrate with gentle stirring in a thermostatted water bath. Equilibrium was approached from two directions: starting with ADP (the forward direction) and starting with a mixture containing approximately equal amounts of AMP and ATP (the reverse direction). It was found that chemical equilibrium, as evidenced by the agreement of equilibrium ratios determined from both the forward and re- verse directions, was attained within two days in all cases and within one day in most cases.
The calorimeters are of the heat-conduction type and have calibration constants varying from 17 to 22 W VP’. The sensitivity (units of V W-‘) is the inverse of the calibration constant. Each calorimeter contains two thermopiles which are solid-state bismuth selenide - bismuth telluride - bismuth antimonide thermoelectric modules manufactured by Cambion Corporation. The two thermopiles are connected in series and are situated in an aluminum block which is contained in an air thermostat, the temperature of which is controlled by means of a Wheatstone bridge cir- cuit and a controller which utilizes both propor- tional and integral modes of action. The sample vessels, which are fabricated from high-density polyethylene, contain two compartments holding approximately 0.55 and 0.45 cm3 of solution, re- spectively. The sample vessels are loaded into a copper container which is kept glued in place between the thermopile elements in a sandwich type arrangement. The vessels and their contents are allowed to equilibrate for at least one hour before the solutions in the vessel are mixed. The calibration of the calorimeters is done electrically with a calibrated voltmeter, standard resistor, and time-interval counter. The inaccuracy and impre- cision of the measurements (= 0.2% for a total
266 Y.B. Tewari et al. / Thermodynamic data for the adenykte krnase reaction, II
heat of 300 m.J) have been determined with chem-
ical reactions which produce well known amounts
of heat. Complete descriptions of the calorimeters
and their performance characteristics are given in refs. [16] and [17].
Measurements of reaction heat were performed
by mixing, in the calorimeter, a substrate solution
and an enzyme solution. The substrate solution
was prepared by dissolving a known amount of
the ADP in a TRIS buffer solution containing a known amount of magnesium chloride. The en-
zyme solution was prepared by adding the same buffer solution to the lyophilized adenylate kinase.
The extent of reaction was determined by analyses
of the reaction mixtures immediately following
completion of the heat measurements. Typically, the calorimetric measurements lasted for about
one hour after which the contents of the reaction
vessels were analyzed with the chromatograph.
These chromatographic analyses yielded apparent
equilibrium constants in agreement with the re-
sults of the equilibrium experiments. This indi-
cated that reaction had proceeded as far as possi-
ble. The calorimetric measurements also showed
that, one hour after the mixing of the enzyme and
substrate solutions, there was no heat being pro- duced. This is consistent with the absence of any
additional reactions. The “blank” heats accompa-
nying the mixing of the substrate solution and of
the enzyme solution with the buffer were, respec-
tively, -(0.63 _t 0.41) mJ and (0.27 + 0.84) mJ.
Thus, a combined correction of -(0.36 & 1.0) mJ was applied to the heats measured for the dispro-
portionation reaction. Measured heats were in the range I to 4 mJ. This correction is the primary
uncertainty in the determination of the enthalpy
change for the disproportionation reaction.
The measurement of the pH of the final reac-
tion mixtures in both the equilibrium and calori-
metric experiments was done with a combination
glass micro-electrode and an Orion Model 811 pH
meter. All measurements were done at the temper-
ature at which the disproportionation reaction oc-
curred, either in the microcalorimeter or in the
thermostats used for the equilibrium measure- ments. Calibration was done with a standard
buffer prepared from potassium dihydrogen phos-
phate (0.009695 mol kg-‘) and disodium hydro-
gen phosphate (0.03043 mol kgg’). Intercompari-
sons of this “physiological” buffer against Fisher
buffers certified at pH values of 7.0, 8.0, and 9.0
was also done with satisfactory agreement ( f 0.03) in the pH of these solutions. A measurement of
the difference in pH brought about by the dispro-
portionation reaction yielded a result of a drop in
pH equal to 0.001 f 0.018. Thus, the amount of
protons produced or absorbed is negligible within
the experimental imprecision of this measurement. All solutions used in both the calorimetric and
equilibrium measurements were prepared gravi- metrically with balances which had been checked
against calibrated weights.
3. Results and discussion
The results of the equilibrium and calorimetric
experiments are given in Tables 1 and 2, respec-
tively. The apparent equilibrium constant:
Ed, =WZ(CAMP)~(CATP),+Z(CADP)]~ (1)
given in Table 1 has been determined over a wide
range of experimental conditions, namely T = 286
to 311 K, pH = 6.04 to 8.87, I = 0.06 to 0.33 mol
kg-‘, and pMg = 2.22 to 7.16. The imprecision with which the apparent equilibrium constants
could be determined is seen to be remarkably
good in many cases. However, we judge that un-
certainties in the determination of response fac-
tors, moisture contents, and sample purities lead
to a realistic error estimate of about &2% for the apparent equilibrium constants given in Table 1.
The enthalpy change (AH;) given in Table 2 is
equal to the measured heat, which has been cor-
rected for blank heats (see Section 2), divided by
the amount of ADP undergoing disproportiona-
tion. Included in AHA are the following enthalpy
changes : A H o for the reference reaction (A);
enthalpies of proton and magnesium ion binding;
the enthalpy differences for the conversion of re-
actants and products from the standard state to
the actual experimental conditions; and the en-
thalpy of protonation of the Tris buffer. The anal-
ysis of these results will be done in terms of the model developed in the preceding paper [l]. The
Y.B. Tewari et ul. / Thermodynamic data for the adenylate kinase reaction, II 26-l
proton and magnesium ion binding constants given (A) from experiments which were performed un- in Table 1 of ref. [l] will be used in all subsequent der conditions where possible errors in the proton calculations. The first aim will be the extraction of and magnesium-ion binding corrections have the a set of thermodynamic parameters (K ‘, AG”, least effect. After this has been done, the model AH”, AS”, and ACPo ) for the reference reaction will be used to predict the variation of the equi-
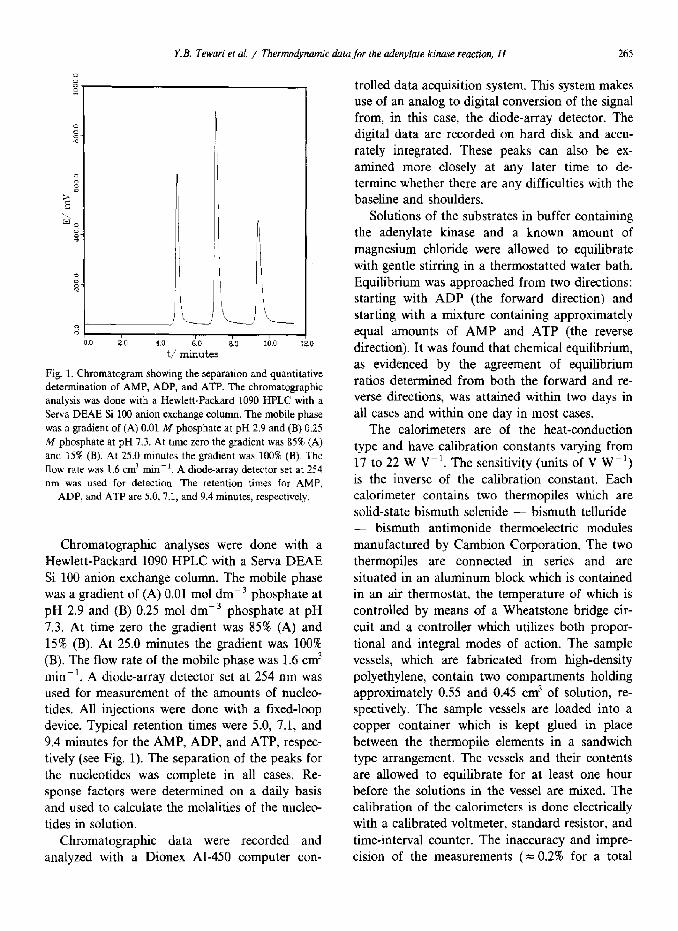
Table 1
Equilibrium data for the disproportionation of ADP to AMP and ATP. The equilibrium constant (Ki) is equal to the quantity
{ m(IAMP)m(~ATP)/[m(CADP)]‘). Each apparent equilibrium constant is the average of four to six measurements. Uncertainties
are statistical 95% confidence limits. Experiments l-38 were done with TRIS buffer while experiments 39 and 40 were done with
phosphate buffer. The concentrations of adenylate kinase was = 0.2 g kg- ‘. The ionic strength and pMg are calculated quantities
Expt. Direction KA T PH Nucleotide MgCl z Buffer KCI I Pi% no. of reaction (KI (mol kg-‘)
- 1 forward
2 reverse
3 forward
4 reverse
5 forward
6 reverse
7 forward
8 reverse
9 forward
10 reverse
11 forward
12 reverse
13 forward
14 reverse
15 forward
16 reverse
17 forward
18 reverse
19 forward
20 reverse
21 forward
22 reverse
23 forward
24 reverse
25 forward
26 reverse
27 forward
28 reverse
29 forward
30 reverse
31 forward
32 reverse
33 forward
34 reverse
35 forward
36 reverse
37 forward
38 reverse
39 forward
40 reverse
0.343 * 0.009 298.15 8.31
0.346 * 0.006 298.15 8.54
0.355 *0.01s 2X6.05 8.68
0.356 * 0.017 2X6.05 8.85
0.35210.003 292.15 8.46
0.349 * 0.003 292.15 8.67
0.357 i 0.005 304.15 8.16
0.351 f 0.002 304.15 X.34
o-351* 0.004 310.25 7.98
0.34X * 0.003 310.25 8.13
0.381 i 0.004 298.15 8.34
0.378 * 0.002 298.15 8.54
0.861*0.004 298.15 8.28
0.854 + 0.002 298.15 8.51
0.260 ? 0.002 298.15 8.40
0.258 ~0.004 298.15 8.56
0.634 k 0.004 29X.15 8.33
0.603 * 0.003 298.15 8.53
0.475 * 0.002 298.15 8.30
0.484 kO.004 298.15 8.50
1.302kO.012 298.15 8.32
1.26X*0.017 298.15 X.50
0.349 kO.006 298.15 8.40
0.361+0.005 298.15 8.54
0.408 + 0.005 298.15 a.49
0.412 +0.003 298.15 8.67
0.450 f 0.003 298.15 8.57
0.444 kO.003 298.15 8.73
0.462 +(I.003 298.15 8.68
0.458 f0.003 298.15 8.87
0.366 kO.002 29X.15 7.79
0.364 f 0.002 298.15 7.93
0.366 5 0.002 298.15 6.04
0.377 f 0.003 298.15 6.67
0.364 +0.002 298.15 6.77
0.365 kO.001 298.15 6.88
0.365 +O.OOl 298.15 7.41
0.366 kO.002 298.15 7.45
0.934 f 0.001 311.15 6.83
0.928 +0.002 311.15 7.04
0.008247 0.0005101
0.008794 0.0005099
0.008247 0.cQO5101
0.008794 0.0005099
0.008247 0.0005101
0.008794 0.ooo5099
0.008247 0.0005101
0.008794 0.0005099
0.008247 0.0005101
0.008794 o.cOo5099
0.008006 0.002412
0.008817 0.002410
0.008370 0.02433
0.008506 0.02432
0.008117 0.2372
0.009037 0.2371
0.008131 0.07690
0.008485 0.07688
0.008406 0.007455
0.008725 0.007453
0.008166 0.03994
0.008631 0.03993
0.007664 o.Ooo1959
0.008526 0.0001957
0.008226 O.ooo1958
0.008715 0.0001950
0.008122 0.0001957
0.008903 o.ooa1934
0.007159 0.0001958
0.006955 0.0001922
0.007301 0.0002121
0.008351 0.0002119
0.007318 0.0002121
0.008351 0.0002119
0.007418 0.0001700
0.007988 0.0001699
0.007619 0.0001700
0.008248 0.0001699
0.002193 0.02426
0.002177 0.02429
0.04982 0.0
0.04982 0.0
0.04979 0.0
0.04979 0.0
0.04982 0.0
0.04979 0.0
0.04982 0.0
0.04979 0.0
0.04982 0.0
0.04979 0.0
0.04978 0.0
0.04975 0.0
0.04932 0.0
0.04931 0.0
0.04495 0.0
0.04494 0.0
0.04X24 0.0
0.04823 0.0
0.04966 0.0
0.04965 0.0
0.04900 0.0
0.04898 0.0
0.04983 0.0
0.04980 0.0
0.04982 0.0491 0.04961
0.04982
0.04924
0.04984
0.04891
0.05018
0.05014
0.05018
0.05014
0.05017
0.05015
0.05017
0.05014
0.00967
0.00951
0.072
0.081
0.072
0.080
0.071
0.080
0.072
0.080
0.071
0.078
0.070
0.080
0.061
0.068
0.093
0.096
0.056
0.062
0.069
0.076
0.057
0.063
0.071
0.079
0.125 0.0489 0.132
0.1506 0.228
0.1488 0.233
0.2540 0.329
0.2493 0.326
0.0 0.052
0.0 0.061
0.0 0.026
0.0 0.037
0.0 0.034
0.0 0.038
0.0 0.044
0.0 0.048
0.2303 0.249
0.2264 0.245
6.72
6.71
6.59
6.59
6.66
6.65
6.78
6.78
6.84
6.84
6.02
6.02
4.70
4.69
2.24
2.27
3.12
3.16
5.49
5.48
4.07
4.13
7.12
7.12
6.92 6.93
6.67
6.70
6.46
6.46
7 17
7.15
6.34
6.84
6.97
7.05
7.22
7.24
3.51
3.54
268 Y, 8. Tewarr et al. / Thermodynamx data for the adenylate kinase reaction, II
librium data with pH, pMg, ionic strength, and
temperature. Detailed comparisons of the calcu-
lated and measured values of KL will then be
made.
Auxiliary data for the ionization of Tris and
phosphate buffers were also required in these
calculations. Thus for the reaction:
TRJS . H+(ao) + TRIS(ao) + H+(ao) (B)
we have used pK a = 8.07, AH” = 47.48 kJ mull’,
and AC,,’ = -50 J mol-’ K-’ at 298.15 K and 0.1 MPa based upon data given in refs. [18-201.
For the reaction:
H,PO;(ao) = H+(a)) + HPOi-(ao) (C)
we have used [21,22] pK a = 7.21, AH” = 3.60 kJ
mol-‘, and AC’ = -220 J mol-’ K-’ at 298.15
K. In treating [he experimental results of Lawson
and Veech [12] information on the binding of
Mg”+ to HPOi- was also needed. We have used
the data of Clarke et al. [23,24], namely pK O =
2.70, AH” = -12.2 kJ mol-‘, and AC; = -251
J mall’ K-r, for the reaction:
MgHPO,(ao) + Mg’+(ao) + HPOi-(ao) (D)
Experiments 1, 2, and 23 to 30 in Table 1 were
performed at high values of pH and pMg at 298.15 K and include variations in the ionic
Table 2
strength. From these results, values of KL = 0.225 f 0.010 for the reference reaction and of B = 1.5
f 0.3 kg’/’ mall”’ were obtained as a result of a
least-squares calculation. It was found that the introduction of various values for X in the activity
coefficient expression (eq. 32 in ref. [l]) had no effect on the results of these calculations. Hence it
was not included in any subsequent calculations.
The uncertainty assigned to K” is twice as large
as the statistical 95% uncertainty interval. This
was done primarily to allow for a possible error in the adjustment to the standard state. The corre-
sponding Gibbs energy change for the reference
reaction (A) is 3.70 f 0.11 kJ mall’. Similarly, with the equilibrium data determined as a func-
tion of temperature (experiments 1 to 10, 23, and
24) and at high pH and pMg, a value of AH: =
-0.9 + 1.1 kJ mol-’ at 298.15 K was obtained.
The equilibrium model was also used to treat
the calorimetric data in Table 2 and to obtain the
calculated values of AH; given in the last column
in the lower part of that table. The intermediate
quantities used in this calculation (see eq. 41 in ref. [l]) are also given in the lower part of Table 2.
Thus, from the calorimetric experiments the fol- lowing results are obtained: AH: = -2.1 i- 1.0
kJ mole’ and AC,,:* = -46 f 90 J mol-’ K-’ at
298.15 K. This calculated heat capacity change
must be considered to be only an approximate
Calorimetric data for the disproportionation reaction of ADP to AMP and ATP. The enthalpy changes (AH;) given in column 8 in
the upper part of the table are equal to the measured heats, which have been corrected for blank heats (see Section Z), divided by the
amounts of ADP undergoing dispmportionatian. Each result is the average of five or six replicate measurements where the total
molalities of ADP, MgCl,, and Tris (given in columns 5 to 7 m the upper part of the table) used in each calorimetnc vessel are,
respectively, very nearly equal. The concentration of adenylate kinase was = 0.4 g kg -’ in all experiments. The uncertainties are
statistical 95% confidence limits, All of the quantities given in the upper part of this table were measured. The quantities given in the
lower part of this table were calculated
Expt.
NO.
direction
of reaction PH m(ADP)
(md kg-‘) m(MgCl,) m(Tris) -AHA
(kJ mol- ‘)
1
2
3
Expt.
No.
forward
forward
forward
I
(mol kg-‘)
298.15 8.37
304.55 8.20
310.25 8.10
pMg “H
0.005275
o.OQ49oo
0.005131
_ ~~&m
(kJ mol-‘)
0.0002643 0.05021 1.20*0.41
0.0002927 0.04977 0.79 * 0.51
0.0002827 0.05021 1.43*0.51
AHCX wxr AH;
1 0.058 6.89 ~ 0.00493 0.23 0.52 0.28 - 2.23
2 0.056 6.90 - 0.00736 0.35 0.56 0.36 - 2.06
3 0.059 6.97 - 0.00886 0.42 0.61 0.35 - 2.81
Y.B. Trwari et al. / Thermodynamic data for the adenylate kinase reaction, II 269
value. The error eslimate assigned to AH: is largely attributable to the uncertainty in the cor- rection for the blank heats of mixing which com- prise a substantial correction to the measured reaction heats (see Section 2). The calculated val- ues of in (-0.0049 to -0.0089) given in Table 2 are consistent with the very small change in pH (-0.001 k 0.018) determined by a direct measure- ment with a pH meter. However, a value of vn equal to 0.01 + 0.006 was calculated (see eq. 25 in ref. [l]) from the data in which KL was de- termined as a function of pH. Thus, in is uncer- tain by about +O.Ol. This leads to a correspond- ing uncertainty of about &0.5 kJ mol-’ in AH:. This uncertainty is also included in the estimated error assigned to AH: as well as an allowance for possible contributions due to errors in the proton and magnesium ion binding corrections and in the adjustment to the standard state. The enthalpy change determined from the calorimetric measure- ments is in agreement with the enthalpy change as obtained from the temperature dependency of the equilibrium data and an average value of AH: = -(I.5 i 1.5) kJ mol-’ at 298.15 K is adopted. Combination of the enthalpy and Gibbs energy changes leads to an entropy change of - 17 k 5 J mall’ K’ at 298.15 K. In summary, the thermo- dynamic parameters at 298.15 K for the reference reaction are: Kz = 0.225 + 0.010, AC: = 3.70 f 0.11 kJ mall’, AH; = -1.5 f 1.5 kJ mol-‘, ASi = -1; & 5 J mol-l K-‘, and ACpTA = -46 i 90 J mol-’ K-r. A value of B of 1.5 kg”’ mol-1’2 has also been found to describe the variation of the equilibrium data with ionic strength.
Comparisons between measured and calculated values of the equilibrium constant K; are shown in Figs. 2-5. All calculated values of KL, i.e. the solid curves in these figures, are based upon the assigned values of Ki, AH:, and AC,Ta de- termined in this study and the thermodynamic parameters for the hydrogen and magnesium-ion binding reactions given in Table 1 of ref. [l] and the model described in that paper. Examination of these figures shows that the measured and calcu- lated values of KL are in agreement within the indicated error limits. The dotted lines in these figures represent estimates of the uncertainties to be associated with the calculated values of Ki.
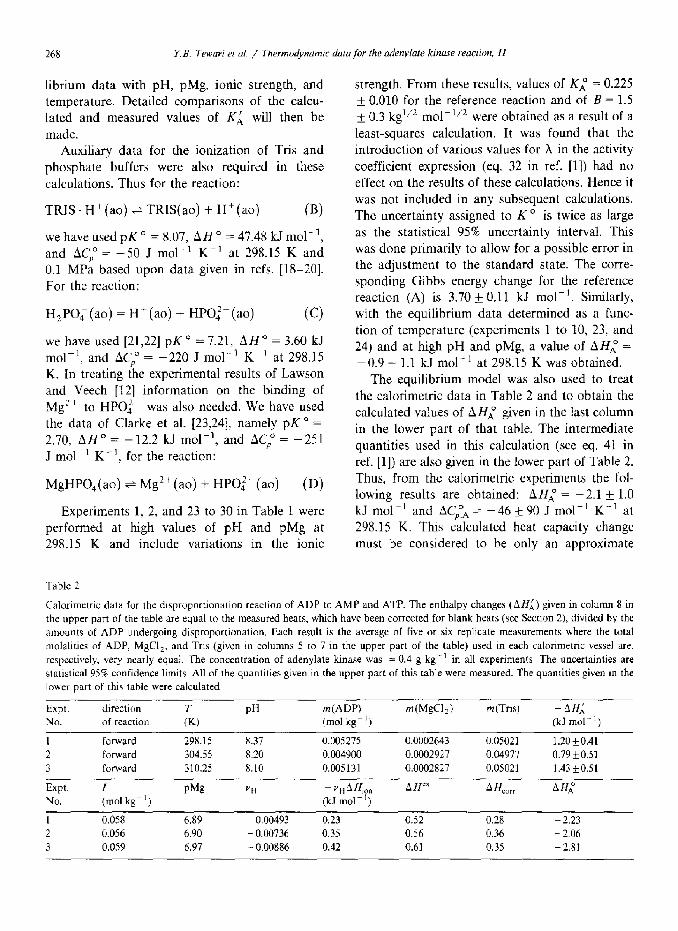
PH
Fig. 2. Plot of the apparent equilibrium constant (KX) as a
function of pH. The measured equilibrium constants (0) were
obtained at 298.15 K, 6.3 < pMg I 7.2, and 0.03 5 IS 0.06
mol kg- ‘. The solid line is the calculated curve. The dashed tines are approximate hmits of error in the calculated curve
which were obtained by perturbing the assigned values of Ki
and the constants pKIAT,, pK,,,,, and pKIAMP by their
assigned error estimates (see Table 1 in ref. 111).
These uncertainties were obtained from the esti- mated errors associated with the parameters used in the model calculation.
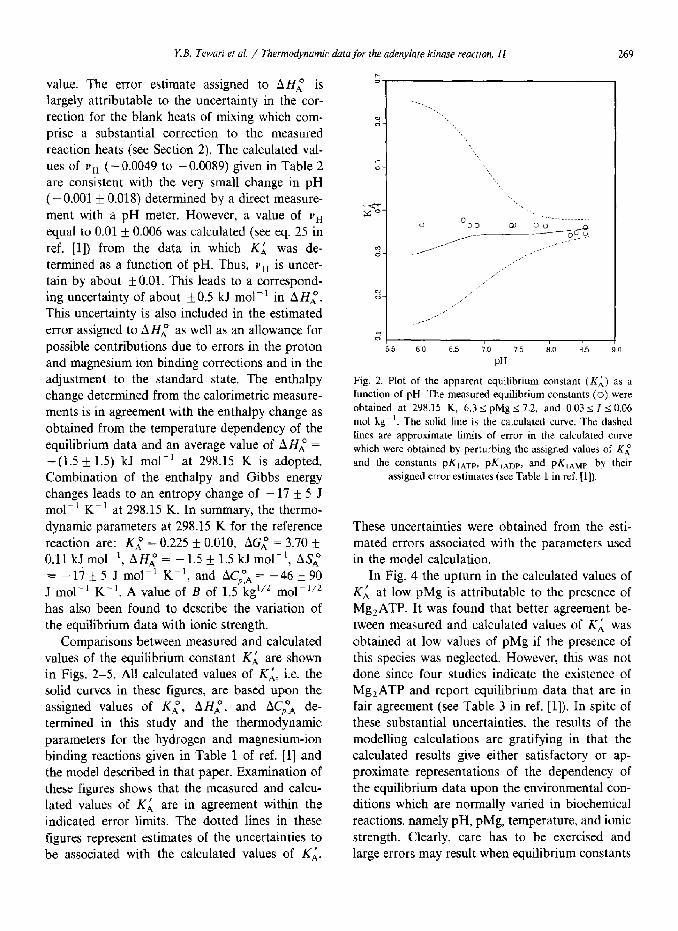
In Fig. 4 the upturn in the calculated values of Kd, at low pMg is attributable to the presence of Mg,ATP. It was found that better agreement be- tween measured and calculated values of KL was obtained at low values of pMg if the presence of this species was neglected. However, this was not done since four studies indicate the existence of Mg,ATP and report equilibrium data that are in fair agreement (see Table 3 in ref. [l]). In spite of these substantial uncertainties, the results of the modelling calculations are gratifying in that the calculated results give either satisfactory or ap- proximate representations of the dependency of the equilibrium data upon the environmental con- ditions which are normally varied in biochemical reactions, namely pH, pMg, temperature, and ionic strength. Clearly, care has to be exercised and large errors may result when equilibrium constants
270 Y.B. Tewari et al. / Thermodynamic data for the adenylate kinase reaction, Ii
or other thermodynamic data are adjusted over wide ranges of environmental conditions. We are not aware of any other investigations where all of these comparisons have been made for a system possessing this degree of complexity.
Comparisons between the results of the earlier investigations and values of calculated values of KL are given in Table 3. For the data of Lawson and Veech [12] the comparison is also made graphically in Fig. 6. This latter comparison is of particular interest since the results pertain to phys- iological conditions. Note that two of our data points (experiments 39 and 40 in Table 1 and shown as the triangles in Fig. 6) were determined under conditions very similar to those used by Lawson and Veech in their experiments. The total uncertainties in the apparent equilibrium con- stants reported by Lawson and Veech are esti- mated to be approximately five percent of the reported values [25], while our results are judged to be reliable within two percent. Thus, the results
00 0:os 0110 ok oleo _p’z5 0:30 0:35
I/ mol kg
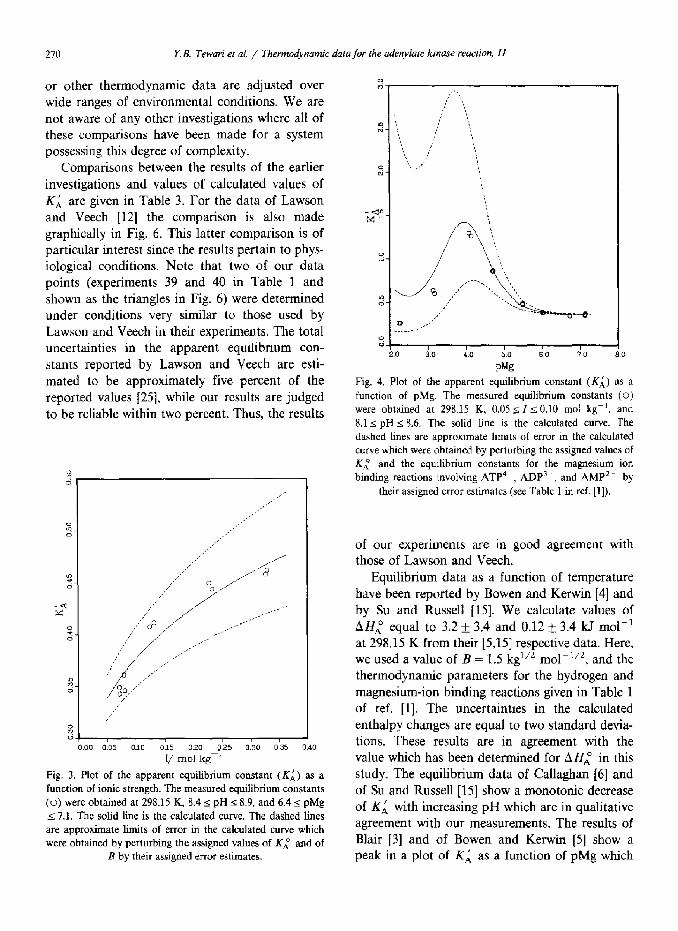
Fig. 3. Plot of the apparent equilibrium constant (KA) as a
function of ionic strength. The measured equilibrium constants
(0) were obtained at 298.15 K, 8.4 I pH I 8.9, and 4.4 s pMg
I 7.1. The solid tine is the calculated curve. The dashed lines
are approximate limits of error in the calculated curve which
were obtained by perturbing the assigned values of Kl and of
B by their assigned error estimates.
0
Fig. 4. Plot of the apparent equilibrium constant (Ki) as a
function of pMg. The measured equilibrium constants (0) were obtained at 298.15 K, 0.05 2 I~0.10 mol kg-‘, and
8.1 I pH s 8.6. The solid line is the calculated curve. The
dashed Lines are approximate limits of error in the calculated
curve which were obtained by perturbing the assigned values of
Ki and the equilibrium constants for the magnesium ion
binding reactions involving ATP4-, ADP’-, and AMP’- by
their assigned error estimates (see Table 1 in ref. [l]).
of our experiments are in good agreement with those of Lawson and Veech.
Equilibrium data as a function of temperature have been reported by Bowen and Kerwin [4] and by Su and Russell [15]. We calculate values of AH,O equal to 3.2 f 3.4 and 0.12 + 3.4 kJ mol-’ at 298.15 K from their [5,15] respective data. Here, we used a value of B = 1.5 kgl/* mol-1’2, and the thermodynamic parameters for the hydrogen and magnesium-ion binding reactions given in Table 1 of ref. [l]. The uncertainties in the calculated enthalpy changes are equal to two standard devia- tions. These results are in agreement with the value which has been determined for AH,” in this study. The equilibrium data of Callaghan [6] and of Su and Russell [15] show a monotonic decrease of KA with increasing pH which are in qualitative agreement with our measurements. The results of Blair [3] and of Bowen and Kerwin [5] show a peak in a plot of KL as a function of pMg which
Y.B. Tewari er al. / Thermodynamic data for the adenylare kinose reaction, II 271
I I
270.0 280.0 290.0 300.0 310.0 3
TI’ K
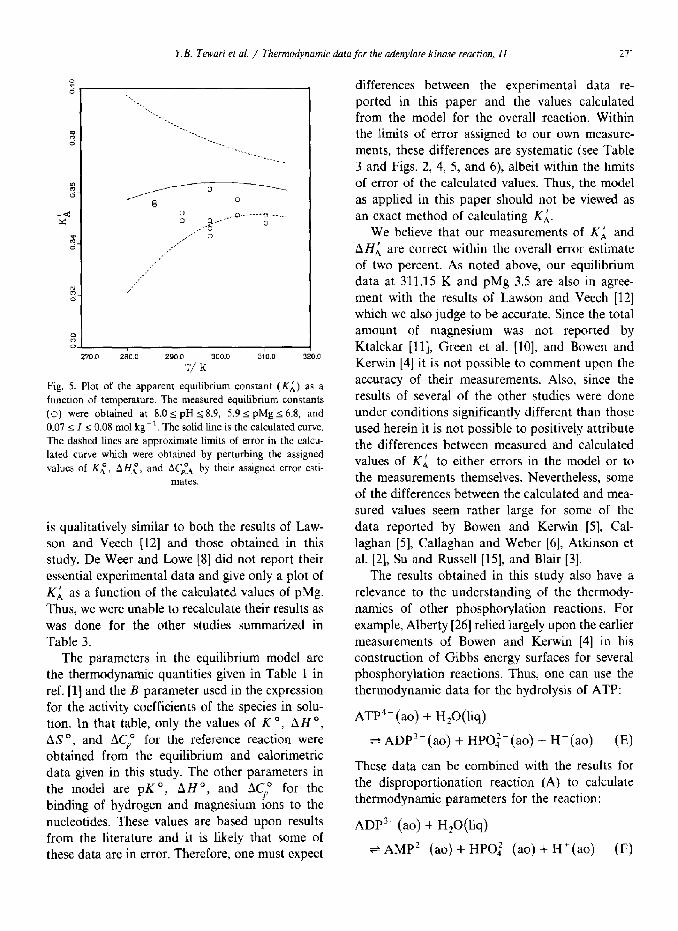
Fig. 5. Plot of the apparent equilibrium constant (Ki) as a
function of temperature. The measured equilibrium constants
(0) were obtained at 8.0 I pH 2 8.9, 5.9 I pMg 2 6.8, and
0.07 5 I 5 0.08 mol kg-‘. The solid line is the calculated curve.
The dashed lines are approximate limits of error in the calcu-
lated curve which were obtained by perturbing the assigned
values of Kl, AHZ, and AC$ by their assigned error esti-
mates.
is qualitatively similar to both the results of Law- son and Veech 1121 and those obtained in this
study. De Weer and Lowe [X] did not report their
essential experimental data and give only a plot of
KL as a function of the calculated values of pMg.
Thus, we were unable to recalculate their results as
was done for the other studies summarized in
Table 3.
The parameters in the equilibrium model are
the thermodynamic quantities given in Table 1 in
ref. [I] and the B parameter used in the expression
for the activity coefficients of the species in solu-
tion. In that table, only the values of K O, AH O,
&SO, and AC,’ for the reference reaction were
obtained from the equilibrium and calorimetric
data given in this study. The other parameters in
the model are pK ‘, AH ‘, and ACpo for the
binding of hydrogen and magnesium ions to the
nucleotides. These values are based upon results
from the literature and it is likely that some of these data are in error. Therefore, one must expect
differences between the experimental data re-
ported in this paper and the values calculated from the model for the overall reaction. Within the limits of error assigned to our own measure-
ments, these differences are systematic (see Table
3 and Figs. 2, 4, 5, and 6), albeit within the limits of error of the calculated values. Thus, the model
as applied in this paper should not be viewed as
an exact method of calculating KL.
We believe that our measurements of KL and
AH; are correct within the overall error estimate of two percent. As noted above, out equilibrium
data at 311.15 K and pMg 3.5 are also in agree-
ment with the results of Lawson and Veech [12]
which we also judge to be accurate. Since the total
amount of magnesium was not reported by
Ktalckar [ll], Green et al. [lo], and Bowen and Kerwin [4] it is not possible to comment upon the
accuracy of their measurements. Also, since the
results of several of the other studies were done
under conditions significantly different than those
used herein it is not possible to positively attribute
the differences between measured and calculated values of KA to either errors in the model or to
the measurements themselves. Nevertheless, some
of the differences between the calculated and mea-
sured values seem rather large for some of the
data reported by Bowen and Kerwin [5], Cal-
laghan [5], Callaghan and Weber [6], Atkinson et al. [2], Su and Russell [15], and Blair [3].
The results obtained in this study also have a
relevance to the understanding of the thermody-
namics of other phosphorylation reactions. For
example, Alberty [26] relied largely upon the earlier
measurements of Bowen and Kerwin [4] in his
construction of Gibbs energy surfaces for several phosphorylation reactions. Thus, one can use the
thermodynamic data for the hydrolysis of ATP:
ATP4-(ao) + H,O(liq)
+ ADP3-(ao) + HPOt-(ao) f H+(ao) (E)
These data can be combined with the results for
the disproportionation reaction (A) to calculate
thermodynamic parameters for the reaction:
ADP3-(ao) + H,O(liq)
= AMP’-(ao) + HPOi-(ao) + H+(ao) (F)
272 Y. B. Tewari et al. / Thermodynamic data for the adenylote kinase reaction, I1
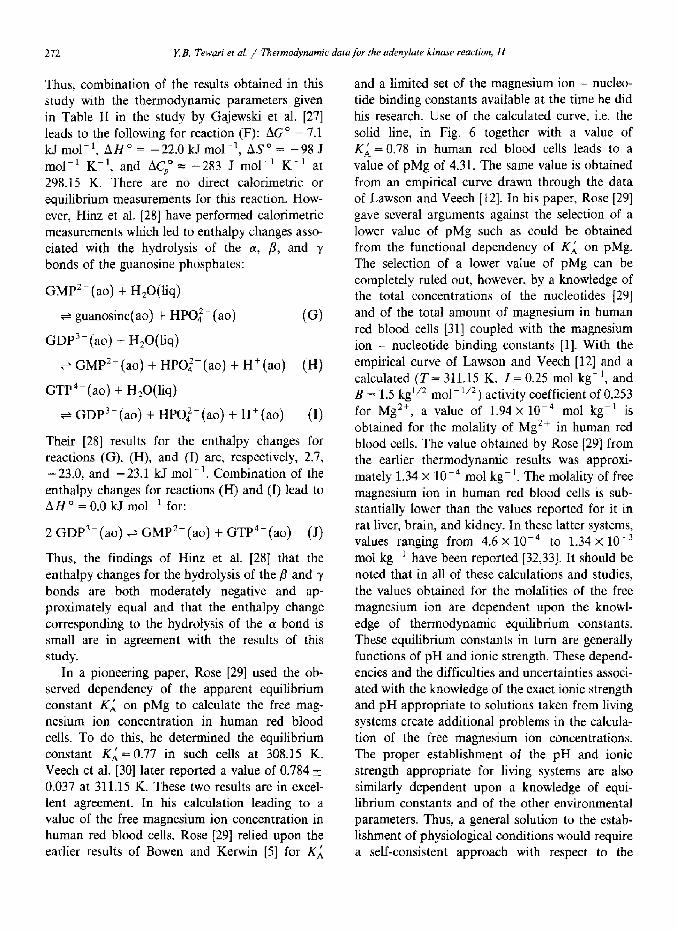
Thus, combination of the results obtained in this study with the thermodynamic parameters given in Table II in the study by Gajewski et al. [27] leads to the following for reaction (F): AC” = 7.1 kJ mol-‘, AH” = -22.0 kJ mol-‘, ASo = -98 J mol-’ K-‘, and AC” = -283 J mol-’ K-’ at 29X.15 K. There arl no direct calorimetric or equilibrium measurements for this reaction. How- ever, Hinz et al. [28] have performed calorimetric measurements which led to enthalpy changes asso- ciated with the hydrolysis of the a, p, and y bonds of the guanosine phosphates:
GMP2-(ao) + H,O(liq)
+ guanosine + HPOi- (ao) (G)
GDP3-(ao) + H,O(liq)
+ GMP*-(ao) + HPOi-(ao) + H+(ao) (H)
GTP4-(ao) + H,O(liq)
+ GDP3-(ao) + HPOi-(ao) + H+(ao) (I)
Their [28] results for the enthalpy changes for reactions (G), (H), and (I) are, respectively, 2.7, -23.0, and -23.1 kJ mol -I. Combination of the enthalpy changes for reactions (H) and (I) lead to AH o = 0.0 kJ mol-’ for:
2 GDP3-(ao) t GMP*-(ao) + GTP4-(ao) (J)
Thus, the findings of Hinz et al. [28] that the enthalpy changes for the hydrolysis of the fi and y bonds are both moderately negative and ap- proximately equal and that the enthalpy change corresponding to the hydrdysis of the a bond is small are in agreement with the results of this study.
In a pioneering paper, Rose [29] used the ob- served dependency of the apparent equilibrium constant KL on pMg to calculate the free mag- nesium ion concentration in human red blood cells. To do this, he determined the equilibrium constant Kd = 0.77 in such cells at 308.15 K. Veech et al. [30] later reported a value of 0,784 f 0.037 at 311.15 K. These two results are in excel- lent agreement. In his calculation leading to a value of the free magnesium ion concentration in human red blood cells, Rose [29] relied upon the earlier results of Bowen and Kerwin [5] for KL
and a limited set of the magnesium ion - nucleo- tide binding constants available at the time he did his research, Use of the calculated curve, i.e. the solid line, in Fig. 6 together with a value of KL = 0.78 in human red blood cells leads to a value of pMg of 4.31. The same value is obtained from an empirical curve drawn through the data of Lawson and Veech [12]. In his paper, Rose [29] gave several arguments against the selection of a lower value of pMg such as could be obtained from the functional dependency of Ki on pMg. The selection of a lower value of pMg can be completely ruled out, however, by a knowtedge of the total concentrations of the nucleolides [29] and of the total amount of magnesium in human red blood cells [31] coupled with the magnesium ion - nucleotide binding constants [l]. With the empirical curve of Lawson and Veech [I 21 and a calculated (T= 311.15 K, Z = 0.25 mol kg-‘, and B = 1.5 kgl/* mol-‘/2 ) activity coefficient of 0.253 for Mg2+, a value of 1.94 x lop4 mol kg-’ is obtained for the molality of Mg2+ in human red blood cells. The value obtained by Rose [29] from the earlier thermodynamic results was approxi- mately 1.34 X lop4 mol kg-‘. The molality of free magnesium ion in human red blood cells is sub- stantially lower than the values reported for it in rat liver, brain, and kidney. In these latter systems, values ranging from 4.6 X 10m4 to 1.34 X 10m3 mol kg-’ have been reported [32,33]. It should be noted that in all of these calculations and studies, the values obtained for the molalities of the free magnesium ion are dependent upon the knowl- edge of thermodynamic equilibrium constants. These equilibrium constants in turn are generally functions of pH and ionic strength. These depend- encies and the difficulties and uncertainties associ- ated with the knowledge of the exact ionic strength and pH appropriate to solutions taken from living systems create additional problems in the calcula- tion of the free magnesium ion concentrations. The proper establishment of the pH and ionic strength appropriate for living systems are also similarly dependent upon a knowledge of equi- librium constants and of the other environmental parameters. Thus, a general solution to the estab- lishment of physiological conditions would require a self-consistent approach with respect to the
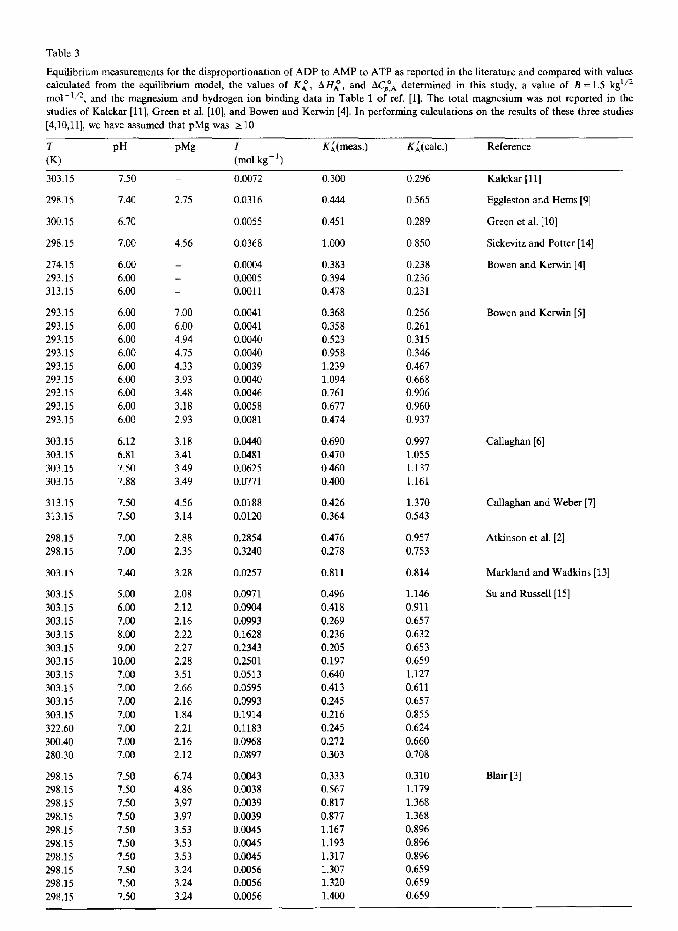
Table 3
Equilibrium measurements for the disproportionation of ADP to AMP to ATP as reported in the literature and compared with values
calculated from the equilibrium model, the values of KL, AH;, and ACpyA determined in this study, a value of B =1.5 kg’j2
mo1-“2, and the magnesium and hydrogen ion binding data in Table 1 of ref. [l]. The total magnesium was not reported in the
studies of Kalckar [ll], Green et al. [lo], and Bowen and Kerwin [4]. In performing calculations on the results of these three studies
[4,10,11], we have assumed that pMg was > 10
T
(K)
PH pMg
303.15 7.50 _ 0.0072 0.300 0.296
298.15 7.40 2.75 0.0316 0.444 0.565
300.15 6.70 0.0055 0.451 0.289
298.15 7.00 4.56 0.0368 1.000 0.850
274.15 6.00
293.15 6.00
313.15 6.00
0.0004 0.383 0.238
o.cNlo5 0.394 0.236
0.0011 0.478 0.231
Kalckar [ll]
Eggleston and Hems [9]
Green et al. [lo]
Siekevitz and Potter [14]
Bowen and Kerwin [4]
_
293.15 6.00 7.00 0.0041 0.368 0.256
293.15 6.00 6.00 0.0041 0.358 0.261 293.15 6.00 4.94 0.0040 0.523 0.315
293.15 6.00 4.75 0.0040 0.958 0.346
293.15 6.00 4.33 osm39 1.239 0.467
293.15 6.00 3.93 0.0040 1.094 0.668
293.15 6.00 3.48 0.0046 0.761 0.906
293.15 6.00 3.18 0.0058 0.677 0.960
293.15 6.00 2.93 0.0081 0.474 0.937
Bowen and Kerwin [ 51
303.15 6.12 3.18 0.0440 0.690 0.997
303.15 6.81 3.41 OS!481 0.470 1.055
303.15 7.50 3.49 0.0625 0.460 1.137
303.15 7.88 3.49 0.0771 0.400 1.161
Callaghan [6]
313.15 7.50 4.56 0.0188 0.426 1.370
313.15 7.50 3.14 0.0120 0.364 0.543
Callaghan and Weber [7]
298.15 7sxl 2.88 0.2854 0.476 0.957
298.15 7.00 2.35 0.3240 0.278 0.753
Atkinson et al. (21
303 .15 7.40 3.28 0.0257 0.811 0.814 Markland and Wadkins [13]
303.15 5.00 2.08 0.0971 0.496 1.146
303.15 6.00 2.12 0.0904 0.418 0.911
303.15 7.00 2.16 0.0993 0.269 0.657
303.15 8.00 2.22 0.1628 0.236 0.632
303.15 9.00 2.27 0.2343 0.205 0.653
303.15 10.00 2.28 0.2501 0.197 0.659
303.15 7.00 3.51 0.0513 0.640 1.127
303.15 7.00 2.66 0.0595 0.413 0.611
303.15 7.00 2.16 0.0993 0.245 0.657
303.15 7.00 1.84 0.1914 0.216 0.855
322.60 7.OQ 2.21 0.1183 0.245 0.624
300.40 7.00 2.16 0.0968 0.272 0.660
280.30 7.00 2.12 0.0897 0.303 0.708
Su and Russell [15]
298.15 7.50 6.74 0.0043 0.333 0.310
298.15 7.50 4.86 0.0038 0.567 1.179
298.15 7.50 3.97 0.0039 0.817 1.368
298.15 7.50 3.97 0.0039 0.877 1.368
298.15 7.50 3.53 0.0045 1.167 0.896
298.15 7.50 3.53 0.0045 1.193 0.896
298.15 7.50 3.53 0.0045 1.317 0.896
298.15 7.50 3.24 0.0056 1.307 0.659
298.15 7.50 3.24 0.0056 1.320 0.659
298.15 7.50 3.24 0.0056 1.400 0.659
Blair [3]
I (mol kg-‘)
KL(meas.) KL(calc.) Reference
274
Table 3 (continued)
Y. B. Tewat? et al. / Thermodynamic data for the adenylate kinase reaction, II
T
w
298.15 298.15
298.15 208.15
298.15
298.15 298.15 298.15 298.15 298.15
2108 311.15 311.15 311.15 311.15 311.15 311.15
311.15 311.15
311.15 311.15 311.15 311.15 311.15 311.15
311.15 311.15
PH PM~ I (mol kg-‘)
K;(meas.) K;(calc.) Reference
7.50 2.06 0.0647 0.900 0.667 7.50 2.66 0.0136 0.543 0.486
7.50 6.11 0.0992 0.433 0.394 7.50 4.55 0.0989 0.637 0.819 7.50 4.13 0.0991 0.833 1.148
7.50 3.84 0.0995 1.153 1.2X8
7.50 3.54 0.1006 1.367 1.237 7.50 3.34 0.1020 1.167 1.110 7.50 3.18 0.1036 1.000 0.991 7.50 2.91 0.1085 0.600 0.794
6.91 3.49 0.250 0.980 1.129 6.90 3.49 0.250 0.982 1.128 6.91 3.48 0.250 0.983 1.129 6.89 3.48 0.250 0.964 1.127 6.98 3.98 0.250 0.946 0.975 6.98 3.98 0.250 0.871 0.975
6.97 3.96 0.250 0.981 0.984 6.97 3.96 0.250 0.929 0.984 6.99 4.54 0.250 0.708 0.660
6.99 4.14 0.250 0.899 0.879 6.99 3.89 0.250 1.014 1.027 6.99 3.72 0.250 1.044 1.106 6.99 3.59 0.250 1.060 1.136 6.99 3.21 0.250 0.842 1.054 6.99 2.86 0.250 0.572 0.851 6.99 2.53 0.250 0.380 0.704
298.15 8.31 6.12 0.072 0.343 0.361 298.15 8.54 6.71 0.081 0.346 0.366 286.05 8.68 6.59 0.072 0.355 0.364 286.05 8.85 6.59 0.080 0.356 0.369 292.15 8.46 6.66 0.071 0.352 0.362 292.15 8.67 6.65 0.080 0.349 0.368 304.15 8.16 6.78 0.072 0.357 0.359 304.15 x.34 6.7X 0.080 0.351 0.363 310.25 7.98 6.84 0.071 0.351 0.356 310.25 8.13 6.84 0.078 0.348 0.360 298.15 8.34 6.02 0.070 0.381 0.385 298.15 8.54 6.02 0.080 0.378 0.388 298.15 8.28 4.70 0.061 0.861 0.883 298.15 8.51 4.69 0.068 0.854 0.870 298.15 8.40 2.24 0.093 0.260 0.601 298.15 8.56 2.27 0.096 0.258 0.597 298.15 8.33 3.12 0.056 0.634 0.816 298.15 8.53 3.16 0.062 0.603 0.866 298.15 8.30 5.49 0.069 0.475 0.457 298.15 8.50 5.48 0.076 0.484 0.458 298.15 8.32 4.07 0.057 1.302 1.418 298.15 8.50 4.13 0.063 1.268 1.368 298.15 8.40 7.12 0.071 0.349 0.356 298.15 8.54 7.12 0.079 0.361 0.362 298.15 8.49 6.92 0.125 0.408 0.391 298.15 8.67 6.93 0.132 0.412 0.394 298.15 8.57 6.67 0.228 0.450 0.435
Blair [3] (continued)
Lawson and Veech [12]
Tewari et al. (this study)
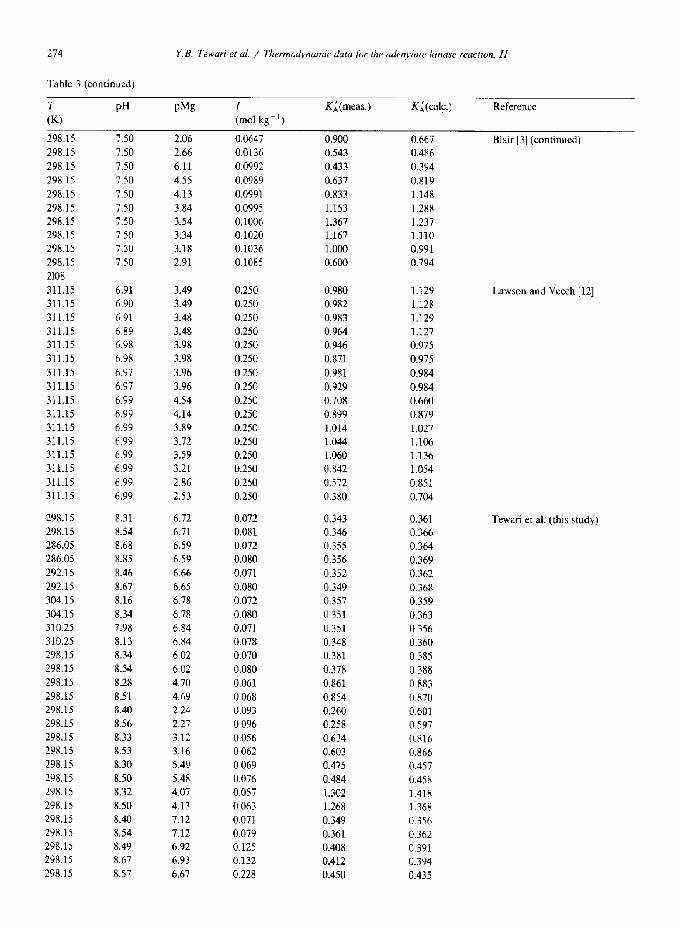
Y.B. Tewari et al. / Thermodynamic data for the adenylate kinase reaction, II 275
Table 3 (continued)
(TK) PH PM~ I K;(meas.) K;(calc.) Reference
(mol kg-‘)
298.15 8.73 6.70 0.233 0.444 0.437 298.15 8.68 6.46 0.328 0.462 0.467 298.15 8.87 6.46 0.326 0.458 0.466 298.15 1.79 7.13 0.052 0.366 0.346 298.15 1.93 7.15 0.061 0.364 0.351 298.15 6.04 6.34 0.026 0.366 0.302 298.15 6.67 6.84 0.037 0.377 0.339 298.15 6.77 6.97 0.034 0.364 0.339 298.15 6.88 7.05 0.038 0.365 0.344 298.15 7.41 7.22 0.044 0.365 0.345 298.15 1.45 7.24 0.048 0.366 0.347 311.15 6.83 3.51 0.249 0.934 1.117 311.15 7.04 3.54 0.245 0.928 1.148
Tewari et al. (this study, continued)
-.
f-
9
a d
2
-2.Y %
x- 0
Z-
2 0
2 1 I 1 I I
2.0 2.5 3.0 3.5 4.0 45 5.0 5.5
P%
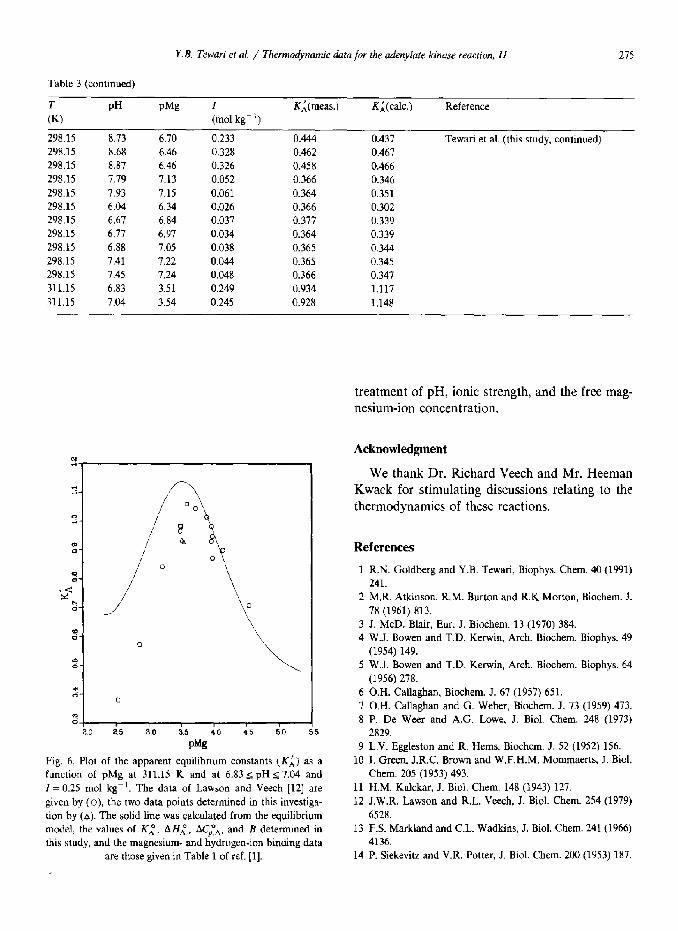
Fig. 6. Plot of the apparent equilibrium constants (KL) as a function of pMg at 311.15 K and at 6.83~ pH I 7.04 and I = 0.25 mol kg-‘. The data of Lawson and Veech [12] are given by (o), the two data points determined in this investiga- tion by (a), The solid line was calculated from the equilibrium model, the values of KL, A HL, ACpTA, and B determined in
this study, and the magnesium- and hydrogen-ion binding data
5 W.J. Bowen and T.D. &win, Arch. B&hem. Biophys. 64 (1956) 278.
6 O.H. Callaghan, B&hem. J. 67 (1957) 651. 7 O.H. Callagban and G. Weber, Biochem. J. 73 (1959) 473. 8 P. De Weer and A.G. Lowe, J. Biol. Chem. 248 (1973)
2829. 9 L.V. Eggleston and R. Hems, B&hem. J. 52 (1952) 156.
10 1. Green, J.R.C. Brown and W.F.H.M. Mommaerts, J. Biol. Chem. 205 (1953) 493.
11 H.M. Kalckar, J. Biol. Chem. 148 (1943) 127. 12 J.W.R. Lawson and R.L. Veech, J. Biol. Chem. 254 (1979)
6528. 13 F.S. Markland and CL. Wadkins, J. Biol. Chem. 241 (1966)
4136. are those given in Table 1 of ref. [l]. 14 P. Siekevitz and V.R. Potter, J. Biol. Chem. 200 (1953) 187.
treatment of pH, ionic strength, and the free mag- nesium-ion concentration.
Acknowledgment
We thank Dr. Richard Veech and Mr. Heeman Kwack for stimulating discussions relating to the thermodynamics of these reactions.
References
1 R.N. Goldberg and Y.B. Tewari, Biophys. Chem. 40 (1991) 241.
2 M.R. Atkinson, R.M. Burton and R.K Morton, Biochem. J. 78 (1961) 813.
3 J. McD. Blair, Eur. J. B&hem. 13 (1970) 384. 4 W.J. Bowen and T.D. Kerwin, Arch. B&hem. Biophys. 49
(1954) 149.
276 Y.B. Tewari et al. / Thermodynamic data for the adenylate kinase reaction, II
15 Su and P.J. Russel, Jr., J. Biol. Chem. 243 (196X) 3826.
16 D.K. Steckler, R.N. Goldberg, Y.B. Tewari and T.J. Buck-
ley, J. Res. Natl. Bur. Stand. 91 (1986) 113.
17 D.K. Steckler, R.N. Goldberg, Y.B. Tewari and T.J. Buck-
Icy, Computer software for the acquisition and treatment of
calorimetric data (National Bureau oi Standards Technical
Note 1224, U.S. Government Printing Office, Washington,
DC, 1986).
18 R.G. Bates and H.B. Hetzer, J. Phys. Chem. 65 (1961) 667.
19 G. Gjelund and I. Wad@ Acta Chem. Stand. 22 (1968) 2691.
20 E.J. Prosen and M.V. Kilday, J. Res. Natl. Bur. Stand. 77A
(1973) 581.
21 CODATA Key values for thermodynamics, eds. J.D. Cox,
D.D. Wagman and V.A. Medvedev (Hemisphere, New
York, NY, 1989).
22 J.W. Larson, K.G. Zeeb and L.G. HepIer, Can. J. Chem. 60
(1982) 2141.
23 H.B. Clarke, D.C. Cusworth and S.P. Datta, B&hem. J. 56
(1954) 14.
24. H.B. Clarke, DC. Cusworth and S.P. Datta, Biochem. J. 58
(1954) 146
25 R. Veech, personal communication, 1990.
26 R.A. Alberty, J. Biol. Chem. 244 (1969) 3290.
27 E. Gajewski, D.K. Steckler and RN. Goldberg, J. Biol.
Chem. 261 (1986) 12733.
28 H.J. Hinz, P. PoIlwein, R. Schmidt and F. Zimmermann,
Archiv. Biochem. Biophys. 212 (1981) 72.
29 I.A. Rose, Proc. Natl. Acad. Sci. (U.S.A.) 61 (1968) 1079.
30 R.L. Veech, J.W. Lawson, N.W. Cornell and H.A. Krebs, J.
Biol. Chem. 254 (1979) 6538.
31 M. Walser, Ergeb. Physiol. Biol. Chem. Exptl. Pharmakol.
59 (1967) 185.
32 D. Veloso, R.W. Guynn, M. Oskarsson and R.L. Veech, J.
Biol. Chem. 248 (1973) 4811.
33 S.M. Cohen, J. BioI. Chem. 258 (1983) 14294.
Note added in proof
Following completion of this research two ad-
ditional publications dealing with the thermody-
namics of the disproportionation reaction of ADP to AMP and ATP were brought to our attention.
They are:
R.S. Langer, CR. Gardner, B.K. Hamilton and
C.K. Colton, AIChE J. 23 (1977) 1; the equi- librium data shown graphically in this paper are
given in tabular form in the following thesis: R.S.
Langer, Enzymatic Regulation of ATP, Mas-
sachusetts Institute of Technology, Cambridge, MA (1974).
A. Horn, R. Husung, M. Schroeder and H. Boern- ing, Acta Biol. Med. Ger. 27 (1971) X21.