Embed Size (px)
Citation preview

These materials have been prepared by the CASBO Financial Services Professional Council, Sacramento Section. They have not been reviewed by State CASBO for approval, so therefore are not an official statement of CASBO.
APRIL 3-6, 2013, LONG BEACH, CA
FIN21CASH FLOW PROJECTIONS

2
2013 CASBO ANNUAL CONFERENCE & SCHOOL BUSINESS EXPO
CASH FLOW PROJECTIONS
Session ID FIN21
Financial Services Professional Council
Sacramento Section
Friday April 5, 2013
11:00 a.m. – 12:00 p.m.
Presented by
Diane Lacombe
El Dorado County Office of Education
3
2013 CASBO ANNUAL CONFERENCE & SCHOOL BUSINESS EXPO
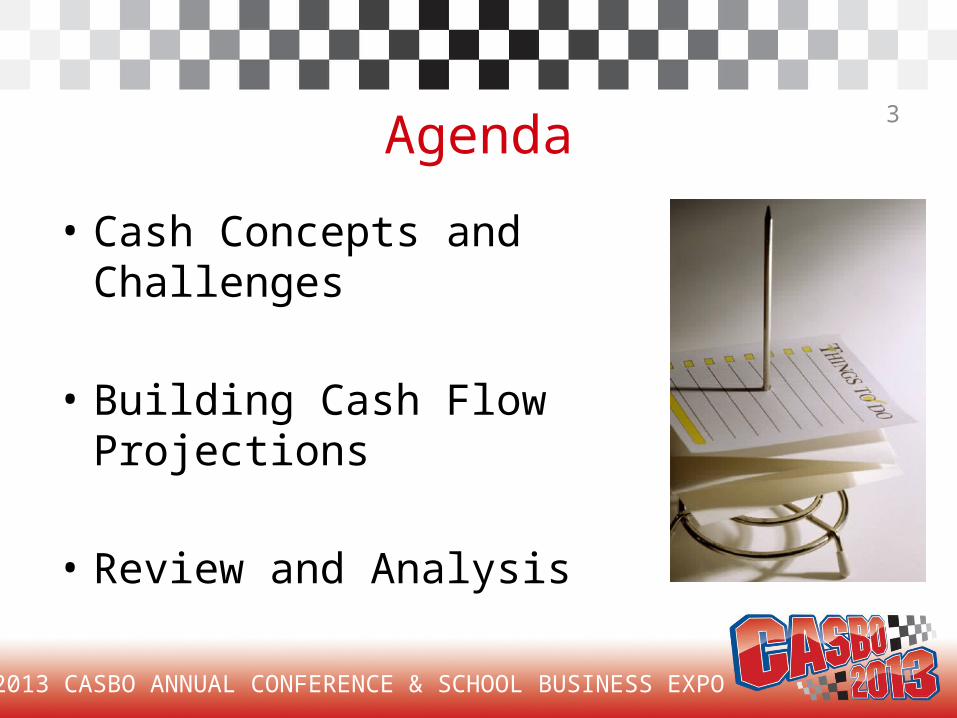
Agenda
• Cash Concepts and Challenges
• Building Cash Flow Projections
• Review and Analysis

4
CASH CONCEPTS & CHALLENGES

5
2013 CASBO ANNUAL CONFERENCE & SCHOOL BUSINESS EXPO
Cash Management is Vital• One of the 15 conditions that most
frequently indicates fiscal distress is poor cash flow analysis and reconciliation
• All districts that have been taken over by the state ran out of cash
• Cost of running low on cash is high

6
2013 CASBO ANNUAL CONFERENCE & SCHOOL BUSINESS EXPO
Cash ≠ Fund Balance• Example:
• Cash is 10% of
• Fund Balance
714,636.96
7,716,085.10
Example:
Cash is 10% of
Fund Balance
7
2013 CASBO ANNUAL CONFERENCE & SCHOOL BUSINESS EXPO
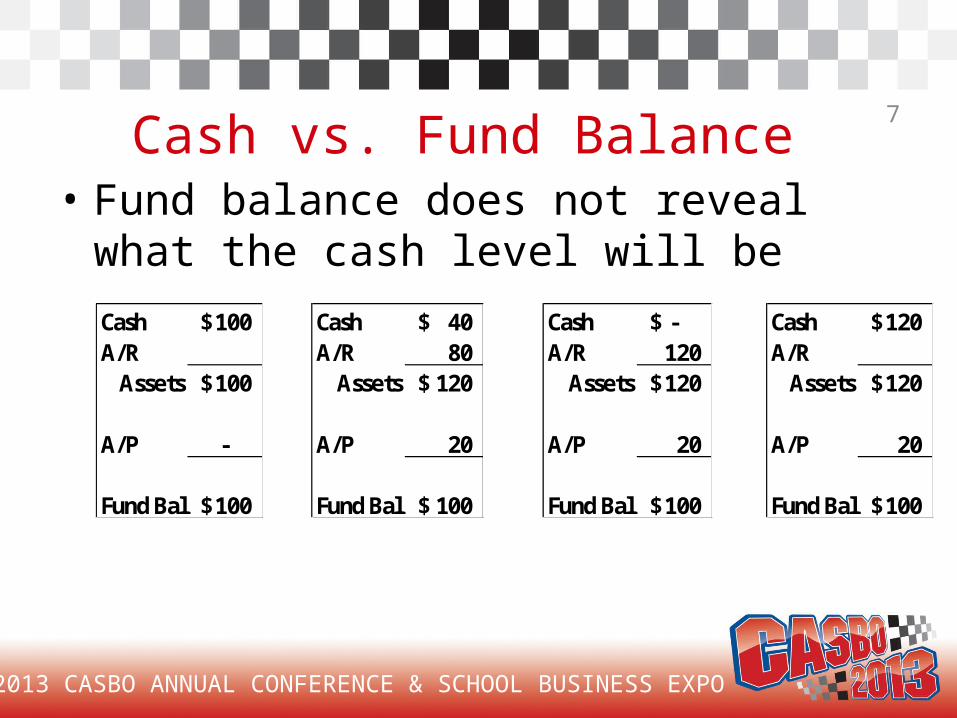
Cash vs. Fund Balance • Fund balance does not reveal what the
cash level will be Cash 100$ A/R
Assets 100$
A/P -
Fund Bal 100$
Cash -$ A/R 120
Assets 120$
A/P 20
Fund Bal 100$
Cash 120$ A/R
Assets 120$
A/P 20
Fund Bal 100$
Cash 40$ A/R 80
Assets 120$
A/P 20
Fund Bal 100$

8
2013 CASBO ANNUAL CONFERENCE & SCHOOL BUSINESS EXPO
Cash vs. Fund Balance• High fund balance
does not necessarily mean high cash levels
• It is possible to have greater than minimum reserve levels, yet be out of cash
A/R DetailsRL State Aid 1,100,000 Federal (Spec Ed, Title I, etc) 100,000 State (CSR, Lottery, etc) 300,000 Local (Spec Ed fm SELPA) 100,000
1,600,000
BudgetRevenue 8,900,000 Expenditures 9,100,000 Excess (Deficiency) (200,000)
Beginning Balance 1,300,000 Ending Balance 1,100,000 12%
Components of Fund BalanceCash (300,000) A/R 1,600,000
Assets 1,300,000 A/P 200,000 Ending Balance 1,100,000
9
2013 CASBO ANNUAL CONFERENCE & SCHOOL BUSINESS EXPO
Importance of Cash Flow Projections has grown
• Funding reductions – 22% revenue limit (RL) deficit– Funded RL per ADA $1,500 less in 12-13 than
in 07-08 for average unified school district
• Deficit spending - less reserves, less cash• State has increased deferrals
– One deferral for a few days June to July in 02-03– Now, multiple deferrals over several months

10
2013 CASBO ANNUAL CONFERENCE & SCHOOL BUSINESS EXPO
Delayed Apportionment Funding
2013-142012-13Feb to Jul
$700MJul to Sep
$500MJul to Dec
Aug to Dec$600M
$800MOct to Dec
Mar to Apr
$900M
End of Fiscal Year
Apr to Jul $419M
$679M now $176M
Apr to Aug / July
May to Jul$800M
May to Aug / July$1.0B now $1.18B
100%
Jun to Jul
Mar to Aug
$764M
Within year
deferrals
Cross-year deferrals
Since Proposition 30 tax initiative passed, cross
year deferrals are reduced by $2.1 billion
$2.0B now $532M
$1.3B now $1.029B
Apr to Aug

11
2013 CASBO ANNUAL CONFERENCE & SCHOOL BUSINESS EXPO
Revenue Limit – Deferrals• Districts that receive a higher percentage
of RL as state aid are hit hardestRevenue Limit Example District A District B District C
Revenue Limit $10,000,000 $10,000,000 $10,000,000
Property Taxes $ 9,000,000 $ 5,000,000 $ 1,000,000
Education Protection Account $ 1,000,000 $ 2,000,000 $ 2,000,000
State Aid $ 3,000,000 $ 7,000,000
Cross Year Deferrals @30% $ -0- $ 900,000 $ 2,100,000
12
2013 CASBO ANNUAL CONFERENCE & SCHOOL BUSINESS EXPO
Cash Flows• Need to be accurate• List assumptions• If borrowing will be needed
– When & how much to borrow
• Analyze, monitor, update monthly – After cash is reconciled, update cash flow for the new
month’s actuals and re-project the rest of the year– Based on the latest version of the budget
• All funds• At least current year and subsequent year

13
BUILDING CASH FLOW PROJECTIONS

14
2013 CASBO ANNUAL CONFERENCE & SCHOOL BUSINESS EXPO
Cash Flow Format1 2 11 12 13
Object July August . . . May June Accruals Adjustments TOTAL Budget
A. BEGINNING CASH 9110 0 0 0 0
B. RECEIPTS
Revenue Limit Sources
Principal Apportionment 8010-8019 0 0 0 0 0 0 0 0
Property Taxes 8020-8079 0 0 0 0 0 0 0 0
TOTAL RECEIPTS 0 0 0 0 0 0 0 0
C. DISBURSEMENTS
Certificated Salaries 1000-1999 0 0 0 0 0 0 0 0
Classified Salaries 2000-2999 0 0 0 0 0 0 0 0
TOTAL DISBURSEMENTS 0 0 0 0 0 0 0 0
D. BALANCE SHEET TRANSACTIONS
ASSETS
Cash Not in Treasury 9111-9199 0 0 0 0 0 0 0
Accounts Receivable 9200-9299 0 0 0 0 0 0 0
Subtotal Assets 0 0 0 0 0 0 0
LIABILITIES 0
Suspense Clearing 9910 0 0 0 0 0 0 0
TOTAL BALANCE SHEET TRANSACTIONS 0 0 0 0 0 0 0
E.0 0 0 0 0 0 0
F.ENDING CASH (A + E) 0 0 0 0
G. -
Beginning Balances
(Ref. Only)
ACTUALS THROUGH THE MONTH OF (Enter Month Name):
NET INCREASE/DECREASE (B - C + D)
ENDING CASH, PLUS CASH ACCRUALS AND ADJUSTMENTS
15
2013 CASBO ANNUAL CONFERENCE & SCHOOL BUSINESS EXPO
Revised SACS Form CASH• Revised format began in SACS2012 budget software• Section Changes
– Receipts • Revenue Limit Principal Apportionment and Property Taxes in
object code order
– Disbursements• 4000’s and 5000’s in two lines
– Balance Sheet Transactions• Renamed from “Prior Year Transactions”• Subsections for Assets, Liabilities, Non-operating with more
rows of detailed balance sheet accounts

16
2013 CASBO ANNUAL CONFERENCE & SCHOOL BUSINESS EXPO
New SACS Form CASH• New columns
– Beginning Balances (Balance Sheet Transactions)• Allows entry of beginning balances as reference• Example – enter beginning Accounts Receivable balance, can
compare to total ARs projected to be received during months of cash flow projections
– Adjustments• Noncash differences (not accruals) between cash transactions and amounts
budgeted• Example -carryover that is budgeted but will not be spent this year
– Budget• Facilitates comparison of cash flow totals to budget
• Subsequent year cash flow tab available

17
2013 CASBO ANNUAL CONFERENCE & SCHOOL BUSINESS EXPO
Building a Cash Flow Projection• Projected budget/interim
– Best if it is done before starting
cash flow projection
• Columns– Completed months = actual amounts– Upcoming months = projected amounts– Accruals for cash in/out that will occur after June 30– Adjustments column – noncash adjustments
• Example: carryover that is budgeted but will not be spent this year
• Estimating cash inflows and outflows– Dividing the budgeted amount by 12 months
is not a good strategy

18
2013 CASBO ANNUAL CONFERENCE & SCHOOL BUSINESS EXPO
Templates
• Can use a template to help prepare cash flow– Create your own, modify an existing one– FCMAT Budget Explorer Cash Flow tool– EDCOE Cash Flow Template
• http://edcoe.org/departments/business_services/CFO_Corner.html
• EDCOE template tips– Start on “Welcome” and “Instructions” tab– Go slowly, step-by-step

19
2013 CASBO ANNUAL CONFERENCE & SCHOOL BUSINESS EXPO
Templates• Template ideas
– Format to make it easier• Match your financial system reports• Final result that matches SACS format
– Make template do the math• Input budget and actuals to date, template calculates
balance• Calculate % expected each month, monthly % x balance
– Have detailed schedule that feeds into summary schedule
• Break out elements in more detail – revenues, balance sheet, etc.

20
2013 CASBO ANNUAL CONFERENCE & SCHOOL BUSINESS EXPO
Revenue Limit – State AidSome ways to project month by month:
1. Spread remaining budget over upcoming months using estimated apportionment schedule percentages
2. Use Payment Schedule Summary Excel spreadsheet provided by CDE
In Principal Apportionment http://www.cde.ca.gov/fg/aa/pa/ See applicable fiscal year / certification period Look in Funding Excel Files

21
2013 CASBO ANNUAL CONFERENCE & SCHOOL BUSINESS EXPO
Estimated Principal Apportionment Schedule
MonthEducation Code Section (E.C.)14041(a)(2)
Education Code Section (E.C.)14041(a)(7)
Education Code Section (E.C.)14041(a)(8)
Jul 2012 - - -Aug 2012 2.02% 6.06% 12.12%Sep 2012 12.73% 26.19% 41.19%Oct 2012 4.86% 8.11% 8.11%Nov 2012 9.00% - -Dec 2012 17.39% 19.64% 28.58%Jan 2013 9.00% 6.00% 6.00%Feb 2013 5.62% 4.24% -Mar 2013 2.45% 1.85% -Apr 2013 0.36% 0.27% -
May 2013 0.00% 0.00% -Jun 2013 0.00% 0.00% 0.00%Jul 2013 25.16% 19.01% 4.00%
Aug 2013 11.41% 8.62% -Total 100.00% 100.00% 100.00%
*Source – 12/21/12 SSC article

22
2013 CASBO ANNUAL CONFERENCE & SCHOOL BUSINESS EXPO
CDE Principal Apportionment Summary• Summary of certification by LEA
County Code
District Code
School District Total Revenue
Limit(0000-8011)
Charter School General Purpose
Entitlement(0000-8015)
Charter School Categorical Block
Grant(0000-8590)
Core Academic Program
(Supplemental Instruction,
Grades K-12)(0000-8590)
Gifted and Talented Education Program
(0000-8590)
Total County Office Funds
Transfer(0000-8011)
Total Principal Apportionment
A-2 A-3 A-4 A-5 A-15 A-22 B-1
56 72553 $ 9,030,040.00 $ - $ - $ 72,084.00 $ 42,444.00 $ (179,040.00) $ 8,990,306.00 56 72553 $ - $ 425,319.00 $ 136,409.00 $ - $ - $ - $ 561,952.00 56 72553 $ - $ 694,671.00 $ 261,688.00 $ 4,203.00 $ - $ - $ 963,416.00 56 72561 $ 10,981,217.00 $ - $ - $ 42,166.00 $ 27,173.00 $ (152,561.00) $ 10,965,287.00 56 72579 $ 140,134.00 $ - $ - $ - $ - $ - $ 140,134.00 56 72587 $ 11,791,179.00 $ - $ - $ 31,565.00 $ 23,995.00 $ (30,780.00) $ 11,860,249.00 56 72611 $ 291,995.00 $ - $ - $ 964.00 $ 5,269.00 $ - $ 306,934.00 56 72611 $ - $ 259,059.00 $ 72,109.00 $ 414.00 $ - $ - $ 334,418.00 56 72546 $ 34,877,592.00 $ - $ - $ 168,964.00 $ 102,837.00 $ (105,722.00) $ 39,067,157.00 56 72546 $ - $ 893,596.00 $ 230,718.00 $ - $ - $ - $ 1,124,314.00
OtherRL RL TOTAL

23
2013 CASBO ANNUAL CONFERENCE & SCHOOL BUSINESS EXPO
CDE Payment Schedule• Schedule of Principal Apportionment payments
– Includes RL State Aid + others (Adult, GATE, etc.)
CALIFORNIA DEPARTMENT OF EDUCATIONCertification of the 2012-13 Advance Apportionment
Monthly Payment Schedule by LEA
Regular Monthly Payment
Partial Repayment of July Deferral
Equals Amount in (4)
September Total
Sum of (10) and (11)
October Payment Before Deferral
October Deferred to
January(45.9620623% of
October Payment)
October Payment
(13) minus (14)
(2) (10) (11) (12) (13) (14) (15)8,990,306$ 809,128$ 335,471$ 1,144,599$ 809,128$ 371,892$ 437,236$
561,952$ 50,576$ 20,969$ 71,545$ 50,576$ 23,246$ 27,330$ 963,416$ 86,707$ 35,950$ 122,657$ 86,707$ 39,852$ 46,855$
10,965,287$ 986,876$ 409,167$ 1,396,043$ 986,876$ 453,589$ 533,287$ 140,134$ 12,612$ 5,229$ 17,841$ 12,612$ 5,797$ 6,815$
11,860,249$ 1,067,422$ 442,562$ 1,509,984$ 1,067,422$ 490,609$ 576,813$ 4,985,297$ 448,677$ 186,025$ 634,702$ 448,677$ 206,221$ 242,456$
46,719,385$ 4,204,745$ 1,743,322$ 5,948,067$ 4,204,745$ 1,932,588$ 2,272,157$ 306,934$ 27,624$ 11,453$ 39,077$ 27,624$ 12,697$ 14,927$ 334,418$ 30,098$ 12,479$ 42,577$ 30,098$ 13,834$ 16,264$
Advance Principal Apportionment
September 2012 October 2012
TOTALOct
payment

24
2013 CASBO ANNUAL CONFERENCE & SCHOOL BUSINESS EXPO
Revenue Limit – Education Protection Account (EPA)
• 2012-13, all EPA will be received in June
• After 2012-13, EPA to be received quarterly

25
2013 CASBO ANNUAL CONFERENCE & SCHOOL BUSINESS EXPO
Revenue Limit – Property Taxes
• Paid based on actual collections– Main tax receipt months are
December and April– Does your county auditor-controller have an estimated
property tax schedule?
• Education Revenue Augmentation Fund (ERAF) apportionments
• Redevelopment Funds• Charter School In-Lieu Transfers

26
2013 CASBO ANNUAL CONFERENCE & SCHOOL BUSINESS EXPO
Charter School In-Lieu Transfers• Education Code 47635 describes transfers
in lieu of property taxes to charter schools from the sponsoring LEA – Annual amount
Property Tax per ADA* x Charter ADA* Total District + Charter ADA
– Schedule of transfers P-2 Annual
Aug Sep Oct Nov Dec Jan Feb Mar Apr May Jun Jul Feb6% 12% 8% 8% 8% 8% 8% 2/6 1/6 1/6 1/6 Balance PY adj
Based on Prior Year P-2 Based on P-1 Balance owed
27
2013 CASBO ANNUAL CONFERENCE & SCHOOL BUSINESS EXPO
Charter School In-Lieu Transfers• EC schedule does not
correspond to actual property tax collections
• EC schedule was not affected by changes to RL State Aid schedule (5-5-9, deferrals)– Charter and District could
agree upon alternate schedule of transfers

28
2013 CASBO ANNUAL CONFERENCE & SCHOOL BUSINESS EXPO
Federal Revenues• SACS object codes 8100-8299• Title I, Title II, etc• Special Education• When do you expect to receive these
revenues?– May depend on when you spend them and
when you report that you’ve spent them– Quarterly federal cash management reporting
29
2013 CASBO ANNUAL CONFERENCE & SCHOOL BUSINESS EXPO
State Revenues• Some programs paid in Principal Apportionment • Tier 3 programs - 5-5-9 schedule• Economic Impact Aid - 20% x 5• Lottery - quarterly• Class Size Reduction
– Partly deferred across fiscal years
• CDE provides an estimated cash flow schedule for select categorical programs– CDE Finance & Grants Allocations & Apportionments
Categorical Programs Estimated Cash Flow Schedule – http://www.cde.ca.gov/fg/aa/ca/estcashflow.asp– Can use to calculate percent by month
30
2013 CASBO ANNUAL CONFERENCE & SCHOOL BUSINESS EXPO
Local Revenues
• SELPA apportionment transfers• Interagency revenues• Transportation Fees• Other local revenue• Consortium revenue• When do you expect to receive
these revenues?

31
2013 CASBO ANNUAL CONFERENCE & SCHOOL BUSINESS EXPO
Salaries• Historical percentage outflow by month is a reliable indicator
– Will include periodic payments e.g. longevity, stipends– Takes into account salary roll backs or other % changes

32
2013 CASBO ANNUAL CONFERENCE & SCHOOL BUSINESS EXPO
Salaries
• Certificated and classified monthly patterns differ• Recent changes may not be reflected in prior year
trends and should be addressed– Furlough days when not converted to a salary decrease– 10 paychecks to 12 paychecks– Program redesign, e.g. summer school– School year changes, e.g. instructional days, staff
development days– One time restoration payments

33
2013 CASBO ANNUAL CONFERENCE & SCHOOL BUSINESS EXPO
Benefits• Mostly driven by payroll• Prior year trends or consistent with
salaries• Some independent of payroll
– Retiree benefits– Golden handshake payments
34
2013 CASBO ANNUAL CONFERENCE & SCHOOL BUSINESS EXPO
Supplies & Services• Prior year trends are more erratic but still
better than dividing by 12– Less working days in December to issue warrants– June crush to pay invoices instead of accruing– School year start-up ordering in early summer with payments
coming due in August or September
• Best to analyze big outflows separately– Utilities & phones…seasonal fluctuations, two payments in a
month
– Pass-thru/subagreement outflows link to inflow

35
2013 CASBO ANNUAL CONFERENCE & SCHOOL BUSINESS EXPO
Capital Outlay• Capital expenditures in the general fund
– Few
– Infrequent
– One-time
– Some leases…recurring and predictable

36
2013 CASBO ANNUAL CONFERENCE & SCHOOL BUSINESS EXPO
Other Outflows• Interfund transfers out
– Should be in the budget
– Some funds regularly receive annual transfers from the general fund, e.g. food services
• Debt payments– Be sure to include these …make a big difference in cash
balance
37
2013 CASBO ANNUAL CONFERENCE & SCHOOL BUSINESS EXPO
Balance Sheet Accounts• Assets
– Accounts Receivable• When will you receive them?• If cleared to revenue before receipt,
consider tracking separately in revenue section of cash flow projection
– Due from Other Funds• When will the other fund pay this fund?
– Prepaid expenditures• When you clear, hits the expenditure and
the balance sheet account (object 9330) – net $0 cash

38
2013 CASBO ANNUAL CONFERENCE & SCHOOL BUSINESS EXPO
Balance Sheet Accounts• Liabilities
– Accounts Payable from prior year• When will you pay them?
– Use Tax Liability• Accumulates during the year, paid quarterly or yearly
– Workers Compensation Liability• Accumulates when payroll is processed• Paid periodically, such as twice a year
– Health & Welfare Liability• Accumulates when payroll is processed
– May be higher in some months than others due to 10, 11, 12 month employees, etc
• Paid to vendor monthly• Plans may not align with July to June fiscal year

39
2013 CASBO ANNUAL CONFERENCE & SCHOOL BUSINESS EXPO
Balance Sheet Accounts• Liabilities (cont.)
– Dues Liability– Voluntary Deductions– Summer Set Aside
• 10 or 11 month employees paid in 12 months• Set aside amounts during the year from payroll• Paid out at the end in the summer
– Due to Other Funds• When will this fund pay to the other fund?
– Current Loans (TRANs)• When will you receive TRAN proceeds?• When will you have TRAN repayments?
– Deferred Revenue • When you clear, hits revenue and deferred revenue
(object 9650) – net $0 cash

40
2013 CASBO ANNUAL CONFERENCE & SCHOOL BUSINESS EXPO
Balance Sheet Accounts – Example
• The cash flow report from your financial system shows the following for Liability accounts 9500-9630
• Does this makes sense?
July August September October November Accounts Payable............9500-9630 179,777 217,962 46,955 326,656 (246,041)
41
2013 CASBO ANNUAL CONFERENCE & SCHOOL BUSINESS EXPO
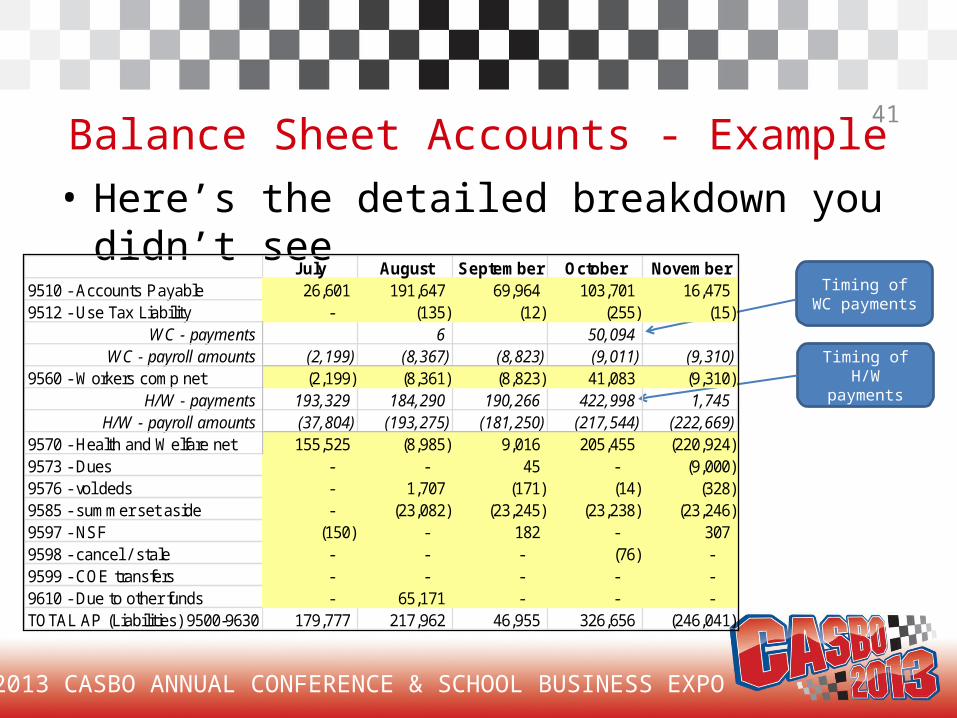
Balance Sheet Accounts - Example• Here’s the detailed breakdown you didn’t see
July August September October November9510 - Accounts Payable 26,601 191,647 69,964 103,701 16,475 9512 - Use Tax Liability - (135) (12) (255) (15)
WC - payments 6 50,094 WC - payroll amounts (2,199) (8,367) (8,823) (9,011) (9,310)
9560 - Workers comp net (2,199) (8,361) (8,823) 41,083 (9,310) H/W - payments 193,329 184,290 190,266 422,998 1,745
H/W - payroll amounts (37,804) (193,275) (181,250) (217,544) (222,669) 9570 - Health and Welfare net 155,525 (8,985) 9,016 205,455 (220,924) 9573 - Dues - - 45 - (9,000) 9576 - vol deds - 1,707 (171) (14) (328) 9585 - summer set aside - (23,082) (23,245) (23,238) (23,246) 9597 - NSF (150) - 182 - 307 9598 - cancel / stale - - - (76) - 9599 - COE transfers - - - - - 9610 - Due to other funds - 65,171 - - - TOTAL AP (Liabilities) 9500-9630 179,777 217,962 46,955 326,656 (246,041)
Timing of H/W payments
Timing of WC payments
42
2013 CASBO ANNUAL CONFERENCE & SCHOOL BUSINESS EXPO
Multiyear Cash Flow• Use current year cash flow and multiyear
projection to build a multiyear cash flow projection– Projected ending cash for current year is
beginning cash for subsequent year– Similar trends but adjust for changes
• For example, EPA arrives in June in 2012-13 but quarterly in 2013-14

43
REVIEW AND ANALYSIS

44
2013 CASBO ANNUAL CONFERENCE & SCHOOL BUSINESS EXPO
Review the Cash Flow Projection
• Totals column sums the cash in/out, accruals and adjustments for each type of category (revenues, expenditures, etc)– Do amounts match totals in budget?
• Revenues• Expenditures• Net Increase/Decrease

45
2013 CASBO ANNUAL CONFERENCE & SCHOOL BUSINESS EXPO
Is the Cash Flow Projection Reasonable?
• Comparison to Fund Balance– Is the total ending cash plus accruals and
adjustments shown in the cash flow projection reasonably close to the ending fund balance shown in the budget?
Example• In the spring, district prepared cash flow
projection to look at potential cash borrowing needs for the following fiscal year

46
2013 CASBO ANNUAL CONFERENCE & SCHOOL BUSINESS EXPO
Comparison to Fund Balance• District’s initial cash flow
– Negative balances in Oct, Nov, Feb, Mar, May, Jun
– June ending cash $(113,335)– Accruals $ 366,699– Total $ 253,363
• Looked like district would need some in-year and cross year borrowing
• Looked like once all accruals received, the district would have $253,363 fund balance
47
2013 CASBO ANNUAL CONFERENCE & SCHOOL BUSINESS EXPO
Comparison to Fund Balance• However…
– Budget ending fund balance $521,792– Cash flow total $253,363
• Why the difference?
• After research, found– July 1 beginning balance was entered incorrectly– Estimated payables of $45,000 were not listed
48
2013 CASBO ANNUAL CONFERENCE & SCHOOL BUSINESS EXPO
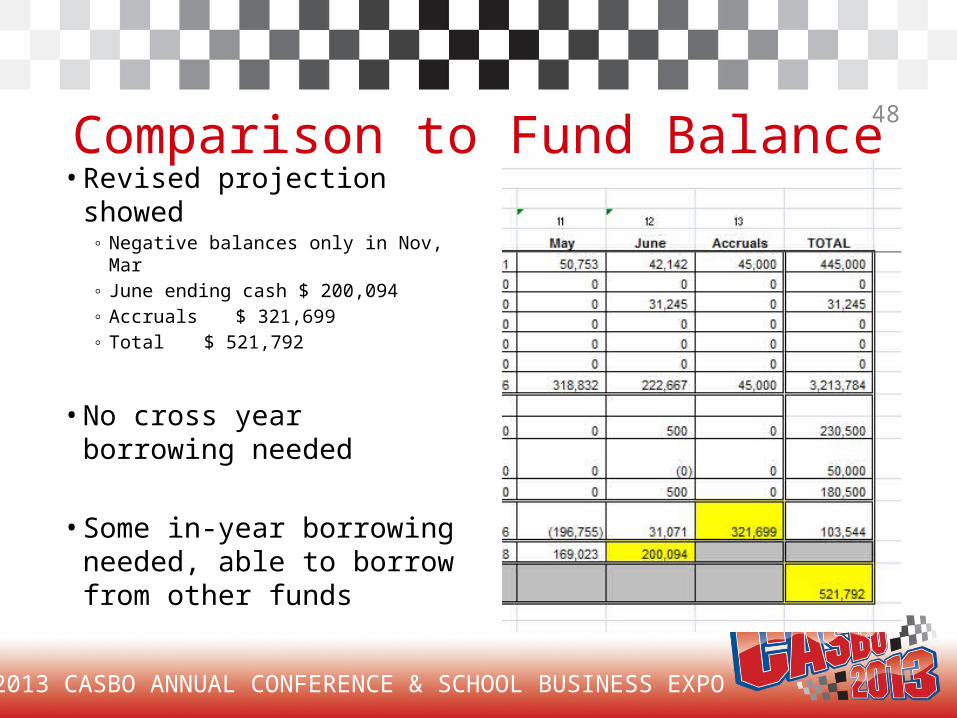
Comparison to Fund Balance• Revised projection
showed◦ Negative balances only in Nov, Mar◦ June ending cash $ 200,094◦ Accruals $ 321,699◦ Total $ 521,792
• No cross year borrowing needed
• Some in-year borrowing needed, able to borrow from other funds

49
2013 CASBO ANNUAL CONFERENCE & SCHOOL BUSINESS EXPO
Negative Balances?• Look to see if there are projected negative cash
balances• If so, what borrowing options
are being considered?– Inter-fund borrowing
• Need to know cash availability• May need separate cash flow
projections for other funds
– Borrowing from COE / County– TRANs
50
2013 CASBO ANNUAL CONFERENCE & SCHOOL BUSINESS EXPO
Borrowing Options• Internal borrowing
– From other funds of the LEA – EC 42603– Up to 75% of the cash in the lending fund– Borrowing fund must earn enough to repay– Paid back generally within a year
• External borrowing– From COE - EC 42621, 42622 and 47603 (thru 7/1/17)
• Up to 85% of anticipated revenues• If COE is willing and able
– From County Treasurer – EC 42620, CA Const. Art. XVI, § 6
• No loans after last Monday in April• Up to 85% of anticipated revenues
– Tax and Revenue Anticipation Notes (TRANs) – GC 53852
51
2013 CASBO ANNUAL CONFERENCE & SCHOOL BUSINESS EXPO
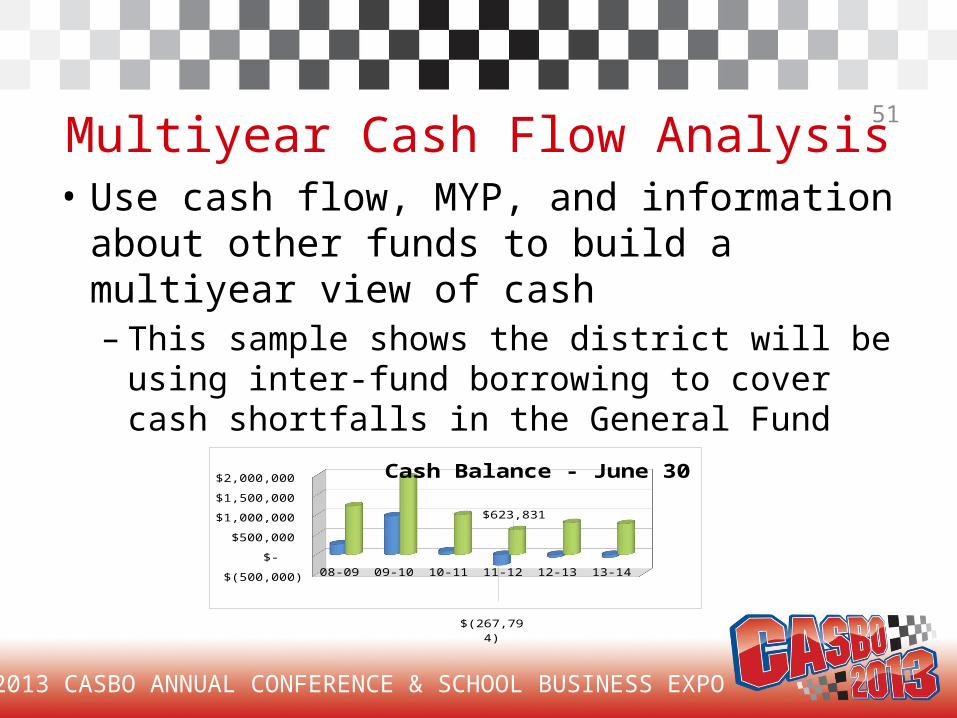
Multiyear Cash Flow Analysis• Use cash flow, MYP, and information about
other funds to build a multiyear view of cash– This sample shows the district will be using
inter-fund borrowing to cover cash shortfalls in the General Fund
08-09 09-10 10-11 11-12 12-13 13-14 $(500,000)
$-
$500,000
$1,000,000
$1,500,000
$2,000,000
$(267,794)
$623,831
Cash Balance - June 30
General Fund All Funds

52
2013 CASBO ANNUAL CONFERENCE & SCHOOL BUSINESS EXPO
Questions?
Thank you for providing feedback by completing an evaluation