Embed Size (px)
Citation preview
1
Parasitism and feather reflectance in mourning doves (Zenaida macroura) by
Wesley Youngblood
A thesis submitted to the faculty of the University of Mississippi in partial fulfillment of the requirements of the Sally McDonnell Barksdale Honors College
Oxford May 2014
Approved by
____________________________________ Advisor: Dr. Richard Buchholz
____________________________________
Reader: Dr. Cliff Ochs
____________________________________ Reader: Dr. Douglass Sullivan-‐González

2
© 2014 Wesley Wayne Youngblood ALL RIGHTS RESERVED
3
Ambitiosum sed Incohatum
4
Acknowledgements
I would like to take this opportunity to thank all of those who helped to make this
research possible. First, I must graciously thank Dr. Richard Buchholz for allowing
me to work under his tutelage. Without his ever-‐present guidance and thorough
knowledge of Behavioral Ecology and Sociobiology, this project would not have
been possible. Furthermore, I would like to thank the Sally McDonnell Barksdale
Honors College for its funding and support for this project. I also extend my
gratitude to Dr. Clifford Ochs and Dr. Douglass Sullivan-‐González for agreeing to be
readers for my honors thesis. I furthermore would like to thank the University Of
Mississippi Department Of Biology for approving this project. Also deserving of
recognition are the many hunters who enthusiastically donated their harvested
Mourning Doves as specimens for this research. I also would like to thank Scott
Shuttleworth and Allison Youngblood, for donating many hours of their time in the
field collection of specimens and the recording of specimen data.
5
Abstract
Wesley Youngblood: Parasitism and Feather Reflectance in mourning doves (Zenaida macroura)
(Under the direction of Dr. Richard Buchholz)
The theory of sexual selection has proven to be an important factor in
understanding the mechanisms behind the evolution of secondary sexual traits. The
Hamilton and Zuk (1982) hypothesis of parasite-‐mediated sexual selection
postulates that birds evolved ornamentation to indicate parasite resistance to
potential mates. My research explores the relationship between parasite load and
plumage coloration in hunter-‐harvested mourning doves. Plumage from seven body
areas was collected, ectoparasites were quantified and blood smears made so that
intracellular hematozoan parasites could be quantified. Tarsometatarsi were
measured, and the testes of males were collected to determine any effects of
parasite load on them. Plumage was subject to UV-‐vis photospectroscopy to
determine the tristimulus color values of brightness, chroma, and hue. The results of
this research indicate that blood parasites and ectoparasites affect plumage
brightness, chroma and hue, but the effects are inconsistent across plumage
locations and color values. From this, it can be concluded that hematozoan parasites
and ectoparasites do not fully explain variations found in plumage coloration in
mourning doves. This means that other factors, such as gut parasites, nutritional
condition, and age must be considered as additional potential sources of plumage
variation. My project lays the groundwork for future research into the causes of
plumage color variation in mourning doves.
6
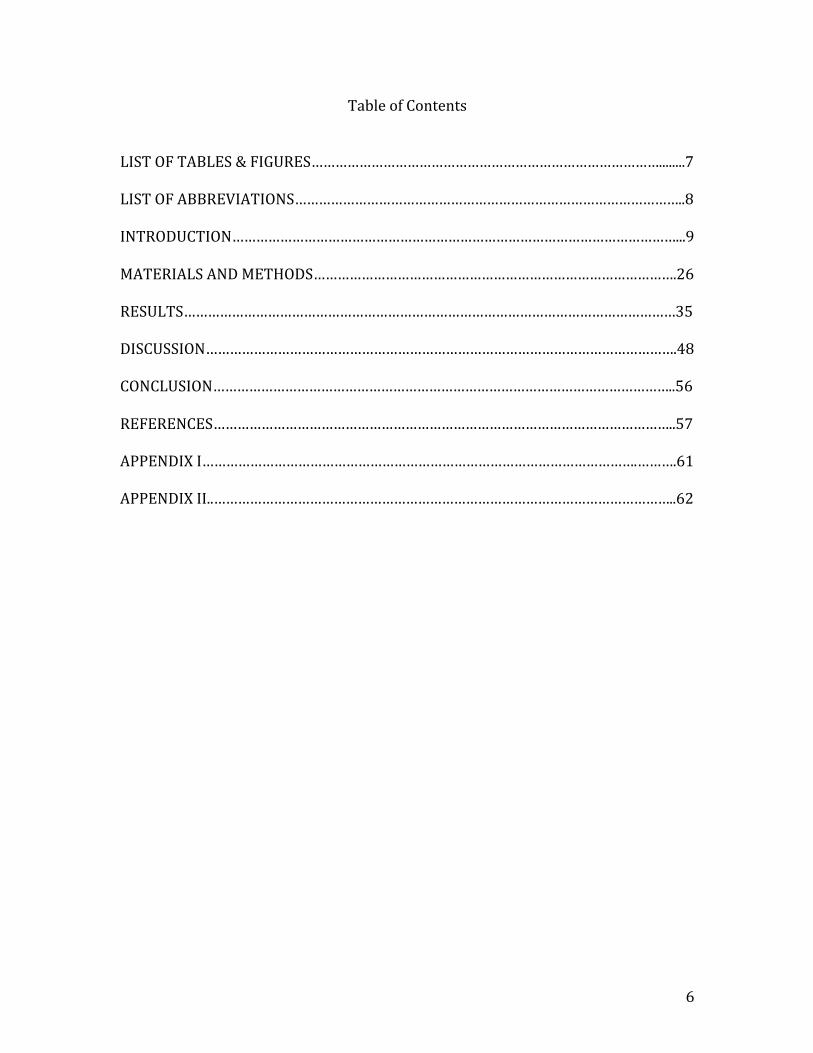
Table of Contents
LIST OF TABLES & FIGURES……………………………………………………………………………........7 LIST OF ABBREVIATIONS……………………………………………………………………………………..8 INTRODUCTION…………………………………………………………………………………………………...9 MATERIALS AND METHODS……………………………………………………………………………….26 RESULTS……………………………………………………………………………………………………………35 DISCUSSION……………………………………………………………………………………………………….48 CONCLUSION……………………………………………………………………………………………………..56 REFERENCES……………………………………………………………………………………………………..57 APPENDIX I……………………………………………………………………………………………….……….61 APPENDIX II..……………………………………………………………………………………………………..62
7
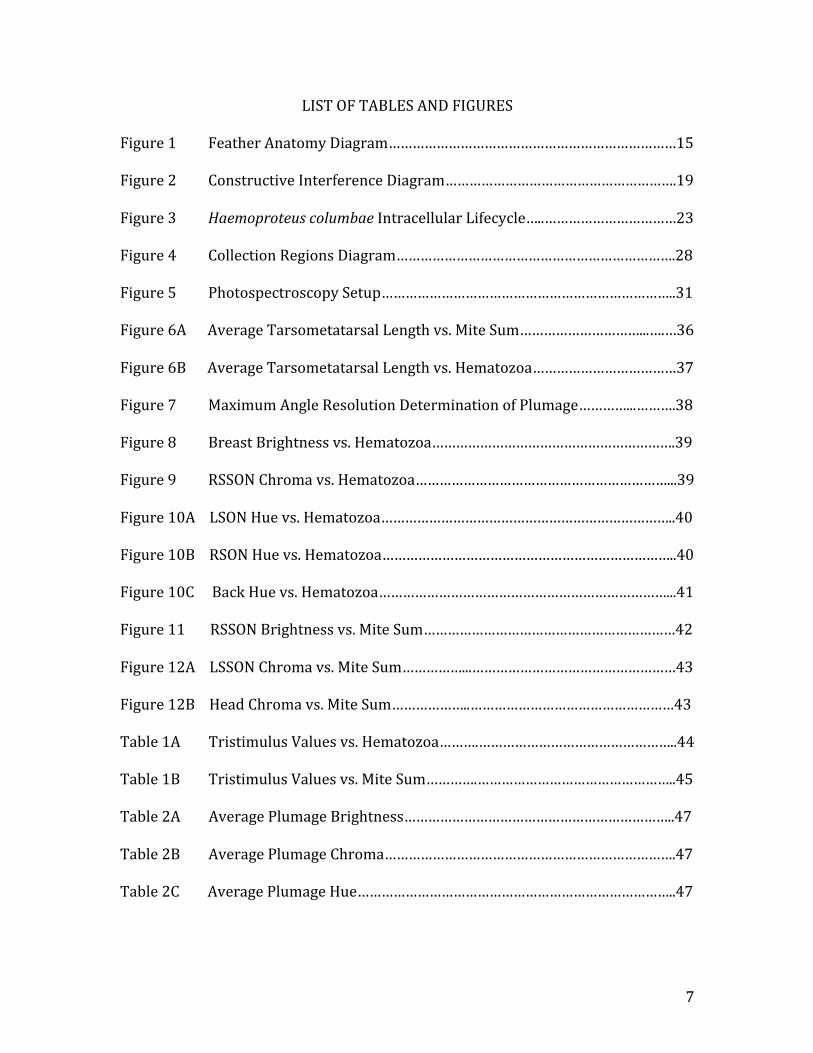
LIST OF TABLES AND FIGURES
Figure 1 Feather Anatomy Diagram………………………………………………………………15 Figure 2 Constructive Interference Diagram………………………………………………….19 Figure 3 Haemoproteus columbae Intracellular Lifecycle…..……………………………23 Figure 4 Collection Regions Diagram…………………………………………………………….28 Figure 5 Photospectroscopy Setup………………………………………………………………..31 Figure 6A Average Tarsometatarsal Length vs. Mite Sum…………………………...….…36 Figure 6B Average Tarsometatarsal Length vs. Hematozoa………………………………37 Figure 7 Maximum Angle Resolution Determination of Plumage…………...……….38 Figure 8 Breast Brightness vs. Hematozoa…………………………………………………….39 Figure 9 RSSON Chroma vs. Hematozoa………………………………………………………...39 Figure 10A LSON Hue vs. Hematozoa………………………………………………………………..40 Figure 10B RSON Hue vs. Hematozoa………………………………………………………………..40 Figure 10C Back Hue vs. Hematozoa………………………………………………………………...41 Figure 11 RSSON Brightness vs. Mite Sum………………………………………………………42 Figure 12A LSSON Chroma vs. Mite Sum……………...……………………………………………43 Figure 12B Head Chroma vs. Mite Sum………………..……………………………………………43 Table 1A Tristimulus Values vs. Hematozoa……….…………………………………………..44 Table 1B Tristimulus Values vs. Mite Sum………….…………………………………………..45 Table 2A Average Plumage Brightness…………………………………………………………..47 Table 2B Average Plumage Chroma……………………………………………………………….47 Table 2C Average Plumage Hue……………………………………………………………………..47
8
LIST OF ABBREVIATIONS
LSON Left Side of Neck RSON Right Side of Neck LSSON Left Spot on Side of Neck RSSON Right Spot on Side of Neck STDEV Standard Deviation
9
Introduction
The selective forces that have led to the evolution of sexual ornamentation have
been of interest to biologists since the time of Charles Darwin. My research
investigated the parasite-‐mediated sexual selection hypothesis (Hamilton and Zuk
1982) for the adaptive function of plumage ornaments in birds. Many birds, such as
my study species, the mourning dove (Zenaida macroura), have brightly colored
feathers that are thought to affect mating success. Such traits may serve to indicate
the quality of prospective mates. In this introduction, I review the scientific
literature that contributed to my understanding of sexual selection theory as it
applies to the evolution of feather ornamentation as indicators of parasite
susceptibility in birds.
A. Sexual Selection Theory
Many dioecious organisms are subjected to sexual selection when mate choice
occurs. Conceived by Charles Darwin, sexual selection is defined as “…the
differences in reproduction that arise from variation among individuals in traits that
affect success in competition over mates and fertilizations” (Andersson 1994, p 31).
Darwin differentiated the idea of sexual selection from that of natural selection by
saying that sexual selection “…depends, not on a struggle for existence, but on a
struggle between males for the possession of females; the result is not death to the
unsuccessful competitor, but few or no offspring” (Darwin 1859, p 85). Originally,
Darwin described two processes by which sexual selection can take place:
intrasexual competition for mating privileges, and intersexual choice (Futuyma
10
2009, p 397). Intrasexual competition involves competition between two members
of the same gender. The process of intersexual choice occurs when a female chooses
a mate based upon her “preference” for a particular trait or combination of traits
displayed by a male.
Intrasexual competition for mates is a key feature of the process of sexual
selection. This is easily recognized by anyone familiar with a species in which
ornamented males engage in a contest with another male of the same species. For
instance, male white-‐tailed deer engage in combat for the opportunity to mate with
the females in that locale. If mating is the result, the winning combatant’s traits, if
heritable will be passed to the next generation. Intrasexually selected traits
commonly include large body size, effective weaponry, and threatening behavioral
signals (Andersson 1994, p 10). Alternatively males may compete through sperm
competition. Sperm competition occurs through the amount, or quality, of gametes
produced by rival males. For example through frequent copulation with a female, a
male can displace rival gametes, or he can physically inhibit copulation by rival
males by depositing a mating plug after mating (Andersson 1994, p 10).
The other component of sexual selection is intersexual choice, also called mate
choice. Mate choice can be described as an “ …evolutionary process that imposes
sexual selection on the other sex and accounts for spectacular ornaments that would
otherwise remain unexplained by natural selection” (Kokko et al., 2002). Intersexual
choice results in two types of selection on a species’ mating preference for a trait,
which are direct selection and indirect selection. The process of direct selection
occurs when the trait that is being selected by the choosy sex confers an immediate
11
benefit that increases fitness (Kokko et al., 2002). Put another way, direct selection
is advantageous to survival and/or fecundity of the female, and involves her looking
at, for example, his nesting site and territory to ensure that it has ample food and
protection from predators (Griffith & Pryke, 2006). Directly selected male traits can
influence mate choice by selection for behaviors and displays in males that indicate
a reduced cost of reproduction for the female. In contrast to direct selection, indirect
selection occurs “…when there is … selection on a trait that is genetically correlated
with the focal trait” (Kokko et al., 2002). This type of intersexual choice benefits the
female indirectly, through the success of her offspring. Potential benefits to the
offspring include superior male-‐derived genes, for example for immunocompetence
and disease resistance (Griffith & Pryke, 2006). The opportunity for individuals to
express their intersexual preferences can differ markedly with the type of mating
systems utilized by a bird species. As a consequence the level of ornamentation,
which is the result of repeated selection via intersexual choice by females, typically
differs with mating system.
The courtship displays of males to females suggest that intersexual choice has
almost certainly contributed to the evolution of elaborate male ornamentation.
Undoubtedly influencing mate choice is the breeding system of a particular species.
Within a polygynous species, such as Indian peafowl (Pavo cristatus), males possess
extreme ornaments such as bright color and long feathers in order to obtain as
many mates as possible. They do not form monogamous pair bonds (Dearborn &
Ryan, 2002). The strategy for monogamous birds differs from this in that pair
bonding occurs and endures to at least the end of the breeding season, and
12
potentially beyond. Because of this, the mechanism by which the less elaborate male
ornamentation of monogamous male birds evolved is different from polygynous
birds, and can be explained by the Darwin-‐Fisher theory. The Darwin-‐Fisher theory
postulates that male secondary sexual traits in monogamous birds are selected for
by the early breeding of females that are in good condition and possess a high
fecundity, and thereby select males based on their secondary sexual traits
(Dearborn & Ryan, 2002). One assumption of this model is that males establish
territories well in advance of female arrival to a breeding site, and that the females
that arrive first are more fecund, or reproductively successful, than later arriving
females (Kirkpatrick et al., 1990). Following their arrival, the females in the best
condition likely will form a pair bond and mate with the most ornamented males.
The later arriving females will have less opportunity to find males with more
preferred secondary sexual traits, and will mate with less ornamented males. Within
monogamous species males often contribute parental care to their offspring, and a
highly conspicuous phenotype could pose a danger to the female and the offspring
from predation (Kirkpatrick et al., 1990). This selection pressure would favor male
secondary sexual characteristics that are noticeable, and still subject to intersexual
choice, but overall less elaborate than in polygynous mating systems.
Aside from mating strategy, the signaled condition of a potential mate plays a
large role in intersexual choice. Condition is defined as the overall phenotypic
quality of an individual (Parker et al., 2007). Rowe and Houle (1996) proposed that
traits dependent on the condition of the organism keep their heritability because
condition itself is an indicator of genetic variance, and that condition itself is
13
dependent upon many genes subject to pleiotropic effects (Rowe et al., 1996, in
Parker et al., 2007). This is important in mate choice, as it means that a male’s
secondary sexual traits are heritable, while also serving to indicate his reproductive
fitness and condition (Rowe et al., 1996, in Parker et al., 2007). When condition is
honestly signaled through secondary sexual traits, there exists a reliable foundation
for intersexual selection to occur on. An important aspect of the condition of a
prospective mate is its parasite load, which holds vast implications for the process
of sexual selection as a whole.
Hamilton & Zuk (1982) were the first to propose the existence of a sexual
selection model in which a coadaptational cycle between hosts and parasites
enabled plumage to indicate parasite resistance in potential mates. Parasite-‐
mediated sexual selection, commonly called the Hamilton & Zuk (1982) hypothesis,
is significant in sexual selection theory because it was the first resolution presented
for the lek paradox. The lek paradox states that persistent female mate choice for
elaborate male ornamentation should eventually eliminate genetic variation within
the trait, and ultimately eliminate the benefits of female preference (Miller et al.,
2007). The Hamilton and Zuk hypothesis makes several assumptions: “(1.) The full
expression of secondary traits of individual hosts is dependent on their overall
health and vigor; (2) Hosts are coevolving with their parasites, thereby continuously
generating heritable resistance to parasites; and (3) parasites have negative effects
on host viability” (Møller, 1990). The process of parasite-‐mediated sexual selection
occurs in a highly cyclical fashion. In illustrating this cycle, assume that the host
possesses two genotypes, D & d, and the parasite possesses two genotypes P & p.
14
Hosts with a D genotype are resistant to parasite type p, and d individuals are
resistant to parasite type P. The parasites proliferate and thrive in hosts with
susceptible genotypes, but die in a host with a resistant genotype. If a female
chooses a male with host genotype D, during a time when parasite type p is
dominant, she receives a selective advantage due to the fact that her offspring will
be better resistant to the predominant parasite, and therefore have increased
survival. It would follow that the D genotype would predominate after successive
generations of selection for the D genotype, but this is not the case. The selection for
the D genotype in the host occurs simultaneous to the selection for a counter-‐
adaptation by the parasite; that is it selects for parasite genotype P. Through this
proliferation of the parasite type P, the selective advantage of host genotype D is
reduced, and in turn the selective advantage for the d host genotype increases. The
ultimate result of this cycle is variation in the viability of both host and parasite,
which prevents the fixation of a genotype in either organism (Møller, 1990).
Additionally, parasite mediated sexual selection is more likely to occur when a
number of different parasite genotypes are evolving in a host with multiple alleles
conveying resistance (Møller, 1990). During the lifetime of a species, an
evolutionary arms race such as this one would undoubtedly take place innumerable
times, thus preventing stagnation and coalescence of the host genotype via sexual
selection as described in the lek paradox.
If plumage quality serves as an honest indicator of parasite-‐load, the Hamilton-‐
Zuk (1982) hypothesis provides a theoretical basis for the evolution of elaborate
male ornamentation in birds. In order to elucidate how plumage could be associated
15
with body condition, the next section of this introduction will explain the various
types of feather coloration, and the mechanisms behind their production of color.
B. Feather Coloration
Feathers are formed within the integument, and have multiple functions,
including flight, ornamentation display, and thermoregulation. The outer feathers
that cover the body of birds are called contour feathers, whereas the feathers of the
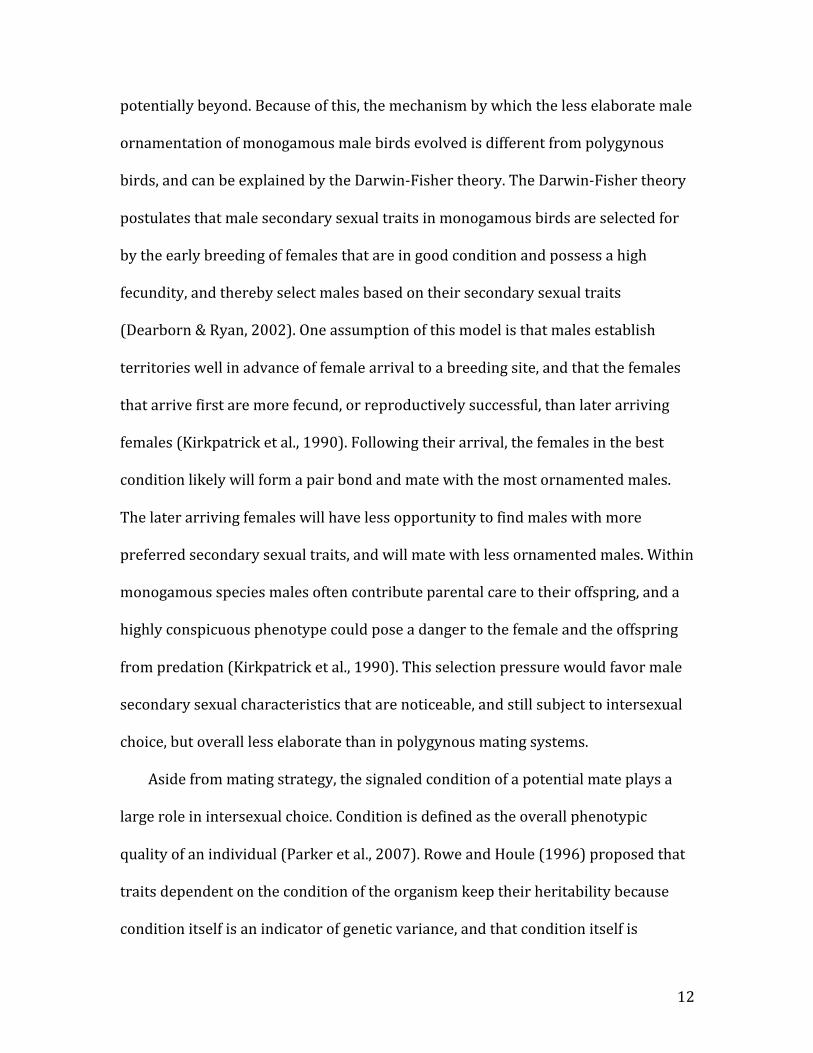
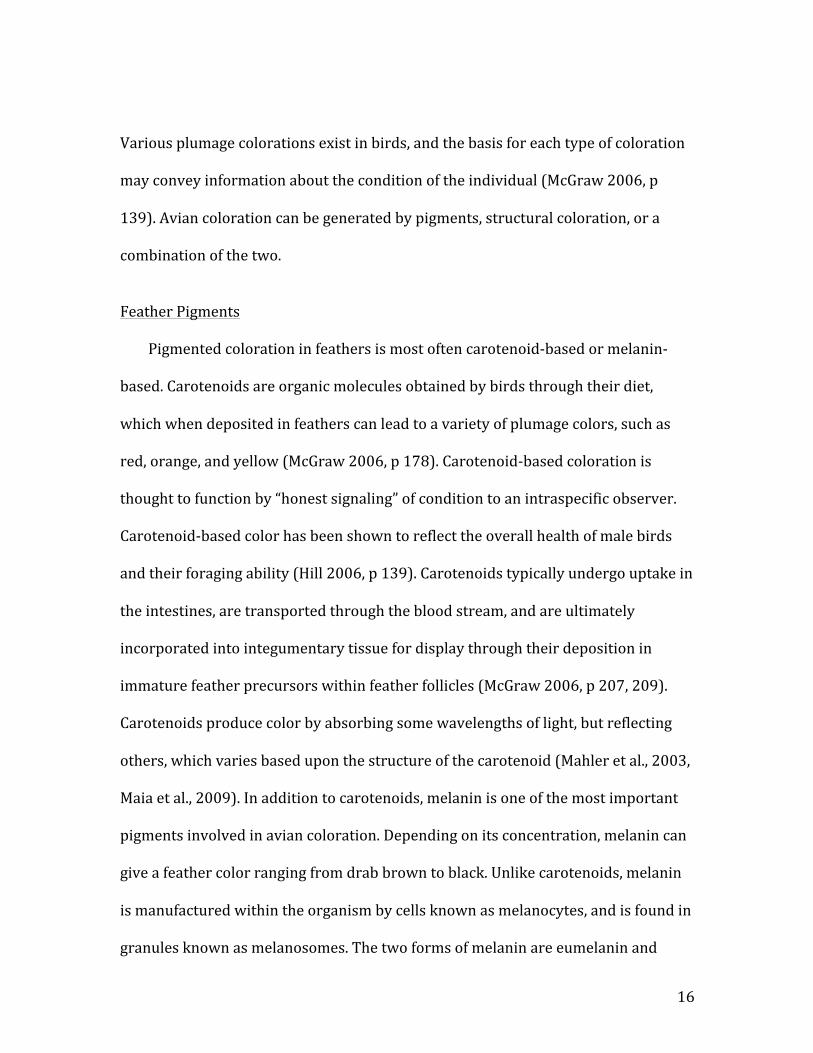
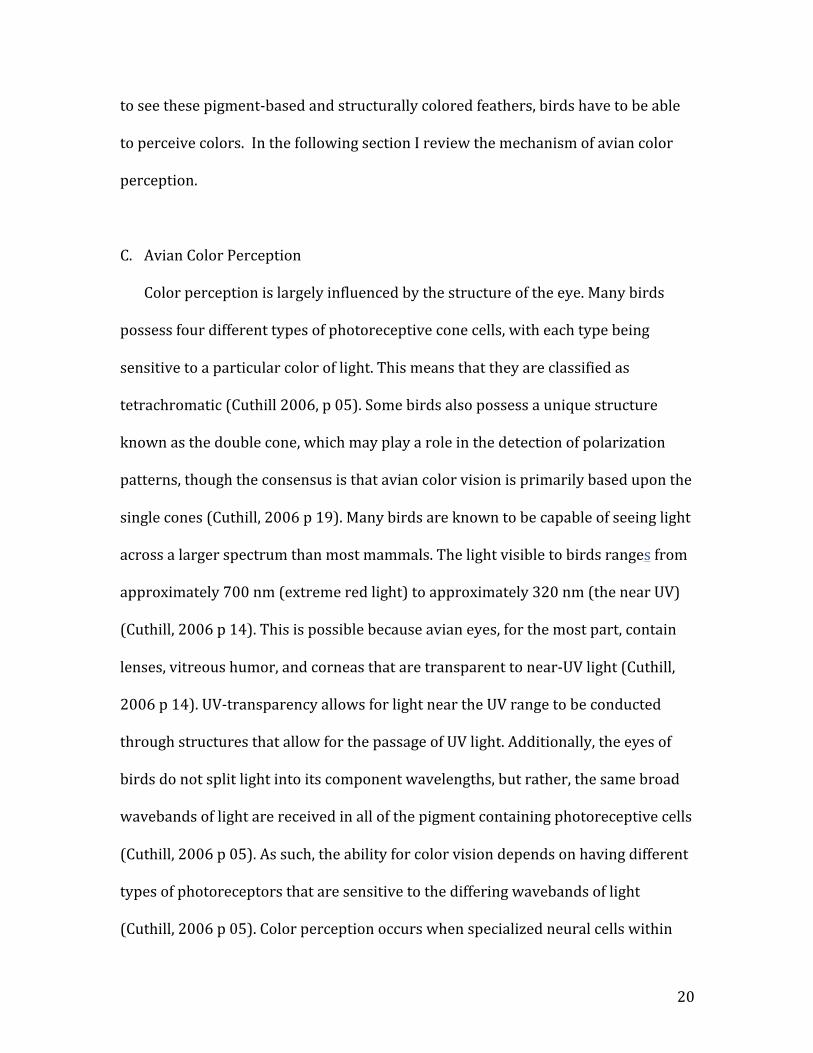
wings and tail are classified as flight feathers. An individual feather is composed of
the rachis or shaft, and is lined with densely packed barbs. Feather barbs
themselves are lined with small barbules (Figure 1). The structural composition of
feathers consists of dead keratinized tissue which is neither innervated nor
vascularized, meaning that the structures and colors found in feathers are not under
the direct control of the bird after the feather is formed (Shawkey et al., 2010).
Figure 1: The structural anatomy of an avian feather.
16
Various plumage colorations exist in birds, and the basis for each type of coloration
may convey information about the condition of the individual (McGraw 2006, p
139). Avian coloration can be generated by pigments, structural coloration, or a
combination of the two.
Feather Pigments
Pigmented coloration in feathers is most often carotenoid-‐based or melanin-‐
based. Carotenoids are organic molecules obtained by birds through their diet,
which when deposited in feathers can lead to a variety of plumage colors, such as
red, orange, and yellow (McGraw 2006, p 178). Carotenoid-‐based coloration is
thought to function by “honest signaling” of condition to an intraspecific observer.
Carotenoid-‐based color has been shown to reflect the overall health of male birds
and their foraging ability (Hill 2006, p 139). Carotenoids typically undergo uptake in
the intestines, are transported through the blood stream, and are ultimately
incorporated into integumentary tissue for display through their deposition in
immature feather precursors within feather follicles (McGraw 2006, p 207, 209).
Carotenoids produce color by absorbing some wavelengths of light, but reflecting
others, which varies based upon the structure of the carotenoid (Mahler et al., 2003,
Maia et al., 2009). In addition to carotenoids, melanin is one of the most important
pigments involved in avian coloration. Depending on its concentration, melanin can
give a feather color ranging from drab brown to black. Unlike carotenoids, melanin
is manufactured within the organism by cells known as melanocytes, and is found in
granules known as melanosomes. The two forms of melanin are eumelanin and
17
phaeomelanin. Eumelanin is the most abundant and produces dark black or brown
hues, whereas phaeomelanin produces light brown hues (McGraw 2006, p 249).
Melanin color displays fulfill a wide variety of functions, from solar UV protection to
indicating testosterone and estrogen levels and the ability for combat (Hill 2006, p
139, 261). In addition to coloration, melanin may also play a role in ectoparasite
defense, as it functions to strengthen integumentary tissues that are targeted by
microbes and mites (McGraw 2006, p 273). Additional pigments that might be found
in bird plumage include porphyrin, pterin, psittacofluvin, flavin, and fluorescent
biochromes, which are found within the plumage, eyes, and skin (McGraw 2006, p
354, 357).
Feather Structural Coloration
Another way through which avian plumage color can occur is through structural
coloration. Structural colors are generated through the coherent scattering of light
waves on the surface of, or within, a structure (Prum, 2006, p 302). The process of
coherent scattering occurs when “…the spatial distribution of light scatterers is not
random with respect to the wavelengths of visible light, so that the phases of
scattered waves are also nonrandom” (Prum 2006, p 307). The process of coherent
scattering can produce two types of structural color: non-‐iridescent structural color,
and iridescent structural color. Non-‐iridescent structural color is primarily
produced by the coherent scattering of light in a matrix of air and keratin within
feather barbules (Shawkey et al., 2006). The occurrence of this type of color is made
possible due to the basal layer of melanosomes directly below the spongy matrix
within the barbule. The melanosomes serve to absorb incoherently scattered white
18
light, thus making the coherently scattered waves the only ones that are reflected to
the observer, and increasing the purity of color reflected by reducing reflectance
noise (Shawkey et al., 2006).
The other type of structural color commonly found throughout many avian
species is the result of iridescence. Iridescence is defined as “the optical phenomena
of change in color with change in angle of observation or angle of illumination”
(Prum, 2006, p 302). One can almost immediately grasp the appearance of
iridescence when one envisions a soap bubble. The brilliant flashes of color one sees
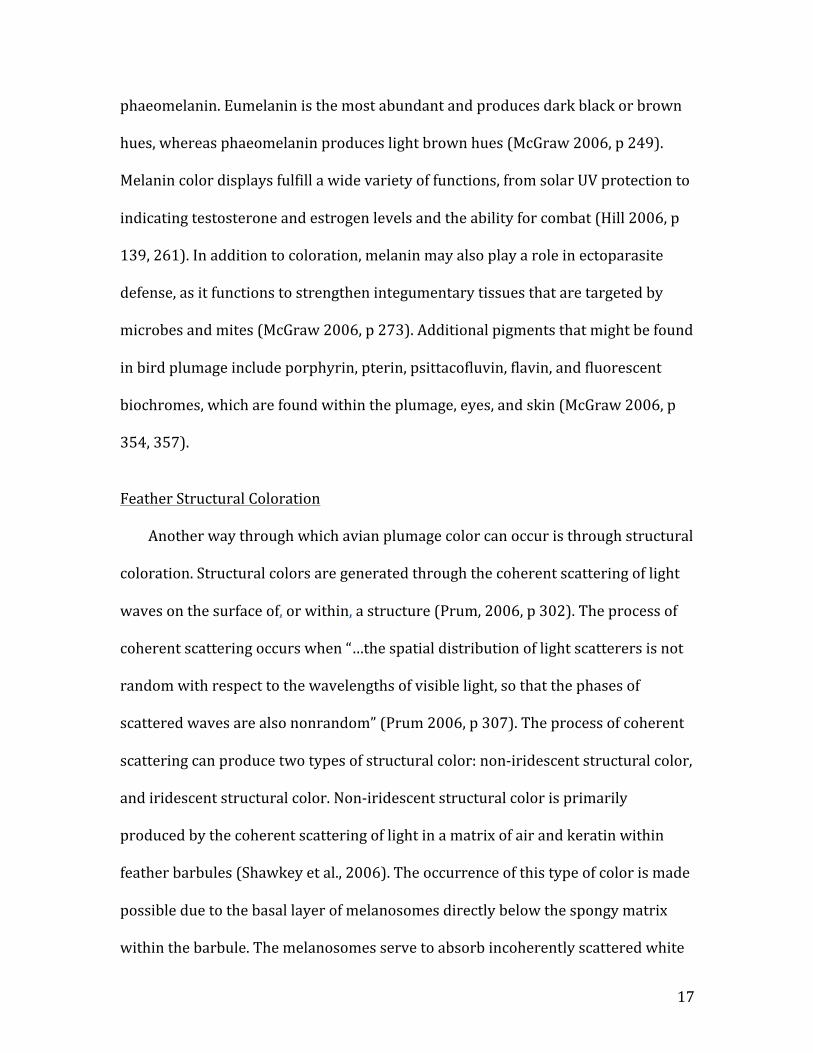
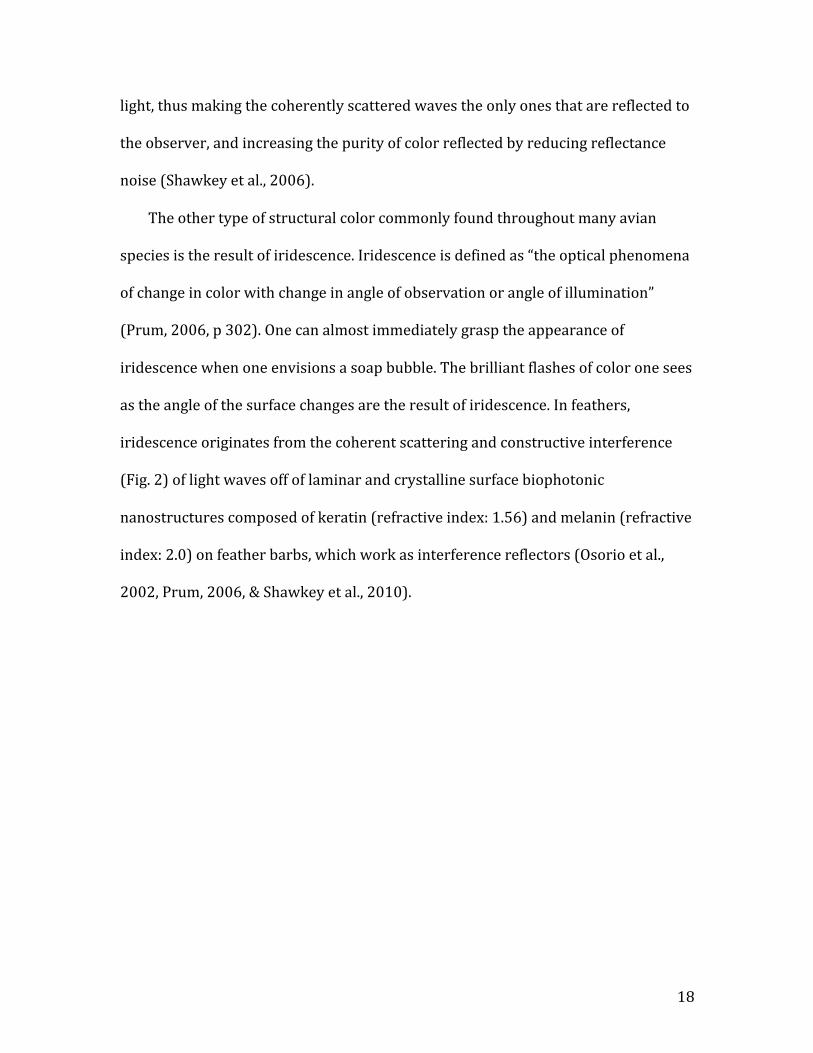
as the angle of the surface changes are the result of iridescence. In feathers,
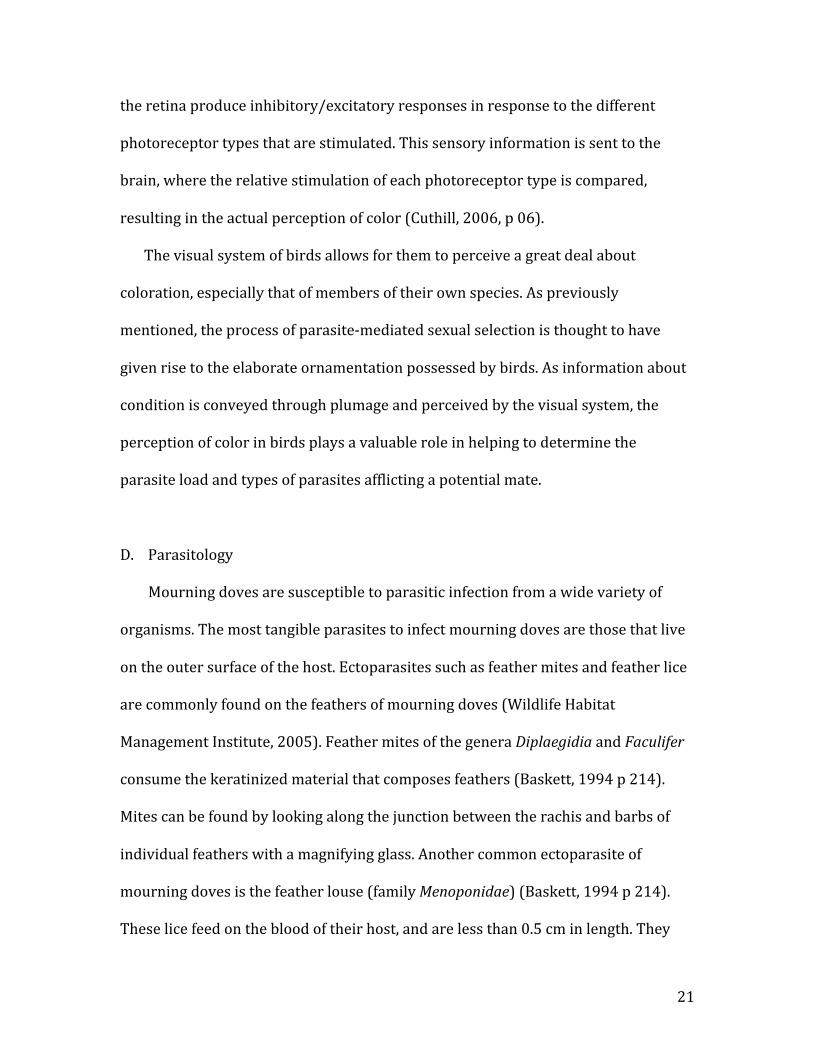
iridescence originates from the coherent scattering and constructive interference
(Fig. 2) of light waves off of laminar and crystalline surface biophotonic
nanostructures composed of keratin (refractive index: 1.56) and melanin (refractive
index: 2.0) on feather barbs, which work as interference reflectors (Osorio et al.,
2002, Prum, 2006, & Shawkey et al., 2010).
19
Figure 2: A graphical illustration of the constructive interference of light.
Coherent scattering occurring within the surface nanostructures is also known
as thin-‐film interference. This type of diffraction occurs when the constructive
interference of light occurs within thin layers or reflective structures on the surface
of an object. In the case of mourning dove feathers, this thin layer is composed of
laminar arrays of keratin on the outer edges of the feather barbules, and is a single
keratin layer approximately 335 nanometers thick (Shawkey et al., 2010). There is a
great variety of nanostructures that occur among birds that allow for the coherent
scattering of light. Depending on the species, nanostructures be either laminar,
crystalline-‐hexagonal, or quasi-‐ordered arrays (Prum, 2006, p 310). It is important
to note that the arrangement of these biophotonic nanostructures on barbule
surfaces is not random. In fact, the order in which these surface nanostructures and
their internal matrices of air, keratin, and melanosomes are spaced precisely to
produce the structural colors observed by the viewer (Prum, 2006 p 316). In order
20
to see these pigment-‐based and structurally colored feathers, birds have to be able
to perceive colors. In the following section I review the mechanism of avian color
perception.
C. Avian Color Perception
Color perception is largely influenced by the structure of the eye. Many birds
possess four different types of photoreceptive cone cells, with each type being
sensitive to a particular color of light. This means that they are classified as
tetrachromatic (Cuthill 2006, p 05). Some birds also possess a unique structure
known as the double cone, which may play a role in the detection of polarization
patterns, though the consensus is that avian color vision is primarily based upon the
single cones (Cuthill, 2006 p 19). Many birds are known to be capable of seeing light
across a larger spectrum than most mammals. The light visible to birds ranges from
approximately 700 nm (extreme red light) to approximately 320 nm (the near UV)
(Cuthill, 2006 p 14). This is possible because avian eyes, for the most part, contain
lenses, vitreous humor, and corneas that are transparent to near-‐UV light (Cuthill,
2006 p 14). UV-‐transparency allows for light near the UV range to be conducted
through structures that allow for the passage of UV light. Additionally, the eyes of
birds do not split light into its component wavelengths, but rather, the same broad
wavebands of light are received in all of the pigment containing photoreceptive cells
(Cuthill, 2006 p 05). As such, the ability for color vision depends on having different
types of photoreceptors that are sensitive to the differing wavebands of light
(Cuthill, 2006 p 05). Color perception occurs when specialized neural cells within
21
the retina produce inhibitory/excitatory responses in response to the different
photoreceptor types that are stimulated. This sensory information is sent to the
brain, where the relative stimulation of each photoreceptor type is compared,
resulting in the actual perception of color (Cuthill, 2006, p 06).
The visual system of birds allows for them to perceive a great deal about
coloration, especially that of members of their own species. As previously
mentioned, the process of parasite-‐mediated sexual selection is thought to have
given rise to the elaborate ornamentation possessed by birds. As information about
condition is conveyed through plumage and perceived by the visual system, the
perception of color in birds plays a valuable role in helping to determine the
parasite load and types of parasites afflicting a potential mate.
D. Parasitology
Mourning doves are susceptible to parasitic infection from a wide variety of
organisms. The most tangible parasites to infect mourning doves are those that live
on the outer surface of the host. Ectoparasites such as feather mites and feather lice
are commonly found on the feathers of mourning doves (Wildlife Habitat
Management Institute, 2005). Feather mites of the genera Diplaegidia and Faculifer
consume the keratinized material that composes feathers (Baskett, 1994 p 214).
Mites can be found by looking along the junction between the rachis and barbs of
individual feathers with a magnifying glass. Another common ectoparasite of
mourning doves is the feather louse (family Menoponidae) (Baskett, 1994 p 214).
These lice feed on the blood of their host, and are less than 0.5 cm in length. They
22
can be found along the rachis of the feather of the host. In addition to ectoparasites,
mourning doves can become infected with endoparasites, including the avian
malarial parasites of the genera Haemoproteus and Plasmodium. Apicomplexan
blood parasites such as these are transmitted by blood sucking insect vectors. The
two most common Haemoproteus parasites that infect mourning doves are H.
maccallumi (also known as H. columbae) and H. sacharovi (Shamis and Forrester,
1977). The vectors for Haemoproteus parasites are Hippoboscid flies (Campbell,
1993 p 30). Plasmodium is another genus of Apicomplexan parasites that can infect
doves. The 5 species commonly found in mourning doves are: P. elongatum, P.
hexamerium, P. polare, P. reticulum, and P. cathemerium (Baskett, 1995, p 207).
These parasites are carried by mosquitos of the genus Culex (Campbell, p 1995, p
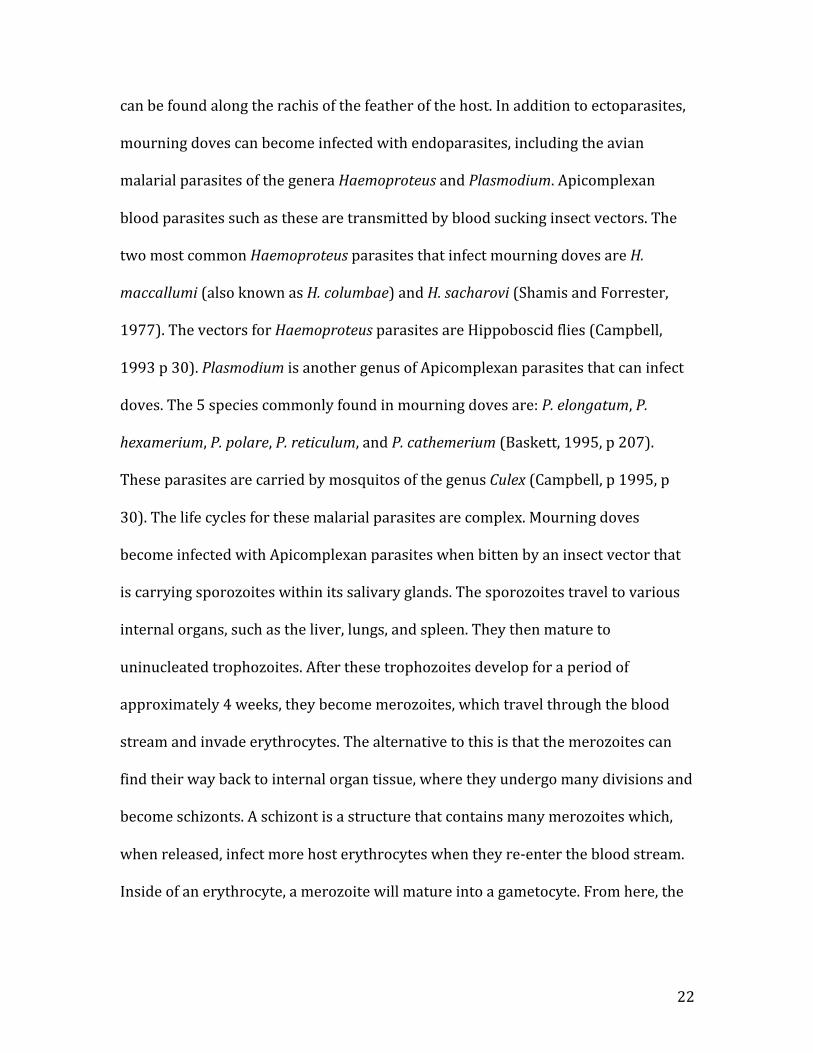
30). The life cycles for these malarial parasites are complex. Mourning doves
become infected with Apicomplexan parasites when bitten by an insect vector that
is carrying sporozoites within its salivary glands. The sporozoites travel to various
internal organs, such as the liver, lungs, and spleen. They then mature to
uninucleated trophozoites. After these trophozoites develop for a period of
approximately 4 weeks, they become merozoites, which travel through the blood
stream and invade erythrocytes. The alternative to this is that the merozoites can
find their way back to internal organ tissue, where they undergo many divisions and
become schizonts. A schizont is a structure that contains many merozoites which,
when released, infect more host erythrocytes when they re-‐enter the blood stream.
Inside of an erythrocyte, a merozoite will mature into a gametocyte. From here, the
23
parasite can reoccupy its vector once the vector bites an infected host (Olsen, 1974
p 144).
Figure 3: The lifecycle of Haemoproteus columbae as it occurs intracellularly.
Another protozoan endoparasite that can infect mourning doves is Trichomonas
gallinae. This protozoan infects the mouth, esophagus, and crop of birds and causes
weight loss and cheesy, yellow buildups in the mouth, which can interfere with the
consumption of food and water (Wildlife Habitat Management Institute, 2005, Cover
et al., 1994 in Stromberg et al., 2008).
Both endoparasites and ectoparasites are known to have negative impacts on
their hosts through either direct mortality or through other effects (Dunn et al.,
2013). Ectoparasites, such as feather mites and feather lice, are known to damage
the barbs and barbules of feathers. This negatively affects the host in multiple ways.
In the event of a heavy infection, the damage to the plumage can compromise its
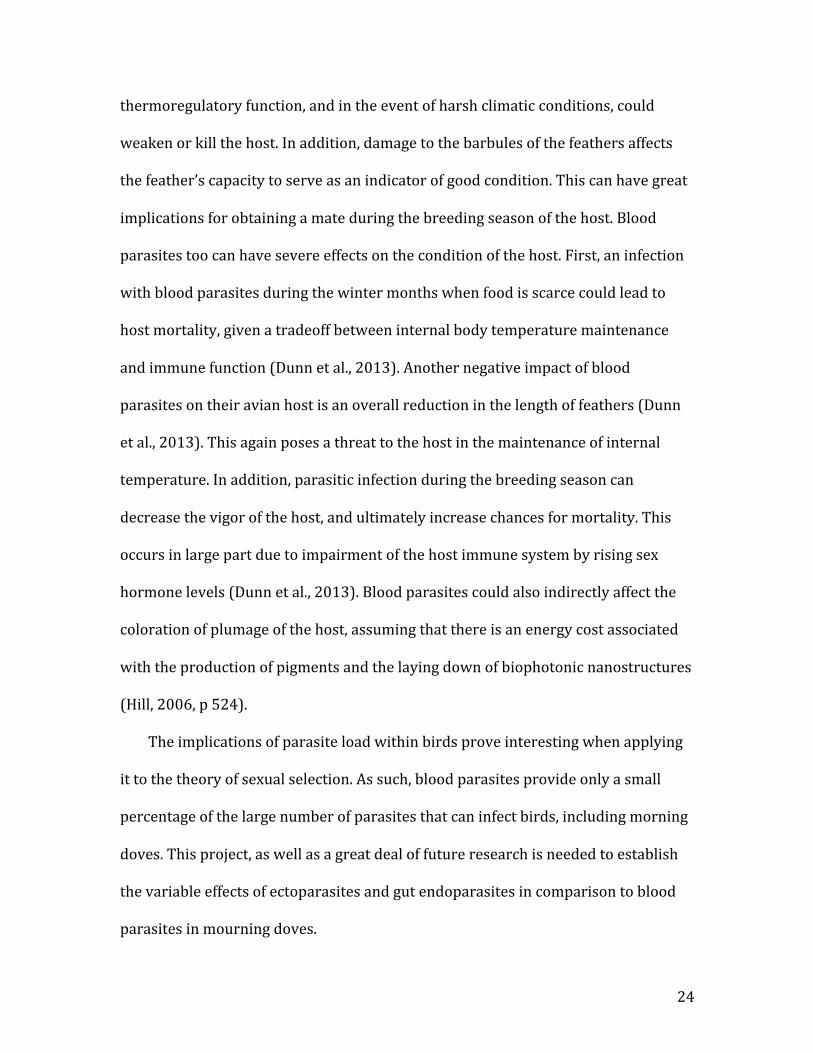
24
thermoregulatory function, and in the event of harsh climatic conditions, could
weaken or kill the host. In addition, damage to the barbules of the feathers affects
the feather’s capacity to serve as an indicator of good condition. This can have great
implications for obtaining a mate during the breeding season of the host. Blood
parasites too can have severe effects on the condition of the host. First, an infection
with blood parasites during the winter months when food is scarce could lead to
host mortality, given a tradeoff between internal body temperature maintenance
and immune function (Dunn et al., 2013). Another negative impact of blood
parasites on their avian host is an overall reduction in the length of feathers (Dunn
et al., 2013). This again poses a threat to the host in the maintenance of internal
temperature. In addition, parasitic infection during the breeding season can
decrease the vigor of the host, and ultimately increase chances for mortality. This
occurs in large part due to impairment of the host immune system by rising sex
hormone levels (Dunn et al., 2013). Blood parasites could also indirectly affect the
coloration of plumage of the host, assuming that there is an energy cost associated
with the production of pigments and the laying down of biophotonic nanostructures
(Hill, 2006, p 524).
The implications of parasite load within birds prove interesting when applying
it to the theory of sexual selection. As such, blood parasites provide only a small
percentage of the large number of parasites that can infect birds, including morning
doves. This project, as well as a great deal of future research is needed to establish
the variable effects of ectoparasites and gut endoparasites in comparison to blood
parasites in mourning doves.
25
D. Objectives The purpose of this research is to explore the theory of parasite mediated sexual
selection to determine its implications for reproductive behavior in mourning
doves. My major objective is to test for a negative correlation between parasite load
and feather iridescence in adult mourning doves. I predict that if avian
ornamentation arose via parasite-‐mediated sexual selection (Hamilton and Zuk,
1982), then mourning dove secondary sexual characteristics are used as an
indicator of parasite load during intrasexual choice. Specific to my data collection, I
predict three things:
1.) Individuals with high parasite load will possess less iridescent plumage.
2.) The testes of males with a low parasite load will have greater mass than the testes of males with a high parasite load.
3.) Tarsometatarsal length will be greater on average for individuals with a lower parasite burden.
My null hypothesis is that parasite load does not affect avian secondary sexual
ornamentation used in sexual selection. The subsequent section describes the
methods that I employed to test my predictions that are based on the Hamilton and
Zuk (1982) hypothesis.
26
Materials and Methods
A. Study Species Mourning doves (Zenaida macroura) are one of the most numerous migratory
birds in North America, with an estimated annual fall population of approximately
400 million birds (Marks, 2005). Hunters prize them, and approximately 18 to 25
million are harvested annually. They have gray wing and tail feathers, with the rest
of the body being light brown. Males possess a more distinct pink coloration on the
contour feathers of the breast, and a more obvious bluish coloration on the neck and
head. Males typically are the larger of the sexes. Juveniles are easily distinguishable
from adults, as they possess a smaller body size, and have light buff tips at the ends
of their feathers, lending to them a scaly appearance (Marks, 2005). Mourning doves
form strong monogamous pair bonds that can endure past the end of the breeding
season, and both parents actively contribute in incubating the offspring. Unpaired
males devote a great deal of their time during the breeding season to attracting a
mate. Females typically lay a small clutch of two eggs, and can raise two to three
clutches per breeding season in northern locations (Marks, 2005). After a clutch has
hatched, both parents feed their offspring with a substance referred to as crop milk
(Gillespie et al, 2012). Pigeon crop ‘milk’ is composed of lipid-‐filled, protein rich
keratinocytes that originate from the lining of the crop sac to form a thick, milk-‐like
substance that is regurgitated and fed to the offspring (Gillespie et al, 2012). This
diet gradually becomes supplemented with seeds, and at around day 15, the diet of
the fledgling is the same as that of the parent (Marks, 2005). Mourning doves’
preferred diet consists of corn, millet, oats, sunflowers, and wheat. In order to drink
27
water, Mourning doves go to puddles or ponds that have high visibility surrounding
them (Marks, 2005). They tend to return to the same sites at which they have found
food until that food source is exhausted.
B. Study Area
All Mourning Doves collected in this study were harvested from 33°39'8.45"N,
88°21'47.55"W, in Caledonia, Mississippi. The specimens were collected during two
organized hunting events on the afternoon of 01 September 2013 and the morning
of 02 September 2013.
C. Field Collection Methods
This research depended on hunters to volunteer their harvested mourning
doves as specimens. In the field, the harvested mourning doves were handled as
quickly as possible to prevent blood coagulation from interfering with blood sample
collection procedures. Clean latex gloves were worn with each specimen to prevent
the oil from fingerprints or any other substance from sticking to the feather and
confounding iridescence. Any blood on target areas for iridescent feathers was
foremost removed with a clean paper towel dampened with distilled water to
prevent blood from staining the feathers. Next, the specimens were aged and sexed
by head and chest contour feather iridescence. Bluish feathers on the back of the
head and conspicuous pink to green coloration on the side of the neck indicated the
male gender, and the absence of these traits indicated female gender. After this, each
specimen was inspected for signs of T. gallinae. The bill was opened and a light
shone down the pharynx to look for the distinctive yellow buildup associated with a
28
Trichomonas infection. Next, I searched for lice and mites on the wings, keel, back,
rump and head. The inspection for these ectoparasites was performed with a
magnifying glass, and feathers were ruffled from the tip of the vane toward the
calamus. I ruffled feathers once, unidirectionally, starting from the bird’s posterior
and moving toward the anterior end. The counting procedure allotted 1 minute for
the tail and rump regions, and 30 seconds for the keel, back, and head regions. These
limitations on time were followed to prevent accidental recounting of the same
parasites, and followed the visual examination methodology laid out by Clayton et
al. (2001). Extensive damage to contour feathers from feather mite activity was
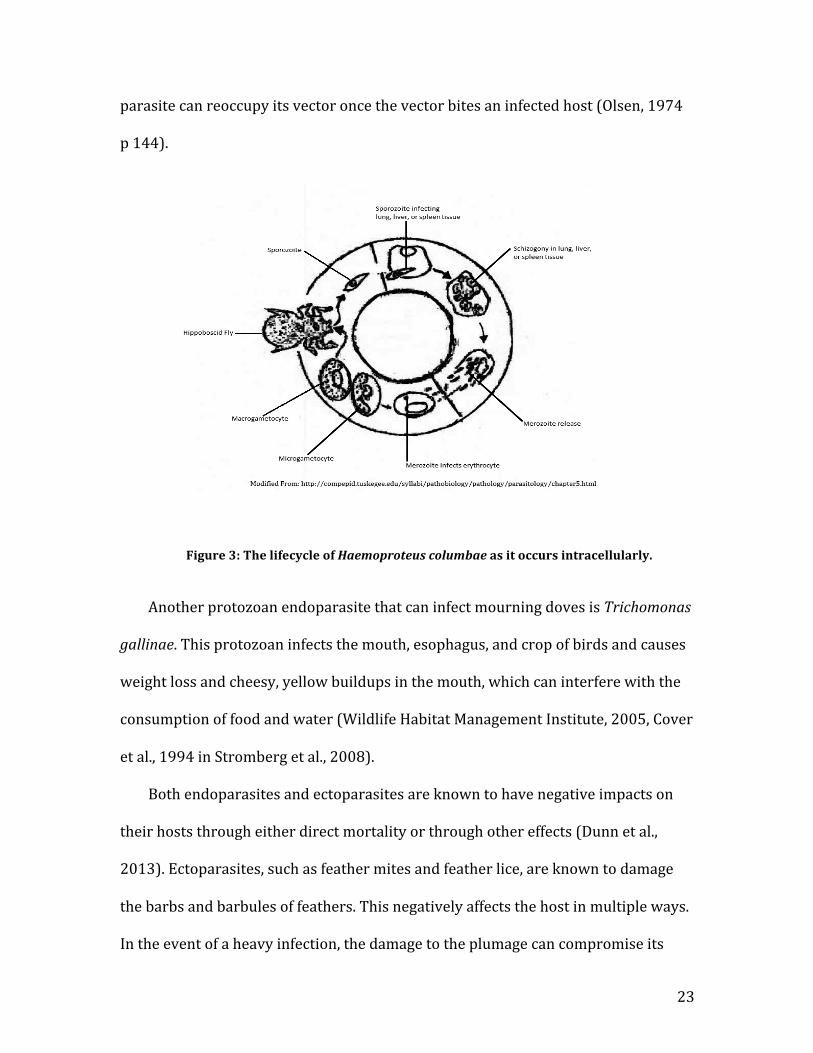
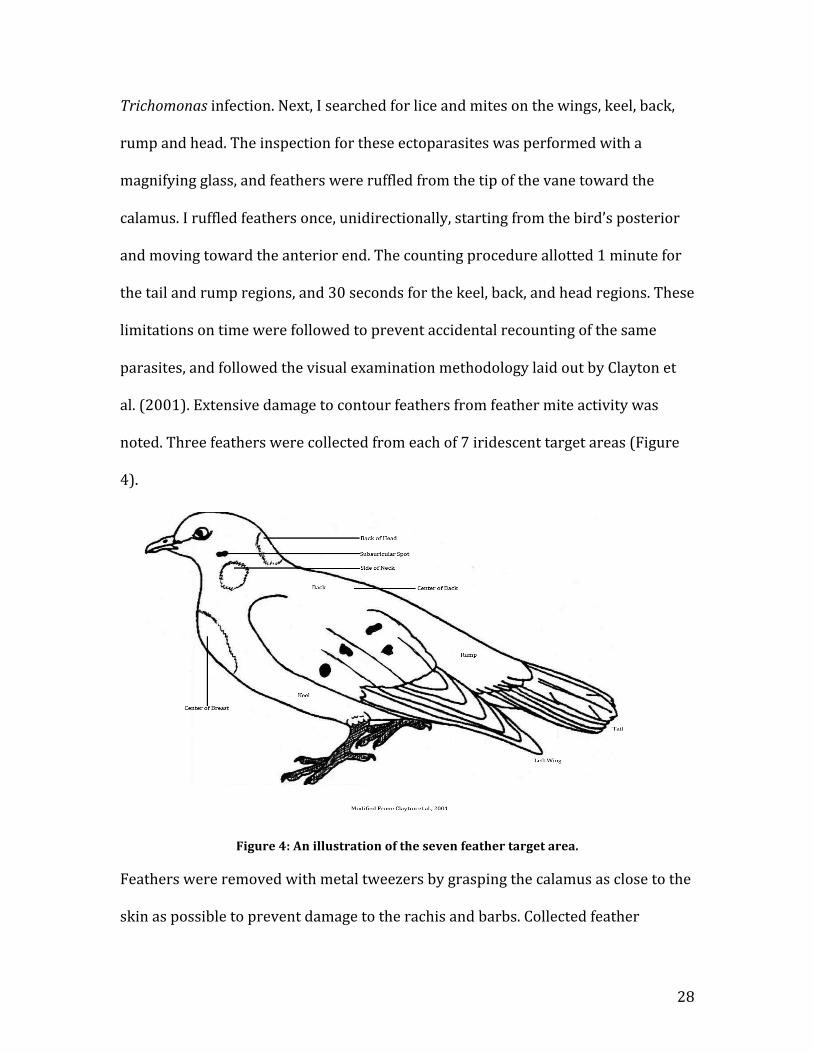
noted. Three feathers were collected from each of 7 iridescent target areas (Figure
4).
Figure 4: An illustration of the seven feather target area.
Feathers were removed with metal tweezers by grasping the calamus as close to the
skin as possible to prevent damage to the rachis and barbs. Collected feather
29
samples were placed into paper envelopes. In order to prevent a biased selection
based on feather brightness or dullness, collection from each target area followed a
set of guidelines, and were as follows: The feathers on the chest were selected from
approximately the center, with the first feather coming from the center, and the
second and third feather collected from the left and right side of the first
respectively. The feathers from both sides of the neck were collected from 1
centimeter below the eye with the head in a normal, alert position. Additionally,
feathers were taken from the center of the back of the specimen, approximately one
inch below the neck. The feathers from the two small iridescent spot on the side of
the neck were selected in the same way as the chest contour feathers. If feathers on
one side of the specimen were heavily damaged by the shot or stained with blood,
additional feathers from the corresponding target area on the opposite side of the
bird were collected instead. After feather collection was completed, the specimens
were dissected. Blood samples were taken by clipping the apex of the heart directly
below the left ventricle and collecting the blood in a non-‐heparinized microcapillary
tube. In the event that blood coagulation had become too extensive to collect a good
sample, a small piece of the liver was taken and processed to a pulverized state with
a razor blade on a pre-‐cleaned slide. These samples were deposited into a
microcentrifuge tube containing 0.5 mL of cold, absolute ethanol to preserve them.
The microcentrifuge tubes were then placed back into a cooler containing ice to
keep the samples cold. After this, two blood smear slides were made by collecting
blood in a heparinized microcapillary tube and depositing it onto a glass microscope
slide that had been cleaned with sterile alcohol swabs and allowed to air dry prior to
30
being used. Lastly, the tarsi and wings were removed with laboratory scissors by
cutting as close to the body of the bird as possible. The tarsi and wings were placed
into Ziploc bags, sealed, and kept on ice.
D. Blood Smear Preparation
In the laboratory, the previously made blood smears were fixed in absolute
methyl alcohol and stained with laboratory grade Wright-‐Giemsa, Fucillo
Modification (Carolina Biological Supply, Burlington, NC). The staining procedure is
described in Appendix II. Slides were examined under the microscope at 400X and
under oil immersion at 1,000X until approximately 10,000 erythrocytes were
viewed. Intracellular parasites were counted, and the life cycle stage noted. The total
parasite count included all intracellular parasitic forms observed. The presence of
schizont forms in peripheral blood was taken to indicate the presence of
Plasmodium.
E. Photospectroscopy
UV-‐ vis Spectrometry was used to measure the iridescence of feather samples
collected in the field. Feathers were taped to matte black cardstock. In order to
provide a stable and repeatable orientation for measuring reflectance, a device
similar to that described by Meadows et al. (2010) was used.

31
Figure 5: Photospectroscopy setup similar to the system described in Meadows et al., 2010.
The device is constructed of aluminum, and consists of a movable stage with two
rotatable arms that accommodate fiber optics supporting a light source and a
spectrometer for receiving the reflectance spectra. Quartz collimating lenses were
attached to the ends of both the light source and the spectrometer, and adjusted so
that they overlapped within an approximately 2.0 mm area on the stage. Ocean
Optics’ SpectraSuite software was used in collecting reflectance data for the feather
specimens. Angle resolved spectroscopy was utilized in determining the angle that
produced the maximum reflectance for each type of feather. The
spectrophotometer’s collection probe was held perpendicular to the viewing stage
at 90°, with the UV pulse light source maintained at an angle of maximum
reflectance determined during my study. Angles of the probe containing arms were
approximated using protractors at the rotatable base of each arm, and were refined
32
using a Wixey WR300 Digital Angle Gauge (Sanibel, FL) that had been zeroed on the
viewing stage. All data collection procedures were completed in a dark room in
order to prevent ambient light from being detected by the spectrophotometer. Prior
to data collection, dark reference spectrum measurements were taken with the light
path to the spectrometer blocked with a piece of matt black card stock, and
reference spectrum measurements were taken with the light source on and a blank
within the sampling region (SpectraSuite Operation Manual, 2009). For the
reference spectrum blank, four strips of Teflon tape were laid one on top of the
other over a piece of matte black card stock. Teflon tape was used due to its
reflectance coefficient of 103% (Janecek 2012). Reference measurements were
taken in scope mode, which is the operating mode in which raw data is acquired by
the detector that allows for the establishment of signal-‐conditioning parameters
(SpectraSuite Operation Manual, 2009). Scope mode also reflects the intensity of the
light source, the reflectivity of the grating and mirrors in the spectrometer, the
transmission efficiency of the fibers, the response of the detector, in addition to the
spectral characteristics of the sample (SpectraSuite Operation Manual, p 86).
Integration time was set at 105 ms, with the continuous strobe delay time being set
at 15 ms, a divisor of the integration time. Boxcar width was set at 2 to smooth out
spikes in the reflectance readings by averaging data points with surrounding data
values (SpectraSuite Operation Manual, 2009). Three reflectance measurements
were taken per feather specimen in the spectrometer’s reflectance mode. Complete
instructions for the photospectroscopy technique can be found in Appendix II. Three
replicate measurements of each feather specimen were taken, involving
33
repositioning of the feather between measurements. Because use of the
spectrophotometer occurred over long periods of time, after each three readings
from one feather were completed, reference spectrum measurements were taken
again to control for the possibility of drift by the spectrometer’s sensor due to
ambient temperature or other factors.
F.) Spectral Data Analysis
Spectral measurements collected from SpectraSuite were analyzed using
Montgomerie’s (2008) CLR: Color Analysis Programs v1.05. The raw spectral
readings were uploaded to CLRfiles and converted to text files with values in
percent reflectance (Montgomerie 2008). For the CLRfiles analysis, the wavelength
range was set from 320nm-‐700nm. The lower value in this range was selected
because pigeons (Columba livia), a relative of the mourning dove, have been found
to be able to perceive UV light from 320nm-‐380nm (Kawamura et al., 1999). For this
experiment, this UV visual capability is assumed to have been conserved
evolutionarily. Bin size, or the width of wavelengths averaged in each spectral
reading, was maintained at 1, meaning that each individual wavelength value was
analyzed independently of the surrounding wavelength values. The tristimulus color
variables generated by the CLRvars feature of the CLR software are brightness,
saturation (also known as chroma), and hue. Brightness, also referred to as spectral
intensity or vividness, is a measure of the total amount of reflected or transmitted
light coming from a surface at a particular angle (Montgomerie 2006, p 102). For
this research, brightness was calculated by adding the percentage of reflectance
from each wavelength between 320nm-‐700nm, as it is the most commonly used
34
method in avian color research (Montgomerie, 2006 p 111). Chroma was calculated
as the ratio of feather reflectance to the spectrum interval from 320nm-‐700nm
(Montgomerie, 2006 p 111). Hue was calculated as the wavelength at which the
highest reflectance was recorded (Montgomerie, 2006 p 111).
G.) Statistical Analysis
Tristimulus color values for each of the seven plumage types were the average
of three spectral readings, which were then averaged with the readings of the other
two feather s collected from each specimen. Comparisons between plumage types
were made by averaging all of one color value (e.g., Hue) for one plumage type, and
comparing it to the averaged value for another plumage type. Tarsometatarsal
length was the result of the average between the two tarsometatarsi of each bird.
Intracellular Hematozoa were counted on two blood smears, and the results of these
counts averaged. Mite sum was calculated as the total number of mites counted on
each specimen. Simple linear regressions were used to graphically represent the
data. Data were considered to be significant if P≤ 0.05. Standard deviation and
range were calculated for brightness, chroma, and hue of the entire population of
specimens.
35
Results Twenty-‐four adult birds were obtained from two days of collection from 01-‐02
September 2013. These included fourteen males and ten females. Two individuals
were uninfected with mites, but twenty-‐two others were found to have mite
infections (Range=2-‐200). Individual feather lice were only found on specimens 16
and 24, but were not noted on any other birds. Hematozoan blood parasites were
noted in all individuals, though the level of infection varied greatly (Avg.range =3-‐
23.5) per 10,000 erythrocytes counted. Not all parasite stages were found in every
specimen, but all stages of parasitic infection were noted within the total population.
Merozoites were by far the most common form observed. Multiple specimens were
found to have no circulating macrogametocytes, whereas specimen 19 possessed
the highest average of macrogametocytes counted (n=15).
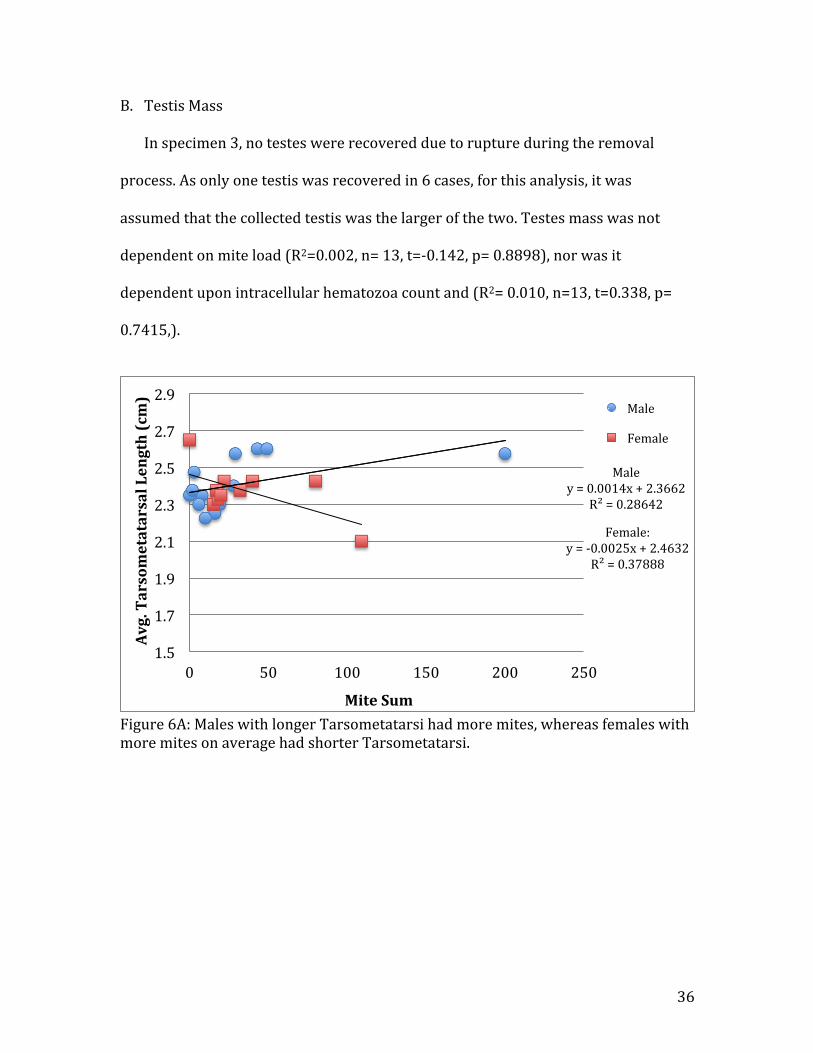
A. Tarsometatarsal Length
There was a positive association between mite sum and average male
tarsometatarsal length (R2=0.29, n=14)(Fig. 6A). No significant relationship was
found between hematozoa sum and average male tarsometatarsal length (R2=0.03,
Fig. 08). Females were found to exhibit a negative relationship between mite sum
and average female tarsometatarsal length (R2=0.38, Fig. 6A), but no relationship
was found with regard to female tarsometatarsal length and hematozoa count
(R2<0.01 Fig. 08).
36
B. Testis Mass
In specimen 3, no testes were recovered due to rupture during the removal
process. As only one testis was recovered in 6 cases, for this analysis, it was
assumed that the collected testis was the larger of the two. Testes mass was not
dependent on mite load (R2=0.002, n= 13, t=-‐0.142, p= 0.8898), nor was it
dependent upon intracellular hematozoa count and (R2= 0.010, n=13, t=0.338, p=
0.7415,).
Figure 6A: Males with longer Tarsometatarsi had more mites, whereas females with more mites on average had shorter Tarsometatarsi.
Male y = 0.0014x + 2.3662
R² = 0.28642
Female: y = -‐0.0025x + 2.4632
R² = 0.37888
1.5
1.7
1.9
2.1
2.3
2.5
2.7
2.9
0 50 100 150 200 250
Avg. Tarsometatarsal Length (cm)
Mite Sum
Male
Female
37
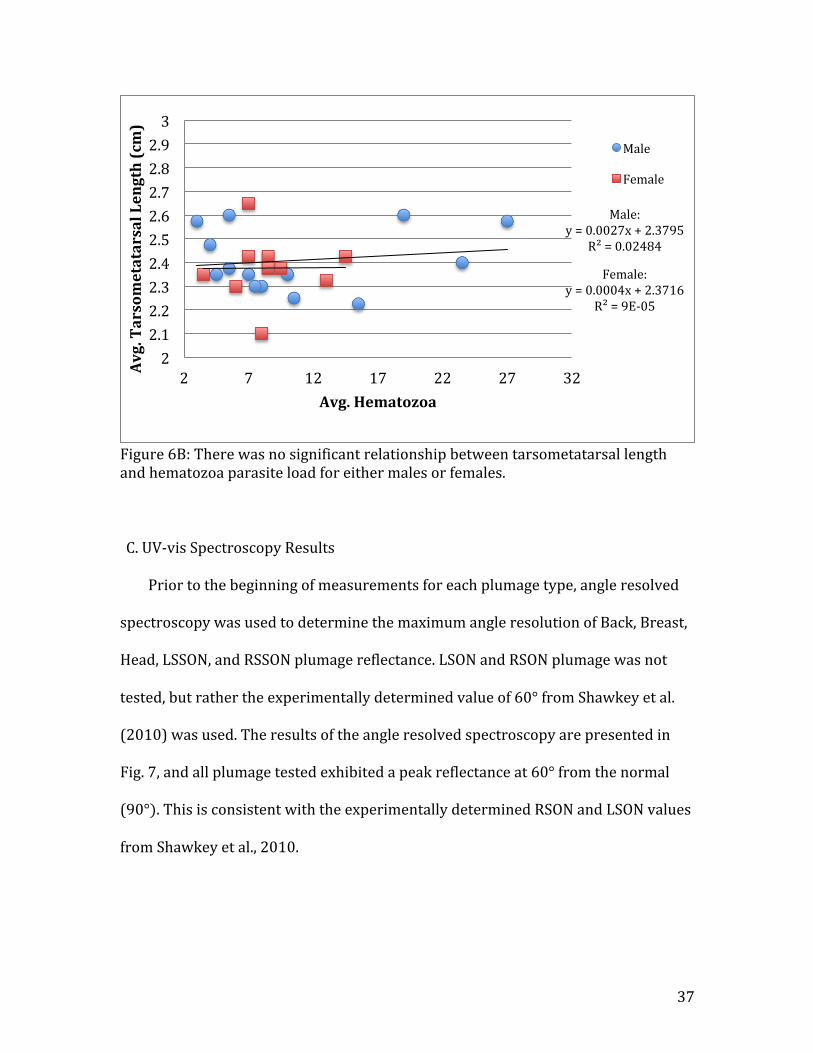
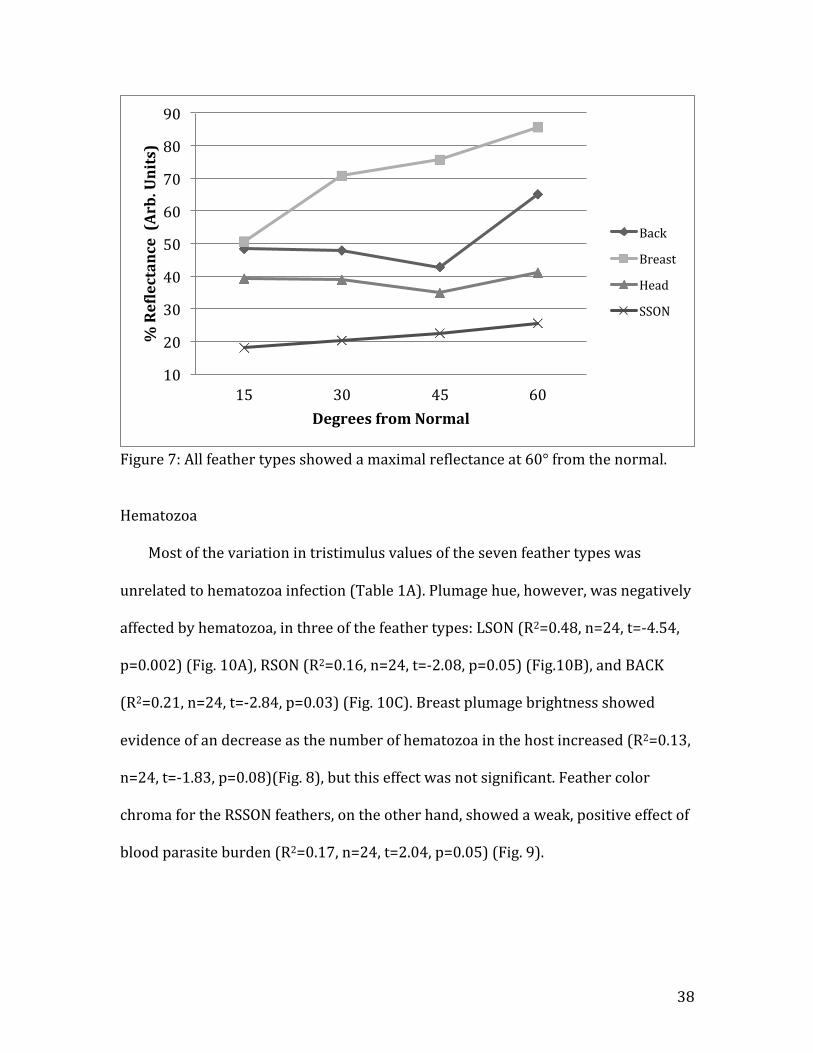
Figure 6B: There was no significant relationship between tarsometatarsal length and hematozoa parasite load for either males or females. C. UV-‐vis Spectroscopy Results Prior to the beginning of measurements for each plumage type, angle resolved
spectroscopy was used to determine the maximum angle resolution of Back, Breast,
Head, LSSON, and RSSON plumage reflectance. LSON and RSON plumage was not
tested, but rather the experimentally determined value of 60° from Shawkey et al.
(2010) was used. The results of the angle resolved spectroscopy are presented in
Fig. 7, and all plumage tested exhibited a peak reflectance at 60° from the normal
(90°). This is consistent with the experimentally determined RSON and LSON values
from Shawkey et al., 2010.
Male: y = 0.0027x + 2.3795
R² = 0.02484
Female: y = 0.0004x + 2.3716
R² = 9E-‐05
2 2.1 2.2 2.3 2.4 2.5 2.6 2.7 2.8 2.9 3
2 7 12 17 22 27 32 Avg. Tarsometatarsal Length (cm)
Avg. Hematozoa
Male
Female
38
Figure 7: All feather types showed a maximal reflectance at 60° from the normal.
Hematozoa
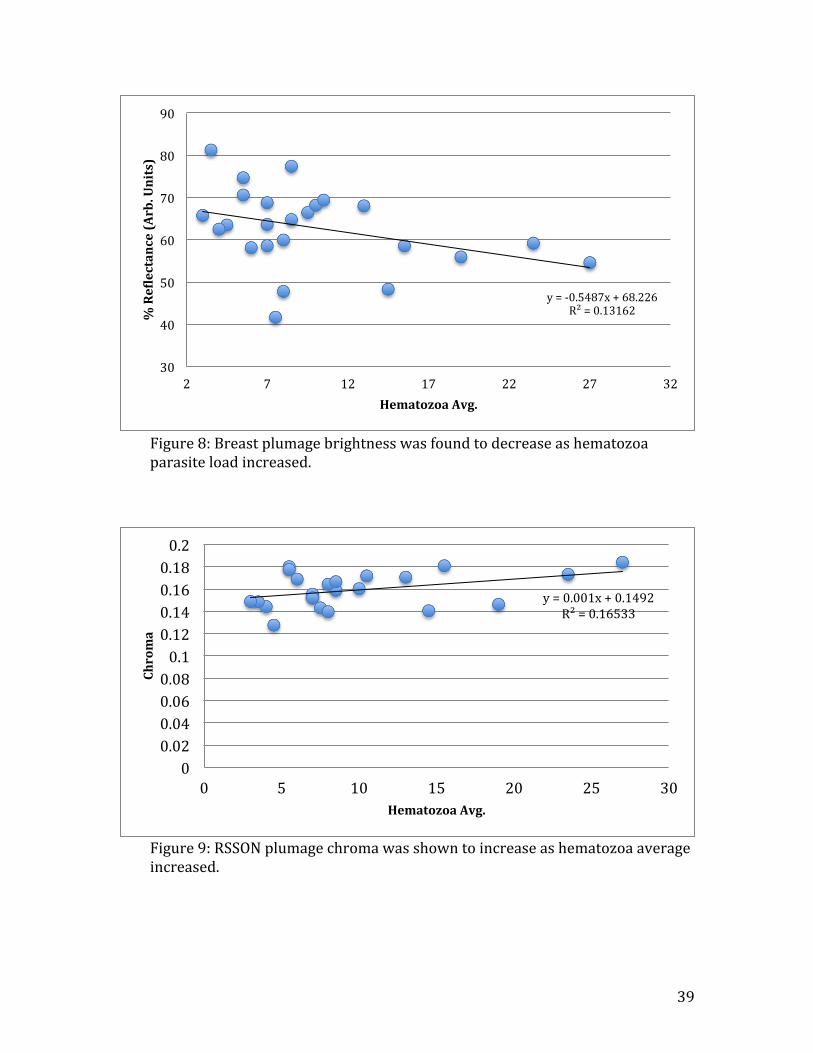
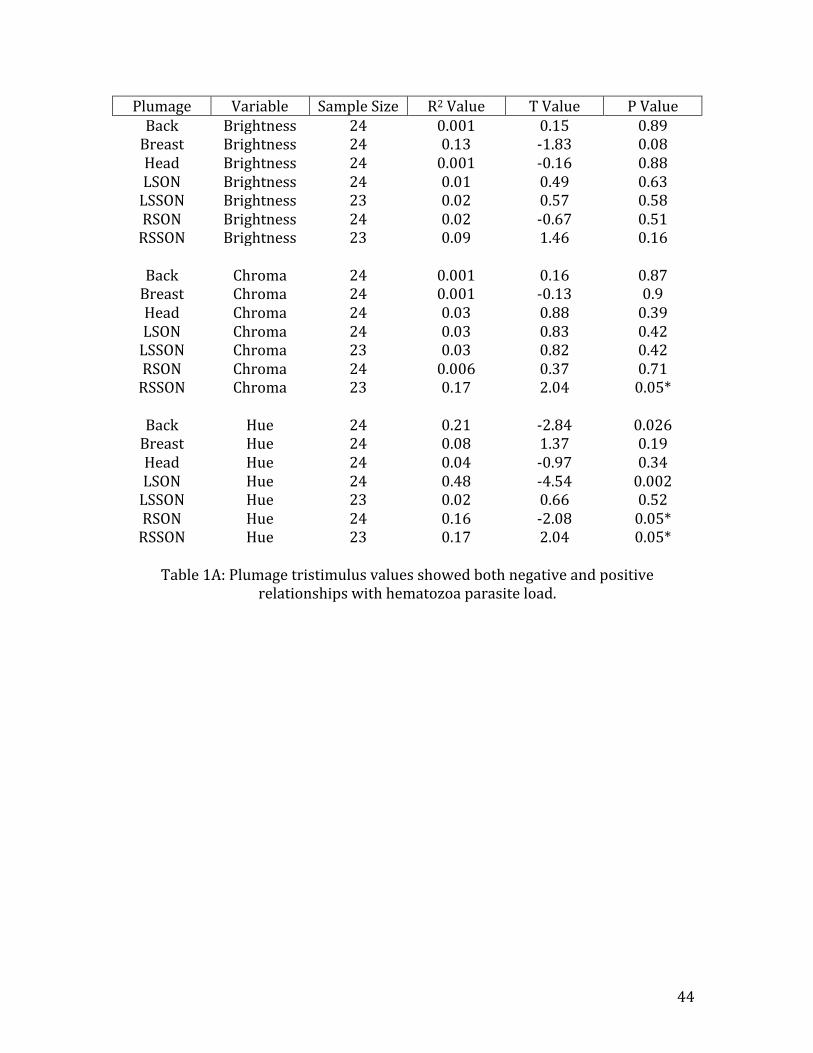
Most of the variation in tristimulus values of the seven feather types was
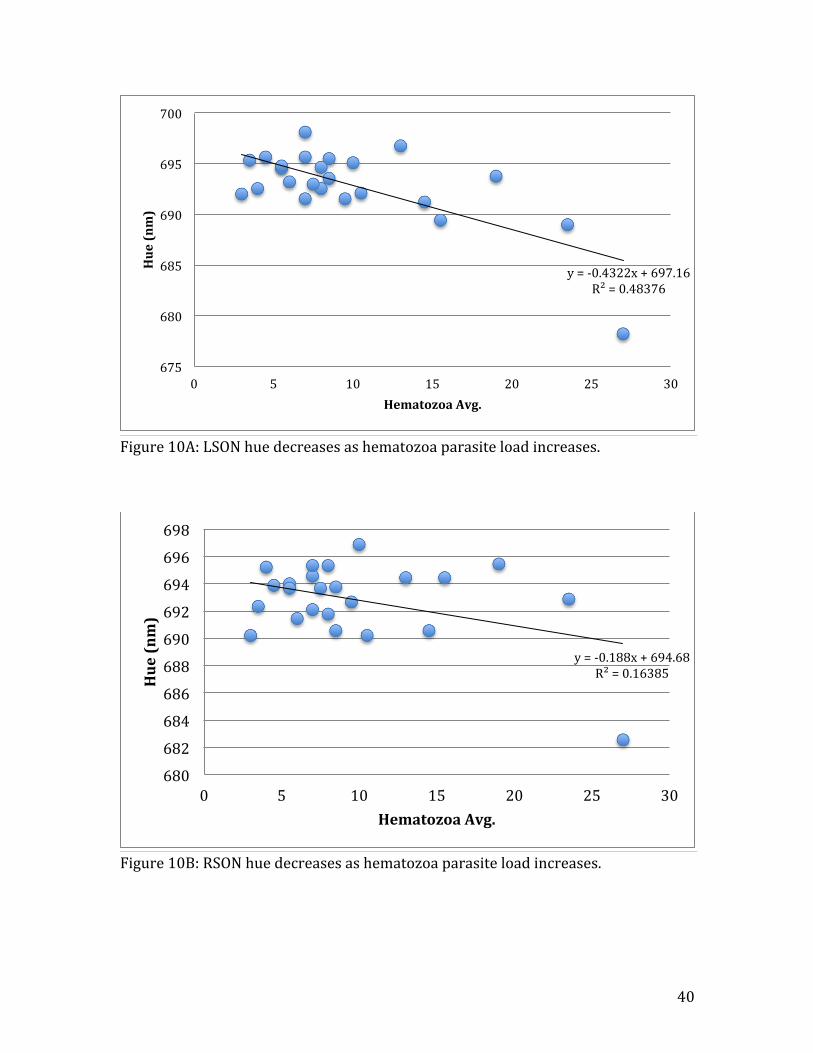
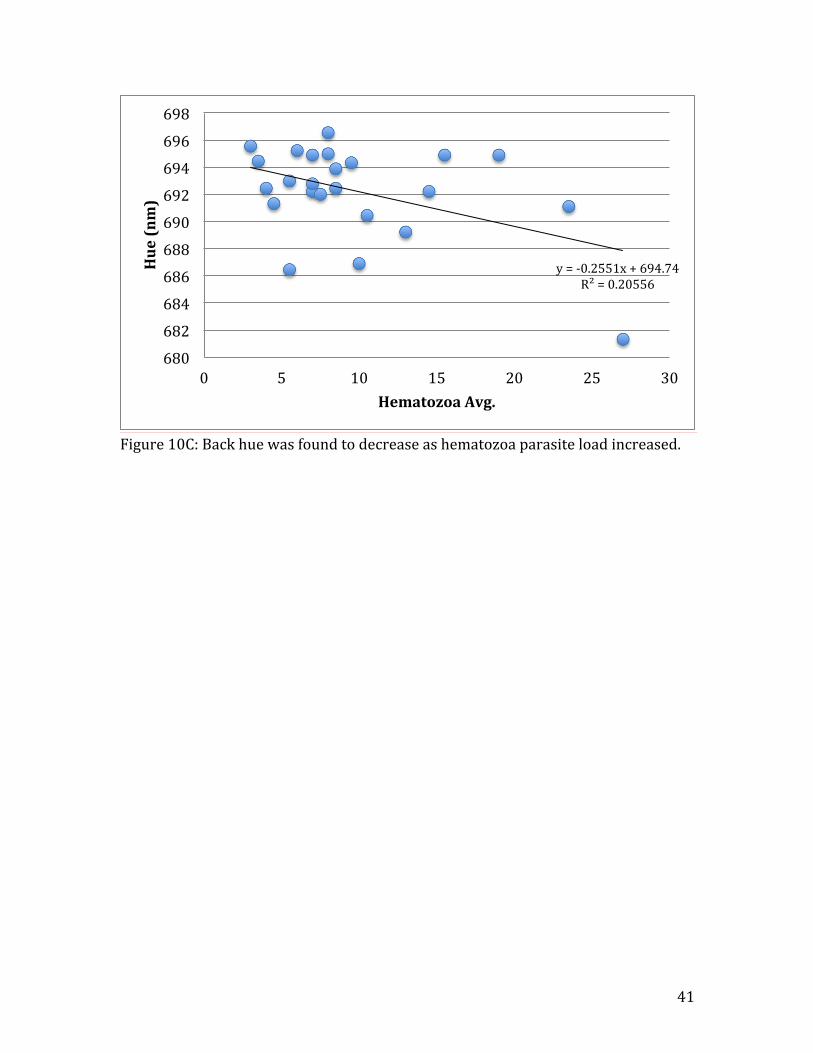
unrelated to hematozoa infection (Table 1A). Plumage hue, however, was negatively
affected by hematozoa, in three of the feather types: LSON (R2=0.48, n=24, t=-‐4.54,
p=0.002) (Fig. 10A), RSON (R2=0.16, n=24, t=-‐2.08, p=0.05) (Fig.10B), and BACK
(R2=0.21, n=24, t=-‐2.84, p=0.03) (Fig. 10C). Breast plumage brightness showed
evidence of an decrease as the number of hematozoa in the host increased (R2=0.13,
n=24, t=-‐1.83, p=0.08)(Fig. 8), but this effect was not significant. Feather color
chroma for the RSSON feathers, on the other hand, showed a weak, positive effect of
blood parasite burden (R2=0.17, n=24, t=2.04, p=0.05) (Fig. 9).
10
20
30
40
50
60
70
80
90
15 30 45 60
% ReNlectance (Arb. Units)
Degrees from Normal
Back
Breast
Head
SSON
39
Figure 8: Breast plumage brightness was found to decrease as hematozoa parasite load increased.
Figure 9: RSSON plumage chroma was shown to increase as hematozoa average increased.
y = -‐0.5487x + 68.226 R² = 0.13162
30
40
50
60
70
80
90
2 7 12 17 22 27 32
% ReNlectance (Arb. Units)
Hematozoa Avg.
y = 0.001x + 0.1492 R² = 0.16533
0 0.02 0.04 0.06 0.08 0.1 0.12 0.14 0.16 0.18 0.2
0 5 10 15 20 25 30
Chroma
Hematozoa Avg.
40
Figure 10A: LSON hue decreases as hematozoa parasite load increases.
Figure 10B: RSON hue decreases as hematozoa parasite load increases.
y = -‐0.4322x + 697.16 R² = 0.48376
675
680
685
690
695
700
0 5 10 15 20 25 30
Hue (nm)
Hematozoa Avg.
y = -‐0.188x + 694.68 R² = 0.16385
680
682
684
686
688
690
692
694
696
698
0 5 10 15 20 25 30
Hue (nm)
Hematozoa Avg.
41
Figure 10C: Back hue was found to decrease as hematozoa parasite load increased.
y = -‐0.2551x + 694.74 R² = 0.20556
680
682
684
686
688
690
692
694
696
698
0 5 10 15 20 25 30
Hue (nm)
Hematozoa Avg.
42
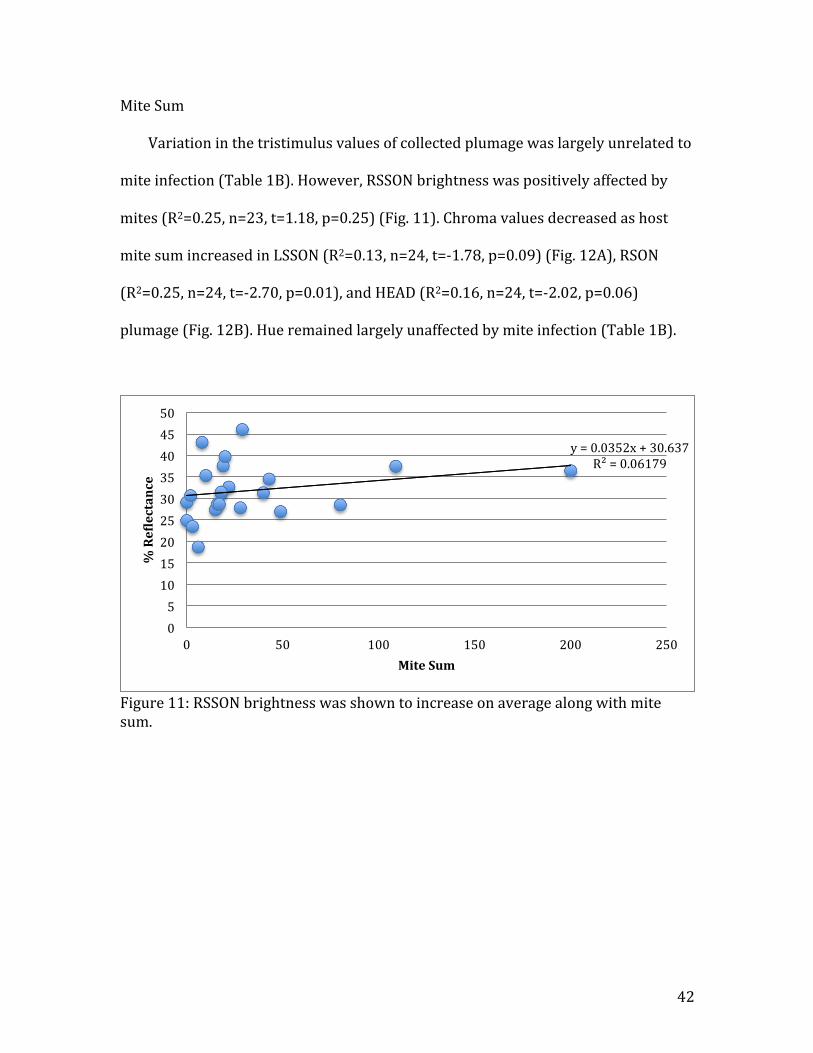
Mite Sum Variation in the tristimulus values of collected plumage was largely unrelated to
mite infection (Table 1B). However, RSSON brightness was positively affected by
mites (R2=0.25, n=23, t=1.18, p=0.25) (Fig. 11). Chroma values decreased as host
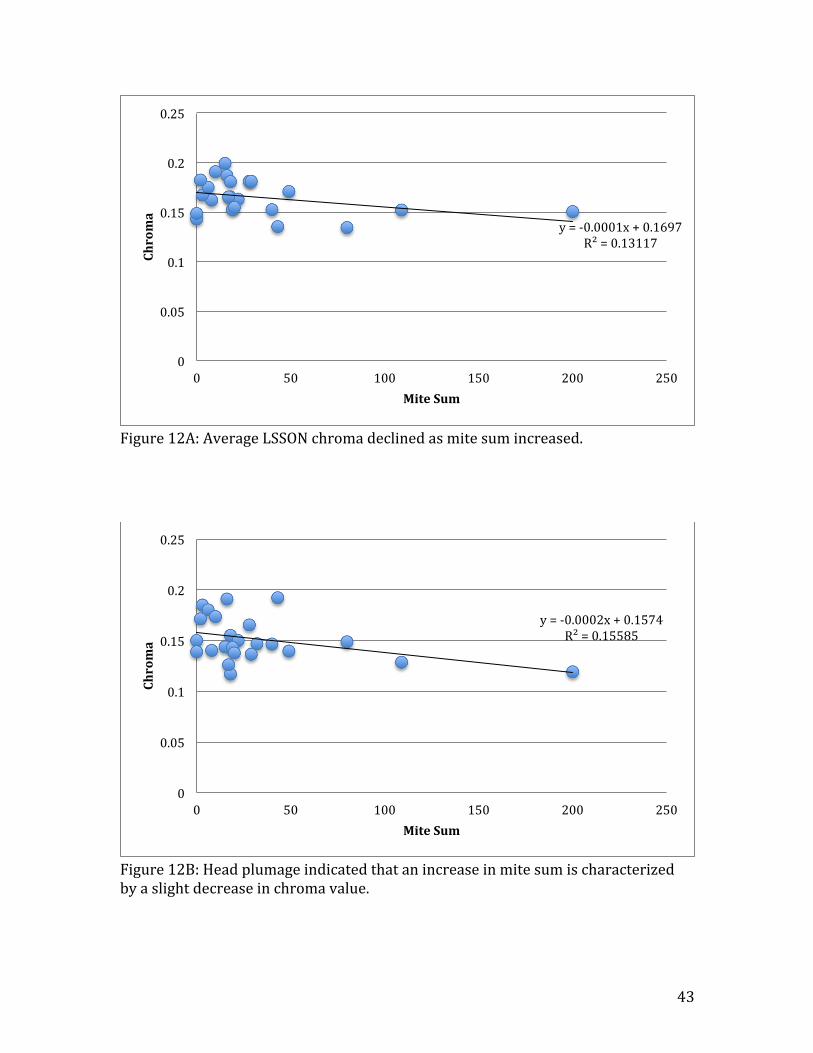
mite sum increased in LSSON (R2=0.13, n=24, t=-‐1.78, p=0.09) (Fig. 12A), RSON
(R2=0.25, n=24, t=-‐2.70, p=0.01), and HEAD (R2=0.16, n=24, t=-‐2.02, p=0.06)
plumage (Fig. 12B). Hue remained largely unaffected by mite infection (Table 1B).
Figure 11: RSSON brightness was shown to increase on average along with mite sum.
y = 0.0352x + 30.637 R² = 0.06179
0 5 10 15 20 25 30 35 40 45 50
0 50 100 150 200 250
% ReNlectance
Mite Sum
43
Figure 12A: Average LSSON chroma declined as mite sum increased.
Figure 12B: Head plumage indicated that an increase in mite sum is characterized by a slight decrease in chroma value.
y = -‐0.0001x + 0.1697 R² = 0.13117
0
0.05
0.1
0.15
0.2
0.25
0 50 100 150 200 250
Chroma
Mite Sum
y = -‐0.0002x + 0.1574 R² = 0.15585
0
0.05
0.1
0.15
0.2
0.25
0 50 100 150 200 250
Chroma
Mite Sum
44
Plumage Variable Sample Size R2 Value T Value P Value Back Brightness 24 0.001 0.15 0.89 Breast Brightness 24 0.13 -‐1.83 0.08 Head Brightness 24 0.001 -‐0.16 0.88 LSON Brightness 24 0.01 0.49 0.63 LSSON Brightness 23 0.02 0.57 0.58 RSON Brightness 24 0.02 -‐0.67 0.51 RSSON Brightness 23 0.09 1.46 0.16
Back
Chroma
24
0.001
0.16
0.87
Breast Chroma 24 0.001 -‐0.13 0.9 Head Chroma 24 0.03 0.88 0.39 LSON Chroma 24 0.03 0.83 0.42 LSSON Chroma 23 0.03 0.82 0.42 RSON Chroma 24 0.006 0.37 0.71 RSSON Chroma 23 0.17 2.04 0.05*
Back
Hue
24
0.21
-‐2.84
0.026
Breast Hue 24 0.08 1.37 0.19 Head Hue 24 0.04 -‐0.97 0.34 LSON Hue 24 0.48 -‐4.54 0.002 LSSON Hue 23 0.02 0.66 0.52 RSON Hue 24 0.16 -‐2.08 0.05* RSSON Hue 23 0.17 2.04 0.05*
Table 1A: Plumage tristimulus values showed both negative and positive
relationships with hematozoa parasite load.
45
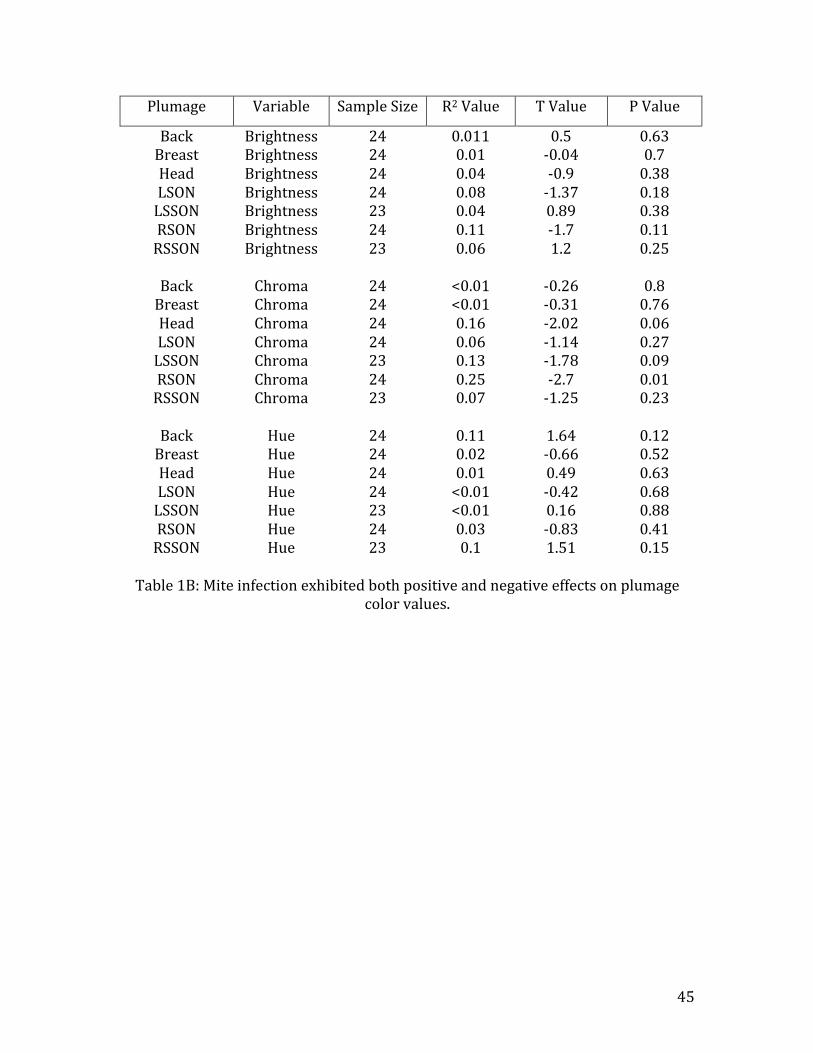
Plumage Variable Sample Size R2 Value T Value P Value
Back Brightness 24 0.011 0.5 0.63 Breast Brightness 24 0.01 -‐0.04 0.7 Head Brightness 24 0.04 -‐0.9 0.38 LSON Brightness 24 0.08 -‐1.37 0.18 LSSON Brightness 23 0.04 0.89 0.38 RSON Brightness 24 0.11 -‐1.7 0.11 RSSON Brightness 23 0.06 1.2 0.25
Back
Chroma
24
<0.01
-‐0.26
0.8
Breast Chroma 24 <0.01 -‐0.31 0.76 Head Chroma 24 0.16 -‐2.02 0.06 LSON Chroma 24 0.06 -‐1.14 0.27 LSSON Chroma 23 0.13 -‐1.78 0.09 RSON Chroma 24 0.25 -‐2.7 0.01 RSSON Chroma 23 0.07 -‐1.25 0.23
Back
Hue
24
0.11
1.64
0.12
Breast Hue 24 0.02 -‐0.66 0.52 Head Hue 24 0.01 0.49 0.63 LSON Hue 24 <0.01 -‐0.42 0.68 LSSON Hue 23 <0.01 0.16 0.88 RSON Hue 24 0.03 -‐0.83 0.41 RSSON Hue 23 0.1 1.51 0.15
Table 1B: Mite infection exhibited both positive and negative effects on plumage
color values.
46
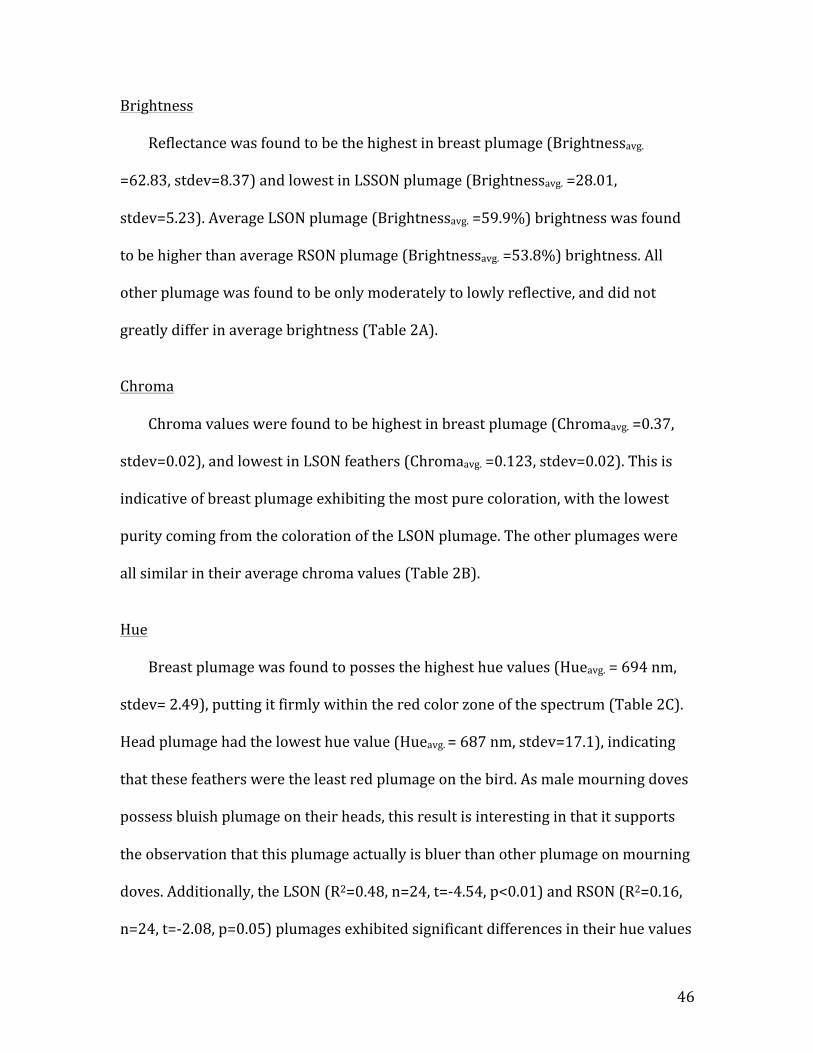
Brightness Reflectance was found to be the highest in breast plumage (Brightnessavg.
=62.83, stdev=8.37) and lowest in LSSON plumage (Brightnessavg. =28.01,
stdev=5.23). Average LSON plumage (Brightnessavg. =59.9%) brightness was found
to be higher than average RSON plumage (Brightnessavg. =53.8%) brightness. All
other plumage was found to be only moderately to lowly reflective, and did not
greatly differ in average brightness (Table 2A).
Chroma Chroma values were found to be highest in breast plumage (Chromaavg. =0.37,
stdev=0.02), and lowest in LSON feathers (Chromaavg. =0.123, stdev=0.02). This is
indicative of breast plumage exhibiting the most pure coloration, with the lowest
purity coming from the coloration of the LSON plumage. The other plumages were
all similar in their average chroma values (Table 2B).
Hue Breast plumage was found to posses the highest hue values (Hueavg. = 694 nm,
stdev= 2.49), putting it firmly within the red color zone of the spectrum (Table 2C).
Head plumage had the lowest hue value (Hueavg. = 687 nm, stdev=17.1), indicating
that these feathers were the least red plumage on the bird. As male mourning doves
possess bluish plumage on their heads, this result is interesting in that it supports
the observation that this plumage actually is bluer than other plumage on mourning
doves. Additionally, the LSON (R2=0.48, n=24, t=-‐4.54, p<0.01) and RSON (R2=0.16,
n=24, t=-‐2.08, p=0.05) plumages exhibited significant differences in their hue values
47
with respect to parasite load, indicating a potential asymmetric effect of
intracellular parasites on plumage hue.
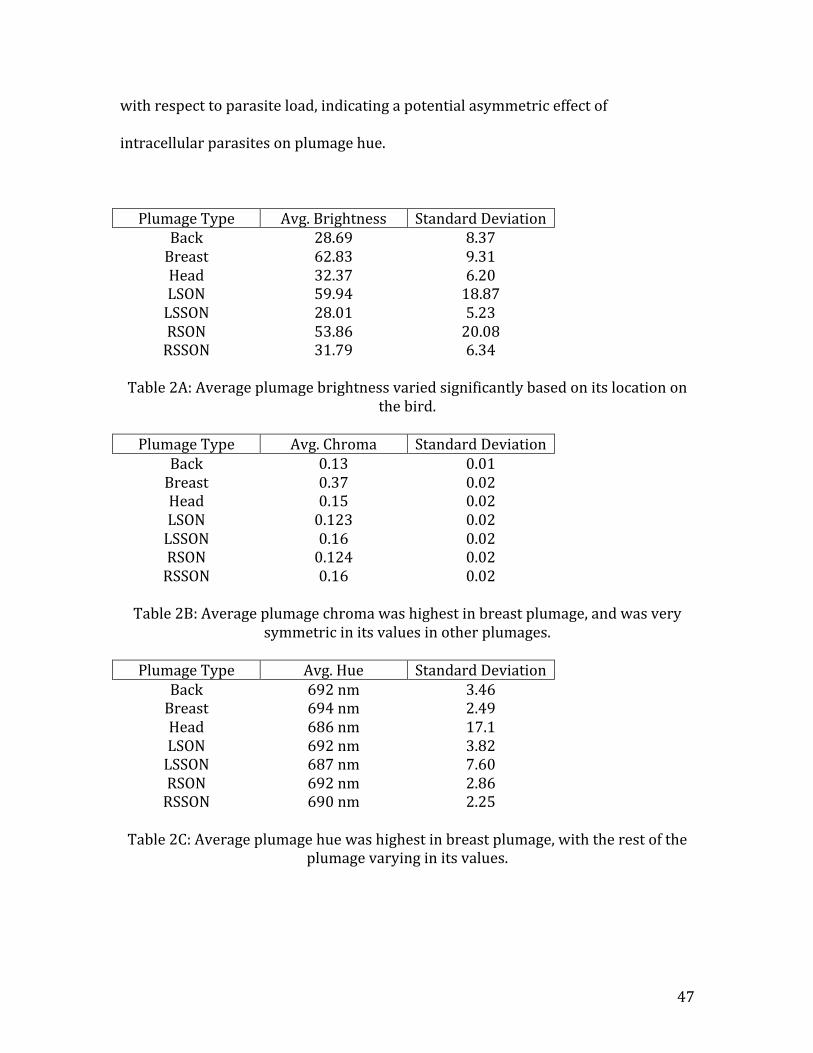
Plumage Type Avg. Brightness Standard Deviation Back 28.69 8.37 Breast 62.83 9.31 Head 32.37 6.20 LSON 59.94 18.87 LSSON 28.01 5.23 RSON 53.86 20.08 RSSON 31.79 6.34
Table 2A: Average plumage brightness varied significantly based on its location on
the bird.
Plumage Type Avg. Chroma Standard Deviation Back 0.13 0.01 Breast 0.37 0.02 Head 0.15 0.02 LSON 0.123 0.02 LSSON 0.16 0.02 RSON 0.124 0.02 RSSON 0.16 0.02
Table 2B: Average plumage chroma was highest in breast plumage, and was very
symmetric in its values in other plumages.
Plumage Type Avg. Hue Standard Deviation Back 692 nm 3.46 Breast 694 nm 2.49 Head 686 nm 17.1 LSON 692 nm 3.82 LSSON 687 nm 7.60 RSON 692 nm 2.86 RSSON 690 nm 2.25
Table 2C: Average plumage hue was highest in breast plumage, with the rest of the
plumage varying in its values.
48
Discussion
This study found some support for the Hamilton & Zuk (1982) hypothesis of
parasite-‐mediated sexual selection. A number of the relationships between plumage
tristimulus values and Hematozoa parasite load were indicative of parasites having
a detrimental effect on the brightness, chroma, and hue on the collected plumage
(Table 1A). These negative relationships found between these variables lend
support to the hypothesis of parasite-‐mediated sexual selection with respect to
intracellular hematozoa. Plumage and mite relationships, however, were
statistically not as supportive of Hamilton & Zuk (1982), but this finding does not
constitute a rejection of this hypothesis. Plumage tristimulus values for feather
specimens showed a variety of things, but most notably, showed that not one single
color value is affected more so than another. This is interesting to consider, and each
color value will be examined on an individual basis to determine if these values
provide support to the hypothesis of parasite-‐mediated sexual selection.
According to the model of parasite-‐mediated sexual selection put forth in
Hamilton & Zuk (1982), brightly colored plumage evolved in male birds as a signal
of an individual’s genetically conferrable resistance to parasites. Though Hamilton &
Zuk never specified what they considered “bright” to be, it follows that their model
would predict a negative correlation between plumage brightness and parasite load.
In my research, three negative relationships were found between plumage
brightness and hematozoan parasite load (Table 1A). This means that as
intracellular parasite load increases, plumage brightness decreases. This begs the
question as to the mechanism by which intracellular parasites could affect
49
brightness. Plumage brightness results from light reflecting off of nanostructures on
the surface of feathers, and it can vary depending on these structures. Most often,
this is the result of variation in the structure of a feather, particularly within the
nanostructures that are found on the surface of barbules (Edler et al., 2010). The
causes of these variations, particularly when it comes to intracellular parasites,
comes down to energy requirements involved in color generation compared to that
of an immune response. Hematozoans can negatively affect an avian host by eliciting
an energy consuming immune reaction in response to an infection, particularly if the
infection is chronic in duration. The energy lost to generating an immune response
over the long run could be key to the process of building feathers and depositing the
array-‐like nanostructures on the surfaces of the barbules necessary for the
generation of structural color (Hill et al., 2005), and thus brightness. This has been
shown in male red bishops (Euplectes orix), in which male plumage brightness
exhibited a negative relationship between blood parasite load and plumage
brightness, which subsequently was attributed to detrimental effects of blood
parasites on their hosts through a trade off of energy between plumage
ornamentation and immune response (Edler et al., 2010). In addition to brightness,
the generation of structural color is also subject to the effects of parasitic infection.
Additionally, Zirpoli et al. (2013) found that Stellar’s jays (Cyanocitta stelleri)
exhibited a condition dependent relationship with respect to parasites in the
generation of structurally colored plumage. What this means is that structural
coloration likely is subject to the effects of parasitism, either directly, through a
competition with the parasite for the nutrients necessary to generate structural
50
color, or indirectly through a tradeoff of energy for plumage generation and immune
action (Hill et al., 2005). Such a tradeoff lends support to the hypothesis of parasite-‐
mediated sexual selection, as it is a platform for mate choice to occur on since
brightness is likely indicative of the body condition of the male. As an honest signal
of condition, this would affects male fitness if females choose the brightest males as
mates, thereby strengthening the selection of this trait with each generation.
Besides brightness, it is also important to consider the chroma of avian plumage
as a contributor to the process of parasite-‐mediated sexual selection. Chroma refers
to the spectral purity of a perceived color. Again, the Hamilton & Zuk (1982)
hypothesis is to be considered, and it would likely predict that males with higher
chroma values for their colored plumage would also have a lesser parasite burden.
This prediction would take into account the fact that it takes more pigment
deposited within the plumage to have a larger chroma value. A recent study by
Remeš et al. (2013) illustrated that the chroma of ornamented cheek plumage in the
great tit (Parus major) was an accurate predictor of offspring survivability. From
this, it can be argued that there is a benefit to females for selecting mates with the
highest chroma value. This provides an indirect benefit to the female, and shows
that there is an incentive for females to be selective in intersexual mate choice. My
research found only one negative correlation between plumage chroma and
hematozoa (Table 1A). It is thought that variation in chroma is largely due to
variation in the concentration of carotenoid pigments within feathers (Edler et al.,
2010). Chroma could be decreased by hematozoan parasites similarly to the way
brightness could be affected, and that is through a trade off of energy between
51
immune function and plumage ornamentation (Hill, 2006). It is more likely, though,
that chroma is affected more so due to the presence of other parasites, such as
coccidia, that can directly interfere with the uptake of carotenoid pigments in the
intestines. In a study by Hill et al. (2009), it was found that American goldfinches
(Carduelis tristis) infected with a coccidian parasite grew plumage whose chroma
was reduced when compared to the chroma of their bills. This holds significant
implications for males with a high coccidian or other gut parasite load in that
females may actively select against their genotypes in mate choice. In addition to gut
parasites, the potential effects that feather mites could have also must be
considered. With regard to the effect of mites on plumage, my study found that all
plumage types exhibited negative relationships between plumage chroma and mite
sum. This is consistent with what would be predicted by Hamilton & Zuk (1982). A
result such as this points to feather mites inflicting somewhat of a detrimental effect
on plumage chroma. This points to the fact that the species of feather mites infecting
the mourning doves collected in this study may be parasitizing or otherwise
degrading feather material. A finding such as this is somewhat supported by past
research, in which it was found that the effects of feather mites were negatively
correlated with plumage dichromatism in multiple species of passerines (Figuerola,
2000). If these mites are in fact somehow reducing host fitness through a parasitic
interaction, then it follows that they would have a slight effect on sexual selection,
even though reproductive fitness may not be greatly affected. Fortunately, wing
samples that were known to contain large numbers of feather mites were archived
during this study, and could potentially be identified in future research to confirm
52
their identity, determine their effect on plumage coloration, and ultimately their
effect on parasite-‐mediated sexual selection.
In addition to brightness and chroma, hue also must be considered. Hue is
representative of the wavelength of light that has the largest contribution to the
total radiance reflected from a surface (Montgomerie, 2006, p 101). More plainly,
hue is what we define as everyday color. Like chroma, variation in hue can be
attributed to the concentration of pigments within feathers (Edler et al., 2010). Hue
proves to be interesting when applying it to the hypothesis of parasite-‐mediated
sexual selection. As feathers can possess multiple colors, it follows that the Hamilton
& Zuk (1982) would predict a negative relationship between an optimal, or mean
plumage hue and parasite load, specific to the hue of each type of plumage. My study
found four negative correlations between plumage hue and hematozoan parasite
load (Table 1A). These four correlations coincide with the predictions of Hamilton &
Zuk (1982), which provides support for the hypothesis of parasite-‐mediated sexual
selection. Again, this negative relationship could result from either an energetic
tradeoff between the host’s immune response and possessing bright plumage. The
three instances in which a positive correlation existed between hematozoa and hue
warrant an explanation other than a negative effect by a parasite on the host. One
such explanation could be the age or nutritional condition of the bird, and will be
discussed further within the next section. Again, however, reductions in hue with
respect to endoparasites is more than likely attributable to gut parasitism, and the
Hill et al. (2009) study supports this. Their study found that hue was affected
negatively when the effects of coccidian infection were allowed to continue.
53
Something similar may be occurring with mourning doves, which possess feathers
with very high average hue values (Table 2C). If hue is directly correlated with
intracellular parasites, then a reduction in the mean hue value of an individual could
result in a decrease in fitness because choosy females may choose individuals with
higher average hue values. This would seem to support Hamilton & Zuk’s
hypothesis. In addition to this, gut parasites also are known to play a role in the
reduction of plumage hue. One study by Hill found that hue of breast feathers in
American goldfinches (Carduelis tristis) was reduced in unmedicated coccidian
infections (Hill et al., 2009). A more recent study provided support to this, and found
that the hue of plumage from greenfinches (Carduelis chloris) experimentally
infected with coccidia was less than that of birds medicated against gut parasites
(Hõrak et al., 2013). Results such as these clearly indicate that gut parasites can
negatively affect the hue of plumage, and can be considered as a partial explanation
for the decrease in hue that remains unexplained by hematozoa. The effects of mites
on hue indicated four negative correlations between hue and mite sum. This concurs
with the prediction of the Hamilton & Zuk (1982) hypothesis in that mites appear to
have a negative impact on the hue of their host’s plumage. This finding lends further
support to the idea that mites may influence intersexual choice in sexual selection in
birds.
With variation in mourning dove plumage coloration left to account for, it is
necessary that factors other than parasite load be considered. One of these factors is
the nutritional condition of the bird. As previously stated, carotenoids must be
obtained through the diet of a bird. It follows that a diet low in carotenoids, or lack
54
of nutrition entirely, could be responsible for a decrease in plumage brightness or
color. One study found that diets experimentally devoid of carotenoid pigments
resulted in male house finches (Carpodacus mexicanus) developing less brightly
colored plumage after molting (Hill, 2000). A result such as this seems to indicate
that nutrition plays a large role in the determination of plumage coloration.
Interestingly, this conveyed ability to obtain nutrition may play a large role in the
process of sexual selection as a whole. If there is a significant relationship between
plumage coloration and the ability to find high-‐quality sources of food, then it could
be argued that females are making their choice not on the parasite load of a
potential mate, but the male’s ability to obtain energy and pigment rich food for the
female and their offspring. This increases not only the fitness of the parents, but of
the offspring as well. My study was unable to take into account the nutritional
condition of the dove specimens. This could be potentially remedied in the future
through the establishment of multiple feeding plots with varying amounts of food
set out for the doves. Another potential source of variation in plumage coloration is
the age of the individual. Observational studies have shown that, in birds, the
plumage of fledglings and young individuals is not as bright or colorful as that of
older adults. One example of this is mourning doves. Young individuals do not
possess obvious structural coloration in their plumage, and their contour feathers
appear scaly and light brown (Wildlife Management Institute, 2005). This coincides
with an immature individual’s inability to mate, or would make them less attractive
to potential mates were they able to reproduce. From this, it follows that older,
brightly colored individuals may have a greater reproductive success rate than
55
younger individuals. In fact, research has shown that this does occur. A study by
Delhey et al. (2006) revealed that older individual blue tits plumage was brighter,
more chromatic, and more UV reflective than that of younger individuals. Results
such as this serve to further the point that plumage coloration may be highly
dependent upon age, and unfortunately, because the specimens for my research
were not captive doves, I was unable to accurately determine the age, beyond
making a distinction between juveniles and adults, of individuals used in this
project. The result of this is an inability to accurately assess the effects of age on
variations in plumage coloration in this study.
56
Conclusion
In conclusion, the results of this research provide support, although some of
which can be considered statistically non-‐significant, for the Hamilton & Zuk (1982)
hypothesis of parasite-‐mediated sexual selection. Intracellular hematozoan
parasites were found to have more statistically significant effects on plumage color
values than were mites, which potentially could be attributed to mites having a less
direct effect on host fitness than intracellular hematozoan parasites. In instances
where results did not provide support for the Hamilton & Zuk hypothesis, alternate
sources of variation in plumage, including gut parasites, age, and nutritional
condition are likely sources of this variance. The male testis mass and
tarsometatarsal length predictions for my hypothesis were not met. The brightness
prediction had limited statistical support, namely from intracellular parasites.
Therefore, it can be concluded that my original hypothesis cannot be fully
confirmed, and my null hypothesis cannot be fully rejected.
57
References Andersson, M. B. (1994). Sexual Selection. Princeton University Press, Princeton. Basket, Thomas S. (1993). Ecology and management of the mourning dove. Stackpole Books, Mechanicsburg. Google Books. Web. 207-‐214. 04 Feb. 2014. Campbell, Terry W. (1995). Avian Hematology and Cytology (2nd ed.). Iowa State University Press. Ames. Clayton, D.H., & Drown, D.M. (2001). Critical evaluation of five methods for quantifying chewing lice (Insecta: Phthiraptera). Journal of Parasitology, 87: 1291-‐1300. Cuthill, I.C. (2006). Bird Coloration, Volume 1: mechanisms and measurement. Cambridge: Harvard University Press. Darwin, C. (1859). On the origin of species by means of natural selection. New York: New York University Press. Dearborn, D.C., & Ryan, M.J. (2002). A test of the Darwin-‐Fisher theory for the evolution of male secondary sexual traits in monogamous birds. Journal of Evolutionary Biology, 15: 307-‐313. Delhey, K, Peters, A., Johnson, A., & Kempenaers, B. (2006). Fertilization success and UV ornamentation in blue tits(Cyanistes caeruleus) correlational and experimental evidence. Journal of Behavioral Ecology, 18: 399-‐409. Dunn, J.C., Goodman, S.J., Benton, T.G, & Hamer, K.C. (2013). Avian blood parasite infection during the non-‐breeding season: an overlooked issue in declining populations?. BMC Ecology, 13: 01-‐09. Edler, A.U., & Friedl, T.W.P. (2010). Individual quality and carotenioid-‐based plumage ornaments in male red bishops (Euplectes orix): plumage is not all that counts. Biological Journal of the Linnean Society, 99: 384-‐397. Figuerola, J. (2000). Ecological correlates of feather mite prevalence in passerines. Journal of Avian Biology, 31: 489-‐494. Futuyma, D.J. (2009). Evolution: Second Edition. Sunderland, MA, USA: Sinauer Associates, inc. Gillespie, Megan J., Stanley, Dragana, Chen, Honglei, Donald, John A., Nicholas, Kevin R., Moore, Robert J., Crowley, Tamsyn M., & Salmon, Henri (2012). Functional similarities between pigeon ‘milk’ and mammalian milk: Induction of immune gene expression and modification of the microbiota. Plos ONE, 07: 1-‐10.
58
Griffith, S.C., & Pryke, S.R. (2006). Bird Coloration, Vol. 01: Mechanics and Measurements. Cambridge: Harvard University Press. Hamilton, W.D., & Zuk, M. (1982) Heritable true fitness and bright birds: a role for parasites?. Science, 218: 384-‐387. Hill, G.E. (2000). Energetic constraints on expression of carotenoid based-‐plumage coloration. Journal of Avian Biology, 31: 559-‐566. Hill, G.E., (2006) Bird Coloration, Vol. 01: Mechanisms and Measurements. Cambridge: Harvard University Press. Hill, G.E., Doucet, S.M, & Buchholz, R. (2005). The effect of coccidial infection on iridescent plumage coloration in wild turkeys. Animal Behaviour, 69: 387-‐394. Hill, G.E., Hood, W.R., & Huggins, K. (2009). A multifactorial test of the effects of carotenoid access, food intake and parasite load on the production of ornamental feathers and bill coloration in American goldfinches. Journal of Experimental Biology, 212: 1225-‐1233. Hõrak, P., Saks, L., Karu, U., Ots, I., Surai, P.F., & McGraw K.J. (2004). How coccidian parasites health and appearance of greenfinches. Journal of Animal Ecology, 73: 935-‐947. Janecek, Martin (2012). Reflectivity Spectra for Commonly Used Reflectors. IEEE Transactions on Nuclear Science, 59: 490-‐497. Kawamura, S., Blow, N.S., & Yokoyama, S. (1999). Genetic analysis of visual pigments of the pigeon (Columba livia). Genetics, 153: 1839-‐1850. Kirkpatrick, M., Price, T., & Arnold, S.J. (1990). The Darwin-‐Fisher theory of sexual selection in monogamous birds. Evolution, 44: 180-‐193. Kokko, H., Brooks, R., Jennions, M.D., & Morley, J. (2002). The evolution of mate choice and mating bias. Proceedings for the Royal Society B, 270: 653-‐664. Mahler, B., Araujo, L.S., & Tubaro, P.L. (2003). Dietary and sexual correlates of carotenoid pigment expression in dove plumage. The Condor, 105: 258-‐267. Maia, R. O Caento, J.V., Báo, S.N., & Macedo, R.H. (2009). Iridescent structural colour production in male blue-‐black grassquit feather barbules: the role of keratin and melanin. Journal of the Royal Society Interface, 06: S203-‐S211. McGraw, K.J., (2006) Bird coloration, Vol. 01: mechanisms and measurements. Cambridge: Harvard University Press.
59
Meadows, M.G., Morehouse, N.I., Rutowski, R.I., Douglas, J.M., & McGraw, K.J. (2010). Quantifying iridescent coloration in animals: a method for improving repeatability. Behav Ecol Sociobio, 65: 1317-‐1327. Marks, R. (2005) Mourning Dove (Zenaida macroura). Wildlife Habitat Management Institute. Fish and Wildlife Habitat Management Leaflet: No.31. 01-‐08. Miller, C.W, & Moore, A.J. (2007) A potential resolution to the lek paradox through indirect genetic effects. Proceedings of the Royal Society B, 274: 1279-‐1286. Møller, A.P. (1990) Parasites and sexual selection: current status of Hamilton and Zuk hypothesis. Journal of Evolutionary Biology, 3: 319-‐328. Montgomerie, R. (2006) Bird coloration, Vol. 01: mechanisms and measurements. Cambridge: Harvard University Press. Montgomerie, R. 2008. CLR, version 1.05. Queen’s University, Kingston, Canada. (available at http://post.queensu.ca/~mont/color/analyze.html).
Ocean Optics, Inc. SpectraSuite Spectrometer Operating Software Installation and Operating Manual. Doc. Num. 000-‐20000-‐300-‐02-‐201110. Dunedin, Fl. Osorio, D., & Ham, A.D. (2002). Spectral reflectance and directional properties of structural coloration in bird plumage. Journal of Experimental Biology, 205: 2017-‐2027. Olsen, Oliver Wilford (1974). Animal Parasites: Their lifecycles and ecology. Courier Dover Publications. Google Books. Web. 143-‐146. 04 Feb. 2014. Prum, R.O (2006). Bird Coloration, Volume 1: mechanisms and measurement. Cambridge: Harvard University Press. 303, Parker, T.H., & Ligon, J.D. (2007). Multiple aspects of condition influence a heritable sexual trait: a synthesis of the evidence for capture of genetic variance in red junglefowl. Biological Journal of the Linnean Society, 92: 651-‐660. Remeš, V., & Matysioková, B. (2013). More ornamented females produce higher quality offspring in a socially monogamous bird: an experimental study in the great tit (Parus major). Frontiers in Zoology, 10: 1-‐10. Rowe L, & Houle D. (1996). The lek paradox and the capture of genetic variance by condition dependent traits. Proceedings of the Royal Society of London Series B, 263: 1415–1421. Shamis, J.D., & Forrester, D.J. (1977). Haematazoan parasites of mourning doves in Florida. Journal of Wildlife Disease, 13: 349-‐355.
60
Shawkey, M. D., D’Alba, L., Wozny, J., Eliason, C., Koop, J. H., & Jia, L. (2010). Structural color change following hydration and dehydration of iridescent mourning dove (Zenaida macroura) feathers. Zoology, 114: 59-‐68. Shawkey, M.D., & Hill, G.E. (2006). Significance of basal melanin layer to the production of non-‐iridescent structural plumage color: evidence from an amelanotic Stellar’s Jay. Journal of Experimental Biology, 209: 1245-‐1250. Stromberg, M.R., Koenig, W.D., Walters, E.L., & Schweisinger, J. (2008). Estimate of Trichomonas gallinae-‐induced mortality in band-‐tailed pigeons, Upper Carmel Valley, California, Winter 2006-‐2007. The Wilson Journal of Ornithology, 120: 603-‐606.
Zirpoli, J.A., Black, J.M., & Gabriel, P.O. (2013). Parasites and plumage in Stellar’s jays: an experimental field test of the parasite-‐mediated handicap hypothesis. Ethology, Ecology, and Evolution, 25: 103-‐116.
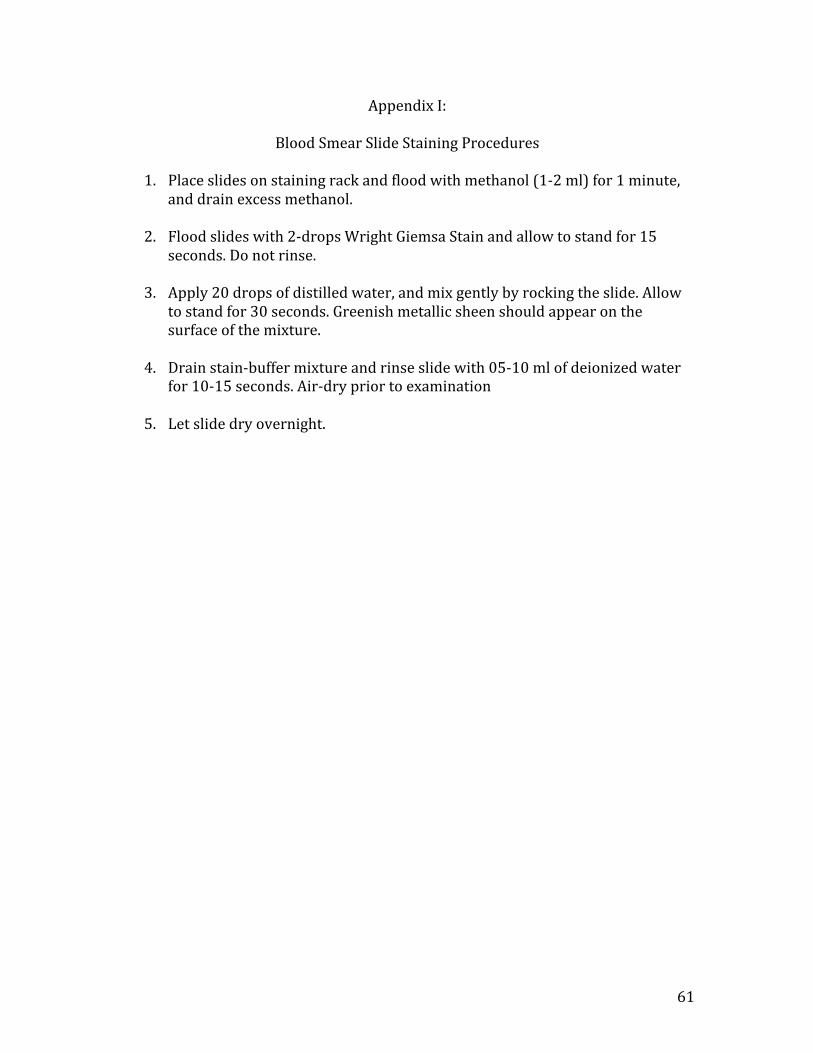
61
Appendix I:
Blood Smear Slide Staining Procedures
1. Place slides on staining rack and flood with methanol (1-‐2 ml) for 1 minute, and drain excess methanol.
2. Flood slides with 2-‐drops Wright Giemsa Stain and allow to stand for 15
seconds. Do not rinse.
3. Apply 20 drops of distilled water, and mix gently by rocking the slide. Allow to stand for 30 seconds. Greenish metallic sheen should appear on the surface of the mixture.
4. Drain stain-‐buffer mixture and rinse slide with 05-‐10 ml of deionized water
for 10-‐15 seconds. Air-‐dry prior to examination
5. Let slide dry overnight.
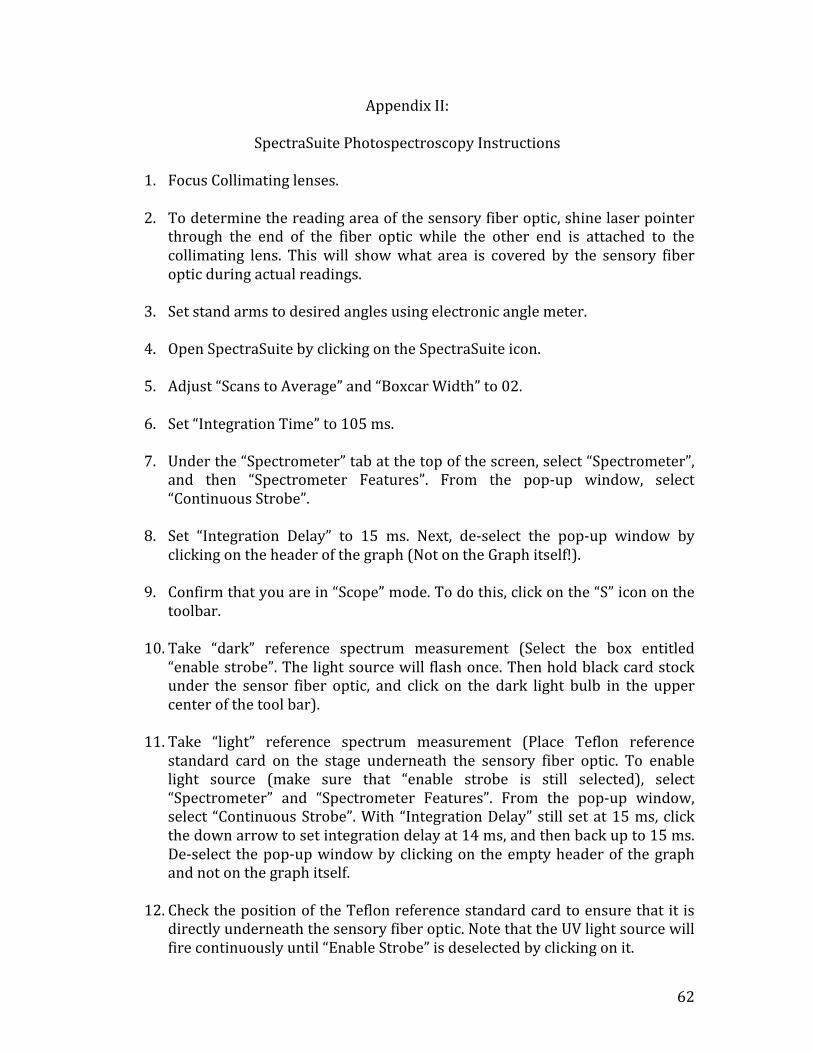
62
Appendix II:
SpectraSuite Photospectroscopy Instructions
1. Focus Collimating lenses.
2. To determine the reading area of the sensory fiber optic, shine laser pointer through the end of the fiber optic while the other end is attached to the collimating lens. This will show what area is covered by the sensory fiber optic during actual readings.
3. Set stand arms to desired angles using electronic angle meter.
4. Open SpectraSuite by clicking on the SpectraSuite icon.
5. Adjust “Scans to Average” and “Boxcar Width” to 02.
6. Set “Integration Time” to 105 ms.
7. Under the “Spectrometer” tab at the top of the screen, select “Spectrometer”,
and then “Spectrometer Features”. From the pop-‐up window, select “Continuous Strobe”.
8. Set “Integration Delay” to 15 ms. Next, de-‐select the pop-‐up window by
clicking on the header of the graph (Not on the Graph itself!).
9. Confirm that you are in “Scope” mode. To do this, click on the “S” icon on the toolbar.
10. Take “dark” reference spectrum measurement (Select the box entitled
“enable strobe”. The light source will flash once. Then hold black card stock under the sensor fiber optic, and click on the dark light bulb in the upper center of the tool bar).
11. Take “light” reference spectrum measurement (Place Teflon reference
standard card on the stage underneath the sensory fiber optic. To enable light source (make sure that “enable strobe is still selected), select “Spectrometer” and “Spectrometer Features”. From the pop-‐up window, select “Continuous Strobe”. With “Integration Delay” still set at 15 ms, click the down arrow to set integration delay at 14 ms, and then back up to 15 ms. De-‐select the pop-‐up window by clicking on the empty header of the graph and not on the graph itself.
12. Check the position of the Teflon reference standard card to ensure that it is
directly underneath the sensory fiber optic. Note that the UV light source will fire continuously until “Enable Strobe” is deselected by clicking on it.
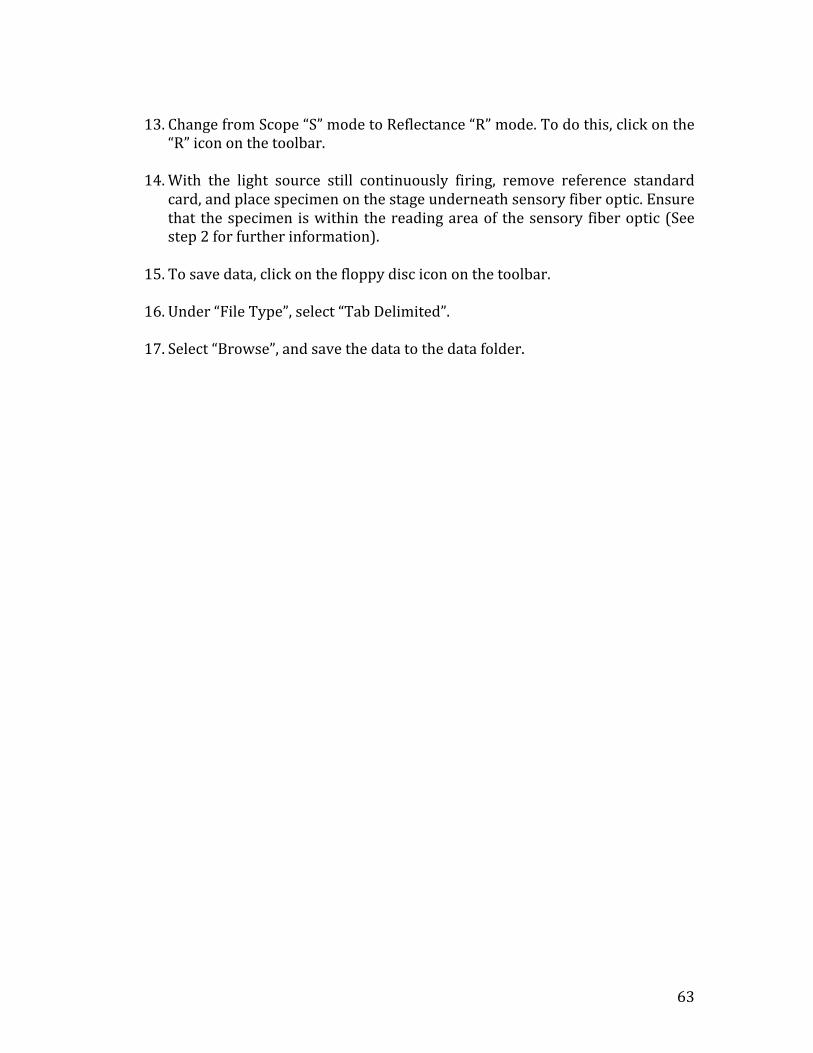
63
13. Change from Scope “S” mode to Reflectance “R” mode. To do this, click on the
“R” icon on the toolbar.
14. With the light source still continuously firing, remove reference standard card, and place specimen on the stage underneath sensory fiber optic. Ensure that the specimen is within the reading area of the sensory fiber optic (See step 2 for further information).
15. To save data, click on the floppy disc icon on the toolbar.
16. Under “File Type”, select “Tab Delimited”.
17. Select “Browse”, and save the data to the data folder.