Embed Size (px)
Citation preview

Louisiana State UniversityLSU Digital Commons
LSU Historical Dissertations and Theses Graduate School
2000
Third -Party Organization Endorsement ofProducts: an Advertising Cue Affecting ConsumerPre-Purchase Evaluation of Goods and Services.Dwane Hal DeanLouisiana State University and Agricultural & Mechanical College
Follow this and additional works at: https://digitalcommons.lsu.edu/gradschool_disstheses
This Dissertation is brought to you for free and open access by the Graduate School at LSU Digital Commons. It has been accepted for inclusion inLSU Historical Dissertations and Theses by an authorized administrator of LSU Digital Commons. For more information, please [email protected].
Recommended CitationDean, Dwane Hal, "Third -Party Organization Endorsement of Products: an Advertising Cue Affecting Consumer Pre-PurchaseEvaluation of Goods and Services." (2000). LSU Historical Dissertations and Theses. 7258.https://digitalcommons.lsu.edu/gradschool_disstheses/7258

INFORMATION TO USERS
This manuscript has been reproduced from the microfilm master. UMI films the text directly from the original or copy submitted. Thus, some thesis and dissertation copies are in typewriter face, while others may be from any type of computer printer.
The quality of this reproduction is dependent upon the quality of the copy submitted. Broken or indistinct print, colored or poor quality illustrations and photographs, print bieedthrough, substandard margins, and improper alignment can adversely affect reproduction.
In the unlikely event that the author did not send UMI a complete manuscript and there are missing pages, these will be noted. Also, if unauthorized copyright material had to be removed, a note will indicate the deletion.
Oversize materials (e.g., maps, drawings, charts) are reproduced by sectioning the original, beginning at the upper left-hand comer and continuing from left to right in equal sections with small overlaps.
Photographs included in the original manuscript have been reproduced xerographically in this copy. Higher quality 6" x 9" black and white photographic prints are available for any photographs or illustrations appearing in this copy for an additional charge. Contact UMI directly to order.
Bell & Howell Information and Learning 300 North Zeeb Road, Ann Arbor, Ml 48106-1346 USA
800-521-0600
Reproduced with permission of the copyright owner. Further reproduction prohibited without permission.

Reproduced with permission of the copyright owner. Further reproduction prohibited without permission.

THIRD-PARTY ORGANIZATION ENDORSEMENT OF PRODUCTS: AN ADVERTISING CUE AFFECTING CONSUMER PRE-PURCHASE
EVALUATION OF GOODS AND SERVICES
A Dissertation
Submitted to the Graduate Faculty of the Louisiana State University and
Agricultural and Mechanical College in partial fulfillment of the
requirements for the degree of Doctor of Philosophy
in
The Interdepartmental Program in Business Administration (Marketing)
byDwane Hal Dean
B.S., Oklahoma State University, 1974 D.D.S., University of Oklahoma, 1977
M.S., University o f Alabama at Birmingham, 1983 August, 2000
Reproduced with permission of the copyright owner. Further reproduction prohibited without permission.

UMI Number 9984325
UMI8UMI Microform9984325
Copyright 2000 by Bell & Howell Information and Learning Company. All rights reserved. This microform edition is protected against
unauthorized copying under Title 17, United States Code.
Bell & Howell Information and Learning Company 300 North Zeeb Road
P.O. Box 1346 Ann Arbor, Ml 48106-1346
Reproduced with permission of the copyright owner. Further reproduction prohibited without permission.

ACKNOWLEDGEMENTS
I would like to thank the members of my committee, Drs. Abe Biswas, Rick
Netemeyer, Bill Black, Jane Licata, Art Bedeian, and Richard Kazmierczak for their
guidance and counsel throughout this endeavor. A special thank you goes to my
chairman, Dr. Abe Biswas, for his perpetual open door and willingness to answer
questions and review drafts.
The financial support o f Louisiana State University, through the award o f a Graduate
School Fellowship to me, is gratefully acknowledged.
ii
Reproduced with permission of the copyright owner. Further reproduction prohibited without permission.

TABLE OF CONTENTS
ACKNOWLEDGEMENTS................................................................................................ii
LIST OF TABLES.............................................................................................................vii
LIST OF FIGURES.............................................................................................................ix
ABSTRACT..........................................................................................................................x
CHAPTER 1: DISSERTATION OVERVIEW................................................................. 1Introduction...............................................................................................................1Definition o f TPO Endorsement............................................................................2Research Gaps .........................................................................................................2Dissertation Objectives.......................................................................................... 4Method..................................................................................................................... 4Dissertation Contributions..................................................................................... 7
CHAPTER 2: THEORY DEVELOPMENT AND HYPOTHESES..............................8The Quality Perception Process............................................................................. 8
Definition.................................................................................................... 8Cues .............................................................................................................9TPO Endorsement as a C ue ..................................................................... 10
Formation of Quality Attribute Beliefs ............................................................. 11Types of Endorsers .............................................................................................. 12
The Endorsement Family ........................................................................ 12Functional Differences Within the Endorsement Family ..................... 14
TPO Endorsements in Advertising...................................................................... 17Form of TPO Endorsement ..................................................................... 17Fusion o f Information Sources ................................................................ 19Context ......................................................................................................19Control.......................................................................................................20Contrast Effects ....................................................................................... 20
The Role of TPO Endorsement ...........................................................................22Two Broad R o les..................................................................................... 22Role Moderators ...................................................................................... 22Endorsement Processing..........................................................................23
Endorsement Theory Development......................................................................23Source Credibility.................................................................................... 25Cognitive Response and Attribution Theory.......................................... 26Cognitive Consistency.............................................................................27Economics o f Information.......................................................................29Signal Theory ...........................................................................................30Uncertainty/Risk Reduction ....................................................................32
Reproduced with permission of the copyright owner. Further reproduction prohibited without permission.

Other Independent V ariables..............................................................................34Source Credibility................................................................................... 35Brand ........................................................................................................ 36Product..................................................................................................... 39
Hypotheses ........................................................................................................... 40
CHAPTER 3: PRETESTING AND EXPERIMENTS.................................................47Dependent Variables............................................................................................ 47Pretest O n e ............................................................................................................49
Description ...............................................................................................49Measures and Analysis ........................................................................... 51Findings and Conclusions.......................................................................51
Pretest T w o ...........................................................................................................53Description ...............................................................................................53Findings and Conclusions.......................................................................54
Pretest T h ree .........................................................................................................58Description ...............................................................................................58Findings and Conclusions.......................................................................60
Experiment O n e ................................................................................................... 62Description ...............................................................................................62Stimuli ...................................................................................................... 64Measurement Instruments.......................................................................65
Experiment Two ...................................................................................................66Description ...............................................................................................66
CHAPTER FOUR: RESULTS AND HYPOTHESES TESTING.............................. 67Experiment One.....................................................................................................67
Sample Size and Endorsement Manipulation Check............................ 67Brand Image Manipulation Check.......................................................... 67Credibility Manipulation Check............................................................. 68Preliminary Analysis................................................................................69Scales......................................................................................................... 69Preparation for MANOVA......................................................................71MANOVAs................................................................................................74MANOVA for the Product Set of Variables...........................................74MANOVA for the Advertisement Set of Variables.............................. 76Covariates in MANOVA......................................................................... 78Cell Means and Group Comparisons...................................................... 81Test o f Hypothesis H I ...............................................................................81Test o f Hypothesis H 2a............................................................................ 85Test o f Hypothesis H 2b............................................................................ 85Test o f Hypothesis H 2c ............................................................................ 86Test o f Hypothesis H 3...............................................................................87Test o f Hypothesis H 4 ...............................................................................88
iv
Reproduced with permission of the copyright owner. Further reproduction prohibited without permission.

Test o f Hypothesis H 5............................................................................... 89Test o f Hypothesis H 6............................................................................... 91
Experiment Tw o......................................................................................................94Sample Size and Endorsement Manipulation Check.............................. 94Brand Image Manipulation Check............................................................ 94Credibility Manipulation Check............................................................... 95Preliminary Analysis................................................................................. 96Scales........................................................................................................... 96Preparation for MANOVA........................................................................97MANOVAs................................................................................................. 99MANOVA for the Product Set o f Variables...........................................99MANOVA for the Advertisement Set o f Variables..............................101Covariates in MANOVA......................................................................... 103Cell Means and Group Comparisons......................................................107Test o f Hypothesis H I ............................................................................. 107Test o f Hypothesis H 2a........................................................................... 109Test o f Hypothesis H2b........................................................................... 110Test o f Hypothesis H 2c........................................................................... I l lTest o f Hypothesis H 3 ............................................................................. 113Test o f Hypothesis H 4............................................................................. 114Test o f Hypothesis H 5............................................................................. 114Test o f Hypothesis H 6............................................................................. 115
CHAPTER FIVE: DISCUSSION...................................................................................117Experiment One.....................................................................................................117
The Endorsement Factor.......................................................................... 117The Brand Factor......................................................................................120The Credibility Factor............................................................................. 122
Experiment Tw o....................................................................................................123The Endorsement Factor.......................................................................... 124The Brand Factor......................................................................................125The Credibility Factor............................................................................. 127
Comparison o f the Two Experiments..................................................................128The Product Factor...................................................................................128Endorsement and the Other Factors........................................................ 130
Comparison to Past TPO Endorsement Research.............................................. 132Limitations..............................................................................................................133Managerial Implications.......................................................................................134Future Directions for Research............................................................................ 135Summary.................................................................................................................137
BIBLIOGRAPHY ............................................................................................................ 138
APPENDIX A: PRETEST ONE QUESTIONNAIRE .................................................144
v
Reproduced with permission of the copyright owner. Further reproduction prohibited without permission.

APPENDIX B: PRETEST TWO QUESTIONNAIRE ...............................................147
APPENDIX C: PRETEST THREE QUESTIONNAIRE............................................153
APPENDIX D: EXPERIMENT ONE ADVERTISING STIM ULI..........................157
APPENDIX E: EXPERIEMENT ONE QUESTIONNAIRE..................................... 168
APPENDIX F: EXPERIMENT TWO ADVERTISING STIMULI...........................176
APPENDIX G: EXPERIMENT TWO QUESTIONNAIRE....................................... 187
VITA.................................................................................................................................. 195
vi
Reproduced with permission of the copyright owner. Further reproduction prohibited without permission.
LIST OF TABLES
3.1 RESPONSE TO PRODUCTS, PRETEST ONE(n = 33 LISTWISE)................................................................................................... 52
3.2 RESPONSE TO BRANDS, PRETEST TWO(n = 43 LISTWISE).................................................................................................. 56
3.3 RESPONSE TO CREDIBILITY OPERATIONALIZATION,PRETEST TWO (n = 43 LISTWISE).....................................................................58
3.4 RESPONSE TO TPO NAMES, PRETEST TWO(n = 43 LISTWISE).................................................................................................. 59
3.5 RESPONSE TO CELEBRITIES, PRETEST THREE(n = 42 LISTWISE)..................................................................................................61
4.1 MEASUREMENT SCALES: EXPERIMENT O N E............................................72
4.2 CORRELATION AMONG DEPENDENT VARIABLES:EXPERIMENT ONE................................................................................................73
4.3 RESULTS OF MANOVA, PRODUCT SET OF VARIABLES,EXPERIMENT ONE, n = 181................................................................................77
4.4 RESULTS OF MANOVA,ADVERTISEMENT SET OFVARIABLES, EXPERIMENT ONE, n = 181.......................................................79
4.5 RESULTS OF MANOVA, PRODUCT SET OF VARIABLES, WITHOPSEEK AS COVARIATE, EXPERIMENT ONE, n = 181.............................. 80
4.6 CELL MEANS, STANDARD DEVIATIONS, ANDUNIVARIATE CONTRASTS: EXPERIMENT ONE..........................................82
4.7 FACTOR-LEVEL GROUP COMPARISONS FOR CREDIBILITY,EXPERIMENT ONE................................................................................................83
4.8 FACTOR-LEVEL GROUP COMPARISONS FOR BRAND,EXPERIMENT ONE................................................................................................83
4.9 FACTOR-LEVEL GROUP COMPARISONS FORENDORSEMENT, EXPERIMENT ONE.............................................................. 84
4.10 TEST OF HYPOTHESIS 1: EXPERIMENT O N E ............................................. 86
vii
Reproduced with permission of the copyright owner. Further reproduction prohibited without permission.

4.11 TEST OF HYPOTHESES 2A AND 2B, EXPERIMENT O N E ........................ 87
4.12 TEST OF HYPOTHESIS 2C: EXPERIMENT ONE.......................................... 88
4.13 TEST OF HYPOTHESIS 3: EXPERIMENT O N E............................................ 89
4.14 TEST OF HYPOTHESIS 4: EXPERIMENT O N E ............................................ 89
4.15 MASUREMENT SCALES: EXPERIMENT TWO..............................................98
4.16 CORRELATION AMONG DEPENDENT VARIABLES:EXPERIMENT TWO............................................................................................... 99
4.17 RESULTS OF MANOVA, PRODUCT SET OF VARIABLES,EXPERIMENT TWO, n = 193............................................................................. 102
4.18 RESULTS OF MANOVA, ADVERTISEMENT SET OF VARIABLES, EXPERIMENT TWO, n = 193............................................................................. 105
4.19 RESULTS OF MANOVA, ADVERTISEMENT SET OF VARIABLES,WITH INVOL AS COVARIATE, EXPERIMENT TWO, n = 193................. 106
4.20 CELL MEANS, STANDARD DEVIATIONS, ANDUNIVARIATE CONTRASTS: EXPERIMENT TWO.......................................108
4.21 FACTOR-LEVEL GROUP COMPARISONS FOR CREDIBILITY, EXPERIMENT TWO..............................................................................................109
4.22 FACTOR-LEVEL GROUP COMPARISONS FOR BRAND,EXPERIMENT TWO..............................................................................................110
4.23 FACTOR-LEVEL GROUP COMPARISONS FORENDORSEMENT, EXPERIMENT TW O........................................................... 111
4.24 TEST OF HYPOTHESIS 1: EXPERIMENT T W O ........................................... 112
4.25 TEST OF HYPOTHESES 2A AND 2B, EXPERIMENT T W O .......................112
4.26 TEST OF HYPOTHESIS 2C: EXPERIMENT TWO.........................................113
4.27 TEST OF HYPOTHESIS 3: EXPERIMENT T W O ........................................... 114
4.28 TEST OF HYPOTHESIS 4: EXPERIMENT T W O ........................................... 115
viii
Reproduced with permission of the copyright owner. Further reproduction prohibited without permission.

LIST OF FIGURES
1.1 EXPERIMENTAL DESIGN OF MAIN STUDIES............................................... 6
2.1 A PROCESS MODEL OF TPO ENDORSEMENT............................................24
3.1 SCHEMATIC OF EFFECTS OF TPO ENDORSEMENT ANDMODERATORS ON SELECTED DEPENDENT VARIABLES.......................50
3.2 EXPERIMENTAL DESIGN OF MAIN STUDIES............................................63
4.1 EXAMINATION OF RESIDUALS FORASSUMPTIONS OF MANOVA............................................................................74
4.2 BRAND BY ENDORSEMENT INTERACTION FOR PQ............................... 76
4.3 BRAND BY ENDORSEMENT INTERACTION FOR PU............................... 78
4.4 BRAND BY ENDORSEMENT INTERACTION FOR ATTM......................... 91
4.5 CREDIBILITY BY BRAND INTERACTION FOR PQ.................................... 92
4.6 CREDIBILITY BY BRAND INTERACTION FOR PU.................................... 93
4.7 CREDIBILITY BY BRAND INTERACTION FOR ATTM.............................. 93
4.8 EXAMINATION OF RESIDUALS FORASSUMPTIONS OF MANOVA..........................................................................100
4.9 CREDIBILITY BY BRAND INTERACTION FOR IV....................................104
4 .10 CREDIBILITY BY BRAND INTERACTION FOR ATTE............................. 104
ix
Reproduced with permission of the copyright owner. Further reproduction prohibited without permission.

ABSTRACT
Observation of advertising in current use suggests that a new type of ad is
emerging as a product positioning tool. The new ad features third-party organization
(TPO) product endorsement as one o f the elements o f the ad (e.g. "Car o f the Year"
award by Motor Trend magazine, and "4-star" mutual fund rating from Momingstar).
Marketers appear to be using favorable TPO statements about their products to enact
their positioning strategy. This dissertation proposed that TPO endorsements are
perceived by consumers as extrinsic quality cues, similar to the established quality
cues of brand, price, retailer reputation, and warranty. This proposition was
supported by arguments from the source credibility literature, the principle of
cognitive consistency, economics o f information theory, signal theory, and consumer
uncertainty literatures.
In two experiments, TPO endorsement was compared to celebrity endorsement for
its ability to affect dependent variables related to product quality and ad
informational value. Additionally, factors that may moderate the TPO endorsement -
product quality perception relationship (brand, credibility o f the TPO) were also
tested. Each experiment consisted of 8 factorial cells (3 factors at 2 levels each) plus
2 control cells. In all, data was collected from 466 student subjects.
Compared to credible celebrity endorsements, ads containing credible TPO
endorsements for the same product significantly enhanced consumer perceptions of
product quality and information value o f the ad. This effect was more pronounced
for desktop computers (a tangible product) than auto insurance (an intangible
product). For computers, endorsement cue interacted with brand cue such that the
x
Reproduced with permission of the copyright owner. Further reproduction prohibited without permission.

perceived quality o f a low image brand was enhanced to a greater degree than that o f
a high image brand going from celebrity endorsement to TPO endorsement.
It is concluded that TPO endorsement functions as an extrinsic quality cue in
advertising. To consumers, TPO endorsement is beneficial because it may
communicate experience and credence characteristics o f products prior to purchase.
For marketers, TPO endorsement may be useful in positioning products against the
competition.
xi
Reproduced with permission of the copyright owner. Further reproduction prohibited without permission.

CHAPTER ONE: DISSERTATION OVERVIEW
Introduction
Imagine that you wish to purchase a laptop computer. Would your attitude toward a
particular brand/model be influenced by viewing an advertisement stating that the
product received the "Editor’s Choice" award from PC Magazine? If you previously
held an unfavorable opinion of the endorsed brand, would the endorsement change your
attitude? Would your attitude be the same if you knew that PC Magazine accepted
advertising from the manufacturer and donation o f items to be evaluated? What if the
endorsement was from a non-profit organization that accepts no advertising or product
donations? All o f the above questions relate to effects o f product endorsement by a
third-party organization (TPO), and how these effects may be moderated by source
credibility (whether the TPO may have a conflict o f interest leading to an endorsement
bias), and brand associations (whether the TPO endorsement is consistent with your
brand beliefs and brand experience). These issues are relevant because TPO
endorsements are commonly found in advertising. Examples o f TPO endorsements in
advertising include: 5 star rating for home PC reliability and service from PC World
magazine (Dell Computer), 4 star mutual investment fund rating from Momingstar (Van
Kampen Funds), the "Editor’s Choice" award from PC Magazine (NEC Computer
Systems), and the "Car of the Year" award from Motor Trend magazine (Chrysler). The
fact that marketers use TPO endorsements in their advertising suggests that they have an
effect on consumer attitudes. Yet, the marketing literature has paid very little attention
to TPO endorsements. This dissertation is intended to address this research gap.
1
Reproduced with permission of the copyright owner. Further reproduction prohibited without permission.
Definition o f TPO Endorsement
As used here, third-party organization (TPO) endorsement is defined as product
advertising that incorporates the name o f a TPO and a positive evaluation o f the
advertised product attributed to the TPO. A TPO is an organization perceived by
consumers to be independent of the advertiser. The TPO product evaluation may be in
the form of a seal of approval (e.g. the American Dental Association seal o f approval
appearing in toothpaste advertising). Although seals meet the technical requirements to
be TPO endorsements, the focus o f this investigation is on TPO endorsements that
compare, rate, and/or rank products within a product class. In most cases, TPOs will
publish their own periodicals and review and test products as a routine part o f their
business.
Research Gaps
The marketing literature recognizes brand, price, product features or appearance,
retailer reputation, warranties, and guarantees as signals o f product quality (Dawar and
Parker 1994), but very little has been said about TPO endorsement as a possible signal
o f product quality. Beltramini and Stafford (1993) reported that consumers had
difficulty identifying seals of approval logos and that consumers were confused about
what a seal actually meant. More importantly, in only one o f twelve seals investigated
did subjects perceive the ad to be more believable with the seal than the same ad
without the seal.
Regarding TPO endorsements that are comparative among products, the only
apparent previous academic investigation is that o f Peterson, Wilson, and Brown
(1992). These authors looked at the ability o f TPO endorsement to influence consumer
2
Reproduced with permission of the copyright owner. Further reproduction prohibited without permission.

attitude toward the ad, attitude toward the brand, attitude toward the company, and
purchase intention for six different goods/services (shoe repair, health maintenance
organization, mutual fund, insect spray, digital audio player, and electric screwdriver).
Fictional brands and companies were used. The TPO was operationalized as a fictional
market research company, and the endorsement was a diagonal ‘banner’ in an ad stating
that a fictional brand had been rated number one in overall customer satisfaction based
on survey results. Advertisements containing TPO endorsements were found to be no
more effective than ads not containing endorsements.
In contrast to the above negative results, there is empirical evidence that TPO
endorsements may affect consumer behavior. The real-life equivalent of the TPO
operationalized in the Peterson, Wilson, and Brown study is the J. D. Power Company.
The Wall Street Journal has reported that sales of the Buick LeSabre allegedly rose 62%
after advertising for it began boasting its J. D. Power Company rating as the most
trouble-free American car (Peterson, Wilson, and Brown 1992). TPO statements
unfavorable to the product may also be effective. Sales of the Isuzu Trooper plummeted
26% after a Consumers Union press conference (and an article in Consumer Reports)
criticized the vehicle for its rollover tendency in crash-avoidance maneuvers (Rechtin
1996).
It is unclear why TPO endorsement had no significant effect in the Peterson, Wilson,
and Brown study. Perhaps if subjects recognized a real-life TPO name, the endorsement
may have been more influential (a source credibility effect). Perhaps a market research
firm was not perceived by consumers to be truly independent o f the manufacturer (a
question o f trustworthiness). Perhaps if the TPO had reported the results of product
3
Reproduced with permission of the copyright owner. Further reproduction prohibited without permission.
evaluation by their own staff o f product experts, the endorsement may have carried
more weight (a question of expertise). Given the demonstrated power o f TPO
endorsement to affect consumer behavior in real life, further investigation appears
warranted.
Dissertation Objectives
The central theme o f this thesis is that TPO endorsements may function as a signal of
product/service quality for consumers. A favorable TPO endorsement is believed to
result in consumer perceptions o f product quality and related variables that are, on
average, more favorable than product perceptions resulting from celebrity endorsement
(or an absence of endorsement) o f the same product. Further, the TPO endorsement-
product quality perception relationship is believed to be moderated by factors such as
TPO credibility (especially trustworthiness o f the TPO), and product brand (whether
endorsement is consonant or dissonant with brand associations held in memory).
Theoretic arguments are given, hypotheses are proposed, and experiments are outlined
to investigate these themes.
Method
An experimental design was generated specifically to achieve the goals set forth in
the preceding paragraph. TPO endorsement, celebrity endorsement, and the no
endorsement condition were compared for their ability to affect variables related to the
product and the ad. The rationale for this choice is that endorsement by experts (and by
extension TPOs) is believed to work through the process o f internalization while
celebrity endorsement is believed to work through the process o f identification
(Friedman and Friedman 1979). Since both are endorsements yet work through
4
Reproduced with permission of the copyright owner. Further reproduction prohibited without permission.

different processes, a comparison o f their ability to affect perceptions o f the same
product was believed to be appropriate. The no endorsement condition serves as a
baseline control against which the effects o f the two endorsement conditions may be
compared. The three endorsement types thus constitute one factor in the experiments.
The second and third factors are brand image (levels of high/low) and TPO credibility
(levels of high/low), respectively. The overall experimental design would be a 3 X 2 X
2 factorial, except that credibility will not be manipulated in the no endorsement
condition, resulting in an unbalanced design. That is, 2 cells are missing from a full
factorial design. A diagram o f the 10 experimental cells is shown in Figure 1.1.
Two experiments were completed, one each for a tangible good and a service.
Because purchase risk reduction is one o f the hypothesized functions o f TPO
endorsement, and because consumers perceive greater risk in the purchase of services
than goods (Murray and Schlecter 1990), it was thought appropriate to test the effects of
TPO endorsement on the perception o f a service as well as a tangible good. The first
pretest resulted in the selection o f personal computers as the tangible good and auto
insurance as the service product for the main studies. Product brands to operationalize
the brand image factor were determined in pretest two, along with a choice o f TPO
name and how to operationalize the TPO credibility factor. The objective o f pretest
three was to screen celebrity names for effectiveness in endorsing personal
computers/auto insurance.
A convenience sample o f undergraduate university business students was chosen for
all pretests and both experiments. For the main studies, subjects viewed 8 by 9 inch
5
Reproduced with permission of the copyright owner. Further reproduction prohibited without permission.

HighCredibility
LowCredibility
No Credibility orEndorsementManipulation
HighImageBrand
TPOEndorsement
Cell#1
Cell#2
Cell#9Celebrity
EndorsementCell#5
Cell#6
TPO Cell CellEndorsement #3 #4
LowImage r ^ iiV'611Brand Celebrity Cell Cell # 1 0
Endorsement #7 #8
FIGURE 1.1EXPERIMENTAL DESIGN OF MAIN STUDIES
black and white ads and responded immediately to questionnaire statements while
viewing the ad. Dependent variables in the experiments were: perceived product quality
(PQ), perceived product uniqueness (PU), attitude toward the manufacturer (ATTM),
perceived risk o f purchase (PR), ad (information) value (TV), and attitude toward the
endorser (ATTE). These six dependent variables break into two logical intercorrelated
groups, a product set (PQ, PU, ATTM, and PR) and an advertisement set (IV and
ATTE). The two sets were analyzed separately in MANOVA for each o f the two
experiments.
Reproduced with permission of the copyright owner. Further reproduction prohibited without permission.

Dissertation Contributions
Observation o f current advertising suggests that TPO endorsements are being used to
promote goods and services. The fact that marketers employ TPO endorsements
suggests that they may affect consumer perceptions o f products. However, to date,
there is no academic demonstration of TPO endorsement effects or an explanation of the
conditions under which these effects may occur. This dissertation is intended to fill
some o f this knowledge void.
It may be argued that TPO endorsements are simply a variant o f expert
endorsements. This dissertation counterargues this point in the theory section. In any
event, there is a paucity o f literature on expert endorsements and even if the two
endorsements were considered as one, the breadth o f dependent variables and
hypotheses in this dissertation makes a significant contribution in the area of
endorsements in advertising.
7
Reproduced with permission of the copyright owner. Further reproduction prohibited without permission.
CHAPTER TWO: THEORY DEVELOPMENT AND HYPOTHESES
The Quality Perception Process
Definition. Product quality may be conceptualized as objective or subjective quality
(ZeithamI 1988). Objective quality refers to the measurement of products on pre
existing criteria that are agreed upon to indicate superiority. Thus, independent judges
could examine the results o f these "mechanistic" tests and they would arrive at the same
quality determination. Examples of objective quality may be ISO 9000 certification and
product testing in the laboratories o f Consumer Reports. In contrast, subjective quality
is a human response to a product that is highly relativistic and known to differ between
judges. The two concepts are not entirely independent, however, since the selection of
criteria to measure "objective" quality may be subjective. Given that consumer
purchase decisions are generally made without the benefit o f objective quality
determinations, consumer behaviorists have focused on subjective quality (more
appropriately termed perceived quality).
In addition to being different from objective or actual quality, perceived quality may
also be defined as: a) a higher level abstraction rather than a specific product attribute,
b) a global assessment that resembles attitude, and c) a comparative judgment
referenced to a consumer’s evoked set (ZeithamI 1988). More broadly, perceived
quality has been defined as the bridge between the basic and derived wants o f the
consumer; it is the extent to which a product, relative to alternatives, is perceived to be
fit to provide a desired consumption experience (Steenkamp 1990). At purchase, this
degree of fit can only be estimated, while upon consumption, perceived quality refers to
experienced fitness for consumption.
8
Reproduced with permission of the copyright owner. Further reproduction prohibited without permission.

Evaluation of product quality takes place within a comparison context. That is, a
product’s quality is evaluated as high or low depending on its relative superiority among
products that are viewed as substitutes by the consumer (ZeithamI 1988). However,
consumers rarely have complete product information available when evaluating
products. Product attributes such as durability, reliability, and other performance
features are often unobservable prior to purchase and consumption o f the product.
Unobservable product attributes may be ‘inferred’ from presented information (Huber
and McCann 1982).
Cues. Quality cues are important to consumers in making inferences, reducing
uncertainty, and forming product preferences. Attributes that signal quality have been
dichotomized into intrinsic and extrinsic cues (Olson and Jacoby 1972). Intrinsic cues
relate to the physical composition o f the product. For example, intrinsic quality cues for
a television may include size o f the viewing screen and image resolution (pixel size).
Extrinsic quality cues are product-related but not part of the physical product. Extrinsic
cues include brand name, price, warranties, retailer reputation, and (it will be argued
here) TPO endorsement. A quality cue is valued to the extent that it is believed to
signal product quality. This relationship may be conceptualized as a means-end chain.
The value of the means (cues) is determined by the value o f the end (attributes/benefits)
to which they are perceived to lead. In addition to perceived informational value, cue
processing is also affected by consumer knowledge and product/purchase involvement.
Consumer knowledge is an important factor in the ability to process information [cues]
(Celsi and Olson 1988), while product/purchase involvement affects motivation to
process information [cues] (Zaichkowsky 1985). It may be expected that
9
Reproduced with permission of the copyright owner. Further reproduction prohibited without permission.

knowledgeable consumers who are highly involved with the product/purchase would
process more quality cues and make more cognitive elaborations than would consumers
with low knowledge and low involvement.
TPO Endorsement as a Cue. The relationship o f TPO endorsement to quality cues
and quality attributes is that TPO endorsement may inform consumers of unobservable
product attributes such as durability, reliability, and other performance features. By
informing consumers of experience and credence characteristics of a product prior to
purchase, TPO endorsement may lower perceived purchase risk. For example, J. D.
Power Company ratings of automobiles will indicate reliability and durability, attributes
not usually known to consumers prior to product purchase.
There are two additional reasons why TPO endorsements may be an important
extrinsic cue. First, the rise of internet commerce means that there will be an increasing
number of consumers deprived o f the opportunity to physically inspect goods before
purchase. Research from direct marketing indicates that consumers perceive a higher
level of risk with non-in-store purchases as compared to in-store purchases (Akaah and
Korgaonkar 1988). In the absence o f intrinsic cues, extrinsic quality cues such as brand
and TPO endorsement may become important in reducing the perceived risk of e-
commerce purchase decisions. Second, perhaps because services are intangible and
heterogeneous, consumers perceive greater risk in the purchase o f services than goods
(Murray and Schlacter 1990). This suggests that consumers may especially value pre
purchase quality cues when shopping for services. Although little research has been
done in this area, advertising encoding certain service quality dimensions has been
shown to decrease consumer perception of risk (Clow, Baack, and Fogliasso 1998). It
10
Reproduced with permission of the copyright owner. Further reproduction prohibited without permission.

will be proposed, later, that TPO endorsement may function as an extrinsic cue to
reduce perceived risk o f service purchase.
This section has defined the concept o f perceived quality and discussed quality cues.
The next section will provide a framework for how consumers integrate quality cues
into quality attribute beliefs.
Formation of Quality Attribute Beliefs
Quality attribute beliefs may be formed through three different processes (Steenkamp
1990): observation, information, and inference. Observational beliefs result from direct
sensory experience with the object. With direct experience, the consumer can form
quality beliefs without relying on quality cues. Marketers employ this process when
they give out free samples o f breakfast cereal or test drives of new cars. Trial product
experience is not always possible, however, and even when available it would not say
much about nutritional quality (in the case of cereal) or durability and safety (in the case
of a car). For these reasons, consumers may use other cues in the quality perception
process.
Product information from outside the consumer (advertisements, other consumers,
consumer magazines) may also result in quality beliefs. For example, Consumer
Reports may rate a particular lawnmower high on the ability to cut tall grass, resulting
in the informational belief that "brand X cuts tall grass well". Information acceptance
may occur by the process o f internalization (Kelman 1961), one o f three basic methods
of attitude change. Consumers internalize opinions/information when the source is
credible and adoption is useful in solving a problem or the adopted position is consistent
with the consumer’s values.
11
Reproduced with permission of the copyright owner. Further reproduction prohibited without permission.

When experiential attributes o f the product are unknown (either because trial test is
unavailable and/or there is no information from other sources), the consumer may infer
quality attributes on the basis of quality cues. The inference process is guided by prior
beliefs and heuristics (schemata) held in memory (Nisbett and Ross 1980). An example
of a prior belief/heuristic is "you get what you pay for" (price as quality cue).
Consumers often misinterpret incoming information to conform with their prior beliefs
and/or avoid disconfirming evidence (Steenkamp 1990).
The framework o f belief formation given above suggests that TPO endorsement may
be most effective as a quality cue when: a) consumers have little direct experience with
the product, b) the organization behind the endorsement is credible and the endorsement
information is useful to the consumer in solving a problem, and c) there are few other
quality cues available or consumers lack schemata to infer quality from available cues.
Having discussed quality perception, quality cues and the formation of quality
beliefs, attention is now turned to endorsement types and the differences between
endorsements containing advertising and advertising in general.
Types of Endorsers
The Endorsement Family. Endorsement implies a recommendation about a good or
service from someone other than the manufacturer/service provider. The endorsement
literature has identified three basic types o f endorsers (Fireworker and Friedman 1977;
Friedman and Friedman 1979; Frieden 1984): celebrity spokesperson, expert, and
typical consumer. These three categories generally parallel, respectively, the three
dimensions o f source communication identified in the literature (Wilson and Sherrell
1993): physical or social attractiveness, credibility, and perceived similarity to the
12
Reproduced with permission of the copyright owner. Further reproduction prohibited without permission.
receiver. Product endorsement by an organization that is comparative among products
(not just a seal o f approval) is a relatively new development in advertising. The study
o f Peterson, Wilson, and Brown (1992), apparently the only work to address
comparative product endorsement by a TPO, found TPO endorsement to have no
significant effects.
It may be questioned whether TPO endorsement is simply a subtype o f expert
endorsement or a separate (a fourth) type of endorsement. This may be debated.
However, if compared, expert and TPO endorsers appear to differ in at least three
respects: perceived independence/profit orientation, access to resources, and consensus
development.
First, individual expert endorsers are probably perceived to profit from their
endorsement in some way. That is, individuals generally have a for-profit orientation
while non-profit TPOs are known to exist. Additionally, even a for-profit TPO may be
perceived as more independent from the marketer than an expert simply because the
novelty of TPO endorsement makes association between the TPO and the marketer less
clear in the mind o f the consumer. Second, TPOs are probably perceived to have access
to testing facilities, equipment, and information to a greater degree than individual
experts. This suggests that technologically complex products that lend themselves to
laboratory testing may be particularly suited for TPO endorsement. Third, because
TPOs are probably perceived to have more than one ‘expert’ on their staff, TPO
endorsement implies that a consensus was reached prior to endorsement. Such a check
and balance system may not be attributed to an expert.
13
Reproduced with permission of the copyright owner. Further reproduction prohibited without permission.

TPOs usually publish their own periodicals containing product ratings, rankings, and
endorsements. Rather than focus on these editorial endorsements, this study will
examine the issue o f advertising containing TPO endorsements. The latter is of
particular interest to marketers because: a) TPO endorsements in ads may appear
repeatedly in multiple publications achieving a wider audience than the individual TPO
publication, and b) marketers are able to exert control over their ads (the content o f the
ad and the association of the ad with the endorsement) while endorsements appearing in
TPO publications are not under marketer control.
Before moving on to a more focused consideration o f TPO endorsements, however,
the proposed mechanisms o f action o f different endorsement types will be briefly
reviewed.
Functional Differences Within the Endorsement Family. Kelman(1961)
hypothesized three processes that may result in a receiver adopting an attitude
advocated by the sender. The process o f identification occurs when an individual
adopts an attitude because it is consistent with his self-definition or reference group
image. The process of internalization occurs when the receiver adopts an attitude
because it is useful for the solution o f a problem or because it is demanded by his value
system. The third process, compliance, results in attitude adoption only to gain
approval or to avoid disapproval from the sender. That is, the attitude is adopted not on
the basis o f its content but because it is instrumental in achieving a desired social effect.
Attitudes formed as a result of these three processes are believed to differ in their
resistance to change (Solomon 1992). Thus, attitudes formed through internalization
are held at a high level of commitment, attitudes formed through identification are held
14
Reproduced with permission of the copyright owner. Further reproduction prohibited without permission.

at an intermediate level, and attitudes resulting from the process o f compliance are held
with the least allegiance.
The first two o f Kelman’s processes are applicable to endorsements. It has been
hypothesized that celebrity endorsers persuade through the process o f identification,
expert endorsers influence through the process o f internalization, and typical consumers
exert their effects through a combination of both processes (Friedman and Friedman
1979). In sum, the different types o f endorsers are believed to operate by different
persuasive mechanisms. On this basis, Friedman and Friedman (1979) proposed that
endorser effectiveness would vary by product type. Specifically, they proposed that: a)
celebrity endorsers would be most effective for products high in psychological or social
risk, b) expert endorsers would be most effective for products high in financial,
performance, or physical risk, and c) typical consumers would be most effective for
products ranking low in risk. All of these hypotheses were supported by experimental
results. Apparently, purchase risk is perceived as a problem by consumers, and the
recommendations o f experts are internalized to solve the problem. Conversely,
consumers may identify with the sophistication and beauty of a celebrity and adopt their
recommended product to emulate the image o f the celebrity. In their 4 types of
endorsement (none, celebrity, expert, typical consumer) X 3 types o f product (vacuum
cleaner, cookies, costume jewelry) factorial design, the Friedmans used a single
(fictional) brand. It will later be proposed that brand interacts with endorsement.
The process whereby endorsement persuades may also be related to the three
recognized dimensions o f source credibility (expertise, trustworthiness, and social
attractiveness) as defined by Ohanian (1991). In her study, the source was a celebrity
15
Reproduced with permission of the copyright owner. Further reproduction prohibited without permission.

endorser. She collected data from 578 respondents and modeled through structural
equations the relationship of the ratings of four celebrities on each o f the three
dimensions to purchase intention (PI). The only one of the three dimensions to
significantly influence PI was expertise. The negligible influence o f attractiveness on
PI was explained by the fact that celebrities are almost always attractive and this is
taken as a given. A lack of effect for trustworthiness was attributed to the receiver
inference that celebrities are well compensated for their endorsements and therefore
probably biased. O ’Mahony and Meenaghan (1997/98), in an endorsement study
conducted by mall intercept survey, also found support for a significant relationship
between expertise and PI.
Interestingly, subjects in the O’Mahony and Meenaghan study reported an overall
celebrity endorsement believability mean o f 2.56 on a 1 to 5 scale, suggesting that
celebrities are not perceived as very trustworthy. The question may be asked, then, why
do advertisers continue to use celebrities to endorse products? Counterbalancing their
negative attributes o f untrustworthiness, O’Mahony and Meenaghan found that celebrity
endorsers are generally perceived as attention-getting and entertaining. Thus, celebrity
endorsement may be effective at the low end of the Lavidge-Steiner persuasion model.
Also, it is generally acknowledged that linking a celebrity to a product may be
strategically important as a means of differentiating competing products from each
other. This may occur when there are few, if any, functional differences among
competitors. Celebrity endorser effectiveness, however, is greatly affected by the "fit"
between celebrity image and product (O’Mahony and Meenaghan 1997/98). That is, the
ability of the expertise dimension to contribute to PI will probably only occur if there is
16
Reproduced with permission of the copyright owner. Further reproduction prohibited without permission.
an appropriate "fit" between endorser and product. By definition, a celebrity endorser is
an individual who is known to the public (entertainer, athelete, etc.) for his or her
achievements other than that of the product class endorsed (Friedman and Friedman
1979). For example, Claudia Schiffer, world-famous supermodel, may endorse a
perfume. The celebrity "expertise" is this case does not mean that she understands the
chemistry o f perfume (that would make her an expert rather than a celebrity). However,
perfume would be appropriate to Schiffer’s image and consumers may believe her to be
qualified to give recommendations in the product class.
In some respects, TPO endorsement may be a mirror image of the positive and
negative attributes o f celebrity endorsement. On the negative side, TPO endorsements
may not be as attention-getting as celebrity endorsements. However, on the positive
side, TPO endorsements are probably perceived as more trustworthy (because
endorsements are first published in the TPO’s periodical). Additionally, TPO expertise
is probably perceived as greater than that o f a celebrity. Overall, endorsements from a
credible TPO should be more effective than a celebrity endorsement (or a no
endorsement condition) when subjects’ attention is not distracted and the time interval
to response is very short.
TPO Endorsements in Advertising
Form o f TPO Endorsement. Observation o f current TPO endorsements in
advertising suggests that the endorsement may take one o f three general forms: 1) the
product is ranked against competing products in its class on one or more criteria, 2) the
product is awarded a "seal" o f approval by the TPO (although how the "seal"
17
Reproduced with permission of the copyright owner. Further reproduction prohibited without permission.

differentiates among products in the class may be unclear), and 3) a subjective, non-
comparative, statement about one or more product attributes.
An example o f #1 is an ad for the Warburg Pincus Capital Appreciation Fund touting
its 5-star rating from Momingstar. The fine print explains that only the top 10% o f
2,916 equity funds in the class received a 5-star rating, based on risk adjusted
performance over a three year period. In this example, the product is a mutual fund, the
TPO is Momingstar, and the criterion is performance relative to 90-day Treasury bill
return (a credence characteristic). An example o f #2 is an ad for Norton AntiVirus
incorporating a "seal" o f approval (the WinList logo) from Windows magazine. In this
example, the product is a software package and the TPO is Windows Magazine.
However, no evaluative criterion is mentioned and it is unclear how many other brands
in the product class may also have been awarded the WinList logo. An example o f #3 is
an ad for the Cannon BJC-6000 color inkjet printer incorporating a quote (with date o f
publication) from PC Magazine, “The Cannon BJC-6000 series Color Bubble Jet
Printer offers economy and value - a savvy color printer package.” In this example, the
product is a color inkjet printer and the TPO is P C Magazine. Instead o f a product
ranking or an ambiguous "seal" o f approval, the endorsement is in the form o f a
subjective statement about the product’s attributes.
The above description o f the three general forms o f TPO endorsement does not say
anything about differences in their visual impact, and this may be very important in
advertising. Although the information conveyed is sometimes ambiguous, the most
visually striking form is #2, the seal of approval. The stylized graphics o f the seal often
resemble the TPO corporate logo triggering a memory within the observer and drawing
18
Reproduced with permission of the copyright owner. Further reproduction prohibited without permission.

attention. The example o f form #1 described above contains five 5-pointed stars to
visually inform the reader o f the mutual fund’s ranking. Consumers are familiar with
star rankings for restaurants and movies and so the star format appears to be a succinct
visual conveyer of information. Form #3 (subjective statement) is the least visually
interesting o f the three, consisting o f only text. However, the example ad contained
statements from five different TPOs and the remainder of the ad copy picked up on
"buzzwords" used by the TPOs to position the product in the mind o f the reader.
Although all three forms o f TPO endorsement position the product, form #3 is probably
the most flexible in its ability to address specific product attributes.
Fusion o f Information Sources. Nelson (1974) has identified four sources of
product information available to consumers: 1) the consumers’ own experience in
sampling products, 2) advertising, 3) other consumers, and 4) consumer magazines.
From a communication perspective, TPO endorsements are interesting because they
appear to represent a fusion o f two of the three external sources o f product information.
The endorsements derive from consumer magazines and/or surveys o f consumers, but
they are contained within advertising. It is this "fusion" that lies at the heart of two
important differences between advertising containing TPO endorsements and general
advertising: 1) context, and 2) control.
Context. Research suggests that consumers are generally skeptical o f advertising
(Calfee and Ringold 1988). Indeed, consumers develop over time personal knowledge
about when, why, and how marketers are trying to influence them (a "schemer schema",
Wright 1985). This knowledge helps them to adapt to persuasion attempts (Friestad and
Wright 1994). Because advertising containing TPO endorsements is a blend of apparent
19
Reproduced with permission of the copyright owner. Further reproduction prohibited without permission.

independent information plus advertising information, consumers may process the ad
with an heuristic other than the "schemer schema" used for general advertising. That is,
the TPO endorsement part o f the ad may be categorized as "news" while the remainder
o f the ad is categorized as "advertising." The significance of different categorization is
that it may affect evaluation (Cohen and Basu 1987). For example, "news" may result
in less source derogation and counterargument than "advertising." It is possible that
advertising containing TPO endorsement is more believable and ultimately more
effective than other forms o f print advertising for certain products.
Control. It may be noted that advertising containing a TPO endorsement can only
occur after a series o f sequential steps. First, the TPO must have rendered a favorable
opinion o f the endorsed product and/or ranked the product better than some competitor.
Second, a marketer must want to use the TPO endorsement in an ad for the product.
Third, the TPO must allow the use of their name and/or logo to be used in a proposed ad
endorsing the product. Certain TPOs are unwilling to do this. The name o f a TPO is
essentially a "brand" and the TPO may not wish to associate its name (brand) with the
name (brand) o f the marketer. Such an association might allow the marketer to trade on
the brand equity of the TPO, while the converse would not be true for the TPO (the TPO
would not logically trade on the brand o f the marketer). Also, the TPO may fear a
perceived loss o f independence if the TPO and the marketer are linked in an ad because
other endorsers (celebrities) are usually paid for their endorsements and/or stand to
profit from the arrangement.
Contrast Effects. A previous section argued that TPO endorsements may be
categorized by viewers as partly "news" and partly "advertising." This difference
20
Reproduced with permission of the copyright owner. Further reproduction prohibited without permission.

suggests that advertising containing TPO endorsements may be perceived by readers as
"different" from advertising in general. The significance of this difference is that new
information (advertising) is perceived in the context o f the observer’s past experience,
beliefs and feelings (Sherif and Hovland 1961). For example, your judgement that a
box is heavy depends on the weight o f other boxes you have lifted. The terms
assimilation and contrast have been applied to the relationship between the observer’s
context and the new stimulus. Assimilation refers to a positive relation between the
context and the new stimulus while contrast refers to a negative relation between the
context and the new attitude object. The primary determinant of whether assimilation or
contrast will occur is the distribution of the observer’s context stimuli (Helson 1964).
Returning to the boxlifting example, a moderately heavy box would typically be judged
as light by subjects who have been lifting heavy boxes, and as heavy by subjects who
have been lifting light boxes. This is a contrast effect.
It is very possible that viewers will perceive ads containing TPO endorsements as
very different than the ads to which they are usually exposed, resulting in a contrast
effect. This assertion is based on the fact that TPO endorsements have a different
structure than most ads, and that TPO endorsement may be perceived as more
informative and more believable. The significance o f a contrast effect for TPO
endorsement is that the rendering of a contrast judgement may predispose the TPO
endorsement to further cognitive elaboration. That is, a viewer who has an interest in
the product category may contrast TPO endorsement against other ads for information
value and believability. This determination may earmark the ad for further processing
because it is relevant and diagnostic to the purchase situation.
21
Reproduced with permission of the copyright owner. Further reproduction prohibited without permission.

The Role of TPO Endorsement
Two Broad Roles. The central theme of this paper is that TPO endorsement
functions as an extrinsic quality cue to allow consumers to infer unobservable product
attributes such as durability, reliability, and other performance features. In playing this
role, TPO endorsement may allow the consumer to perceive that he can more accurately
assess product quality prior to purchase, thereby lowering his risk of purchase. A
second theme is that the incorporation of a credible TPO endorsement into advertising
will enhance the information value o f the ad and attitude toward the manufacturer above
that o f comparable advertising not containing a TPO endorsement. Arguments to
support these two themes will be provided soon.
Based on the roles identified above, TPO endorsements would appear to have value
to both consumers and marketers. To consumers, TPO endorsement may communicate
experience and credence characteristics of products prior to purchase and in some cases
compare competing brands o f products on certain attributes. Both of these functions
serve to lower consumer perceived risk of product purchase. For marketers, TPO
endorsement may: a) make their ads more believable, b) result in the endorsed brand/
model becoming part of the viewer’s evoked set for the product class (if not already), c)
function as a tool to position their product against the competition, and d) increase
product sales (by lowering perceived risk of purchase). The ability of TPO endorsement
to lower purchase risk is therefore critical to its hypothesized functions.
Role Moderators. It may be expected that factors which influence the risk reduction
ability o f TPO endorsement would act as moderators o f TPO endorsement. These
include: a) credibility of the TPO (endorsements o f low credibility would not lower
22
Reproduced with permission of the copyright owner. Further reproduction prohibited without permission.
purchase risk), b) brand experience and brand knowledge (knowledgeable consumers
can already assess risk without the aid o f TPO endorsements), and c) type o f product
(services have more experience/ credence characteristics and therefore carry higher risk
than goods. These moderators will later be explored in detail.
Consistent with its role o f purchase risk reduction, TPO endorsement is probably
most appropriate for products considered risky (financial and performance risk),
products that are technologically complex or difficult to understand, or products with a
lot of experience/ credence characteristics. The set o f products appropriate for TPO
endorsement advertising is probably a smaller subset o f that found in general
advertising.
Endorsement Processing. This section concludes with a proposed schematic o f TPO
endorsement processing by consumers (see Figure 2.1). This schematic is based on the
general model o f Maclnnis and Jaworski (1989). TPO endorsements are diagrammed as
being cognitively processed, and this process is moderated by individual motivation,
ability, and opportunity to process information. Processing may result in: a) cognitive
responses concerning source credibility, b) inference o f unobservable product attributes,
and c) an assessment o f uncertainty and the need for continued information search.
Finally, product quality perception is moderated by attitude toward the endorsed brand,
type of product (good/ service), and the perceived quality o f competitive offerings.
Endorsement Theory Development
The hypothesized ability o f TPO endorsement to affect consumer quality perception
is drawn from several sources including source credibility/ attribution theory literatures,
23
Reproduced with permission of the copyright owner. Further reproduction prohibited without permission.

Exposure to TPOEndorsement
Motivation and Ability and Opportunity to Process Information
Cognitive Processing of Endorsement Information
a) TPO credibility attributionsb) inference o f unobservable product attributesc) assessment of attribute uncertainty and need
for continued search
Perception o f Competitive Product Offerings
Brand Associations Held in Memory
Perceived Quality o f the Endorsed Product
FIGURE 2.1A PROCESS MODEL OF TPO ENDORSEMENT
24
Reproduced with permission of the copyright owner. Further reproduction prohibited without permission.

the principle o f cognitive consistency, economics o f information theory, signal theory,
and consumer uncertainty/ risk reduction literatures.
Source Credibility. It is generally accepted that highly credible sources are more
persuasive than sources of low credibility (Dholakia and Stemthal 1977; Stemthal,
Phillips, and Dholakia 1978). As a rationale for this finding it has been suggested that
messages from highly credible sources are perceived to provide a more accurate
representation o f reality, thereby becoming persuasive (Eagly, Wood, and Chaiken
1978). Early work on isolating the dimensions of source credibility proposed the
following factors: a) expertness o f the source on the topic o f concern, b) trustworthiness
of the source to communicate without bias, c) reliability o f the source (dependability
and consistency), d) social attractiveness o f the source as perceived by the message
recipient, and e) degree to which others hold a positive belief about the credibility o f the
source (Giffin 1967). The last factor was conceptualized as social influence factor that
could interact with one or more o f the other factors. The literature has subsequently
distilled the source credibility dimensions into three factors (Ohanian 1991): expertise,
trustworthiness, and attractiveness.
The theoretical discussion below will focus primarily on the trustworthiness
dimension o f source credibility. Source expertise may not play a critical role in the
context o f TPO endorsement. Consumers may assume that TPOs would hire product
experts and make available to them sufficient resources to evaluate products. Also,
source trustworthiness is suggested to be more important to persuasion than source
expertise (McGinnies and Ward 1980). The attractiveness factor is highly relevant to
celebrity spokespersons; however, it may not be applicable to TPOs.
25
Reproduced with permission of the copyright owner. Further reproduction prohibited without permission.

Cognitive Response and Attribution Theory. Wright (1973) has identified three
primary cognitive responses mediating the acceptance o f advertising: counterargument,
source derogation, and support argument. Counterarguments are spontaneously
generated to neutralize incoming messages that are discrepant with the recipients belief
system. Conversely, if the incoming message is consistent with existing beliefs, support
arguments may be generated. Source derogation is a substitute for counterargument,
and it may be especially used when the source is viewed as untrustworthy. Wright
believed that the impact o f source derogation on the incoming message may be as
devastating as counterargument. An attribution theory perspective may also be applied
to Wright’s source derogation response. Attribution theory suggests that message
recipients will act like naive scientists and attempt to determine the credibility o f the
source of the message. Within a TPO endorsement context, the discounting principle (a
component o f attribution theory, Kelly 1973) suggests that consumers will question why
an endorser has taken a particular position. That is, consumers will evaluate the
endorser to determine source expertise (accurate knowledge) and trustworthiness (a
willingness to communicate accurate knowledge). If the communicator (endorser) is
perceived to lack expertise and trustworthiness, the endorsement will be discounted and
its effectiveness will be lost (Mizerski, Golden, and Keman 1979).
Attribution theory implies that an endorser will score higher on the trustworthiness
dimension (and consumers may evaluate the product more favorably) if the endorser
does not profit from making the endorsement. Confirming this, Chrysler automobiles
were found to be rated more favorably when it was revealed that celebrity endorser
Frank Sinatra was paid only $1.00 per year than when no rate o f pay was stated (Folkes
26
Reproduced with permission of the copyright owner. Further reproduction prohibited without permission.

1988). Within a TPO endorsement context, this finding may suggest that a non-profit
TPO (such as Consumer Reports) would be perceived as more trustworthy, and products
endorsed by CR may perhaps be evaluated more favorably, than similar products
endorsed by a for-profit TPO. The question really appears to be one of independence
(of the endorser from the manufacturer/marketer). That is, it would be more difficult to
make negative attributions (and diminish credibility) i f the endorser and marketer were
totally independent (the endorser received no money, advertising revenue, product
donation, personnel sharing or support of any kind from the marketer).
The previous discussions of source credibility, cognitive response, and attribution
theory suggest that the credibility of an endorsing TPO should influence subject
responses on the dependent variables o f purchase risk (PR), perceived product quality
(PQ), perceived product uniqueness (PU), and attitude toward the manufacturer
(ATTM). These variables are discussed in detail in Chapter 3.
Cognitive Consistency. According to the principle o f cognitive consistency,
consumers value harmony in their feelings, thoughts and behaviors and they are
motivated to maintain consistency among these elements. If necessary, consumers will
change their thoughts and feelings to make them consistent with attitudes already held.
Balance theory (Heider 1958), a corollary of cognitive consistency, involves relations
among three elements in a triad (a person and his perceptions, an attitude object, and
some other person or object). The relation of balance theory to TPO endorsement is that
the TPO may be one o f the objects in the triad. That is, the consumer may be aware o f
the TPO and have a positive attitude toward the TPO (a positive linkage). When the
TPO endorses a product, another positive linkage in the triad is established. With two
27
Reproduced with permission of the copyright owner. Further reproduction prohibited without permission.

positive linkages already established, balance theory suggests that the consumer will
develop a positive linkage toward the endorsed product. Note that in balance theory the
consumer would develop sentiment toward the object (product) on the basis of the
linkage (endorsement) rather than on the basis o f intrinsic product attributes.
Balance theory has been used to account for the widespread use o f celebrities to
endorse products. It has apparently not been used as an explanation for TPO
endorsement, but there is no obvious reason why the principle would not apply. A TPO
who dependably and consistently issues useful product recommendations may become
an object o f positive sentiment by consumers. These sentiment linkages may be
primarily affective. Thus, balance theory may be an affective counterpart to the
cognitive response triggered by source credibility. Perhaps cognitive evaluation of
product attributes would be more favorable if consumers began their review with
positive affective bias toward the product.
Of the five theoretic arguments for why TPO endorsements should be effective,
cognitive consistency is probably the weakest because it depends on a pre-existing
condition (positive sentiment toward the TPO). However, the recommendation o f some
TPOs, such as Consumer Reports, carries a great deal of weight in the mind of
consumers. The opinion o f Consumer Reports may be valued by consumers because it
has led to pleasurable consumption experiences in the past, proving to be a reliable
source of information. Within the experimental context to be described, a balance
theory scenario (with a pre-existing sentiment toward the TPO) should affect subject
responses on the dependent variable of attitude toward the endorser (ATTE).
28
Reproduced with permission of the copyright owner. Further reproduction prohibited without permission.

Economics o f Information. Consumers routinely make purchase decisions about
products in the absence o f full information about the choices available to them. This
occurs because the consumer search for information has costs (Nelson 1970). There are
time and travel costs to visit stores and inspect goods, and time costs to read advertising
or ask other consumers about their experience with a product. Because different buyers
place different values on the costs and returns o f search for market information, some
buyers will become more informed than others. Stigler (1961) argued that it is this
dispersion o f price information among buyers that allows some sellers to charge higher
prices. Stigler formulated a number of propositions including: 1) the expected savings
from a given search are positively related to the dispersion of prices, 2) the extent of
search is negatively related to the cost o f search, other things being equal, and 3) the
gain from search decreases with continued search (i.e., there are diminishing returns).
These propositions have been subsequently applied to product attributes other than price
(Urbany 1986). Stigler’s theory of search proposed that consumers will inform
themselves about marketplace offerings only to the point where the marginal cost of
gathering more information equals or exceeds the marginal return.
Nelson (1974) has proposed that consumers will be willing to look at advertisements
as long as the marginal revenue to them o f so doing is greater than the marginal cost.
By providing information about experience and credence characteristics o f products and
sometimes product rankings on certain attributes, TPO endorsements should be
perceived by consumers as valued information. Assuming a viewer has a purchase
interest in an advertised product, TPO endorsement may: a) raise the value o f the ad to
29
Reproduced with permission of the copyright owner. Further reproduction prohibited without permission.

the viewer, and b) be perceived as so highly informative that the marginal cost o f
obtaining additional information outweighs the marginal benefit.
Although buyers differ in their perceived costs and benefits o f search, a large
proportion o f shoppers exhibit minimum information search effort (Claxton, Fry and
Portis 1974). Additionally, consumers are particularly attracted to "chunks" of
information about products that efficiently convey meaning (Jacoby, Szybillo, and
Busato-Schach 1977). It is possible that TPO endorsement may function as a "chunk”
o f information about a product and be perceived as a cost efficient guide to product
quality (in an economics of information sense).
The previous discussion o f search theory suggests that the informational value of
TPO endorsement to subjects will drive subject responses on the dependent variable of
information value (IV).
Signal Theory. Consumers may be uncertain about product attributes such as
durability, reliability, and performance and thus perceive risk in the purchase of a
product (Gal-or 1989). Manufacturers may attempt to reduce consumer uncertainty and
risk perception by sending pre-purchase signals o f unobservable product quality.
Warranty, manufacturer reputation, and price are examples of signals intended to reduce
risk perceptions (Shimp and Bearden 1982; Boulding and Kirmani 1993). To be
credible, however, signals must contain a "bonding" component, a potential cost to the
sender of the signal if the signal is false (Ippolito 1990). For the examples o f signals
given, this would be high warranty redemption costs, loss o f investment in building a
reputation, and loss of ability to charge a price premium.
30
Reproduced with permission of the copyright owner. Further reproduction prohibited without permission.

To the extent that TPO endorsements rank competing products on certain attributes,
TPO endorsements appear to function as signals o f unobservable product quality. For
example, a 5-star ranking from Momingstar separates the top 10% of mutual funds from
the remainder based on risk-adjusted performance. A fund scoring only 1-star would
not likely advertise their ranking. Thus, the high performing funds may pursue a
different signaling strategy than low performers. This leads to a separation o f the firms
based on their signaling strategies, allowing consumers to infer unobservable quality
based on the presence of the signal. However, it must be noted that TPO endorsement
differs from the more common quality signals (warranty, manufacturer reputation,
price) in that action by the TPO (an endorsement) is first required before the
manufacturer/marketer can send the signal (in the form o f an ad). Additionally, the
"bonding" component of a TPO endorsement is mostly a cost to the TPO (loss o f source
credibility) rather than a cost to the manufacturer/marketer. From an attribution theory
perspective, TPO endorsement may also differ from traditional quality signals sent by
manufacturers/marketers in that consumers may be less likely to infer an ulterior motive
to a quality signal sent by a TPO (provided the TPO is truly independent o f the
manufacturer/marketer). The fact that a TPO is willing to "go to bat" for an unrelated
marketer and suffer potential cost suggests that TPO endorsement may be perceived by
consumers as a valued signal of hidden product quality.
In their review of signals of product quality, Dawar and Parker (1994) note that the
importance o f a signal (brand, price, physical features, and retailer reputation) generally
follows the signal’s specificity. That is, the importance o f brand as a signal may be due
to that fact that it is shared by only a few products within a product category.
31
Reproduced with permission of the copyright owner. Further reproduction prohibited without permission.
Conversely, retailer reputation is a less important quality signal, perhaps because it is
less specific (retailers generally stock several competing products with a range o f
quality). Following this line of reasoning, TPO endorsement should be very important
as a quality signal (and therefore valued by consumers) because it is model specific
within a branded product line.
Within the experimental context of this study, subject responses on the dependent
variable o f perceived product quality (PQ) should be influenced by the TPO
endorsement signal.
Uncertaintv/Risk Reduction. The constructs of uncertainty and risk have already
been mentioned in association with the section on economics o f information and signal
theory. That is, Stigler included risk (operationalized as monetary cost of purchase) in
his theory of search propositions (Stigler 1961), and there would be no need to signal
unobservable product quality if consumers perceived no purchase risk or experienced no
purchase uncertainty. However, TPO endorsement may play a role in consumer
perception of uncertainty and risk beyond the already mentioned associations.
Consumers experience two types o f uncertainty (Urbany, Dickson, and Wilkie
1989): uncertainty about the alternatives available to meet their needs (knowledge
uncertainty) and uncertainty about which alternative to choose (choice uncertainty).
Articles in Consumer Reports and other TPO magazines often define evaluative criteria,
compare product performance within a product class, and endorse (rate) one or more
products as being better than others. Reading this information and/or the summary
endorsement may serve to give the buyer more subjective certainty in making quality
judgments of brands.
32
Reproduced with permission of the copyright owner. Further reproduction prohibited without permission.

Risk and uncertainty are related concepts. Indeed, perceived risk is defined in terms
of the consumer’s perception o f the uncertainty and adverse consequences o f buying a
product/service (Dowling and Staelin 1994). There are five classical risk components
(Kaplan, Szybilo, and Jacoby 1974): performance (product failure) risk, physical
(safety) risk, psychological (self-image) risk, social risk (loss o f esteem, respect, or
friendship), and financial risk. A sixth component (time loss risk - the cost in time,
convenience and effort to get a product adjusted, repaired, or replaced) has been
proposed (Brooker 1983). These six components generally parallel the possible
negative consequences o f product purchase.
The ability of product warranty (an extrinsic quality cue) to reduce consumer
perceptions of financial risk has been demonstrated (Shimp and Bearden 1982). It is
believed that TPO endorsement (another extrinsic cue) may also reduce financial risk
perceptions. Additionally, TPO endorsement may also reduce performance risk
perceptions. Note that the financial and performance risk components are factorially
indistinct (Shimp and Bearden 1982), reflecting the logic that a product performance
failure would also be a financial cost.
In reference to the dependent variables in this study, the ability o f TPO endorsement
to lower consumer uncertainty should influence information value (IV).
This concludes the endorsement theory section. The next section considers
independent variables likely to moderate the effects o f TPO endorsement on consumer
perceptions. Then, specific hypotheses are developed to propose effects of the
independent variables on the dependent variables.
33
Reproduced with permission of the copyright owner. Further reproduction prohibited without permission.

Other Independent Variables
Although previous sections have argued that TPO endorsement may affect perceived
product quality, other variables likely to moderate the effectiveness o f TPO
endorsement have only been mentioned tangentially. There are five potential
moderators/independent variables that immediately come to mind. First, one would
expect that the endorsing TPO should "fit" the product. That is, an endorsement from
Good Housekeeping magazine would probably be a better image "fit” for a hair dryer
than an endorsement from Motor Trend magazine. Second, the "strength" and/or
context o f the endorsement (5 star rating versus 2 star rating; absolute versus
comparative quality rating) may also affect perceived quality. Third, source credibility
(trustworthiness) would probably be considered by the consumer in evaluating the
endorsement. A perceived reporting bias may cause the consumer to discount the
endorsement. Fourth, the endorsement may or may not be congruent with the
consumer’s brand beliefs and brand experience. In the case o f incongruence, personal
brand experience may have led to highly valenced and accessible attitudes that cause the
endorsement to be rejected. Fifth, the fact that the consumer perceives more risk in the
purchase o f services than goods suggests that TPO endorsement, as a quality cue, may
be relied upon to a greater extent in purchasing services than goods.
Three o f the five potential moderators o f TPO endorsement will be considered
further. The "fit" moderator will not be considered, since inappropriate product/TPO
endorser "fit" is a major blunder that experienced advertisers are unlikely to commit.
The "strength" moderator will not be addressed at this time because it is considered first
necessary to demonstrate that TPO endorsement can be effective. Only a single, strong
34
Reproduced with permission of the copyright owner. Further reproduction prohibited without permission.
level of TPO endorsement will be tested at this time. The remaining three variables to
be considered are: a) level o f credibility o f the TPO endorsement, (b) brand, and (c) type
o f product (good versus service).
Source Credibility. Investigators have found that source credibility may interact
with other factors such that a highly credible source induces no greater persuasion than
a source of low credibility (Dholakia and Stemthal 1977). For example, when subjects
had a highly favorable opinion toward the object o f the communication and the
communicator’s source credibility was identified at the start o f the message, a
moderately credible source was more persuasive than a highly credible source
(Stemthal, Dholakia, and Leavitt 1978). This effect may be explained through cognitive
response theory. High source credibility is believed to inhibit own thought generation
while low source credibility is believed to stimulate own thoughts. When listeners are
opposed to a message, a highly credible source inhibits counterarguments and results in
a greater persuasion than a low credibility source. Conversely, when listeners favor the
message, a highly credible source inhibits support arguments and is not as persuasive as
a less credible source that facilitates support argument generation. Other conditions
shown to interact with source credibility include issue involvement (Petty, Cacioppo,
and Goldman 1981), and message congruence with source’s self-interest (Eagly and
Chaiken 1975). That is, high credibility conditions induce only as much attitude change
as low credibility conditions when: a) the audience is highly involved with the message
issue, and b) the message is incongruous with the source’s self interest. It is possible
that source credibility may interact with other variables in this study.
35
Reproduced with permission of the copyright owner. Further reproduction prohibited without permission.

It will be proposed later than source credibility interacts with brand image in a 2-way
interaction (hypothesis 6). That is, the increase in mean response going from low
credibility to high credibility on the dependent variables related to quality will be
greater for low image brands than high image brands. The rationale for this effect is
cognitive response theory (Wright 1973). High source credibility should induce more
support arguments and less source derogation than low source credibility. Also, high
image brands should induce more support arguments than low image brands. However,
high source credibility should aid the perceived quality o f low image brands more than
high image brands, leading to an interaction.
Brand. Brand has been defined as a name, term, sign, symbol, design, or
combination of these elements, intended to identify goods and services and to
differentiate them from the those o f competitors (Keller 1993). Brand is a well-
recognized extrinsic quality cue for products (Dawar and Parker 1994; Zeithaml 1988;
Aaker 1996). With reference to TPO endorsement, an intriguing question is what would
happen if a respected TPO endorsed a brand the consumer did not highly value? That
is, the two cues would be in conflict, suggesting cognitive dissonance. How will the
dissonance be resolved? The direction of resolution is predicted by congruity theory
(Osgood and Tannebaum 1955). This theory has been used to explain the results of
pairing a celebrity endorser with a product that is incongruous with his image.
The linkage of a highly-valued object to a low-valued object resulted in a loss of
value to the highly-valued object and a rise in value to the low-valued object (Jacoby
and Mazursky 1984). However, the magnitude o f change was not equal for the two
elements; change is inversely proportional to the degree o f attitude polarization. For
36
Reproduced with permission of the copyright owner. Further reproduction prohibited without permission.

example, if consumers valued the opinion o f PC Magazine more than they disliked a
brand endorsed by PC Magazine, then the value o f the brand would rise more than the
value o f PC Magazine would fall. Alternatively, the consumer may revise his valuation
of the brand by attributing the valuation discrepancy to product revision or incorrect
product usage on his part in a prior encounter. The opposite scenario, endorsement o f a
highly-valued brand, would reinforce the consumer’s present attitude, but it may be
given little attention by consumers since it would be expected.
An alternative explanation for the result o f incongruous brand/TPO endorsement
pairings is suggested by the work o f Wu and Shaffer (1987). These authors argue that
consumers with direct versus indirect brand experience will differ in their susceptibility
to a counterattitudinal message. That is, an attitude formed by direct experience is
believed to be more clearly and confidently held than an attitude formed on the basis of
hearsay. Accordingly, direct experience attitudes are believed to be more resistant to
counterattitudinal influence. Conversely, the attitudes o f indirect experience consumers
may be more affected by other factors (such as source credibility) than are the attitudes
held by direct experience consumers.
The work o f Wu and Shaffer (1987) thus provides a rationale for an interaction
hypothesis. That is, if brands are classified into high and low image, consumers may be
less likely to have direct experience with low image brands because they are perceived
to not perform well. This particular subject group may be susceptible to the persuasive
influence of positive endorsements by TPO’s o f high source credibility, such that the
increase in perceived quality going from celebrity endorsement to TPO endorsement is
greater for low image brands than for high image brands (later stated formally as
37
Reproduced with permission of the copyright owner. Further reproduction prohibited without permission.

hypothesis S). Again, the explanation is that attitudes formed from indirect experience
are less highly valenced than attitudes formed as the result o f direct experience.
Recent investigations into attitude correction could perhaps be applied to explaining
how TPO endorsement o f a low image brand (an incongruous pairing) could result in
subjects holding a favorable attitude toward the brand. As stated above, subjects may
hold a low opinion o f a brand based on word-of-mouth or other non-direct experience.
The discrepancy between the TPO endorsement and the subject’s initial attitude toward
the brand may prompt the subject to review this initial attitude for bias. Bias would
include attitude formation based on irrelevant (contextual) data, inappropriate
inferences, or overlooked crucial data. People are generally inclined to review their
attitudes because they prefer to hold views that are free from bias (Petty and Wegener
1993).
It has been found that subjects will only undertake to correct their attitudes if three
conditions are met (Myers-Levy and Malaviya 1999). These conditions include: 1)
awareness of possible bias in judgement, 2) identification o f a "naive theory" o f how
and to what extent the bias affected judgement, and 3) a willingness to expend cognitive
resources to correct the judgement. Judgement correction is often extreme and in the
opposite direction to that suggested by the bias (Myers-Levy and Malaviya 1999).
Combining the streams of thought from Wu and Shaffer (1987) and Myers-Levy and
Malaviya (1999), it may be suggested that TPO endorsement could serve to make a
subject question the accuracy o f his brand judgement, and that subjects could attribute
lack of direct experience with a brand as a biasing condition in their brand judgement.
Further, TPO endorsements are more likely to be used to advertise expensive products
38
Reproduced with permission of the copyright owner. Further reproduction prohibited without permission.

rather than inexpensive ones, suggesting that potential purchasers would be willing to
expend cognitive resources to correct their brand attitudes. Thus, an incongruous TPO
endorsement/ brand pairing may satisfy the three conditions needed for attitude
correction. Additionally, overcorrection of attitudes is typical, suggesting in the present
case that product quality perception o f low image brands may be significantly enhanced
in the presence of credible TPO endorsement. Attitude correction, then, could be a
mechanism to explain and support the aforementioned interaction o f brand image and
TPO endorsement (hypothesis 5).
Product. The last independent variable is product. There are basic differences
between the two forms o f product (goods and services). For example, services are
characterized by intangibility, heterogeneity, and inseparability (Zeithaml,
Parasuraman, and Berry 1985). These characteristics imply that: a) services can not be
quality inspected in advance o f sale, b) services can not be quality engineered at a
manufacturing plant, and c) quality evaluation is made on both the process o f service
delivery as well as the outcome o f a service (Parasuraman, Zeithaml, and Berry 1985).
These latter authors go on to note that service quality is more difficult to evaluate than
product quality. That is, tangible service quality cues may be limited to physical
facilities and equipment, suggesting that intangible (extrinsic) quality cues may be
relied upon to a greater extent in evaluating services than goods.
The purchase of services poses other uncertainties, in addition to quality. These
include (Murray and Schlacter 1990): 1) a variable price (especially in repair service
because the extent o f damage may not be known prior to the start o f service), and 2)
increased opportunity for embarrassing, distressing, or frustrating interactions with
39
Reproduced with permission of the copyright owner. Further reproduction prohibited without permission.

service personnel. In sum, it is the benefit variability inherent in service offerings that
increases the purchase risk o f service above that o f tangible goods. A central theme of
this thesis is that TPO endorsement functions as an extrinsic quality cue to give
consumers information that lowers their purchase risk o f service purchase.
Accordingly, the means-end chain analysis would argue that consumers would find
TPO endorsement to be valuable because it provides diagnostic information that is
otherwise difficult to acquire. Consistent with the means-end chain, the value of the
cue would be greater for services than goods and greater for expensive items than low-
cost items.
Hypotheses
This investigation will compare the effects o f advertisements containing no
endorsement, celebrity endorsement, or TPO endorsement on subject perceptions o f the
product and the ad. This basic experimental design allows comparisons between
advertisements containing endorsements versus no endorsements, and between
endorsements believed to work through the process o f identification (celebrities) versus
endorsements believed to work through the process of internalization (TPOs). It is
hypothesized that mean product and ad perceptions will fall in the following order: no
endorsement, celebrity endorsement, and TPO endorsement (from least favorable to
most favorable). Response differences between celebrity endorsements and the no
endorsement condition are not hypothesized. However, mean response for ads
containing TPO endorsement is expected to be significantly more favorable than the
means for celebrity endorsements or no endorsements. There are multiple arguments for
this hypothesis. First, Friedman and Friedman (1979) have argued that celebrity
40
Reproduced with permission of the copyright owner. Further reproduction prohibited without permission.

endorsements work through the process of identification, and that they are most
appropriate for products high in the psychological or social subdimensions o f risk.
Conversely, expert endorsers (and TPO endorsers by extension) are believed to work
through internalization, and they are probably best suited for products high in financial,
performance, and/or physical risk. Working with four types o f endorsements (celebrity,
expert, typical consumer, and no endorsement) and three types of products (vacuum
cleaner, cookies and costume jewelry), the Friedmans hypothesized and found a highly
significant endorser by product interaction. Their expert endorser was able to enhance
the perception o f the vacuum cleaner product, but not cookies or costume jewelry.
Cookie perceptions were increased most by the typical consumer endorser while the
celebrity was most effective endorsing costume jewelry. The products chosen to
operationalize this study are believed to rank relatively high on the performance and
financial subdimensions of risk (and this is consistent with the products TPO
endorsements are currently used to advertise). The above suggests that responses in this
study will be less favorable for celebrity endorsements as compared to TPO
endorsements.
There are additional arguments to suggest that TPO endorsements will outperform
celebrity endorsements in this investigation. O’Mahony and Meenaghan (1997/98)
found that celebrity endorsements generally had low believability. Conversely, TPO
endorsements should be perceived as more trustworthy than celebrity endorsements
(based on the TPO being an external source o f information and a bonding loss accruing
mostly to the TPO rather than the marketer). Intuitively, TPOs should be perceived as
having more expertise than celebrities. Also, from a search theory perspective, the
41
Reproduced with permission of the copyright owner. Further reproduction prohibited without permission.

information provided in a summary TPO endorsement (e.g. rating/ranking on a
comparative dimension) should be more appealing to consumers than a celebrity
endorsement. Additionally, from cognitive response theory, arguments have been
presented suggesting that endorsing TPOs may be perceived as trustworthy and expert,
implying that TPO endorsement will result in less source derogation or counterargument
generation by message recipients than some other sources. The no endorsement
condition will contain the least information, therefore, it is expected to result in the least
favorable responses. The above discussion leads to the following main effect
hypothesis:
H 1: Subjects exposed to an ad containing a highly credible third partyorganization endorsement for a brand will show higher scores on measures o f perceived quality (PQ), perceived uniqueness (PU), attitude toward the manufacturer (ATTM), information value (TV), and lower scores on purchase risk (PR) than will subjects exposed to either a highly credible celebrity endorsement or a no-endorsement ad for the same brand.
Based on earlier discussions o f source credibility, it is proposed that
manipulation o f source trustworthiness (expertise will not be manipulated) will
result in changes in perceived information value o f the endorsement and attitude toward
the endorser. Specifically, disclosure that the third-party endorser is a for-profit
organization, accepts donation from manufacturers of items to be evaluated for
endorsement, and accepts advertising from manufacturers o f goods that are or
potentially could be evaluated for endorsement will result in lower perceived
information value and attitude toward the endorser by consumers compared to
disclosure that an endorser is a non-profit organization and accepts no advertising or
donation of goods from manufacturers. The rationale for this hypothesis is that
42
Reproduced with permission of the copyright owner. Further reproduction prohibited without permission.

diminished trustworthiness will result in source derogation argument generation by the
message recipient. That is, diminished trust will act as a signal that the TPO may not
have the best interests of the consumer in mind. This leads to the following main effect
hypothesis:
H2a: Subjects exposed to a highly credible third party organizationendorsement for a brand will show higher scores on measures o f information value (IV) and attitude toward the endorser (ATTE) than will subjects exposed to a third party organization endorsement o f low credibility for the same brand.
More specific effects of source credibility may be hypothesized. High source
credibility should lead to fewer source derogation arguments being generated and a
greater acceptance o f the endorsement communication. Thus, highly credible TPO
endorsements should result in enhanced product quality perceptions compared to
endorsements o f low credibility:
H2b: Subjects exposed to a third party organization endorsement froma highly credible source will show higher scores on measures of perceived quality (PQ), perceived uniqueness (PU), attitude toward the manufacturer (ATTM), and lower scores on purchase risk (PR) than will subjects exposed to a third party organization endorsement of low credibility for the same brand.
Additionally, subjects exposed to a TPO endorsement of low credibility may exhibit
a "boomerang" effect due to the apparent insincerity o f the ad. That is, subjects may
generate negative affect and/or cognitions about the ad and form attitudes about the
product that are in the opposite direction to that intended by the marketer (e.g., a highly
insincere ad leading to a negative perception o f the product). Similar "boomerang"
effects have been explained in psychology by reactance theory (Brehm 1966). This
leads to the following hypothesis:
43
Reproduced with permission of the copyright owner. Further reproduction prohibited without permission.

H2c: Subjects exposed to an ad containing a third party organizationendorsement o f low credibility will show lower scores on measures of perceived quality (PQ), perceived uniqueness (PU), and attitude toward the manufacturer (ATTM) than subjects exposed to a similar ad for the same brand not containing an endorsement.
Brands vary in their perceived ability to deliver a desired consumption experience.
More specifically, consumers look to brand as a signal of product quality (Hite, Hite,
and Minor 1991). This suggests that a high image brand may be perceived to rank
higher on perceived quality, perceived uniqueness, and attitude toward the brand than a
low image brand. Thus, the following main effect hypothesis is offered:
H3: Subjects exposed to an ad for a high image brand will show higherscores on measures o f perceived quality (PQ), perceived uniqueness (PU), and attitude toward the manufacturer (ATTM), and lower scores on purchase risk (PR) than subjects exposed to an ad for a low image brand.
It may be expected that consumers will evaluate product endorsers to determine if
the endorsement can be attributed to an ulterior motive. If the receiver believes the
endorser (communicator) to be biased, the effectiveness of the endorsement may be lost.
Thus, endorsements of perceived low credibility (low trustworthiness) may result in
more source derogation argument generation by the receiver than endorsements o f high
credibility. Additionally, unless the receiver has a pre-existing favorable opinion
toward the product, a source o f low credibility will probably result in the generation o f
fewer support arguments and more counterarguments than a source o f high credibility.
Based on the above, the following main effect hypothesis is offered:
H4: Subjects exposed to a credible endorsement for a brand will showhigher scores on measures o f perceived quality (PQ), perceived uniqueness (PU), and attitude toward the manufacturer (ATTM), and lower scores on measures of purchase risk (PR) than subjects exposed to an endorsement for the same brand with low credibility.
44
Reproduced with permission of the copyright owner. Further reproduction prohibited without permission.

It is possible that consumers may not highly value a brand that deserves their
consideration. The may occur because the consumer is not aware of the brand, or for
other reasons. The work of Wu and Shafer (1987) suggests that consumers who lack
direct experience with a brand and hold an unfavorable opinion o f the brand are more
susceptible to counterattitudinal influence than are consumers with direct brand
experience. Also, it has been argued that viewing a credible TPO endorsement may
prompt and facilitate brand attitude correction. It is suggested, here, that TPO
endorsement of a brand with an unknown or less favorable reputation may raise quality
perceptions o f an unknown brand to a greater extent than the quality perceptions o f a
high image brand will be raised. The rationale is that few consumers will have direct
experience with the low image brand (because they perceive low quality) and therefore
they will be more susceptible to a counterattitudinal influence. This leads to the
following interaction hypothesis:
H5: Endorsement cue will interact with brand image cue such that theincrease in mean response, going from celebrity endorsement to TPO endorsement, on the dependent variables o f perceived quality (PQ), perceived uniqueness (PU), and attitude toward the manufacturer (ATTM), will be greater for low image than high image brands.
As previously stated, consumers look to brand as a signal o f product quality (Hite,
Hite, and Minor 1991). Ads for high image brands should induce less
counterargumentation in the minds o f consumers than ads for low image brands.
Additionally, ads with low credibility should result in more source derogation argument
generation than ads with high credibility. The joint effect o f the two factors should be
that high source credibility aids the perceived quality of low image brands more than it
aids the perceived quality of high image brands. Stated alternatively, low source
45
Reproduced with permission of the copyright owner. Further reproduction prohibited without permission.

credibility may damage the perceived quality o f low image brands more than it impairs
the perceived quality o f high image brands . This leads to the following interaction
hypothesis:
H6: Source credibility cue will interact with brand image cue such thatthe increase in mean response, going from low credibility to high credibility on the dependent variables o f perceived quality (PQ), perceived uniqueness (PU), and attitude toward the manufacturer (ATTM) will be greater for low-image brands than high-image brands.
46
Reproduced with permission of the copyright owner. Further reproduction prohibited without permission.
CHAPTER 3: PRETESTING AND EXPERIMENTS
Two experiments (each 3 X 2 X 2 unbalanced designs) were conducted as main
studies, preceded by three pretests. The purpose of the pretests was to choose the
appropriate operationalization of the independent variables so that the hypothesized
effects may be revealed. There was one experiment each for a tangible good and a
service. Each pretest and experiment will be described in more detail later. In all cases,
university students enrolled in undergraduate business courses were used as subjects;
they each received extra credit for their participation. General criteria for the selection
o f the good and service to be used as advertising stimuli include the following: 1) the
products should be familiar to typical university students, 2) the products should have
evaluative dimensions that are more objective than subjective, and 3) the marketplace
offerings in the product class should be differentiated from each other (that is, not
commodities).
This chapter begins by defining the dependent variables that are hypothesized to be
affected by TPO endorsements in advertising and moderated by the effects of TPO
credibility and brand image. Next, the three pretests are described. Then the two
experiments are outlined, along with the measurement instruments and experimental
stimuli.
Dependent Variables
As stated previously, TPO endorsement is hypothesized to affect consumer
perceptions o f both the product and the ad. Accordingly, dependent variables have been
chosen to reflect these two broad areas o f effect. The dependent variables break into
two logical groups, a "product" group and an "endorsement" group. The product group
47
Reproduced with permission of the copyright owner. Further reproduction prohibited without permission.

consists of: perceived product quality, perceived product uniqueness, attitude toward the
manufacturer, and perceived risk o f purchase. The endorsement group includes:
information (ad) value, and attitude toward the endorser. The ability o f TPO
endorsements to stimulate favorable responses on these variables should be of interest to
marketers.
Perceived product quality (PQ) is defined as the anticipated degree to which a
product, relative to alternatives, will provide a desired consumption experience.
Consumer perceptions o f product quality are considered to be a pivotal determinant o f
shopping behavior and product choice (Zeithaml 1988). Perceived product uniqueness
(PU) is defined as the degree to which consumers feel the brand/product is different
from competing brands/products. Differentiation is central to the brand-building
process (Aaker 1996). Attitude toward the manufacturer (ATTM) is defined as the
degree to which the manufacturer is held in high regard, is trusted by, and respected by
consumers relative to other manufacturers in its product category. Attitude toward the
manufacturer may be a higher-level construct summarizing brand equity related
variables. Perceived risk o f purchase (PR) is defined as the level of uncertainty about
the outcome and consequences (performance and financial) of product purchase. It may
be noted that perceived risk is moderated by the ability of the individual to absorb a
monetary loss, which is dependent upon the individual’s current and future wealth
(Dowling and Staelin 1994).
Information value (IV) is defined as the degree to which provided information
completes the information search process for the consumer and saves the consumer time
and effort in foregoing additional search. A perceived inadequacy o f information would
48
Reproduced with permission of the copyright owner. Further reproduction prohibited without permission.

likely impede progression toward product purchase in the Lavidge-Steiner model
(Lavidge and Steiner 1961). The last variable, attitude toward the endorser (ATTE), is
defined as the degree to which the endorser is held in high regard, is trusted by, and
respected by consumers. This measure may reflect the overall level o f source credibility
o f the endorser.
The two groups o f dependent variables may be analyzed separately in MANOVA. A
schematic of the effects o f independent variables on the dependent variables is shown in
Figure 3.1.
Pretest One
Description. The objective of this pre-test was to screen a variety o f goods and
services to help select appropriate products for the main studies. Screening criteria
included: 1) perceived risk of choosing the wrong brand within the product class, 2)
perceived range o f quality among marketplace offerings for the product class, and 3)
familiarity with marketplace offerings for the product class. In the ideal case, products
chosen for this study should rank high on all three dimensions. A high ranking on risk
is desirable because the theoretic ability o f TPO endorsement to lower purchase risk is
the central proposition in this study, and risk reduction can only be demonstrated if the
product has an initial risk value above a baseline level. It is primarily the financial and
performance components o f risk that are the focus of this study. The next dimension,
range of quality, attempts to measure the performance component. The third dimension,
familiarity, is measured to ensure that subjects have some purchase experience with the
product class. Purchase risk was considered to be the most important dimension.
49
Reproduced with permission of the copyright owner. Further reproduction prohibited without permission.

Third-Party OrganizationEndorsement o f Product
Moderators:
Credibility o f the TPO Brand Associations Product Type
Product Set o f Variables: Endorsement Set o f Variables:
Perceived Quality Ad (information) valuePerceived Uniqueness Attitude Toward the EndorserAttitude Toward the ManufacturerPerceived Risk of Purchase
FIGURE 3.1SCHEMATIC OF EFFECTS OF TPO ENDORSEMENT
AND MODERATORS ON SELECTED DEPENDENT VARIABLES
50
Reproduced with permission of the copyright owner. Further reproduction prohibited without permission.
Subjects were presented with eleven product class designations: personal computer,
digital camera, pocket calculator (non-graphing), television set, automobile insurance,
internet service, credit card, optometry service (exam plus eyewear), cell phone service,
gym (fitness club) membership, and auto muffler replacement. These particular goods
and services were selected for screening because they were advertised in publications
distributed on campus, or were otherwise thought to be familiar to a university student
population. A blank questionnaire from Pretest 1 is included as Appendix A.
Measures and Analysis. Subjects rated each of the eleven product classes on each of
three dimensions (risk, range o f quality, familiarity) using single, 7-point semantic
differential scales. Data were received from 35 students, although two questionnaires
were incomplete (listwise n = 33). For each scale, the mean, standard deviation, and
one-sample t-test (using the scale mid-point of 4 as the test value) were computed.
Scale means are shown in Table 3.1. For each of the three dimensions, the eleven
product class means were ranked from highest to lowest, and a range of means for the
dimension was determined.
Findings and Conclusions. The familiarity dimension had the largest range of means
(6.37 to 2.46), followed by risk (5.77 to 2.40), and then quality (5.77 to 4.37). Some of
the perceived risk means did not make intuitive sense. For example, the second highest
rated product on the risk dimension was a credit card - a product which many would
consider to be a commodity and not particularly associated with financial or
performance risk. Also, television sets were rated as the product having the highest
range of quality, but this product class ranked third from the bottom on the risk
dimension. Television sets are not inexpensive and so this finding was unexpected.
51
Reproduced with permission of the copyright owner. Further reproduction prohibited without permission.

TABLE 3.1RESPONSE TO PRODUCTS
PRETEST ONE (n = 33 LISTWISE)
Product Class Familiarity Range of Quality Purchase Risk
5.71*** 5.71** 4.77**Personal Computer 1.34b 1.20 1.50
3.06** 4.60* 4.11Digital Camera 1.86 1.59 1.66
Pocket Calculator (non-graphing)
6.31**1.28
5.08**2.01
2.40**1.79
6.37** 5.77** 3.37*Television Set 1.00 1.26 1.66
4.11 4.60* 5.77**Auto Insurance 2.11 1.72 1.24
5.31** 5.09** 3.88Internet Service 1.81 1.27 1.84
5.42** 4.71* 5.48**Credit Card 1.65 1.79 1.65
Optometry Service (exam and eyewear)
3.202.36
4.571.87
4.441.97
3.97 5.08** 4.57*Cell Phone Service 2.37 1.31 1.56
Gym (fitness club) Membership
4.232.26
4.371.83
3.20**1.67
Auto Muffler Replacement
2.46**1.92
4.441.73
4.351.43
“Meanb Standard Deviation* indicates p < .05, ** indicates p < .01 significance of t-value in one-sample
t-test with the scale midpoint o f four as the test value.
52
Reproduced with permission of the copyright owner. Further reproduction prohibited without permission.

Of the eleven products screened, the tangible good with the highest risk mean was
the personal computer (PC). The PC had the second highest ranking on range of
quality, and its familiarity was also high. One sample t-test indicated that the PC means
for all three dimensions were significantly (p < .01) greater than the scale midpoint o f 4.
Thus, the PC appeared to meet the criteria to be selected as a test product for the main
study. The highest rated service on the risk dimension was auto insurance. This
product scored in about the middle o f the range on the quality and familiarity
dimensions. One sample t-test revealed that the auto insurance means for risk and range
of quality were significantly (p < .05) greater than 4. However, auto insurance did not
score significantly different from 4 on the familiarity dimension. Some consideration
was given to moving on to the next highest rated service on the risk dimension (credit
card), but this product was intuitively unappealing and there was a precipitous drop in
risk score to the next service product. Therefore, auto insurance appeared to be the best
overall choice as a service product for the main study.
Pretest Two
Description. The objective o f this pre-test was to screen brands of personal
computers and auto insurance for brand image in order to operationalize the (high,low)
brand image variable in the main studies. Additionally, the operationalization o f the
TPO credibility variable (high,low) was tested, and TPO names were screened for
familiarity and the expectation that the TPOs would publish product reviews of personal
computers and auto insurance.
Subjects were presented with the brand names o f 9 personal computers and 10 auto
insurers and asked to rate each brand on a 7-point semantic differential scale o f brand
53
Reproduced with permission of the copyright owner. Further reproduction prohibited without permission.
image. Brand image was defined in the instructions as “your awareness o f the brand,
the degree to which you would consider buying one brand over others, and the degree to
which you would recommend one brand over others.” For each brand, the mean,
standard deviation, and one sample t-test (using the scale midpoint o f 4 as the test value)
was computed. Brands were then ranked from highest to lowest on brand image.
For credibility operationalization, subjects were presented with three descriptions o f
TPOs and asked to rate each on a 7-point semantic differential scale. The first
description was that o f a non-profit TPO that refused paid advertising and product
donation. The second description was that o f a for-profit TPO that willingly accepted
paid advertising and product donation o f items to be evaluated. The third description
was that o f a for-profit TPO that not only accepted paid advertising and product
donation but also payments of an undisclosed amount from the National Association o f
Manufacturers to assist the organization in its “mission to inform the public” about
goods and services.
Finally, subjects were presented with five TPO names and asked to rate each on its
familiarity and the degree to which the subject would expect to see product reviews
about personal computers and auto insurance in the TPO’s magazine. The five TPO
names were: Consumer Reports, Consumer’s Digest, Consumers ’ Review, Roper's
Shopping Guide, and Best's Product Review. A blank questionnaire from Pretest 2 is
included as Appendix B.
Findings and Conclusions. Data were collected from 45 students, although two
questionnaires were incomplete (listwise n = 43). Ranking of the brand image means
revealed that the brands segregated into three groups, and this was true for both personal
54
Reproduced with permission of the copyright owner. Further reproduction prohibited without permission.

computers and auto insurance. For example, personal computers had three brands in the
6.00 to 5.75 group, followed by three brands in the 5.11 to 4.62 group, then three brands
in the 3.33 to 2.73 group. Auto insurance had two brands in the 6.27 to 6.00 group,
followed by three brands in the 5.18 to 4.60 group, then five brands in the 2.98 to 2.62
group. Brand image means are shown in Table 3.2.
In choosing brands to operationalize the image variable, consideration was given to
the fact that the hypotheses predict that endorsement from a credible TPO will enhance
quality perception. Therefore, brands must be chosen that are "high" but not so high as
to encounter a "ceiling" effect - meaning that TPO endorsement may not be able to
enhance quality perception o f a brand that is already perceived as very high quality.
Accordingly, a decision was made to select "high" brands from the middle group of
brand rankings. The middle group in both product categories contained three brands,
and so the middle brand of the middle groups was chosen as the "high" image brand.
To maximize the difference between the chosen brands, the lowest ranking brands in
both product categories were chosen as the "low" image brands. For personal
computers, the means for the high and low brands were 5.02 (Hewlett-Packard) and
2.73 (Acer), respectively. The corresponding means for auto insurance were 4.69
(GEICO) and 2.62 (Shelter), respectively.
The means for the three TPO credibility operationalizations (in the same sequence as
described above) were 6.24, 3.64, and 3.53, respectively. Paired t-test differences
between the means of operationalizations 1 and 2 (t=l 0.039), and 1 and 3 (t=8.421)
were both significant (p<.001). The difference between 2 and 3 was not significant
(t=.466). Operationalization 2 was chosen over operationalization 3 to be the "low"
55
Reproduced with permission of the copyright owner. Further reproduction prohibited without permission.

TABLE 3.2RESPONSE TO BRANDS
PRETEST TWO (n = 43 LISTWISE)
Brand Mean Image Score Standard Deviation
Dell 6.00** 1.51
E-Machines 2.86** 1.45
Hewlett-Packard 5.02** 1.48
IBM 5.75** 1.31
NEC 3.33** 1.65
Compaq 5.11** 1.53
Sony 4.62** 1.53
Acer 2.73** 1.62
Gateway 5.98** 1.44
Allstate 6.00** 0.90
Progressive 4.60* 1.70
American National 2.98** 1.37
Shelter 2.62** 1.53
GEICO 4.69* 1.77
State Farm 6.27** 1.19
AAA (Triple A) 5.18** 1.56
Safeco 2.78** 1.58
American Eagle 2.71** 1.62
Kemper 2.67** 1.65
* indicates p<.05, ** indicates p<.01 significance of one-sample t-test using the scale midpoint of four as test value.
56
Reproduced with permission of the copyright owner. Further reproduction prohibited without permission.

credibility operationalization because: a) the wording o f number 2 was more similar in
length to number 1 than was number 3, and b) being shorter in length, number 2
required fewer cognitive resources to process than number 3. Credibility means are
shown in Table 3.3.
O f the five TPO names presented to subjects, three were real TPOs whereas two
were fictional. That is, Consumer Reports, Consumer’s Digest, and Consumers ’ Review
are real-life TPOs that publish magazines while Roper’s Shopping Guide and B est’s
Product Review are fictional. When ranked on familiarity, the TPO names appeared to
segregate into two groups, a better know group o f two (means o f 5.80 and 4.67) and a
mostly unknown group o f three (means from 2.76 to 2.40). Clearly, subjects were able
to distinguish between real-life TPOs and fictional TPOs since the better known group
consisted of Consumer Reports magazine and Consumer's Digest magazine. The
expectations of subjects to see reviews o f personal computers and auto insurance in
these publications generally paralleled their familiarity responses. That is, expectations
were higher for Consumer Reports and Consumer’s Digest than the other TPO names.
In choosing a TPO name for the main studies, consideration was given to the fact
that: a) a familiar name and expectation o f product review would enhance the "high"
credibility manipulation, b) however, a too familiar name may complicate the "low"
credibility manipulation because it would be unbelievable, and c) the failure o f
Peterson, Wilson and Brown (1992) to demonstrate an effect for TPO endorsement may
have been due to the use o f a fictional TPO name and/or problems with credibility.
Therefore, Consumer’s Digest was selected as an appropriate TPO name because it is
57
Reproduced with permission of the copyright owner. Further reproduction prohibited without permission.

TABLE 33RESPONSE TO CREDIBILITY OPERATIONALIZATION
PRETEST TWO (n = 43 LISTWISE)
TPO Description Mean Credibility Standard Deviation
Non-Profit Organization, refuses advertising and product donation
6.24** 0.91
For-Profit Organization, accepts advertising and product donation
3.64 1.35
For-Profit Organization, accepts advertising and product donation and cash payments from manufacturers
3.53 1.75
** indicates p<.01 significance o f t-value for one-sample t-test using scalemidpoint of four as test value.
somewhat familiar but not too familiar, and because the expectations of seeing personal
computer and auto insurance product reviews in Consumer's Digest were significantly
greater than 4 (the scale midpoint). Data from TPO name testing (familiarity and
expectations to see product reviews) are shown in Table 3.4.
Pretest Three
Description. The objective o f this pre-test was to screen a variety o f names o f famous
people for familiarity, and the degree to which each celebrity would be effective in
endorsing (selling) personal computers and auto insurance. The first criterion,
familiarity, was defined as recognition of name and occupation, and possibly recall of
face. The second criterion, effectiveness, was an attempt to measure the "match"
between celebrity image and the product being endorsed. To appropriately
58
Reproduced with permission of the copyright owner. Further reproduction prohibited without permission.

TABLE 3.4RESPONSE TO TPO NAMES
PRETEST TWO (n = 43 LISTWISE)
TPO Name Familiarity Expectation to see Personal Computer Product review
Expectation to see Auto Insurance Product Review
Consumer Reports 5.801** 6.04** 4.80**Magazine 1.55b 1.17 1.90
Consumer’s Digest 4.67** 4.98** 4.42*Magazine 1.55 1.22 1.39
Consumers’ Review 2.76** 4.49* 3.96Magazine 1.43 1.31 1.61
Roper’s Shopping Guide 2.40** 3.87 3.47*1.59 1.47 1.65
Best’s Product Review 2.47** 3.98 3.18**1.56 1.57 1.64
‘ Meanb Standard Deviation * indicates p<-05,** indicates p<.01 significance of t-value for one-sample t-test using scale midpoint
o f four as test value.
operationalize a celebrity endorsement, there should be a compatible match. A list of 10
names was generated by asking a convenience sample of students, “Can you think of
any celebrity that would be effective in selling a personal computer (auto insurance) by
endorsing the computer (auto insurance) in an advertisement?” Subjects were then
presented with the 10 names and asked to rate each on 7-point semantic differential
scales for familiarity, effectiveness in endorsing (selling) a personal computer, and
effectiveness in endorsing (selling) auto insurance. Additionally, the questionnaire
contained two open-ended questions to allow subjects to nominate any celebrity they
felt would be effective in endorsing (selling) personal computers or auto insurance. For
59
Reproduced with permission of the copyright owner. Further reproduction prohibited without permission.

each celebrity name, the mean, standard deviation, and one-sample t-test (using the
scale mid-point o f 4 as the test value) was computed. Celebrities were then ranked from
highest to lowest on familiarity, effectiveness in endorsing (selling) a personal
computer, and effectiveness in endorsing (selling) auto insurance. A blank
questionnaire from Pretest 3 in included as Appendix C.
Findings and Conclusions. Data were collected from 44 students, although two
questionnaires were incomplete (listwise n = 42). On the familiarity criterion, none of
the celebrity names were significantly below the scale mid-point o f 4. However, the
range of means on this dimension was rather wide (6.88 to 3.84). The range of means
for the same celebrities on the effectiveness in selling (endorsing) a personal computer
was also rather wide (4.91 to 1.63). Since the same list o f names was used on all three
dimensions, a wide range of means is expected. That is, a celebrity perceived as
effective in endorsing auto insurance would probably not be perceived as effective in
endorsing computers because the image o f a single celebrity is unlikely to be
appropriate to both products. Conversely, the range of means for the effectiveness in
endorsing auto insurance was relatively narrow (4.11 to 3.05). Also, none o f the
celebrities had means for effectiveness in endorsing auto insurance that were
significantly greater than the scale mid-point o f 4, while three celebrities had means for
computer endorsement that were significantly greater than 4. The means for pretest 3
are reported in Table 3.5.
Of the celebrities listed, Tom Brokaw was perceived to be the most effective
endorser of personal computers. Brokaw’s means for both familiarity and effectiveness
60
Reproduced with permission of the copyright owner. Further reproduction prohibited without permission.

in endorsing a personal computer were significantly greater than 4. For auto insurance,
Mario Andretti had the highest mean effectiveness in endorsing auto insurance.
TABLE 3.5 RESPONSE TO CELEBRITIES
PRETEST THREE (n = 42 LISTWISE)
Celebrity Familiarity Computer Auto InsuranceEndorsement EndorsementEffectiveness Effectiveness
Peter Jennings 5.82’** 4.73** 3.931.45b 1.68 1.62
Tom Brokaw 6.20** 4.91** 3.981.02 1.71 1.58
Dan Rather 6.09** 4.70* 3.821.43 1.87 1.72
Barbara Walters 6.73** 4.28 3.660.87 1.88 1.72
Hugh Downs 4.86* 3.48 3.05**2.34 2.11 1.63
Mario Andretti 4.20 2.14** 4.112.19 1.53 2.53
Richard Petty 3.84 1.86** 3.25*2.32 1.47 2.46
Jay Leno 6.89** 3.23** 3.27**0.32 1.74 1.59
Alex Trebek 6.77** 4.52 3.45*0.68 2.10 1.66
Evel Knevel 4.55 1.63* 3.752.17 1.40 2.50
’Meanb Standard Deviation* indicates p < .05, ** indicates p < .01 significance o f t-value for one-sample t-test
using scale midpoint of four as test value.
61
Reproduced with permission of the copyright owner. Further reproduction prohibited without permission.

However, Andretti’s means for both familiarity and effectiveness in endorsing auto
insurance were not significantly different from 4. It is believed that Andretti’s auto
endorsement effectiveness would be higher if he were more familiar. Andretti, a
prominent race car driver in the 70’s and 80’s, is not well known to the current
generation o f university students. Still, he had the highest rated effectiveness in auto
endorsement, and it is believed that if Andretti is identified in the endorsement as an
Indy 500 winner (which is true), then he may be even more effective.
A variety o f other possible endorsers were nominated by subjects. The only name
that was mentioned by multiple respondents was Bill Gates as an endorser o f personal
computers. However, Mr. Gates may be both an expert and a celebrity. Expert
endorsers (and by extension TPO endorsement) are believed to function through the
process of internalization, while celebrity endorsers are believed to function through the
process of identification. Because the rationale in experimental design was to compare
the two processes, Mr. Gates (as an expert in computers) was deemed unsuitable.
Experiment One
Description. This is an investigation o f the effects o f TPO endorsement on the
perception o f a tangible good, a personal computer. A 3 (types o f endorsement) X 2
(levels o f brand image) X 2 (levels o f TPO source credibility) unbalanced design was
used (see Figure 3.2). The types o f endorsement were: a) mock ad containing no
endorsement, and b) mock ad containing a celebrity endorsement, and c) mock ad
containing an endorsement from a TPO. The levels o f source credibility were high and
low. The levels o f brand image were high and low. The unbalanced design relates to
the fact that source credibility was only manipulated in advertisements containing an
62
Reproduced with permission of the copyright owner. Further reproduction prohibited without permission.

HighCredibility
LowCredibility
No Credibility orEndorsementManipulation
HighImageBrand
TPOEndorsement
Cell#1
Cell#2
Cell#9Celebrity
EndorsementCell#5
Cell#6
TPO Cell CellEndorsement #3 #4
LowImage P a l l
V'Cll
Brand #10Celebrity Cell CellEndorsement #7 #8
FIGURE 3.2 EXPERIMENTAL DESIGN OF MAIN STUDIES
endorsement. Thus, two cells were missing from the full factorial design. The
dependent variables were perceived quality, perceived uniqueness, attitude toward the
manufacturer, perceived risk of purchase, information value, and attitude toward the
endorser.
The same intrinsic cues were included in all ad stimuli. To better isolate the
endorsement effect, extrinsic quality cues other than brand and endorsement (price,
country o f origin, warranty, and retailer name) were excluded. Source credibility o f the
63
Reproduced with permission of the copyright owner. Further reproduction prohibited without permission.

endorser was manipulated through disclosure o f information favorable or unfavorable to
the trustworthiness dimension. Subjects may assume a TPO would have sufficient
resources to hire experts, so it may be difficult to manipulate expertise. Rather, subjects
may be more willing to believe diminished trustworthiness than diminished expertise
for TPOs. Thus, TPO endorsers were described as having high credibility (refusing
paid advertising or product donations from manufacturers) or low credibility (accepting
advertising and donation o f products to be evaluated for endorsement from
manufacturers). Similarly, celebrity endorsers were described as accepting only a
nominal endorsement fee and purchasing the product with their own funds (high
credibility), or accepting the customary endorsement fee and receiving the product as a
gift (low credibility). The endorsement cue included the name o f the endorser (a real-
world person or organization) as part o f the ad.
Stimuli. Stimuli were presented individually to subjects as 8 by 9 inch black and
while advertisements stapled to the inside left panel of a manila file folder. The
questionnaire was stapled to the inside right o f the same folder permitting both the ad
and the questionnaire to be viewed at the same time. A total o f ten advertisements were
prepared, one for each cell in the experimental design. All ten ads contained a photo
image of a desktop personal computer, four intrinsic cues (statements about processor
speed, memory capacity, hard disk capacity, and modem speed), and the brand name
and logo. In other cells, additional information appeared (a celebrity endorsement o f the
PC, or a statement that the PC ranked first o f 11 brands/models tested by a TPO whose
credibility could be inferred to be either high or low depending on the manipulation).
The ten ad stimuli used in Experiment 1 are reproduced as Appendix D.
64
Reproduced with permission of the copyright owner. Further reproduction prohibited without permission.

Measurement Instruments. There were seven primary dependent variables in this
experiment. The scales for perceived quality (4 items), perceived uniqueness (4 items),
and attitude toward the manufacturer (4 items) were derived from a brand equity study
in progress. The scale for purchase risk (4 items) was constructed de novo, based on
face validity. The scale for information (ad) value (4 items) was adapted, in part, from
Aaker and Norris (1982). The scale o f attitude toward the endorser (4 items) is a
rewording o f the aforementioned attitude toward the manufacturer scale. Dependent
variables were multi-item averages for each scale. A copy of the questionnaire is
reproduced as Appendix E.
The survey instrument contained two additional scales as possible covariates in data
analysis. The scale for opinion seeking (4 items) was adapted from Flynn, Goldsmith,
and Eastman (1996). These authors conceptualized opinion seeking as a subset of
product information search. That is, opinions are sought in an effort to acquire non
biased information that facilitates the purchase task and reduces risk. The information
acquisition and risk reduction objectives o f opinion seeking may perhaps be satisfied by
the hypothesized functions o f TPO endorsements in advertising. That is, TPO
endorsements may summarize a comparison o f competing products on critical attributes
thereby providing information to the reader and reducing purchase risk. It was believed
that subjects scoring high in opinion seeking might be particularly attracted to TPO
endorsements.
A scale for a second possible covariate, involvement with product class, was also
included in the questionnaire. The involvement scale (5 items) is a modification of
Zaichowsky’s personal involvement inventory (Mittal 1995). Involvement with the
65
Reproduced with permission of the copyright owner. Further reproduction prohibited without permission.

product class may affect the subject’s knowledge acquisition and motivation to process
information about the product. These factors could moderate the effect o f TPO
endorsement on product quality perception.
Experiment Two
Description. This is an investigation of the effects o f TPO endorsement on the
perception o f a service, auto insurance. This study is similar to Experiment 1; it is also
a 3 X 2 X 2 unbalanced design with the same independent and dependent variables. As
in the first investigation, there is an absence o f extrinsic cues other than brand and
endorsement. Additionally, in this study, intrinsic cues are also absent. The same TPO
name is used in both experiments, and endorsement credibility manipulations are
similar to those in the first experiment. The ad stimuli, presentation o f stimuli, and
measurement instrument are also similar to the first study. The ad stimuli for the
second experiment are reproduced as Appendix F.
66
Reproduced with permission of the copyright owner. Further reproduction prohibited without permission.

CHAPTER FOUR: RESULTS AND HYPOTHESES TESTING
This chapter will discuss each of the two main studies in detail beginning first with
measurement issues, and then progressing to comparison o f groups and tests of
hypotheses.
Experiment One
Sample Size and Endorsement Manipulation Check. All 250 questionnaire folders
distributed were returned (25 folders per cell in the experimental design). However, 19
subjects missed the endorsement manipulation check. This was placed at the end o f the
questionnaire and asked the respondent to fold over the page containing the advertising
stimuli and recall from memory whether the ad contained an endorsement, whether the
endorser was a magazine or a person, and whether the endorser was non-profit or for-
profit. If the three answers, as a group, were incorrect/inconsistent, the folder was
removed from further consideration. Also, data in 2 folders were incomplete. In both
cases, an entire page o f responses was missing, suggesting that the subject had turned
two pages by mistake. With these 21 questionnaires deleted from further analysis, data
from 229 questionnaires were entered and this constituted the final sample (54.6%
female, 45.4% male). Each of the 10 experimental cells contained data from a
minimum of 20 to a maximum of 25 respondents. About 88% percent of subjects (201
of 229) reported having a computer for their own personal use, and 60% percent of
those who had a computer reported participation in the purchase choice of computer
brand and model.
Brand Image Manipulation Check. A separate survey item asked the respondent's
perception of the image o f the brand in the ad before exposure to the ad. Image was
67
Reproduced with permission of the copyright owner. Further reproduction prohibited without permission.

defined for the respondent as the degree to which they would consider purchase o f the
brand and recommend it to others. For the brand manipulation to work, respondents
should indicate higher intent to purchase and recommend the high image brand
compared to the low image brand. As evidence o f successful manipulation, brand
image means for subjects exposed to the high and low brands were, respectively, 5.20
and 2.58. These two groups were significantly different on the brand image variable
( t= 13.635, p < .001).
Credibility Manipulation Check. A third manipulation was credibility. This was
achieved through disclosure o f the relationship between the endorser and the
manufacturer. In the high credibility condition, the endorser (TPO or celebrity) did not
stand to gain anything from the endorsement, either directly or indirectly. In the low
credibility condition, the endorser had an obvious conflict o f interest. That is, the
endorser received money, advertising revenue, or product donations from the
manufacturer, and both parties stood to gain from the endorsement. Credibility
perception was checked by a series o f four questionnaire items that inquired about the
sincerity, believability, truthfulness, and honesty o f the ad/advertiser. From the
manipulation check, the means o f the high and low credibility groups were,
respectively, 5.01 and 4.48. Although the two groups are significantly different on this
variable (t = 2.795, p < .01), the difference is not as pronounced as in the brand
manipulation.
It is possible that some subjects interpreted the act of disclosure o f the relationship
between the advertiser and the endorser (non-profit or profit) to be a basis for inferring
honesty, even if the endorsement was motivated by profit. Since some subjects clearly
68
Reproduced with permission of the copyright owner. Further reproduction prohibited without permission.

interpreted the "low” credibility condition to be highly credible, and vice-versa, a better
method o f grouping subjects on the credibility variable was needed. Therefore, subjects
were post-hoc re-classified into high and low credibility conditions based on their
response to the four credibility check items rather than the ad stimulus they were
exposed to. If it occurred, re-classification was always into the mirror-image cell. That
is, re-classification only occurred into cells with the same endorsement and brand
conditions and the opposite pre-distribution credibility condition. Since credibility was
not manipulated in the control cells, subject re-classification into or out of these cells
did not occur. After re-classification, the mean difference between the two credibility
groups widened (means o f 5.84 and 3.75, respectively), and the t-test for the difference
between the means was more significant (t = 18.475, p < .001).
Preliminary Analysis. To screen for out-of-range data entries (e.g. an entry o f 77
instead of 7 for a 1 to 7 scale) and missing data, descriptive statistics on all 33
individual scale items were obtained. The number of observations and minimum and
maximum suggested an absence of obvious input errors for these variables.
Scales. It is desirable that measures be both unidimensional and internally
consistent. Unidimensionality (homogeneity) is demonstrated by the attainment of
simple structure in exploratory factor analysis (a single high loading for each item on
only one factor). If a scale is not unidimensional, then it is measuring something other
than just the construct of interest. Conversely, internal consistency is achieved by a
high degree o f item intercorrelation (measured by coefficient alpha). It is possible for a
scale to be internally consistent without being unidimensional.
69
Reproduced with permission of the copyright owner. Further reproduction prohibited without permission.

To assess unidimensionality, the 33 individual scale items from the 8 major variables
were entered into exploratory factor analysis with principal components extraction.
Since there was a priori reason to expect 8 factors underlying the 33 items, 8 factors
were requested with varimax rotation. The Bartlett test of sphericity (statistical
probability that the correlation matrix has significant correlations among the variables)
was high (p < .001), suggesting the appropriateness o f factor analysis for the variables
as a group. Additionally, the lowest individual measure of sampling adequacy for any
one variable was .75, well above the recommended minimum o f .50.
Examination of the rotated component matrix revealed a relatively simple structure
(scale items associated with only a single factor) except for two problematic variables.
One item from the information value scale (B4) crossloaded on the perceived quality
scale (loadings of .474 and .392 respectively). Also, one item from the perceived
uniqueness scale (Gl) crossloaded on the perceived quality scale (loadings of .579 and
.404, respectively. The communality o f item B4 was .446 (below the minimum
guideline o f .500), suggesting that deletion of the item was desirable. The communality
of Gl was .691 (well above the minimum), and this item was retained despite its lack of
ideal structure. Scales were computed as the mean of the individual items in the scale.
Reliability coefficients and number of items for the 8 scales in Experiment One are
shown in Table 4.1; they range from a low o f .8329 for information value to a high of
.9563 for opinion seeking. Pearson correlations among the scales are shown in Table
4.2. Note that the correlation between perceived risk and most other constructs in
negative. By definition, risk is a negative attribute; scale items were worded so that
70
Reproduced with permission of the copyright owner. Further reproduction prohibited without permission.

greater response values indicated more o f the negative attribute. These items were not
reverse coded to avoid the confusion o f having greater values mean less o f an attribute.
The distributions o f the 8 dependent variables were compared against the normal
distribution by the Kolmogorov-Smimov test (see Table 4.1). This test calculates the
mean and standard deviation from the sample and compares the cumulative sample
distribution function to the normal distribution function. Significant departures from
normality were found for variables PU, ATTM, IV, ATTE, OPSEEK, and ENVOL.
However, it is clear from looking at Table 4.1 that these variables fall into two groups:
moderate departure from normality (PU, ATTM, IV, and ATTE), and severe departure
(OPSEEK and INVOL). The significance o f the Kolmogorov-Smimov Z-value for the
latter variables was less than .001, indicating a highly non-normal distribution. The
scales o f OPSEEK and INVOL were included in the questionnaire as potential
covariates; these variables will be addressed in a later section. Any non-normality in
the distributions of the remaining variables is deemed to be within acceptable limits.
Preparation for MANOVA. The MANOVA procedure assumes independent
observations, equality o f variance-covariance matrices across treatment groups,
multivariate normality o f linear combinations o f dependent variables, and linearity and
multicollinearity among the dependent variables. The independence o f observations
issue is deferred since there is no test for determination of dependence. The equality of
variance issue will be addressed later with Box's test. Thus, this section is concerned
with multivariate normality and linearity among the dependent variables.
The assessment o f multivariate normality is problematic; there is no readily available
statistical test for this condition. However, as an alternative, the dependent variables of
71
Reproduced with permission of the copyright owner. Further reproduction prohibited without permission.

TABLE 4.1MEASUREMENT SCALES: EXPERIMENT ONE
Scale3 n Items Coefficient Alpha K-S Test Significance**PQ 229 4 .8669 .359
PU 229 4 .8353 .013
ATTM 229 4 .9209 .034
PR 229 4 .8762 .096
IV 229 3 .8329 .035
ATTE 181° 4 .9434 .040
OPSEEK 229 4 .9563 .000
INVOL 229 5 .9303 .000
“Scale abbreviations are as follows: perceived quality (PQ), perceived uniqueness (PU), attitude toward the manufacturer (ATTM), purchase risk (PR), information value (TV), attitude toward the endorser (ATTE), opinion seeking (OPSEEK), and involvement with product class (INVOL) bKolmogorov-Smimov Test for normality o f distribution 'Control cells were not exposed to ad stimuli containing an endorsement
perceived quality, perceived uniqueness, and attitude toward the manufacturer may be
regressed upon purchase risk and a scatterplot o f the standardized residuals versus the
predicted risk value may be visually evaluated for evidence of violation o f assumptions
as well as outliers. The pattern o f residuals should be random, with an equal dispersion
around zero and along the range o f predicted values (a null plot). There should be an
absence o f consistent curvilinear patterns or clustering. Additionally, the residual plot
may be examined for outliers. Consideration may be given to eliminating these cases
because they have a disproportionate impact on overall MANOVA results.
As a diagnostic procedure, perceived quality, perceived uniqueness, and attitude
toward the manufacturer were regressed upon purchase risk as the dependent variable
72
Reproduced with permission of the copyright owner. Further reproduction prohibited without permission.

TABLE 4.2CORRELATION AMONG DEPENDENT VARIABLES: EXPERIMENT ONE
PQ PU ATTM PR IV ATTE OPSEEK
PU .535s.000b
ATTM .455.000
.478
.000PR -.477
.000-.190.004
-.442.000
IV .537.000
.398
.000.438.000
-.322.000
ATTE .408.000
.441
.000.528.000
-.258.000
.375
.000OPSEEK .252
.000.153.020
.118
.074-.076.255
.097
.145.017.823
INVOL -.032.631
.012
.859.073.272
.024
.713.024.718
.088
.240-.052.433
“Pearson correlation coefficient btwo-tailed significance
using the enter method. The choice of purchase risk as the dependent variable was
intuitively appealing as this is the most logical outcome variable o f the set. A similar
diagnostic was not generated for the advertisement set o f dependent variables because
there would only be one independent variable.
Examination o f the residual scatterplot (standardized residuals versus predicted risk)
revealed an essentially null plot (see Figure 4.1). That is, there was a generally random
pattern of residuals with equal dispersion and an absence of curvilinear patterns. Only 1
o f the 229 cases had a standardized residual outside 2.5 standard deviations from the
mean. Given the solitary outlier, the subjective criteria for its identification, and the
possible attendant criticism o f overfitting the data if it were deleted, a decision was
made to retain this case.
73
Reproduced with permission of the copyright owner. Further reproduction prohibited without permission.

MANOVAs. Separate MANOVAs were run, one for the product set of dependent
variables (PQ, PU, ATTM, and PR), and one for the advertisement set of dependent
variables (IV and ATTE). In both cases, only the 8 cells in the full factorial portion of
the experimental design (n = 181) were included in the analysis.
a ° o ° t f e O 0 ■ o a
4 .5
Regression Adjusted (Press) Predicted Value
FIGURE 4.1EXAMINATION OF RESIDUALS FOR ASSUMPTIONS O F MANOVA
MANOVA for the Product Set o f Variables. For the product set, Box’s test was non
significant at p =. 358, indicating equality o f covariance matrices o f the dependent
variables across groups. Additionally, Bartlett’s test o f sphericity was significant at
p < .001, suggesting an adequate level o f correlation among the dependent measures.
With these two assumptions satisfied, attention was next turned toward the multivariate
results.
74
Reproduced with permission of the copyright owner. Further reproduction prohibited without permission.

The independent variables o f credibility, brand, and endorsement all exhibited
significant main effects (see Table 4.3). However, one o f four possible interactions,
brand (B) by endorsement (E), was significant (Wilks’ A. = .945, F = 2.464, p = .047), so
this had to be examined before the main effects could be interpreted. The source o f the
multivariate B x E interaction appeared to be PQ and PU (see Table 4.3). Graphical
representation of these univariate interactions (see Figures 4.2 and 4.3) indicated an
ordinal interaction for PQ (F = 5.505, p = .020) and a disordinal interaction for PU
(F = 8.647, p = .004). Further examination suggested that the source of the B x E
interaction for PU was mostly due to the celebrity side o f the graph and not the TPO
endorsement side (where the lines cross). Indeed, the difference between the two brand
means on the TPO endorsement side o f the graph (3.15 and 2.99) is not significant (t =.
73, p = .50), suggesting that the interaction is primarily due to the difference in means
on the other side o f the graph (t = 3.29, p < .01). This suggests that disordinality, in this
instance, does not preclude interpretation of the main effects.
All three main effects (credibility, brand, endorsement) were significant at p < .001
(Wilks’ A's o f .805, .783, and .803, respectively), and all three had relatively large effect
sizes (see Table 4.3). In almost all cases, the significant multivariate main effect was
supported by a significant univariate effect for each of the four dependent variables.
Only in the cases of PU (for brand) and PR (for endorsement) were the multivariate
main effects not supported by a univariate effect. Athough only one multivariate
interaction was significant (brand by endorsement), there was a significant credibility by
brand univariate interaction for PQ. This univariate interaction will be addressed later
75
Reproduced with permission of the copyright owner. Further reproduction prohibited without permission.

in the section on hypotheses tests. The R2 for the four dependent variables in the
MANOVA was as follows: PQ (-339), PU (.190), ATTM (.304), and PR (.136).
MANOVA for the Advertisement Set o f Variables. A second MANOVA was
conducted for the advertisement set o f dependent variables (TV and ATTE). These
variables satisfied the assumptions o f equality o f covariance matrices across groups
5.5
5.0 II---
C3C’§? 4 .0ess•o2 3.5a£
Brand
High
t / i O L ow3.0BJTPO C e le b r i ty
Type o f E ndo r s em e n t
FIGURE 4.2BRAND BY ENDORSEMENT INTERACTION FOR PQ
(Box’s test p = .135) and multicollinearity (Bartlett’s test p < .001). O f the four
interactions, none were significant in either a multivariate or univariate sense (see Table
4.4). The independent variables of credibility, brand, and endorsement all exhibited
significant main effects (p < .04) with Wilks' X's of .830, .963, and .910, respectively).
However, unlike the MANOVA for the product variables, the strength o f these three
main effects varied. For example, main effect F-values ranged from 17.579 for
76
Reproduced with permission of the copyright owner. Further reproduction prohibited without permission.

Reproduced
with perm
ission of the
copyright ow
ner. Further
reproduction prohibited
without
permission.
TABLE 4.3RESULTS OF MANOVA, PRODUCT SET OF VARIABLES, EXPERIMENT ONE, n=181
Multivariate Univariate
Effect Wilks' X Effect Size df F-value Sig PQ PU ATTM PR
C .805 .195 4/170 10.277 .000 26.475b**.133°
18.803**.098
26.590**.133
16.604**.088
B .783 .217 4/170 11.776 .000 14.276**.076
3.258.018
40.636**.190
5.709*.032
E .803 .197 4/170 10.411 .000 38.911**.184
7.752**.043
5.378*.030
1.969.011
CxB .956 .044 4/170 1.978 .100 4.895*.028
.063
.0001.331.008
.880
.005
CxE .976 .024 4/170 1.039 .389 .004.000
1.868.011
.331
.0021.261.007
BxE .945 .055 4/170 2.464 .047 5.505*.031
8.647**.048
1.810.010
.745
.004
CxBxE .985 .015
/r>\ T"» J
4/170 .647 .630 .323.002
1.496.009
.016
.000.334.002
: Effect Sizeindicates p < .01

credibility to 3.320 for brand, and effect sizes varied from .170 for credibility to .037 for
brand. These significant multivariate main effects were generally supported by
significant univariate effects for the two dependent variables. The only exception was
ATTE not supporting the brand main effect. The R2 for the dependent variables in the
MANOVA was as follows: IV (.196) and ATTE (.171).
wa
oC5
st/3u
3 .4
3 .2
3 .0
2 .8
2 .6
Brand2 .4
O High
O LowT P O C e le b r i ty
T y p e o f Endorsem ent
FIGURE 4.3BRAND BY ENDORSEMENT INTERACTION FOR PU
Covariates in MANOVA. The measures o f opinion seeking (OPSEEK) and
involvement (INVOL) were included in the questionnaire as possible covariates in
MANOVA. Unfortunately, the INVOL scale was poorly correlated with the dependent
variables (see Table 4.2), precluding use as a covariate. However, the OPSEEK scale
exhibited significant correlations with two of the four dependent variables in the product
set, so it was included as a covariate. With OPSEEK included, there were significant
main effects for all four independent variables (opinion seeking, credibility, brand, and
78
Reproduced with permission of the copyright owner. Further reproduction prohibited without permission.
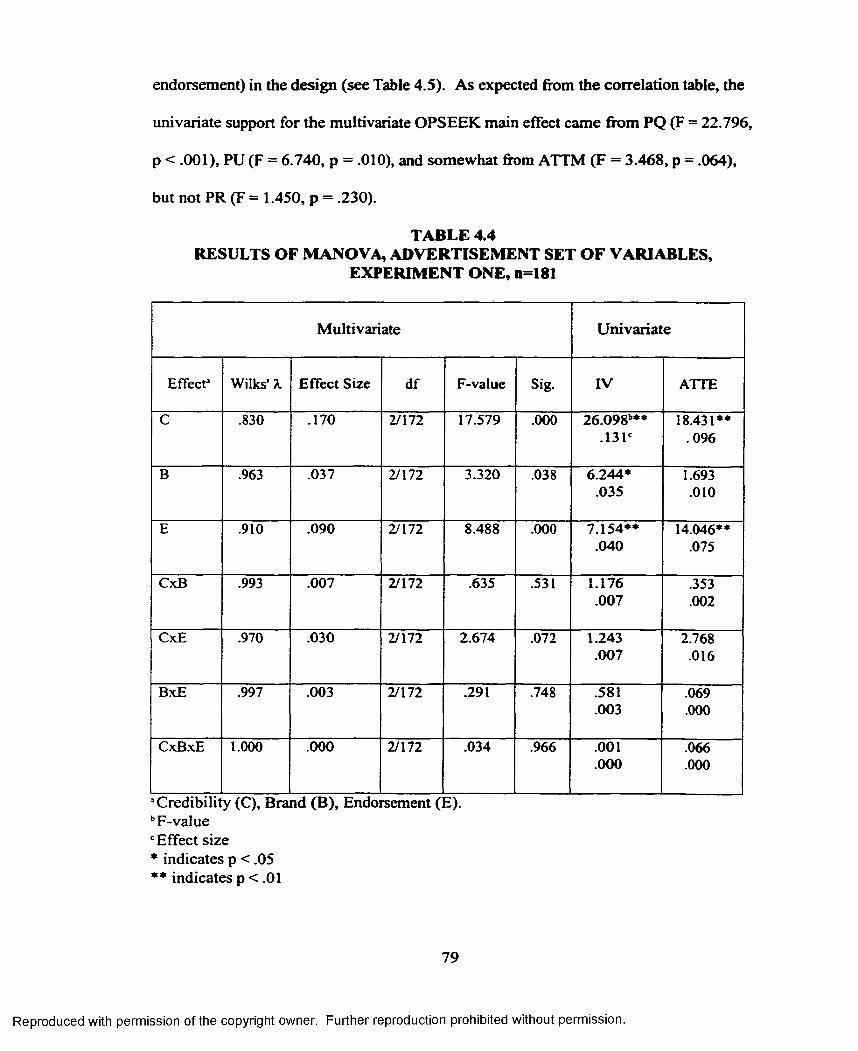
endorsement) in the design (see Table 4.5). As expected from the correlation table, the
univariate support for the multivariate OPSEEK main effect came from PQ (F = 22.796,
p < .001), PU (F = 6.740, p = .010), and somewhat from ATTM (F = 3.468, p = .064),
but not PR (F = 1.450, p = .230).
TABLE 4.4RESULTS OF MANOVA, ADVERTISEMENT SET OF VARIABLES,
EXPERIMENT ONE, n=181
Multivariate Univariate
Effect1 Wilks' A. Effect Size df F-value Sig. IV ATTE
C .830 .170 2/172 17.579 .000 26.098b**.131'
18.431**.096
B .963 .037 2/172 3.320 .038 6.244*.035
1.693.010
E .910 .090 2/172 8.488 .000 7.154**.040
14.046**.075
CxB .993 .007 2/172 .635 .531 1.176.007
.353
.002
CxE .970 .030 2/172 2.674 .072 1.243.007
2.768.016
BxE .997 .003 2/172 .291 .748 .581.003
.069
.000
CxBxE 1.000 .000 2/172 .034 .966 .001.000
.066
.000
’Credibility (C), Brand (B), Endorsement (E). bF-value c Effect size * indicates p < .05 ** indicates p < .01
79
Reproduced with permission of the copyright owner. Further reproduction prohibited without permission.

TABLE 4.5RESULTS OF MANOVA, PRODUCT SET OF VARIABLES,
WITH OPSEEK AS COVARIATE, EXPERIMENT ONE, n = 181
Effect1 Wilks' X Effect Size df F-value Significance
OPSEEK .875 .125 4/169 6.060 .000
C .794 .206 4/169 10.940 .000
B .794 .206 4/169 10.945 .000
E .770 .230 4/169 12.598 .000
CxB .952 .048 4/169 2.114 .081
CxE .976 .024 4/169 1.040 .388
BxE .942 .058 4/169 2.602 .038
CxBxE .980 .020 4/169 .856 .492
aOpinion See king (OPSEEK), Credibility (C), Brand 0 3), and Endorsement (E)
Because the OPSEEK main effect and increase in the endorsement main effect
appeared to come at the expense of the brand main effect, a Kendall's tau-c correlation
was computed for OPSEEK and the brand independent variable. Ideally, covariates
should be correlated with the dependent variables and not correlated with the
independent variables. As expected, the corrrelation between brand and OPSEEK was
negative (-. 127) and marginally significant (p = .065). This suggests that OPSEEK may
not satisfy the criteria for use as a covariate. Inclusion o f OPSEEK as a covariate in
MANOVA for the advertisement set o f dependent variables was ineffective (F = 1.428,
p = .243 for the main effect).
Additional reasons against using OPSEEK and INVOL as covariates arise from the
frequency distribution o f these variables. For example, 55% of respondents (127 o f
229) had an OPSEEK scale score (the average o f four individual scales) o f 7.00 on a
80
Reproduced with permission of the copyright owner. Further reproduction prohibited without permission.

possible 1 to 7 scale. This is a highly skewed distribution. Similarly, for INVOL, 43%
of subjects (99 o f 229) had a scale score (the average o f five individual items) o f 7.00
on a possible 1 to 7 scale. Mean scores for OPSEEK and INVOL were, respectively,
6.34 and 6.31. Given the lack o f mean centering, the highly skewed distributions, the
lack of correlation with the dependent variables (INVOL) or correlation with an
independent variable (OPSEEK), these two covariates do not appear appropriate for
further consideration.
Cell Means and Group Comparisons. Means for all 10 cells in the experimental
design are shown in Table 4.6. Cell means are post-hoc compared against each other by
Student-Newman-Keuls tests. These tests allow multiple means comparisons among
groups while controlling the overall error rate at a specified level. Data is also
presented in the format of groups/levels within a single factor for credibility (Table 4.7),
brand (Table 4.8), and endorsement (Table 4.9).
Test o f Hypothesis H I. This hypothesis proposed that subjects exposed to a
credible TPO endorsement for a brand will show higher scores on measures o f PQ, PU,
ATTM, IV, and lower scores on PR than subjects exposed to either a credible celebrity
endorsement or a no-endorsement ad for the same brand. To test this hypothesis, a
grouping variable was created to bring together cells 1 and 3 (credible TPO
endorsement cells), cells 5 and 7 (credible celebrity endorsement cells), and cells 9 and
10 (no-endorsement cells). The cell numbering system is as indicated in Table 4.6.
These three groups were then compared using oneway ANOVA for each dependent
variable and Student-Newman-Keuls tests to determine significant differences among
groups.
81
Reproduced with permission of the copyright owner. Further reproduction prohibited without permission.

Reproduced
with perm
ission of the
copyright ow
ner. Further
reproduction prohibited
without
permission.
TABLE 4.6CELL MEANS, STANDARD DEVIATIONS, AND UNIVARIATE CONTRASTS: EXERIMENT ONE
TPO Endorsement Celebrity Endorsement No Endorsement
High Brand Low Brand High Brand Low Brand H. Brand L. BrandSignificant
High Low High Low High Low High Low No Credibility MeanCredib Credib Credib Credib Credib Credib Credib Credib Manipulation Differences
Dep. n=20 n=22 n=21 n=25 n=22 n=25 n=23 n=23 n=24 n=24 AmongVar. Cell #1 Cell n2 Cell #3 Cell m Cell #5 Cell #6 Cell #7 Cell #8 Cell #9 Cell #10 Cells*
PQ 5.26b 4.67 5.29 4.16 4.51 4.13 3.96 2.65 3.68 3.25 8 < 9,7,6,4 < 1,3.90' 1.37 1.21 1.26 .91 .99 1.13 1.03 .99 .86
PU 3.54 2.49 3.49 2.87 3.18 2.89 2.63 2.05 2.58 2.36 8,10,2,9,7 <3,1.76 .96 .93 1.16 1.01 .92 1.14 .86 1.03 .90
ATTM 4.89 4.10 4.23 2.99 4.64 4.01 3.46 2.47 4.60 2.96 8,10,4 <6,2,3,9,5,1.95 1.85 .80 1.06 1.13 1.02 1.24 1.11 .87 .93
PR 2.71 3.34 2.71 3.86 2.89 3.34 3.39 3.96 3.09 3.94 1,3,5 <4,10,81.08 1.39 .82 1.32 1.04 1.05 1.11 1.22 1.05 .96
IV 4.75 4.18 4.62 3.64 4.59 3.60 4.17 2.75 3.53 3.32 8,10 <5,3,11.14 1.54 1.31 1.18 .90 1.30 1.46 1.43 1.36 1.51
ATTE 5.13 3.93 4.98 3.64 3.98 3.60 3.83 3.09 N/A N/A 8,6,4,7,2,5 < 3,11.54 1.49 1.29 1.24 1.59 1.38 1.35 1.49
Column headings are the combination of elements appearing in the ad stimuli for the cells“Significant differences are Student-Newman-Keuls tests at p=.05 or less.bMeanc Standard Deviation

TABLE 4.7FACTOR-LEVEL GROUP COMPARISONS FOR CREDIBILITY,
EXPERIMENT ONE
No Credibility Manipulation
(NC) n=48
Low Credibility Manipulation
(LC) n=95
High Credibility Manipulation
(HC) n=86
Significance2
PQ 3.46 3.91 4.73 NC < LC < HC.94 1.37 1.18
PU 2.47 2.59 3.19 NC, LC < HC.97 1.03 1.03
ATTM 3.78 3.39 4.28 LC,NC < HC1.22 1.44 1.17
PR 3.52 3.63 2.94 HC < NC, LC1.08 1.26 1.04
IV 3.42 3.54 4.52 NC, LC < HC1.43 1.43 1.22
ATTE N/A 3.56 4.45 LC < HC1.41 1.54
1 Significant differences between groups are Student-Newman-Keuls tests at p=.05 orless, except for ATTE which is a t-test comparison between two groups.
TABLE 4.8FACTOR-LEVEL GROUP COMPARISONS FOR BRAND,
EXPERIMENT ONE
Low Brand (LB) n=l 16
High Brand (HB) n=l 13 Significance2
PQ 3.84b 4.41 LB < HB1.39= 1.16
PU 2.67 2.92 None1.09 1.00
ATTM 3.19 4.43 LB < HB1.17 1.24
PR 3.59 3.09 HB < LB1.18 1.13
IV 3.68 4.09 LB < HB1.50 1.35
n=92 n=893.85 4.12 None
ATTE 1.49 1.58
“Significant differences between groups are t-tests at p=.05 or less. bMean‘Standard Deviation
83
Reproduced with permission of the copyright owner. Further reproduction prohibited without permission.

TABLE 4.9FACTOR-LEVEL GROUP COMPARISONS FOR ENDORSEMENT,
EXPERIMENT ONE
NoEndorsement
(NE)n=48
CelebrityEndorsement
(C)n=93
TPOEndorsement
(TPO)n=88
Significance*
PQ 3.46b 3.81 4.81 NE, C < TPO.94c 1.22 1.28
PU 2.47 2.69 3.07 NE, C < TPO.97 1.05 1.05
ATTM 3.78 3.64 3.99 None1.22 1.36 1.41
PR 3.52 3.40 3.19 None1.08 1.15 1.26
IV 3.42 3.77 4.26 NE, C < TPO1.43 1.45 1.36
ATTE N/A 3.62 4.37 C < TPO1.47 1.51
Significant differences between groups are Student-Newman-Keuls tests at p=.05 orless, except for ATTE which is a t-test between two groups.bMeanStandard deviation
For the three endorsement groups compared, the dependent variables and the
respective ANOVA F-values were as follows: PQ (35.429), PU (12.463), ATTM
(4.847), PR (6.499), and IV (11.623). All of these F-values are significant at p < .01.
Group means and significant differences among groups are shown in Table 4.10.
Hypothesis 1 was fully supported for PQ, PU, ATTM, and PR and partially supported
for IV. That is, we see an ascending series of means going from no endorsement, to
credible celebrity endorsement, to credible TPO endorsement for PQ, PU, ATTM, and
IV. Except for IV, the means o f the credible TPO endorsement condition are
significantly greater than either of the other two conditions. For PR, there is a
84
Reproduced with permission of the copyright owner. Further reproduction prohibited without permission.

decreasing series o f means across the conditions, as hypothesized, with the mean of the
credible TPO condition being significantly less than either of the other two conditions.
Test of Hypothesis H2a. This hypothesis stated that subjects exposed to a highly
credible TPO endorsement for a brand will show higher scores on measures o f IV and
ATTE than will subjects exposed to a TPO endorsement o f low credibility for the same
brand. Again, following a procedure similar to that in hypothesis 1, a grouping variable
was created to bring together cells 1 and 3 (high credibility TPO endorsement cells) and
cells 2 and 4 (low credibility TPO endorsement cells). The means o f these two groups
were then compared by t-test for IV and ATTE. As shown in Table 4.11, means
for the high credibility condition are significantly greater than the means for the low
credibility condition for both IV (t = 2.833, p = .006) and ATTE (t = 4.309, p < .001).
Thus, hypothesis 2a is fully supported.
Test of Hypothesis H2b. This hypothesis proposed that subjects exposed to a highly
credible TPO endorsement will show higher scores on measures of PQ, PU, ATTM, and
lower scores on PR than subjects exposed to a TPO endorsement of low credibility for
the same brand. This is really just an extension o f H2a to cover the product set o f
variables. Accordingly, the same cells are being compared and the same grouping
variable may be used. As shown in Table 4.11, means for the two groups on the four
product variables are all significantly different by t-test, and the difference is in the
direction hypothesized. Specific comparisons are as follows: PQ (t = 3.424, p = .001),
PU (t = 3.945, p < .001), ATTM ( t = 3.700, p < .001), and PR (t = -3.562, p = .001).
Thus, hypothesis 2b is supported in all respects.
85
Reproduced with permission of the copyright owner. Further reproduction prohibited without permission.

Test o f Hypothesis H2c. This hypothesis stated that subjects exposed to an ad
containing a TPO endorsement o f low credibility will show lower scores on measures o f
PQ, PU, and ATTM than subjects exposed to a similar ad for the same brand not
containing an endorsement. This is the so-called "boomerang" hypothesis. A grouping
variable was created to bring together cells 2 and 4 (low credibility TPO endorsement
cells) and cells 9 and 10 (no-endorsement cells). Means for the two groups were then
TABLE 4.10 TEST OF HYPOTHESIS 1: EXPERIMENT ONE
NoEndorsementManipulation
(NE)n=48
CredibleCelebrity
Endorsement(CC)n=45
CredibleTPO
Endorsement(CTP)n=41
Significance*
PQ 3.46b 4.23 5.28 NE < CC < CTP.94° 1.06 1.06
PU 2.47 2.90 3.51 NE < CC < CTP.97 1.10 .84
ATTM 3.78 4.03 4.55 NE, CC < CTP1.22 1.32 .93
PR 3.52 3.15 2.71 CTP < CC, NE1.08 1.09 .94
IV 3.42 4.38 4.68 NE < CC, CTP1.43 1.22 1.22
1 Significant differences between groups are Student-Newman-Keuls tests at p=.05 or less b Meanc Standard Deviation
compared by t-test. As shown in Table 4.12, this hypothesis was not supported for any
of the three variables. That is, the means for the low credibility TPO endorsement
condition were never significantly less than those for the control (no-endorsement)
condition. For PQ, the means were significantly different (t = 3.983, p < .001), but in
the opposite direction to that hypothesized. That is, the low credibility TPO
endorsement condition had a mean for PQ (4.39) that was significantly greater than the
86
Reproduced with permission of the copyright owner. Further reproduction prohibited without permission.

TABLE 4.11TEST OF HYPOTHESES 2A AND 2B, EXPERIMENT ONE
Low Credibility TPO Endorsement
(LCTP) n=47
High Credibility TPO Endorsement
(HCTP) n=41
Significance*
PQ 4.3 9b 5.28 LCTP < HCTP1.32c 1.06
PU 2.69 3.51 LCTP < HCTP1.07 .84
ATTM 3.51 4.55 LCTP < HCTP1.57 .93
PR 3.62 2.71 HCTP < LCTP1.36 .94
IV 3.89 4.68 LCTP < HCTP1.37 1.22
ATTE 3.78 5.05 LCTP < HCTP1.36 1.41
1 Significant differences between groups are t-tests at p=.05 or less bMean0 Standard Deviation
mean for the no-endorsement condition (3.46). For PU, ATTM, and PR, the group
comparison t-values were all less than 1.04, and p-values were all greater than .300. Of
the three variables, only ATTM exhibited a mean difference in the hypothesized
direction; however, this difference was not significant. Thus, hypothesis 2c is not
supported.
Test of Hypothesis H3. This hypothesis proposed that subjects exposed to an ad for
a high image brand will show higher scores on measures of PQ, PU, and ATTM, and
lower scores on PR than subjects exposed to an ad for a low image brand. In brief, a
main effect for brand image is proposed. Comparison o f brand level means by t-test
revealed significant differences for PQ, ATTM, and PR, all in the direction
hypothesized (Table 4.13). The results o f specific comparisons were: PQ (t = 3.395,
87
Reproduced with permission of the copyright owner. Further reproduction prohibited without permission.

p = .001), ATTM (t = 7.750, p < .001), and PR (t = -3.291, p = .001). The uniqueness
variable did not show a significant difference (t = 1.797, p = .074), although the means
for the high and low image groups (2.918 and 2.668, respectively) were in the
hypothesized direction. Thus, hypothesis 3 is partially supported.
Test o f Hypothesis H4. This hypothesis stated that subjects exposed to a credible
endorsement for a brand will show higher scores on measures o f PQ, PU, and ATTM,
and lower scores on measurers of PR than subjects exposed to an endorsement for the
same brand with low credibility. In brief, a main effect for credibility is proposed. A
TABLE 4.12TEST OF HYPOTHESIS 2C: EXPERIMENT ONE
No Endorsement Manipulation
(NE) n=48
Low Credibility TPO Endorsement (LCTP) n=47
Significance'
PQ 3.46b 4.39 NE < LCTP.91c 1.32
PU 2.47 2.69 None.97 1.07
ATTM 3.78 3.51 None1.22 1.57
“Significant differences between groups are t-tests at p=.05 or less bMeancStandard Deviation
grouping variable was created to bring together cells 1, 3, 5, and 7 (high credibility
endorsement cells) and 2,4, 6, and 8 (low credibility endorsement cells) . Comparison
of these two groups by t-test (Table 4.14) revealed that means for the high credibility
condition were significantly greater than means for the low credibility condition for PQ
(t = 4.325, p < .001), PU (t = 3.940, p < .001), and ATTM (t = 4.525, p < .001). For PR,
the mean for the low credibility condition was significantly greater than the mean for
88
Reproduced with permission of the copyright owner. Further reproduction prohibited without permission.

TABLE 4.13TEST OF HYPOTHESIS 3: EXPERIMENT ONE
Low Image Brand (LB) n = l16
High Brand Image (HB) n=l 13 Significance*
PQ 3.84b 4.41 LB < HB1.39* 1.16
PU 2.67 2.92 None1.09 1.00
ATTM 3.19 4.43 LB < HB1.18 1.24
PR 3.59 3.09 HB <LB1.18 1.13
“Significant differences between groups are t-tests at p=.05 or lessbMean‘Standard Deviation
the high credibility condition (t = -3.960, p < .001). Thus, hypothesis 4 is fully
supported in all respects.
TABLE 4.14 TEST OF HYPOTHESIS 4: EXPERIMENT ONE
Low Credibility Endorsements (LC)
n=95
High Credibility Endorsements (HC)
n=86 Significance*PQ 3.91b 4.73 LC < HC
1.37‘ 1.18PU 2.59 3.19 LC < HC
1.03 1.03ATTM 3.39 4.28 LC < HC
1.44 1.17PR 3.63 2.94 HC < LC
1.26 1.04“Significant differences between groups are t-tests at p=.05 or less bMean‘Standard Deviation
Test of Hypothesis H5. This hypothesis proposed that endorsement cue will interact
with brand cue such that the increase in mean response, going from celebrity
endorsement to TPO endorsement, on the dependent variables o f PQ, PU, and ATTM
89
Reproduced with permission of the copyright owner. Further reproduction prohibited without permission.

will be greater for low image than high image brands. This brand by endorsement
interaction has already been discussed, briefly, in preparation for MANOVA. Since the
multivariate B x E interaction was significant (F=2.464, p = .047), any question o f
disordinality had to be addressed prior to interpreting the main effects in MANOVA.
The interaction was supported by the variables o f PQ (F = 5.505, p = .020) and PU (F =
8.647, p = .004), but not ATTM (F — 1.810, p = .180). Graphs o f the PQ and PU
interactions have already been shown (see Figures 4.2 and 4.3), and the disordinal
features o f Figure 4.3 have been addressed.
In looking at Figure 4.2 for PQ, the means at the TPO and celebrity endorsement
ends of the low brand image line appear to be very different (a mean difference o f
1.375, t = 5.063, p < .001). The means at the two ends of the high image brand line are
closer together (a mean difference o f .6439, t = 2.776, p < .005). This difference in
mean differences gives rise to the different slopes o f the lines and a visual portrayal of
the interaction. In Figure 4.3 for PU, the means at the TPO and celebrity ends o f the
low image brand line appear very different (a mean difference o f .809, t = 3.639, p <
.001). In contrast, the two means at the end o f the high image brand line are very
similar (a mean difference of .035, t = .035, p > .500). The difference in the slopes o f
the two lines is very apparent in Figure 4.3. Consistent in both Figures is the fact that
the slope of the line for the low image brand is steeper than that o f the high image
brand. This suggests that improvement in PQ and PU following TPO endorsement
stimulus (relative to celebrity endorsement stimulus) is greater for low image brands
than high image brands.
90
Reproduced with permission of the copyright owner. Further reproduction prohibited without permission.

A graph o f means for the remaining third variable mentioned in the hypothesis
(ATTM), is shown in Figure 4.4. It is an ordinal interaction. Unlike the other two
variables, ATTM did not exhibit univariate support for the interaction (F = 1.810, p =
.180). Overall, hypothesis 5 is partially supported.
5.0
4.0 ,
C3
Brand3.0
High
Q LowTPO Celebrity
Type o f Endorsement
FIGURE 4.4BRAND BY ENDORSEMENT INTERACTION FOR ATTM
Test of Hypothesis H6. This hypothesis stated that source credibility cue will
interact with brand image such that the increase in mean response going from low
credibility to high credibility on the dependent variables of PQ, PU, and ATTM will be
greater for low image brands than high image brands. This interaction was insignificant
in a multivariate sense (F = 1.978, p = . 100). Of the three variables mentioned in the
hypothesis, only PQ (F = 4.895, p = .028) exhibited significant univariate support for
91
Reproduced with permission of the copyright owner. Further reproduction prohibited without permission.

the interaction. Neither PU (F = .063, p = .802) nor ATTM (F = 1.331, p = .250)
contributed significantly.
Graphical representations o f the interactions for PQ, PU, and ATTM are shown in
Figures 4.5,4.6, and 4.7, respectively. All o f the graphs indicate ordinal interactions.
In looking at Figure 4.5 for PQ, the high and low credibility means at the two ends o f
the low image brand line appear very different (a mean difference o f 1.159, t = 4.102,
p < .001). The slope of the high image brand line is Hatter, and as expected, the
difference between the two means at the ends o f this line is not as large (a mean
difference o f .486, t = 2.104, p < .025). The interpretation is that the high credibility
condition raises product PQ more for the low image brand than the high image brand.
Overall, hypothesis 6 is partially supported.
5.0
4.5
Brand
High3.0 Q Low
High Low
Level of Credibility
FIGURE 4.5CREDIBILITY BY BRAND INTERACTION FOR PQ
92
Reproduced with permission of the copyright owner. Further reproduction prohibited without permission.

3.6
^ 3.2 .
«c
,Brand
High
2.4 LowHigh Low
Level o f Credibility
FIGURE 4.6CREDIBILITY BY BRAND INTERACTION FOR PU
5.0
CO
Brand
High
LowHigh Low
Level o f Credibility
FIGURE 4.7CREDIBILITY BY BRAND INTERACTION FOR ATTM
93
Reproduced with permission of the copyright owner. Further reproduction prohibited without permission.
Experiment Two
This experiment studied the advertising effects o f TPO and celebrity endorsements
(and the moderating factors o f brand and credibility on these endorsements) on subject
perceptions of auto insurance. This product is a pure service, quite unlike the tangible
good used in Experiment One (a desktop computer). The experimental design and
dependent variables remain the same as in Experiment One.
Sample Size and Endorsement Manipulation Check. All 263 questionnaire folders
distributed were returned. However, 18 respondents missed the endorsement
manipulation check (meaning they were unable to recall from memory and categorize
the endorsement condition they were exposed to). An additional 8 folders were deleted
after consent form information indicated that these same subjects had responded in two
separate data gathering sessions (double responders). For all double responders, the
first response was retained and the second response was discarded. With these 26
questionnaires deleted from further analysis, data from 237 questionnaires were entered
and this constituted the final sample (53.6% female, 46.4% male). Each o f the 10
experimental cells contained data from a minimum o f 20 to a maximum of 27
respondents. About 61% o f subjects (144 o f 237) reported having an auto insurance
policy in their name. Also, 35% of those who had their own insurance indicated that
they had actively chosen the insurance company rather than blindly followed the choice
o f their parents, a family member, or a friend.
Brand Image Manipulation Check. A separate survey item asked the respondent’s
perception of the image o f the brand in the ad before exposure to the ad. Image was
defined in the questionnaire as the degree to which the subject would consider purchase
94
Reproduced with permission of the copyright owner. Further reproduction prohibited without permission.

of the brand and recommend it to others. Successful brand image manipulation requires
that respondents report a higher intent to purchase and recommend the high image brand
compared to the low image brand. As evidence o f successful manipulation, brand
image means for subjects exposed to the high and low brands were, respectively, 4.47
and 3.18. These two groups are significantly different on the brand image variable (t =
6.662, p < .001).
Credibility Manipulation Check. Credibility manipulation for experiment two was
similar to that o f experiment one. That is, the advertisement disclosed that the endorser
o f the auto insurance would profit from making the endorsement (low credibility) or
that the endorser stood to gain nothing by making the endorsement (high credibility).
Credibility perception was checked by a series o f four questionnaire items that asked
about the sincerity, believability, truthfulness, and honesty of the ad/advertiser. From
the manipulation check, the means of the high and low credibility groups were,
respectively, 4.77 and 4.21. The two groups are significantly different in credibility
perception (t = 3.142, p < .005).
As in experiment one, inspection of crosstabulation results comparing mirror image
cells (cells having the same brand and endorsement conditions and differing only in
credibility manipulation) revealed that some subjects had clearly interpreted the low
credibility condition to be highly credible and vice-versa. The explanation for this
occurrence is uncertain. It is possible that the act o f disclosure o f the relationship
between the endorser and the manufacturer could serve as a basis for inferring honesty,
in the minds o f some people. An attempt was made to minimize this possibility through
the use of questionnaire instructions that told respondents to assume that the advertiser
95
Reproduced with permission of the copyright owner. Further reproduction prohibited without permission.

is required by law to disclose the relationship between any endorser o f the product and
the advertiser. Nevertheless, some subjects perceived the manipulation in a manner
opposite to that intended. Therefore, respondents were re-classified into high and low
credibility conditions on the basis o f their response to the four credibility check items
rather than the ad stimulus they were exposed to. Re-classification only occurred
between mirror-image cells (as defined above). Since credibility was not manipulated
in the control cells, subject re-classification into or out o f these cells did not occur.
After re-classification, the mean difference between the two credibility groups widened
(means of 5.48 and 3.42, respectively), and the t-test for the difference between the
means was more significant (t = 19.135, p < .001).
Preliminary Analysis. To screen for missing data and out-of-range data entries (e.g.
an entry o f 33 instead of 3 on a 1 to 7 scale), descriptive statistics on all 33 individual
scale items were obtained. The number of observations and minimum and maximum
suggested an absence o f obvious input errors for all variables.
Scales. To assess unidimensionality, the 33 individual scale items were entered into
exploratory factor analysis with principal components extraction. Since there was a
priori reason to expect 8 factors underlying the 33 items, 8 factors were requested with
varimax rotation. The Bartlett test o f sphericity was high (p < .001) suggesting that
factor analysis may be appropriate for the variables as a group. Additionally, the lowest
measure of sampling adequacy for any one variable was .743, well above the
recommended minimum o f .50.
Inspection o f the rotated component matrix showed a relatively simple structure
(scale items associated with only a single factor) except for two problematic variables.
96
Reproduced with permission of the copyright owner. Further reproduction prohibited without permission.

Item El from the ATTM scale crossloaded on the PQ scale (loadings o f .643 and .448,
respectively), and item G1 from the PU scale also crossladed on the PQ scale (loadings
o f .656 and .438, respectively). No other items had crossloadings above .400. All 33
items had communalities above .500. Despite their lack o f ideal structure, items El and
G1 were both retained.
Reliability coefficients and number of items per scale for the 8 scales in Experiment
Two are shown in Table 4.15. Reliabilities ranged from a low of .8569 for perceived
uniqueness to .9561 for involvement with the product class. Pearson correlations
among the scales are shown in Table 4.16. Note that the correlation between perceived
risk and other variables is negative, and that OPSEEK and ENVOL are poorly correlated
to the other variables.
Results o f tests for normality o f distribution (Kolmogorov-Smimov tests) are also
shown in Table 4.15. Significant departures from normality were found for PQ, PR,
OPSEEK, and INVOL. However, it is clear that these variables fall into two groups:
moderate departure from normality (PQ and PR) and severe departure (OPSEEK and
INVOL). The significance o f the Kolmogorov-Smimov Z-value for the latter variables
was less than .001, indicating highly non-normal distributions. The OPSEEK and
INVOL scales will be addressed in a later section, but the highly atypical distributions
of these variables argues against their use. Any non-normality in the distributions o f the
remaining variables is deemed to be within acceptable limits.
Preparation for MANOVA. The MANOVA procedure assumes multivariate
normality o f linear combinations o f dependent variables; however, there is no readily
available statistical test for this condition. As an alternative, the dependent variables of
97
Reproduced with permission of the copyright owner. Further reproduction prohibited without permission.

TABLE 4.15MEASUREMENT SCALES: EXPERIMENT TWO
Scale* n Items Coefficient Alpha K-S Test Significance6PQ 237 4 .8844 .035
PU 237 4 .8569 .073
ATTM 237 4 .9000 .258
PR 237 4 .8678 .034
IV 237 4 .8671 .113
ATTE 193' 4 .9258 .184
OPSEEK 237 4 .9298 .000
INVOL 237 5 .9561 .000
‘Scale abbreviations are as follows: perceived quality (PQ), perceived uniqueness (PU), attitude toward the manufacturer (ATTM), purchase risk (PR), information value (IV), attitude toward the endorser (ATTE), opinion seeking (OPSEEK), and involvement with product class (INVOL) bKolmogorov-Smimov Test for normality o f distribution cControl cells were not exposed to ad stimuli containing an endorsement
PQ, PU, and ATTM may be regressed upon PR and a scatterplot o f the standardized
residuals versus the predicted risk value may be visually evaluated for evidence of
violation of assumptions. The dispersion of residuals should be random, with an
absence o f curvilinear patterns or clustering. So, as a diagnostic procedure, PQ, PU, and
ATTM were regressed upon PR using the enter method. A similar diagnostic was not
generated for the advertisement set o f variables because there would only be one
independent variable.
Examination of the residual scatterplot (standardized residuals versus predicted risk)
revealed an essentially null plot (see Figure 4.8). That is, there was a generally random
98
Reproduced with permission of the copyright owner. Further reproduction prohibited without permission.

dispersion o f residuals and an absence o f curvilinear patterns. Only 4 of 193 cases had
standardized residuals outside 2.5 standardized deviations from the mean. Given the
small number of outliers and the possible attendant criticism of overfitting the data if
they were deleted, a decision was made to retain these cases.
TABLE 4.16CORRELATION AMONG DEPENDENT VARIABLES: EXPERIMENT TWO
PQ PU ATTM PR IV ATTE OPSEEK
PU .449*.000b
ATTM .555.000
.626
.000PR -.300
.000-.137.057
-.322.000
IV .598.000
.400
.000.612.000
-.285.000
ATTE .408.000
.455
.000.551.000
-.269.000
.502
.000OPSEEK .149
.038.026.724
.112
.120-.013.862
.096
.183-.027.705
INVOL .112.119
.103
.153.110.129
-.142.050
.049
.498.157.029
.166
.021‘Pearson correlation coefficient btwo-tailed significance
MANOVAs. Separate MANOVAs were performed, one for the product set o f
dependent variables (PQ, PU, ATTM, and PR), and one for the advertisement set o f
dependent variables (IV and ATTE). In both cases, only the 8 cells in the full factorial
portion of the experimental design (n = 193) were included in the analysis.
MANOVA for the Product Set of Variables. For the product set, Box’s test was non
significant at p = .207, indicating equality o f covariance matrices of the dependent
variables across treatment groups. Additionally, Bartlett’s test o f sphericity was
99
Reproduced with permission of the copyright owner. Further reproduction prohibited without permission.

4
□a
3 < a a
Regression Adjusted (Press) Predicted Value
FIGURE 4.8EXAMINATION OF RESIDUALS FOR ASSUMPTIONS OF MANOVA
significant at p < .001, suggesting an adequate level o f correlation among the dependent
measures. With these assumptions satisfied, attention was directed toward the
multivariate results.
All four multivariate interactions were non-significant (F-values of 1.435 to .204, p-
values of .224 to .936, see Table 4.17), allowing a direct interpretation o f the main
effects. The three independent variables (credibility, brand, endorsement) all exhibited
significant main effects (Wilks’ A.’s o f .741to .878, F-values o f 15.877 to 6.300, p-
values < .001 for all). In almost all cases, the significant multivariate main effect was
supported by a significant univariate effect for each o f the four dependent variables.
Only in the cases o f PU and ATTM (both for endorsement) did univariate effects not
100
Reproduced with permission of the copyright owner. Further reproduction prohibited without permission.
significantly support the multivariate main effect. The non-significance of the
multivariate interactions was also true in a univariate sense; there were no significant
univariate interaction effects (F-values from .001 to 3.084 and p-values from .975 to
.081). The R2 for the four dependent variables in the MANOVA was as follows: PQ
(.204), PU (.173), ATTM (.276), and PR (.180).
MANOVA for the Advertisement Set o f Variables. A second MANOVA was
performed for the advertisement set o f dependent variables (IV and ATTE). These
variables satisfied the assumptions o f equality of covariance matrices across groups
(Box’s test p = .413) and multicollinearity (Bartlett’s test p < .001). Of the four
interactions, one (credibility by brand) was significant (Wilks’ X o f .961, F = 3.739,
p = .026), so this interaction had to be examined more completely before the main
effects could be interpreted.
As shown in Table 4.18, the source o f the multivariate C x B interaction appeared to
be both IV (F = 5.087, p = .025) and ATTE (F = 5.243, p = .023). Graphical
representation of these univariate interactions revealed that both were disordinal (see
Figures 4.9 and 4.10). In looking at Figure 4.9, the difference in brand means on the
high credibility side o f the graph is .5433 (t = 2.175, p < .05) while the difference in
brand means on the low credibility side o f the graph (where the lines cross) is . 1725
(t = .651, not significant). The latter mean difference insignificance suggests that the
overall interaction is mostly due to the high credibility side o f the graph, and that the
disordinality on the low credibility side o f the graph does not preclude interpretation of
the main effects. The C x B interaction for ATTE represented in Figure 4.10 is very
101
Reproduced with permission of the copyright owner. Further reproduction prohibited without permission.

Reproduced
with perm
ission of the
copyright ow
ner. Further
reproduction prohibited
without
permission.
TABLE 4.17RESULTS OF MANOVA, PRODUCT SET OF VARIABLES, EXPERIMENT TWO, n=193
Multivariate Univariate
Effect" Wilks' k Effect Size df F-value Sig PQ PU ATTM PR
C .741 .259 4/182 15.877 .000 21.090b** . I02c
21.707**.105
58.869**.241
12.075**.061
B .846 .154 4/182 8.312 .000 6.826*.036
11.568**.059
6.744*.035
21.146**.103
E .878 .122 4/182 6.300 .000 20.565**.100
.214
.0013.699
.0206.672*
.035
CxB .983 .017 4/182 .771 .546 .072.000
2.548.014
.927
.005.308.002
CxE .996 .004 4/182 .204 .936 .121.001
.036
.000.698.004
.008
.000
BxE .975 .025 4/182 1.173 .324 .001.000
1.259.007
.817
.004.075.000
CxBxE .969 .031 4/182 1.435 .224 .022.000
3.084.016
.285
.0021.557.008
"Credibilit y (C), Brand B), Endorsement (E) * indicates p < .05b F-value *+ indicates p < .01c Effect Size

similar to the interaction just discussed. That is, the line cross occurs on the low
credibility side o f the graph, and the two brand means on that side are relatively close
together. Indeed, the difference between means on the low credibility side of the graph
is .1642 (t = .588, not significant) while the difference between means on the high
credibility side o f the graph is .6362 (t = 2.146, p < .05). As in Figure 4.9, this suggests
that although a technical disordinality is present, the main effects can still be
interpreted.
Of the three main effects, credibility (Wilks’ X of .829, F = 19.040, p < .001) and
endorsement (Wilks’ X o f .841, F = 17.398, p < .001) were both significant (see Table
4.18). Brand (Wilks’ X o f .990, F = .898, p = .409) did not exhibit a significant main
effect. The two significant multivariate main effects were both supported by significant
univariate effects for both dependent variables (F-values from 19.343 to 30.223, p-
values < .001 for all four univariate effects). For brand, neither dependent variable had
a significant univariate effect (F-values o f 1.049 and 1.415, p-values > .235 for both).
The R2 for the two dependent variables in the MANOVA was as follows: IV (.234) and
ATTE (.240).
Covariates in MANOVA. The measures o f opinion seeking (OPSEEK) and
involvement (INVOL) were included in the questionnaire as possible covariates in
MANOVA. Unfortunately, neither scale was well correlated with either the product or
advertisement set o f dependent variables suggesting that the scales may not be suitable
as covariates. For example, OPSEEK exhibits only one significant correlation among
the four variables in the product set (PQ, p = .038) and no significant correlations with
103
Reproduced with permission of the copyright owner. Further reproduction prohibited without permission.

e<9 U
s
C3Ebu> C32■o
uj
4 .2
4 .0
3 .8
3 .6
3 .2
rand3 .0
° H ig h
O L o w.8
High L ow
Level of Credibility
FIGURE 4.9CREDIBILITY BY BRAND INTERACTION FOR IV
s .o
4 .5
4 .0
3 .5 rand•ooa
t i D H igh
D L o w
c3 .0
High L ow
Level of Credibility
FIGURE 4.10CREDIBILITY BY BRAND INTERACTION FOR ATTE
104
Reproduced with permission of the copyright owner. Further reproduction prohibited without permission.

TABLE 4.18RESULTS OF MANOVA, ADVERTISEMENT SET OF VARIABLES,
EXPERIMENT TWO, n=193
Multivariate Univariate
Effect* Wilks' X Effect Size df F-value Sig. IV ATTE
C .829 .171 2/184 19.040 .000 21.997"**.106c
30.223**.140
B .990 .010 2/184 .898 .409 1.049.006
1.415.008
E .841 .159 2/184 17.398 .000 28.228**.132
19.343**.095
CxB .961 .039 2/184 3.739 .026 5.087*.027
5.243*.028
CxE .995 .005 2/184 .438 .646 .069.000
.872
.005
BxE .996 .004 2/184 .335 .716 .536.003
.005
.000
CxBxE .968 .032 2/184 3.000 .052 .579.003
3.540.019
’Credibility (C), Brand (B), Endorsement (E). "F-value c Effect size * indicates p < .05 ** indicates p < .01
the two variables in the advertisement set. The INVOL variable is significantly
correlated with one of the four product set variables (PR, p = .050) and one o f the two
variables in the advertisement set (ATTE, p = .029). It may be noted that OPSEEK and
INVOL are significantly correlated (p = .021) in Experiment Two while these two
105
Reproduced with permission of the copyright owner. Further reproduction prohibited without permission.
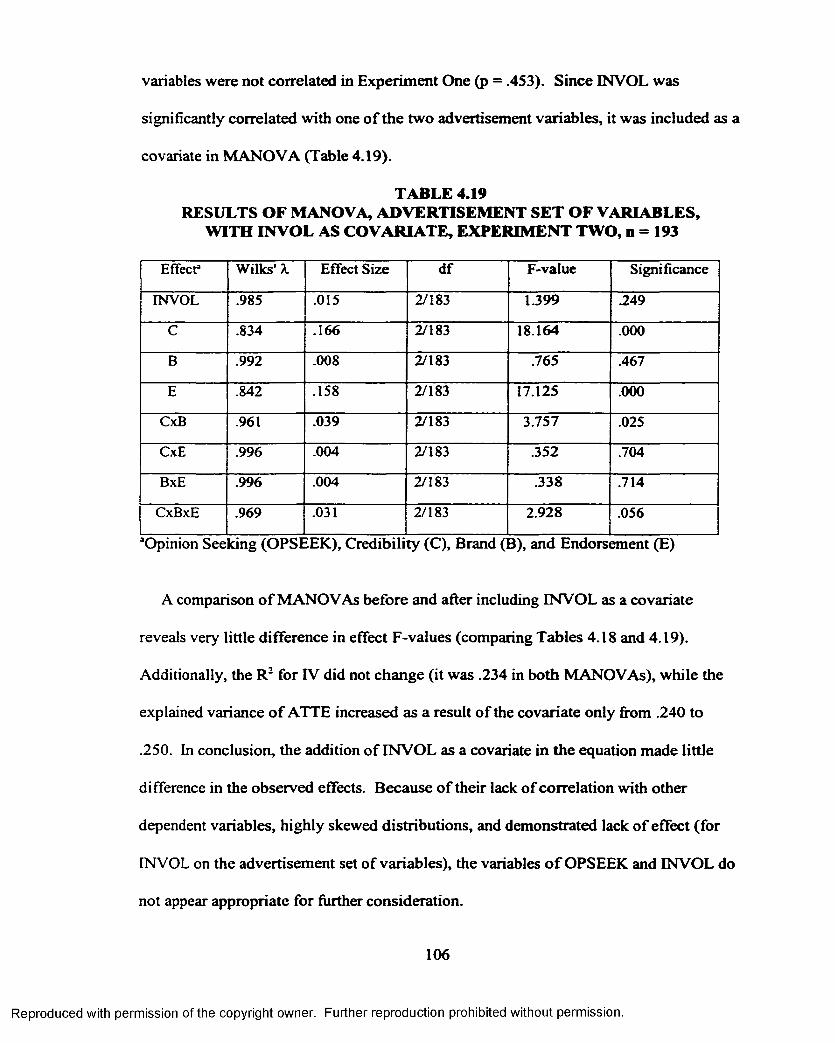
variables were not correlated in Experiment One (p = .453). Since INVOL was
significantly correlated with one o f the two advertisement variables, it was included as a
covariate in MANOVA (Table 4.19).
TABLE 4.19RESULTS OF MANOVA, ADVERTISEMENT SET OF VARIABLES,
WITH INVOL AS COVARIATE, EXPERIMENT TWO, n = 193
Effect1 Wilks' \ Effect Size df F-value Significance
INVOL .985 .015 2/183 1.399 .249
C .834 .166 2/183 18.164 .000
B .992 .008 2/183 .765 .467
E .842 .158 2/183 17.125 .000
CxB .961 .039 2/183 3.757 .025
CxE .996 .004 2/183 .352 .704
BxE .996 .004 2/183 .338 .714
CxBxE .969 .031 2/183 2.928 .056
’Opinion See ring (OPSEEK), Credibility (C), Brand ( 3), and Endorsement (E)
A comparison o f MANOVAs before and after including INVOL as a covariate
reveals very little difference in effect F-values (comparing Tables 4.18 and 4.19).
Additionally, the R2 for IV did not change (it was .234 in both MANOVAs), while the
explained variance o f ATTE increased as a result o f the covariate only from .240 to
.250. In conclusion, the addition o f INVOL as a covariate in the equation made little
difference in the observed effects. Because o f their lack o f correlation with other
dependent variables, highly skewed distributions, and demonstrated lack o f effect (for
INVOL on the advertisement set of variables), the variables o f OPSEEK and INVOL do
not appear appropriate for further consideration.
106
Reproduced with permission of the copyright owner. Further reproduction prohibited without permission.

Cell Means and Group Comparisons. Means for all 10 cells in the experimental
design are shown in Table 4.20. Cell means are post-hoc compared against each other
by Student-Newman-Keuls tests. These tests allow multiple means comparisons while
controlling overall error rate. Data is also presented in the format of groups/levels
within a single factor for credibility (Table 4.21), brand (Table 4.22), and endorsement
(Table 4.23).
Test of Hypothesis H I. This hypothesis proposed that subjects exposed to a credible
TPO endorsement for a brand will show higher scores on measures of PQ, PU, ATTM,
IV, and lower scores on PR than subjects exposed to either a credible celebrity
endorsement or a no-endorsement ad for the same brand. To test this hypothesis, a
grouping variable was created to bring together cells 1 and 3 (credible TPO
endorsement cells), cells 5 and 7 (credible celebrity endorsement cells), and cells 9 and
10 (no-endorsement cells). The cell numbering system is as indicated in Table 4.20.
These three groups were then compared using oneway ANOVA for each dependent
variable and Student-Newman-Keuls tests to determine significant differences among
groups.
For the three endorsement groups compared, the dependent variables and the
respective ANOVA F-values and significance were as follows: PQ (F = 7.062, p =
.001), PU (F = .799, p = .452), ATTM (F = 5.056, p = .008), PR (F = 1.444, p = .239),
and IV (F = 10.320, p < .001). Group means and significant differences among groups
are shown in Table 4.24. Hypothesis 1 was fully supported for PQ and IV, partially
supported for ATTM, and not supported for PU or PR. That is, the PQ and IV levels o f
the credible TPO endorsement group was significantly greater than those o f either the
107
Reproduced with permission of the copyright owner. Further reproduction prohibited without permission.

Reproduced
with perm
ission of the
copyright ow
ner. Further
reproduction prohibited
without
permission.
TABLE 4.20CELL MEANS, STANDARD DEVIATIONS, AND UNIVARIATE CONTRASTS: EXERIMENT TWO
O00
TPO Endorsement Celebrity Endorsement No Endorsement
High Brand Low Brand High Brand Low Brand H. Brand L. BrandSignificantHigh Low High Low High Low High Low No Credibility MeanCredib Credib Credib Credib Credib Credib Credib Credib Manipulation DifferencesDep. n=22 n=25 n=25 n=20 n=26 n=24 n=27 n=24 n=21 n=23 AmongVar. Cell #1 Cell #2 Cell #3 Cell #4 Cell #5 Cell #6 Cell #7 Cell m Cell #9 Cell #10 Cells*
PQ 4.89b 4.08 4.44 3.75 4.13 3.47 3.71 3.08 4.14 3.77 8,6<3,1.98c 1.29 1.14 1.16 .93 .99 .99 .93 .89 1.42
PU 4.09 2.83 2.88 2.65 3.55 2.89 3.22 2.51 3.52 2.80 8<9,5,11.04 1.06 1.02 1.01 .97 1.08 1.30 .95 .90 1.39
ATTM 4.56 3.03 4.07 3.00 4.19 3.08 3.59 2.61 3.82 3.25 8,4,2,6,10<3,5,1.81 1.03 1.09 1.09 1.01 .88 1.43 .91 1.15 1.21
PR 2.34 3.16 3.27 3.54 2.89 3.30 3.53 4.15 3.19 3.02 1<81.08 .80 1.22 .95 .81 .91 1.34 1.11 1.06 .99
IV 4.58 3.47 4.02 3.43 3.63 2.34 3.06 2.81 3.36 2.98 6,8<3,l.77 1.24 1.19 1.35 1.20 1.21 1.38 1.04 1.27 1.64
ATTE 5.47 3.39 4.43 3.99 4.07 3.09 3.74 2.93 N/A N/A 8,6< 3<1.94 1.32 1.44 1.32 1.52 1.54 1.52 1.03
‘ Significant differences are Student-Newman-Keuls tests at p=.05 or less. bMeanc Standard Deviation

credible celebrity endorsement group or the no-endorsement group. For ATTM, the
credible TPO group mean was significantly greater than that o f the no-endorsement
group but not the credible celebrity group. Thus, hypothesis 1 is partially supported for
ATTM. There were no significant differences among the three groups for PU or PR,
although the group means were in the hypothesized direction.
TABLE 4.21FACTOR-LEVEL GROUP COMPARISONS FOR CREDIBILITY,
EXPERIMENT TWO
No Credibility Manipulation
(NC) n=44
Low Credibility Manipulation
(LC) n=100
High Credibility Manipulation
(HC) n=93
Significance'
PQ 3.95 3.59 4.27 LC < HC1.19 1.15 1.08
PU 3.15 2.72 3.41 LC < NC,HC1.22 1.02 1.16
ATTM 3.52 2.93 4.08 LC < NC < HC1.21 .98 1.16
PR 3.10 3.53 3.04 HC,NC < LC1.02 1.01 1.19
IV 3.16 3.00 3.78 LC,NC < HC1.47 1.28 1.28
ATTE N/A 3.32 4.38 LC < HC1.35 1.51
1 Significant differences between groups are Student-Newman-Keuls tests at p=.05 or less, except for ATTE which is a t-test comparison between two groups.
'’Mean'Standard Deviation
Test o f Hypothesis H2a. This hypothesis stated that subjects exposed to a highly
credible TPO endorsement for a brand will show higher scores on measures of IV and
ATTE than subjects exposed to a TPO endorsement o f low credibility for the same
brand. To test this proposal, grouping variable was created to bring together cells 1 and
3 (high credibility TPO endorsement cells) and cells 2 and 4 (low credibility TPO
endorsement cells). The means of these two groups were then compared by t-test (see
109
Reproduced with permission of the copyright owner. Further reproduction prohibited without permission.
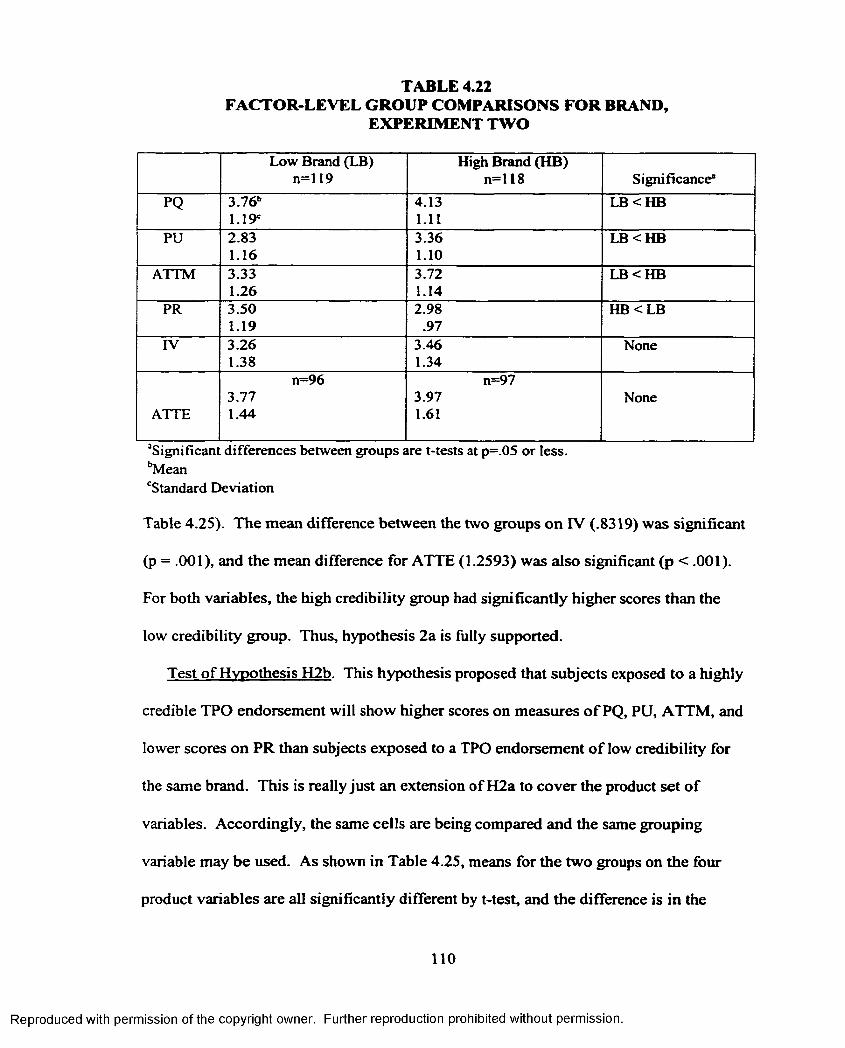
TABLE 4.22FACTOR-LEVEL GROUP COMPARISONS FOR BRAND,
EXPERIMENT TWO
Low Brand (LB) n=l 19
High Brand (HB)n=l 18 Significance1
PQ 3.76b 4.13 LB < HB1.198 1.11
PU 2.83 3.36 LB < HB1.16 1.10
ATTM 3.33 3.72 LB < HB1.26 1.14
PR 3.50 2.98 HB < LB1.19 .97
IV 3.26 3.46 None1.38 1.34
n=96 n=973.77 3.97 None
ATTE 1.44 1.61
3Significant differences between groups are t-tests at p=.05 or less. '’Mean'Standard Deviation
Table 4.25). The mean difference between the two groups on IV (.8319) was significant
(p = .001), and the mean difference for ATTE (1.2593) was also significant (p < .001).
For both variables, the high credibility group had significantly higher scores than the
low credibility group. Thus, hypothesis 2a is fully supported.
Test of Hypothesis H2b. This hypothesis proposed that subjects exposed to a highly
credible TPO endorsement will show higher scores on measures o f PQ, PU, ATTM, and
lower scores on PR than subjects exposed to a TPO endorsement o f low credibility for
the same brand. This is really just an extension of H2a to cover the product set of
variables. Accordingly, the same cells are being compared and the same grouping
variable may be used. As shown in Table 4.25, means for the two groups on the four
product variables are all significantly different by t-test, and the difference is in the
110
Reproduced with permission of the copyright owner. Further reproduction prohibited without permission.

TABLE 4.23FACTOR-LEVEL GROUP COMPARISONS FOR ENDORSEMENT,
EXPERIMENT TWO
No Celebrity TPOEndorsement Endorsement Endorsement
(NE) (C) (TPO) Significance1n=44 n=101 n=92
PQ 3.95b 3.61 4.30 C < TPO1.19° 1.02 1.21
PU 3.15 3.06 3.11 None1.22 1.14 1.16
ATTM 3.52 3.39 3.67 None1.21 1.22 1.20
PR 3.10 3.46 3.07 None1.02 1.14 1.10
IV 3.16 2.98 3.88 C,NE < TPO1.47 1.29 1.23
ATTE N/A 3.48 4.29 C < TPO1.48 1.47
“Significant differences between groups are Student-Newman-Keuls tests at p=.05 or less, except for ATTE which is a t-test between two groups.‘’MeancStandard deviation
direction hypothesized. Specific comparisons are as follows: PQ (t = 2.984, p = .004),
PU (t = 2.997, p = .004), ATTM (t = 6.027, p < .001), and PR (t = -2.177, p = .032).
Thus, hypothesis 2b was fully supported.
Test o f Hypothesis H2c. This hypothesis stated that subjects exposed to an ad
containing a TPO endorsement o f low credibility will show lower scores on measures o f
PQ, PU, and ATTM than subjects exposed to a similar ad for the same brand not
containing an endorsement. This is the so-called ‘boomerang’ hypothesis. A grouping
variable was created to bring together cells 2 and 4 (low credibility TPO endorsement
cells) and cells 9 and 10 (no-endorsement cells). Means for the two groups were then
111
Reproduced with permission of the copyright owner. Further reproduction prohibited without permission.

TABLE 4.24TEST OF HYPOTHESIS 1: EXPERIMENT TWO
NoEndorsementManipulation
(NE)n=44
CredibleCelebrity
Endorsement(CC)n=53
CredibleTPO
Endorsement(CTP)n=47
Significance3
PQ 3.95b 3.92 4.65 CC,NE < CTP1.19c .97 1.08
PU 3.15 3.38 3.45 None1.22 1.15 1.19
ATTM 3.52 3.89 4.29 NE < CTP1.21 1.27 .99
PR 3.10 3.22 2.84 None1.02 1.15 1.24
IV 3.16 3.33 4.28 NE,CC < CTP1.47 1.32 1.04
3 Significant differences between groups are Student-Newman-Keuls tests at p=.05 or less bMeanc Standard Deviation
TABLE 4.25TEST OF HYPOTHESES 2A AND 2B, EXPERIMENT TWO
Low Credibility TPO Endorsement
(LCTP) n=45
High Credibility TPO Endorsement
(HCTP) n=47
Significance3
PQ 3.93b 4.65 LCTP < HCTP1.23° 1.08
PU 2.75 3.45 LCTP < HCTP1.03 1.19
ATTM 3.02 4.29 LCTP < HCTP1.05 .99
PR 3.33 2.84 HCTP < LCTP.88 1.24
IV 3.45 4.28 LCTP < HCTP1.28 1.04
ATTE 3.66 4.91 LCTP < HCTP1.34 1.33
3 Significant differences between groups are t-tests at p=.05 or less bMeanc Standard Deviation
Reproduced with permission of the copyright owner. Further reproduction prohibited without permission.
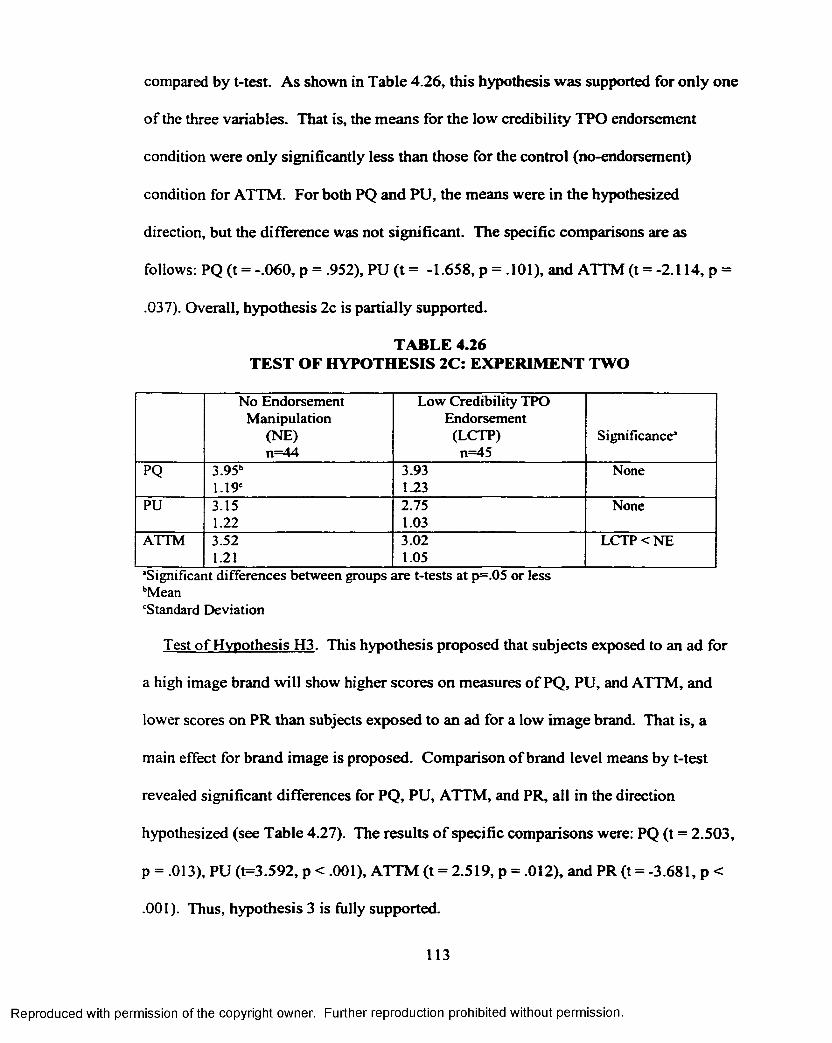
compared by t-test. As shown in Table 4.26, this hypothesis was supported for only one
of the three variables. That is, the means for the low credibility TPO endorsement
condition were only significantly less than those for the control (no-endorsement)
condition for ATTM. For both PQ and PU, the means were in the hypothesized
direction, but the difference was not significant. The specific comparisons are as
follows: PQ (t = -.060, p = .952), PU (t = -1.658, p = .101), and ATTM (t = -2.114, p =
.037). Overall, hypothesis 2c is partially supported.
TABLE 4.26TEST OF HYPOTHESIS 2C: EXPERIMENT TWO
No Endorsement Manipulation
(NE) n=44
Low Credibility TPO Endorsement (LCTP) n=45
Significance'
PQ 3.95b 3.93 None1.19C 1.23
PU 3.15 2.75 None1.22 1.03
ATTM 3.52 3.02 LCTP < NE1.21 1.05
'Significant differences between groups are t-tests at p=.05 or less bMean‘Standard Deviation
Test of Hypothesis H3. This hypothesis proposed that subjects exposed to an ad for
a high image brand will show higher scores on measures o f PQ, PU, and ATTM, and
lower scores on PR than subjects exposed to an ad for a low image brand. That is, a
main effect for brand image is proposed. Comparison of brand level means by t-test
revealed significant differences for PQ, PU, ATTM, and PR, all in the direction
hypothesized (see Table 4.27). The results o f specific comparisons were: PQ (t = 2.503,
p = .013), PU (t=3.592, p < .001), ATTM (t = 2.519, p = .012), and PR (t = -3.681, p <
.001). Thus, hypothesis 3 is fully supported.
113
Reproduced with permission of the copyright owner. Further reproduction prohibited without permission.

TABLE 4.27TEST OF HYPOTHESIS 3: EXPERIMENT TWO
Low Image Brand (LB) n=l 19
High Brand Image (HB) n=l 18 Significance*
PQ 3.76b 4.13 LB < HB1.19* 1.11
PU 2.83 3.36 LB < HB1.16 1.10
ATTM 3.33 3.72 LB <HB1.26 1.14
PR 3.50 2.98 HB < LB1.19 .97
‘Significant differences between groups are t-tests at p=.05 or less Mean‘Standard Deviation
Test o f Hypothesis H4. This hypothesis stated that subjects exposed to a credible
endorsement for a brand will show higher scores on measures o f PQ, PU, and ATTM,
and lower scores on measurers of PR than subjects exposed to an endorsement for the
same brand with low credibility. In brief, a main effect for credibility is proposed. A
grouping variable was created to bring together cells 1, 3, 5, and 7 (high credibility
endorsement cells) and 2 ,4 , 6, and 8 (low credibility endorsement cells). Comparison
of these two groups by t-test (Table 4.28) revealed that means for the high credibility
condition were significantly greater than means for the low credibility condition for PQ
(t = 4.177, p < .001), PU (t = 4.360, p < .001), and ATTM (t = 7.416, p < .001). For PR,
the mean for the low credibility condition was significantly greater than the mean for
the high credibility condition (t = -3.078, p = .002). Thus, hypothesis 4 is fully
supported in all respects.
Test o f Hypothesis H5. This hypothesis proposed that endorsement cue will interact
with brand cue such that the increase in mean response, going from celebrity
114
Reproduced with permission of the copyright owner. Further reproduction prohibited without permission.

TABLE 4.28TEST OF HYPOTHESIS 4: EXPERIMENT TWO
Low Credibility Endorsements (LC)
n=93
High Credibility Endorsements (HC)
n=100 Significance1PQ 3.59b 4.27 LC < HC
1.15* 1.08PU 2.73 3.41 LC < HC
1.02 1.16ATTM 2.93 4.08 LC < HC
.98 1.16PR 3.53 3.04 HC < LC
1.01 1.19“Significant differences between groups are t-tests at p=.05 or less bMean‘Standard Deviation
endorsement to TPO endorsement, on the dependent variables o f PQ, PU, and ATTM
will be greater for low image than high image brands. As noted in the earlier section on
MANOVA for the product set of variables, the multivariate brand (B) by endorsement
(E) interaction was not significant (F = 1.173, p = .324). Tests o f a B x E interaction for
the univariate elements revealed the following: PQ (F = .001, p = .975), PU (F= 1.259, p
= .263), and ATTM (F = .817, p = .594). Thus, there is no support for hypothesis H5;
none o f the three univariate interactions are significant.
Test of Hypothesis H6. This hypothesis stated that source credibility cue will
interact with brand image such that the increase in mean response going from low
credibility to high credibility on the dependent variables of PQ, PU, and ATTM will be
greater for low image brands than high image brands. As noted in the section for
MANOVA of the product set of variables, the multivariate credibility (C) by brand
interaction was not significant (F = .771, p = .546). Tests of a C x B interaction for the
univariate elements revealed the following: PQ (F = .072, p = .789), PU (F = 2.548,
115
Reproduced with permission of the copyright owner. Further reproduction prohibited without permission.

p = .112), and ATTM (F = .927, p = .337). None of these three interactions are
significant and, thus, there is no support for hypothesis H6.
116
Reproduced with permission of the copyright owner. Further reproduction prohibited without permission.

CHAPTER FIVE: DISCUSSION
This chapter will begin by discussing each experiment separately, then the results of
the two experiments will be compared. Subsequent sections compare the present
findings to past literature on TPO endorsement, and address the limitations o f this
investigation, the managerial implications of the results, and future directions for
research on TPO endorsements in advertising.
Experiment One
This experiment studied the advertising effects of TPO and celebrity endorsements
(and the moderating factors o f brand and credibility on these endorsements) on subject
perceptions of a personal computer. The dependent variables included perceived
product quality (PQ), perceived product uniqueness (PU), attitude toward the
manufacturer (ATTM), and perceived risk of purchase (PR, in aggregate, the product
set of variables), and ad (information) value (TV) and attitude toward the endorser
(ATTE, together, the advertisement set of variables). Each set o f variables was
analyzed separately in MANOVA. The independent variables of brand and credibility
were pre-tested to determine high and low levels o f brand image and credibility,
respectively. It was expected that opposing levels o f these independent variables may
have different influences on the dependent variables, so the subsequent finding of main
effects for these variables was not surprising. The focus of the experiment was the main
effect o f endorsement as an independent variable and any interactions endorsement may
have with brand image and credibility.
The Endorsement Factor. The results o f MANOVA for the product set o f variables
indicated a significant (p < .001) multivariate main effect for endorsement (Table 4.3).
117
Reproduced with permission of the copyright owner. Further reproduction prohibited without permission.

The magnitude o f the main effect is moderate (t |2 o f .197), suggesting that the effect is
significant in both a practical and statistical sense. By far, the largest univariate
contributor to the multivariate effect size is PQ (univariate r|2 of .184). O f the four
product dependent variables, PQ had a univariate F-value five times larger than any
other variable. Certainly, the contribution of PQ toward the endorsement main effect
overshadows that of the other variables.
It may be noted that PR did not support the endorsement main effect, exhibiting a
non-significant F-value and a meager r|2 of .011. Theoretic arguments were advanced in
Chapter Two suggesting that TPO endorsement should reduce purchase risk to a greater
degree than other types of ads. Possibly, the non-significance of PR in the main effect
is due to the collapse of credibility conditions which occurred during the analysis. That
is, the main effect compares TPO endorsement cells to celebrity endorsement cells
collapsed across all other conditions. Supporting this explanation, we find in the test of
hypothesis 1 (Table 4.10) that the credible TPO endorsement condition has a
significantly lower mean for PR than either the credible celebrity endorsement
condition or the no endorsement condition. Thus, when the groups are separated by
endorsement and credibility condition, the expected results are found. Further, the
results imply that reduction o f PR may not occur unless the ad is credible. The
relationship between PR and credibility will be addressed later in this section.
The endorsement main effect compared only the two endorsement conditions (TPO
and celebrity); the third condition (no-endorsement) is considered in Table 4.9. Here,
we find a stair-step increase o f means going from no-endorsement, to celebrity
endorsement, to TPO endorsement, for PQ, PU and IV with the TPO endorsement cells
118
Reproduced with permission of the copyright owner. Further reproduction prohibited without permission.

having significantly more favorable means than either the celebrity endorsement cells or
the no-endorsement cells. This is additional evidence for the effectiveness o f TPO
endorsement compared to the other endorsement conditions. The means for PR among
the three endorsement conditions in Table 4.9 are not significantly different. As
discussed earlier, this is believed to be due to the collapse o f credibility conditions
across endorsement cells and the effect of advertisement credibility upon PR.
The results of MANOVA for the advertisement set o f variables indicated a
significant (p < .001) multivariate main effect for endorsement (Table 4.4). The
magnitude of the main effect is small (r|2 = .090), however, suggesting that the effect
may not have great practical meaning. Both dependent variables contributed to the
effect. As noted earlier, credibility may be a necessary requirement for endorsement to
have its full effect. This appears to make sense, because perceived low credibility would
probably negate the positive effect o f endorsement on information value and attitude
toward the endorser. Appearing to support this, we find a marginally significant (p =
.072) multivariate credibility by endorsement interaction for the advertisement set of
dependent variables.
The only significant multivariate interaction in Experiment One was a brand by
endorsement interaction for the product variable group (p = .047, r|2 =.055). This
interaction was supported by two of the four dependent variables, PQ and PU. Graphs
o f this interaction (Figures 4.2 and 4.3) show that the PQ and PU o f the low image
brand of personal computer increased to a greater degree than that o f the high image
brand, going from celebrity to TPO endorsement. This interaction had been proposed
as hypothesis 5, and it was gratifying to see support for the interaction even when cells
119
Reproduced with permission of the copyright owner. Further reproduction prohibited without permission.

were collapsed across credibility levels. The credibility by brand interaction
(hypothesis 6) approached significance (p = .100), but was not significant.
The basis for the brand by endorsement interaction hypothesis was the work of Wu
and Shaffer (1987). These authors argued that consumers with direct versus indirect
brand experience will differ in their susceptibility to a counterattitudinal message. That
is, an attitude formed by direct experience is believed to be more clearly and
confidently held than an attitude formed on the basis o f hearsay. Within the context of
this experiment, the classification of brands into high and low image may suggest that
consumers would have less direct experience with the low image brand. This
assumption is based on the rationale that a brand held in low regard is probably less
likely to be purchased. Lacking direct experience with the low image brand, consumers
may review and favorably change their opinion o f the brand upon endorsement o f the
brand. That is, viewers of an endorsement for the low image brand may perceive their
existing opinion o f the brand to be biased and undertake a review o f their attitude (the
process o f judgement correction). If the endorsement is convincing and respondents
can identify a reason why their attitude may have been biased (such as lack o f direct
experience with a brand) attitude correction may occur. Judgement correction is often
extreme and in the opposite direction to the bias (Myers-Levy and Malaviya 1999). The
results o f the brand by endorsement interaction in MANOVA appear to support the
attitude correction hypothesis.
The Brand Factor. The brand image variable exhibited a highly significant main
effect for the product set of variables (p < .001, r|2 = .217). The effect size for brand
image is the largest o f the three independent variables in this experiment. The moderate
120
Reproduced with permission of the copyright owner. Further reproduction prohibited without permission.
size o f T | “ suggests that brand image has practical as well as statistical significance.
Among the four dependent variables, brand image received the greatest support from
ATTM (r|2= .190). The variables o f PQ (q2 = .076) and PR (rj2= .032) also contributed
to the brand image main effect, but the magnitude of their effects was overshadowed by
that of ATTM. The PU variable did not exhibit a significant univariate support for the
main effect. This suggests that, at least for the two brands/models being compared,
product uniqueness was not a discriminating factor. It may be noted that endorsement,
rather than brand image, elicited the largest effect from PQ of the three independent
variables. This again suggests the effectiveness of endorsement in influencing
consumer perceptions of products.
For the advertisement set of variables, brand image had a significant main effect (p =
.038). However, the r|2 was a feeble .037. O f the two advertisement variables, only IV
contributed significantly to the brand image effect (q2 = .035).
The brand image main effect may be better grasped by looking at Table 4.8
(comparison o f the two brand image group means on the six dependent variables). The
high image brand group has significantly more favorable scores than the low image
brand group on all variables except PU and ATTE. However, the two brand image
groups are collapsed across credibility and endorsement conditions, and this may have
had the effect o f clouding the influence o f these factors on the brand image results. For
example, cells 9 and 10 (see Table 4.6) indicate the baseline means in the presence of
brand cue but absent endorsement and credibility manipulation. We see that the means
are in the approximate center range o f the 1 to 7 scale and that the high image brand has
more favorable means than the low image brand. Conversely, in cells 1 and 3 (credible
121
Reproduced with permission of the copyright owner. Further reproduction prohibited without permission.

TPO endorsement cells o f high image brand and low image brand, respectively) we find
that the low image brand has “caught up” with the high image brand. That is, the
dependent variable means for cells 1 and 3 are very similar, suggesting that TPO
endorsement has raised consumer perceptions of the low image brand to essentially
equal those o f the high image brand. This “catch up” cell comparison is less obvious
for cell 5 and 7 (celebrity endorsement cells) and other cell pairings.
The “catch up” effect mentioned above is a demonstration o f the effect o f TPO
endorsement as an advertising cue. In their article on signals o f product quality, Dawar
and Parker (1994) concluded that brand names have been found to be more important
than price, physical appearance, or retailer reputation. The “catch up” phenomenon
suggests that TPO endorsements (and this is probably most true for credible TPO
endorsements) may counteract the negative influence o f a powerful extrinsic cue (low
brand image). That is, the presence o f both cues may result in attitude toward the low
image brand being enhanced to a much greater degree than attitude toward the high
image brand. This finding may suggest a practical use for TPO endorsements in
advertising products with low brand equity but high objective product quality.
The Credibility Factor. The credibility variable exhibited a highly significant main
effect for the product set o f variables (p < .001, T|2 = .195). This was not surprising.
Opposing levels o f credibility were expected to have different effects on at least some
of the dependent variables. However, the credibility variable is remarkable for the fact
that all six dependent variables significantly (p < .01) supported its main effect. Indeed,
credibility is the only one of the three independent variables (endorsement, brand,
credibility) to receive such broad support.
122
Reproduced with permission of the copyright owner. Further reproduction prohibited without permission.

The significance, effect size, and broad univariate support for the credibility main
effect suggests that credibility exerts a fundamental influence over essentially all
potential effects o f the endorsement. This may be seen in Table 4.6 where adjacent
cells (columns) have alternating high and low credibility classifications. We find a
"sawtooth" pattern (alternating rise and fall) o f dependent variable means going from
column to column. The high credibility cells (columns) generally have more favorable
means than the low credibility columns. Additional evidence for the credibility effect
may be found in Table 4.7. Here, the three credibility conditions (high, low, and no
credibility manipulation) are compared against each other. The high credibility
condition occupies the significantly more favorable position for each dependent
variable. Finally, a credibility main effect was proposed as hypothesis 4, and test o f this
hypothesis (Table 4.14) supported the proposition for all specified variables (PQ, PU,
ATTM, and PR).
Experiment Two
This experiment studied the advertising effects of TPO and celebrity endorsements
(and the moderating factors o f brand and credibility on these endorsements) on subject
perceptions of auto insurance. This product is a pure service, quite unlike the tangible
good used in Experiment One (a personal computer). The dependent variables included
perceived product quality (PQ), perceived product uniqueness (PU), attitude toward the
manufacturer (ATTM), and perceived risk o f purchase (PR, in aggregate, the product
set of variables), and ad (information) value (IV) and attitude toward the endorser
(ATTE, together, the advertisement set o f variables). Each set o f variables was
analyzed separately in MANOVA. The independent variables o f brand and credibility
123
Reproduced with permission of the copyright owner. Further reproduction prohibited without permission.

were pre-tested to determine high and low levels o f brand image and credibility,
respectively. It was expected that opposing levels o f these independent variables may
have different influences on the dependent variables, so the subsequent finding of main
effects for these variables was not surprising. The focus o f the experiment was the main
effect of endorsement as an independent variable and any interactions endorsement may
have with brand image and credibility.
The Endorsement Factor. The results o f MANOVA for the product set o f variables
indicated a significant (p < .001) multivariate main effect for endorsement (Table 4.17).
The magnitude o f the main effect is small to moderate (r|2 o f .122), and less than the
comparable endorsement effect for personal computers (t|2 o f .197). Only two of four
product dependent variables significantly supported the endorsement effect, PQ and PR.
By far, the largest univariate contributor to the endorsement effect size is PQ, a pattern
also found in Experiment One. However, unlike the results for personal computers, PR
significantly supported the endorsement effect. It may be recalled that risk reduction
was one o f the hypothesized functions o f TPO endorsement. As in Experiment One,
however, the relationship between PR and the three independent variables was more
pronounced for credibility and brand image than for endorsement. Although
endorsement elicited the largest effect from PQ in Experiment One, this was not true in
Experiment Two. Rather, credibility elicited the largest F-value from PQ (21.090) with
endorsement close behind (20.565). Overall, MANOVA o f the product set o f variables
suggests that endorsement had a weaker effect in Experiment Two than in Experiment
One. Possible reasons for this weaker effect of endorsement will be addressed in a
later section.
124
Reproduced with permission of the copyright owner. Further reproduction prohibited without permission.

Additional evidence for the diminished effect of endorsement may be seen in Table
4.23 (endorsement group comparisons on the dependent variables). Of the six
dependent variables, it is only for IV that the TPO endorsement group mean is
significantly greater than that o f the no-endorsement group mean. This is a very
different result than when the endorsement groups in Experiment One were compared
(Table 4.9). There, TPO endorsement group means for PQ, PU, and IV were all
significantly greater than both the no-endorsement group and the celebrity endorsement
group. The results suggest that TPO endorsement was less effective in Experiment Two
than in Experiment One in enhancing respondent perceptions o f product quality.
Endorsement also exhibited a significant main effect for the advertisement set o f
variables (p < .001, r|2 =159). This is a larger effect size than in the first experiment
(r|2 =.090 there). This larger effect size is supported by both IV and ATTE, but the
pattern is different (comparing Tables 4.24 and 4.4). In Experiment One, ATTE was
the much larger contributor, but in Experiment Two, IV provides the most support
(univariate r|2 =.132). Indeed, o f the three independent variables, endorsement elicited
the largest F-value and effect size from IV. The results suggest some increased strength
for endorsement among the advertisement set o f variables in Experiment Two, but the
results also show weaker effects for endorsement among the product variables in
Experiment Two compared to Experiment One.
The Brand Factor. The brand image variable exhibited a highly significant main
effect for the product set of variables (p < .001, r|2 = .154). The effect size for brand
image in Experiment One was rj2= .217 (see Table 4.3), so the brand image effect is
somewhat diminished in Experiment Two. Also, brand image went from having the
125
Reproduced with permission of the copyright owner. Further reproduction prohibited without permission.

largest effect size o f the three independent variables in Experiment One to having the
second largest effect size in Experiment Two (Table 4.17). While effect sizes for the
three factors were all relatively similar in Experiment One, credibility has a decidedly
large effect size in Experiment Two, and the effect sizes o f both brand and endorsement
are diminished, relative to Experiment One.
Of the four dependent variables, the largest contributor to the brand image main
effect is PR (r|2 = .103). This pattern o f dependent variable support is also different
from Experiment One. There, PU did not support the main effect and the largest
contributor was ATTM. In Experiment Two, all four variables significantly support the
brand image main effect and the largest contributor is PR.
Hypothesis 3 proposed a main effect for brand image for PQ, PU, ATTM and PR.
T-test of the means o f high image and low image groups found significant differences
for all four variables with the high brand image group occupying the more favorable
position in each instance (Table 4.27). The product variable brand by endorsement
interaction that was significant in Experiment One is not significant in Experiment Two.
For the advertisement set o f variables, brand image had an insignificant main effect
(p = .409, r|2 = .010). O f the two advertisement variables, neither IV nor ATTE
significantly supported the main effect. However, the credibility by brand interaction
was significant in MANOVA o f the advertising variables (p = .026, r|2 = .039),
receiving significant support from both IV and ATTE. Graphs o f these interactions are
shown in Figures 4.9 and 4.10; they indicate that the increase in mean response for IV
and ATTE is greater for low image brands than high image brands. Although the
interactions in both figures are disordinal, t-tests of the sets o f means nearest the line
126
Reproduced with permission of the copyright owner. Further reproduction prohibited without permission.
cross were not significant, suggesting that the effects may still be interpreted. In any
event, the relatively small effect sizes (.027 for IV and .095 for ATTE) suggest that the
interaction may not have much practical significance.
The Credibility Factor. The credibility variable exhibited a highly significant main
effect for the product set of variables (p < .001, rj2 = .259). A significant effect was not
unexpected. However, the credibility variable is remarkable for the fact that all six
dependent variables significantly (p < .01) supported its main effect (see Tables 4.17
and 4.18). Indeed, credibility is the only one of the three independent variables to
receive such broad support in Experiment Two.
The credibility effect size (t|2 = .259) is the largest o f any independent variable in
either o f the two experiments. Although all four product variables significantly
supported the credibility effect, the strongest contributor was ATTM (univariate
r|2 = .241). It may be noted that brand image received the strongest support from
ATTM in Experiment One. Yet, in Experiment Two, the credibility the F-value for
ATTM was 58.869 while the similar value for brand image was 6.744. The difference
may suggest that the respondents were less familiar with auto insurance brand names
(Experiment Two) than personal computer brand names (Experiment One) and relied on
the credibility of the advertisement to make a brand judgement.
There was also a significant credibility main effect for the advertisement set o f
variables (p < .001, t|2= .171, see Table 4.25). Both IV and ATTE significantly
supported the effect.
Additional evidence for the credibility effect may be seen in the comparison o f
credibility groups (high, low, and no credibility manipulation) in Table 4.21. Here, the
127
Reproduced with permission of the copyright owner. Further reproduction prohibited without permission.

high credibility group has means that are significantly more favorable than those o f the
low credibility group for all variables. Further support for the credibility effect is seen
in the Table 4.20 where adjacent cells (columns) have alternating high and low
credibility classifications. We find a "sawtooth" pattern (alternating rise and fall) of
dependent variable means going from column to column. The high credibility cells
(columns) generally have more favorable means than the low credibility columns.
Finally, a credibility main effect was proposed as hypothesis 4, and test of this
hypothesis (Table 4.28) supported the proposition for all specified variables (PQ, PU,
ATTM, and PR).
Comparison of the Two Experiments
The Product Factor. The reader may question why the two data sets (Experiments
One and Two) were not merged so that the product factor (personal computer versus
auto insurance) could be examined in MANOVA (i.e., a 2 X 2 X 2 X 2 design). The
rationale against such analysis is that a problem of interpretability arises. For example,
both the products and the advertising claims used in TPO endorsements for the two
experiments are different. The personal computer TPO endorsement claimed that the
machine had been rated number one (of 11 comparable brands/models tested) in overall
performance based on speed, convenience, upgradibility, and reliability. The auto
insurance TPO endorsement claimed that the company had been rated number one (of
26 different auto insurance companies) in claims satisfaction based on the claims
experience o f 32,000 policyholders. One claim is objective (a machine test) based on
specified criteria, while the other is more subjective. If product type were to have a
main effect in MANOVA, would this be due to the fact that one product is a pure
128
Reproduced with permission of the copyright owner. Further reproduction prohibited without permission.
service and the other a tangible good, or because the advertising claims for the two are
different? Even if the advertising claims were constructed to be similar, the two
products were not equated for risk and other factors that would allow one to say that a
difference between the two is due solely to the fact that one is a service and the other a
tangible good.
Intrinsic cues would also confound the interpretation o f a product factor. The
advertisement for the personal computer included four intrinsic cues (clock speed of
central processor, transfer speed o f modem, size of RAM memory, and size o f hard
disk). The concept o f intrinsic cues does not transfer well to an ad for a pure service
such as auto insurance; thus, the insurance ads did not contain equivalent cues. Again,
any product effect that might be found is confounded by an inability to determine which
of multiple conditions may have led to the effect. Given these problems, the product
factor was not explored at this time.
It may be noted that a brand by endorsement interaction was present in Experiment
One but not Experiment Two. That is, TPO endorsement was able to increase
respondent perception of a low brand image desktop computer to a significantly greater
degree (compared to celebrity endorsement) than the perception of a high brand image
computer was increased, and this interaction was not apparent when the product was
auto insurance. It is unclear why TPO endorsement o f a low image brand would differ
for the two products. Possible reasons for the difference include: a) TPO endorsement
has a differential effect on the products (tangible good versus a service), b) the claims
used in the TPO endorsements were different and this impacted their effectiveness, c)
the cues used in the ads were different (absence of intrinsic cues for auto insurance) and
129
Reproduced with permission of the copyright owner. Further reproduction prohibited without permission.

this affected the results, and d) the respondent’s familiarity with the two product
categories was different and this moderated the effectiveness o f the TPO endorsement.
A combination o f the four reasons may be the most likely explanation. As noted above,
the claim for computers appeared to be more “objective” and the claim for auto
insurance could be perceived as “subjective”. Respondents may have been more
skeptical o f the later claim. Also, respondents may have been familiar with computers
and able to interpret the intrinsic cues appearing in the computer ads as quality signals.
No similar signals appeared in the ads for auto insurance. Thus, the two ads may have
had different informational value to the respondents. Lacking adequate information, the
respondents to the auto insurance ads may have “discounted” the perceived quality of
the insurance to adjust for the lack o f information.
Appearing to support the lack o f information rationale, a comparison of tests o f
hypothesis 1 in Experiment One (Table 4.10) and Experiment Two (Table 4.24) finds
the means for IV (the closest variable to a measure of skepticism) to be lower in
Experiment Two than Experiment One for all three endorsement conditions (TPO,
celebrity, and no-endorsement). In general, comparable means for the same dependent
variable are lower in Experiment One (Table 4.10) than Experiment Two (Table 4.24).
Endorsement and the Other Factors. O f the three independent variables, credibility
probably has the largest combined effect size (main effect) across both sets of
dependent variables for the two experiments (.195 + .170 + .259 + .171). This
compares to brand image (.217 + .037 + .154 + .010) and endorsement (.197 + .090 +
. 122 + . 159). Brand image had a relatively diminished effect on the advertisement set
of variables in each experiment. Based on theory, however, it is surprising that
130
Reproduced with permission of the copyright owner. Further reproduction prohibited without permission.

endorsement does not have a greater effect, especially in the second experiment. Recall
that TPO endorsements used in both experiments were constructed to communicate
experience/credence characteristics of products to consumers prior to purchase. Such
information should reduce the risk of purchase. For services, especially, consumers are
believed to rely on experience properties to evaluate quality (Parasuraman, Zeithaml,
and Berry 1985). Given the large difference between TPO and celebrity endorsements
in the amount o f experience properties communicated, a larger main effect was perhaps
expected.
Consistent in both experiments, the endorsement factor exhibited a significant
(p < .001) main effect for product and advertisements sets o f variables. Test of
hypothesis 1 (superiority o f TPO endorsement over celebrity and the no-endorsement
conditions) was at least partially supported for both experiments, although support was
weaker in Experiment Two than Experiment One. Also, the B x E interaction found in
Experiment One did not occur in Experiment Two. This may have been due to
differences in the TPO endorsement (claim and presence o f intrinsic cues) between the
two experiments.
Examination o f Table 4.6 suggests that TPO endorsement was most effective when
the advertisement was highly credible and the brand was low image (cell 3). A
comparison of cell 3 to cell 10 (low image brand control) indicates large favorable mean
changes on all dependent variables (excluding ATTE which has no control). Indeed,
the changes between cell 3 and cell 10 are larger than the changes between any other
cell and its brand control. This may suggest a practical use for TPO endorsement when
the advertisement is credible, an “objective” claim can be used together with intrinsic
131
Reproduced with permission of the copyright owner. Further reproduction prohibited without permission.
cues, and the product is a low image brand. This suggestion is supported not only by
the findings in the current study but also by the work of Wu and Shaffer (1987).
Comparison to Past TPO Endorsement Research
It may be noted that the only prior research on the effects o f TPO endorsement found
entirely negative results (Peterson, Wilson, and Brown 1992). These authors
operationalized their TPO as a fictional independent market research company and the
endorsement was a statement that a fictional brand had been rated number one in overall
satisfaction based on survey results. Six different goods/services were endorsed (shoe
repair, mutual fund, health maintenance organization, insect spray, digital audio tape,
and electric screwdriver). The TPO endorsements were compared to testimonial
endorsements and ads containing no satisfaction information on measures of attitude
toward the brand, attitude toward the manufacturer, attitude toward the ad, and purchase
intention. Advertisements containing TPO endorsements were found to be no more
effective than ads without TPO endorsements. However, a highly significant (p < .001)
difference was found in consumer responses to the various products.
There are interesting differences between the investigation described above and the
present study. The largest difference is that TPO endorsements in this study were found
to have a significant effect (compared to celebrity endorsements). The range of
dependent variables in this study is a bit more broad and this may partially explain the
discrepancy. However, there are further differences in that the TPO is this study
{Consumers’ Digest) was not fictional, the brands were from the real-world, and two
different endorsement claims were used. The different results in the two studies may be
due, in part, to these differences in opertionalization of the investigations.
132
Reproduced with permission of the copyright owner. Further reproduction prohibited without permission.
Because it used a satisfaction claim, Experiment Two o f this study is probably most
comparable to the investigation of Peterson, Wilson, and Brown. Although a significant
endorsement effect was found in this experiment, the results were weaker than those o f
Experiment One (which used a performance claim). The negative findings of Peterson,
Wilson, and Brown may be due to their use o f a satisfaction claim and fictional TPO
and brand names which could have left respondents questioning the credibility of the
endorsement. Indeed, the magnitude o f the credibility main effect in the current study
suggests that credibility may have been an overlooked factor in the earlier investigation.
Limitations
The conditions o f this investigation were very artificial. For example, advertisement
processing probably occurred under high-involvement, a state that would predispose the
respondent to question the credibility o f the endorsement. As evidence of this, we see
in Tables 4.6 and 4.20 a “sawtooth” pattern o f alternating high and low means in
adjacent cells that differ only in credibility. The possible effects o f low-involvement
processing of TPO endorsement are unclear. An additional limitation is exclusion of
other extrinsic quality cues (price, retailer name and location, warranty) from the
advertising stimuli. Any or all of these cues may interact with the cues studied in this
investigation. Also, the effects of repetitive viewing of the ad stimuli on attitude
formation/change were not studied. Finally, the products chosen for investigation
(desktop computers, auto insurance) are relatively expensive. TPO endorsement o f
inexpensive, frequently purchased products may have very different results. All o f the
above limit the conclusions that may be drawn from this study, and suggest that the
findings may not generalize to other environments and populations.
133
Reproduced with permission of the copyright owner. Further reproduction prohibited without permission.

The present study compared TPO endorsement (as an ad type) to celebrity
endorsement (as an ad type). However, there are a number of other types of ads to
which TPO endorsement could be compared, and the relative effectiveness of TPO
endorsement within these comparisons remains unknown. If the effects o f TPO
endorsement are achieved through cognitive processing of the ad (which is probably
true), then it would be especially interesting to compare TPO endorsement to an ad
processed primarily by affect. Certainly, both types o f ad processing occur and both
may affect attitude toward the brand (Edell and Burke 1987; Burke and Edell 1989).
Certain product classes may be evaluated more by affect than cognition (entertainment,
food) and TPO endorsement may be relatively ineffective for these product classes.
The inability to make a cognitive versus affective comparison is a limitation of the
current study.
Probably the major limitation of this study (and a threat to the generalizability o f the
findings) is the use of a sample with relatively limited consumer experience. This lack
of experience may predispose the sample to place greater reliance on quality cues in
advertising than would a similar sample of more experienced consumers. Thus,
experience may be an unobserved moderator o f the TPO endorsement effect.
Managerial Implications
The results suggest a practical usefulness for TPO endorsements. Consistent in both
experiments, TPO endorsement of the product resulted in significantly greater perceived
product quality and information value of the ad than did celebrity endorsement. This
may suggest that for certain types of products, TPO endorsement may achieve specific
marketing objectives better than celebrity endorsement.
134
Reproduced with permission of the copyright owner. Further reproduction prohibited without permission.

There are caveats to the above recommendation. First, to achieve its full effect, the
TPO endorsement should be credible. Credibility apparently decreases the negative
attributions that viewers may make about the endorsement, resulting in more favorable
perceptions o f the product and the ad. The results of this study indicate that credibility
also affects celebrity endorsements, and the magnitude o f the effect appears to be about
equal to the credibility effect on TPO endorsements. This is an interesting
development, because going into the study it was believed that respondents would
generally expect celebrity endorsers to be biased in their recommendations. That is, it
was believed that subjects would discount the fact that celebrity endorsers were well
compensated for their service. This appears not to be true.
The second caveat is that credible TPO endorsements appear to be most effective
when they are promoting a brand with a low image. That is, the magnitude o f
perceptual enhancement due to TPO endorsement is greater for low image brands than
high image brands. This may suggest that TPO endorsement would be most appropriate
for a brand with low brand equity but high objective quality. The third caveat is that an
“objective” TPO endorsement claim may perform better than a “subjective” claim. This
conclusion is based on the stronger results achieved in Experiment One versus
Experiment Two.
Future Directions for Research
The results of this study raise a number of questions that may be addressed with
future research. To start, this investigation only looked at TPO endorsement of
products. It is possible that endorsement o f companies might be a practical application
o f the TPO type of endorsement. For example, there are a number o f start-up
135
Reproduced with permission of the copyright owner. Further reproduction prohibited without permission.
companies in the internet industry that lack name awareness and brand image. These
start-ups may wish to reach an audience o f consumers or potential investors.
Endorsement of the start-up by a more well known technology company could help to
achieve the goals of the smaller company. The larger company may be willing to
endorse the smaller company because the two are linked through a vendor relationship
or a technology-sharing alliance. In any event, the start-up may leverage the
relationship to help achieve desired goals.
Second, the extrinsic quality cues of price, retailer reputation and location, and
warranty may be investigated as potential moderators o f the TPO endorsement - quality
perception relationship. The current study found that brand (a well-recognized extrinsic
cue) interacted with endorsement in Experiment One. It is possible that other extrinsic
cues also moderate the endorsement effect. Third, TPO endorsement may be compared
against other types of endorsements (expert, testimonial) and/or other types o f ads (e.g.,
an ad processed through affect rather than cognition) for the ability to change
respondent perception o f the product. As an ad type, TPO endorsement is probably
somewhat limited in the imagery that may be used. However, it is precisely these
affective appeals that strongly influence attitude toward the ad, and indirectly, attitude
toward the brand. From a communications standpoint, it would be interesting to
compare the effects of ads processed primarily through cognition versus affect. Fourth,
TPO endorsement may be tested for its ability to enhance perception o f other types of
products. That is, both products used in this study were relatively expensive, but had
few hedonic consumption characteristics. TPO endorsement may perform very
differently if the advertised product is inexpensive or if the product has strong affective
136
Reproduced with permission of the copyright owner. Further reproduction prohibited without permission.

appeal. For example, food and entertainment are products that may have elicit strong
emotions. In such cases, the consumer may have idiosyncratic tastes and be unwilling
to follow a TPO recommendation.
Summary
Third-party organization product endorsements in advertising are perceived by
consumers as extrinsic quality cues, similar to the established quality cues o f brand,
price, retailer reputation, and warranty. To consumers, TPO endorsement is beneficial
because it may communicate experience and credence properties of products prior to
purchase. To marketers, TPO endorsement may be useful in positioning products
against the competition.
137
Reproduced with permission of the copyright owner. Further reproduction prohibited without permission.

BIBLIOGRAPHY
Aaker, David A. (1996), “Measuring Brand Equity Across Products and Markets,” California Management Review, 38(#3), 102-125.
Aaker, David A. and Donald Norris (1982), “Characteristics o f TV Commercials Perceived as Informative,” Journal o f Advertising Research, 22, 61-70.
Akaah, Ishmael P. and Pradeep K. Korgaonkar (1988), “A Conjoint Investigation o f the Relative Importance o f Risk,” Journal o f Advertising Research,28(August/September), 38-45.
Beltramini, Richard F. and Edwin R. Stafford (1993), “Comprehension and Perceived Believability of Seals of Approval Information in Advertising,” Journal o f Advertising, 22(September), 3-13.
Boulding, William and Amna Kirmani (1993), “A Consumer-Side Experimental Examination of Signaling Theory: Do Consumers Perceive Warranties as Signals of Quality?” Journal o f Consumer Research, 20(June), 111-123.
Brehm, Jack (1966), A Theory o f Psychological Reactance, New York, NY:Academic Press.
Brooker, George (1983), “An Assessment of an Expanded Measure o f Perceived Risk,” Advances in Consumer Research, 11, 439-441.
Burke, Marian C. and Julie A. Edell (1989), “The Impact o f Feelings on “Ad-Based Affect and Cognition,” Journal o f Marketing Research, 26(February), 69-83.
Calfee, John E. and Debra J. Ringold (1988), “Consumer Skepticism Of Advertising: What Do the Polls Show?” in Advances in Consumer Research, Vol. 16, ed. Thomas K. Srull, Provo, UT: Association for Consumer Research, 15-19.
Celsi, Richard L. and Jerry C. Olson (1988), “The Role o f Involvement in Attention and Comprehension Processes,” Journal o f Consumer Research, 15(September), 210-224.
Claxton, John D., Joseph N. Fry, and Bernard Portis (1974), “A Taxonomy Of Prepurchase Information Gathering Patterns,” Journal o f Consumer Research.1 (December), 35-43.
Clow, Kenneth E, Donald F. Baack, and Chris Fogliasso (1998), “Reducing Perceived Risk Through Advertising Service Quality Cues,” Journal O f Professional Services Marketing, 16(#2), 151-162.
138
Reproduced with permission of the copyright owner. Further reproduction prohibited without permission.

Cohen, Joel B. and Junal Basu (1987), “Alternative Models o f Categorization: Toward a Contingent Processing Framework,” Journal o f Consumer Research.13(March), 455-472.
Dawar, Niraj and Philip Parker (1994), “Marketing Universals: Consumers’ Use o f Brand Name, Price, Physical Appearance, and Retailer Reputation As Signals o f Product Quality,” Journal o f Marketing, 58(April), 81-95.
Dholakia, Ruby Roy, and Brian Stemthal (1977), “Highly Credible Sources:Persuasive Facilitators or Persuasive Liabilities?” Journal o f Consumer Research,3 (March), 223-232.
Dowling, Grahame R. and Richard Staelin (1994), “A Model o f Perceived Risk and Intended Risk-handling Activity,” Journal o f Consumer Research,21 (June), 119-134.
Eagly, Alice and Shelly Chaiken (1975), “An Attribution Analysis o f the Effect o f Communicator Characteristics on Opinion Change: The Case o f Communicator Attractiveness,” Journal o f Personality and Social Psychology, 32(1), 136-144.
Eagly, Alice H., Wendy Wood, and Shelly Chaiken (1978), ’’Causal Inferences About Communicators and Their Effect on Opinion Change,” Journal o f Personality and Social Psychology, 36(#4), 424-435.
Edell, Julie A and Marian C. Burke (1987), “The Power of Feelings in Understanding Advertising Effects,” Journal o f Consumer Research, 14(December), 421-433.
Fireworker, Robert B. and Hershey H. Friedman (1977), “The Effects o f Endorsements on Product Evaluation,” Decision Science, 8(July), 576-583.
Flynn, Leisa R., Ronald E. Goldsmith, and Jacqueline K. Eastman (1996) “Opinion Leaders and Opinion Seekers: Two New Measurement Scales,” Journal o f the Academy o f Marketing Science, 24(2), 137-147.
Folkes, Valerie S. (1988), “Recent Attribution Research in Consumer Behavior: A Review and New Directions,” Journal o f Consumer Research, 14(March), 548-565.
Frieden, Jon B. (1984), “Advertising Spokesperson Effects: An Examination of Endorser Type and Gender on Two Audiences,” Journal o f Advertising Research, 24(October-November), 33-41.
Friedman, Hershey H. and Linda Friedman (1979), “Endorser Effectiveness By Product Type,” Journal o f Advertising Research, 19(October), 63-71.
139
Reproduced with permission of the copyright owner. Further reproduction prohibited without permission.

Friestad, Marian and Peter Wright (1994), “The Persuasion Knowledge Model: How People Cope with Persuasion Attempts,” Journal o f Consumer Research,21 (June), 1-31.
Gal-or, Esther (1989), “Warranties as a Signal of Quality,” Canadian Journal o f Economics, 22(February), 50-61.
Giffin, Kim (1967), “The Contribution o f Studies of Source Credibility to a Theory of Interpersonal Trust in the Communication Process,” Psychological Bulletin,68(#2), 104-120.
Heider, Fritz (1958), The Psychology o f Interpersonal Relations, New York, NY:John Wiley & Sons, Inc.
Helson, H. (1964), Adaptation-Level Theory: An Experimental and Systematic Approach to Behavior, New York, NY: Harper & Row.
Hite, Cynthia F., Robert E. Hite, and Tamra Minor (1991), “Quality Uncertainty, Brand Reliance, and Dissipative Advertising,” Journal o f the Academy ofMarketing Science, 19(Spring), 115-121.
Hovland C. I., I. L. Janis, and H. H. Kelly (1953), Communication And Persuasion,New Haven, CT: Yale University Press.
Huber, Joel and John McCann (1982), “The Importance o f Inferential Beliefs on Product Evaluation,” Journal o f Marketing Research, 19( August), 324-333.
Ippolito, Pauline M. (1990), “Bonding and Nonbonding Signals o f Product Quality,” Journal o f Business, 63(1), 41-60.
Jacoby, Jacob and David Mazursky (1984), “Linking Brand and Retailer Images: Do the Potential Risks Outweigh the Potential Benefits,” Journal o f Retailing,60(Summer), 105-122.
Jacoby, Jacob, George J. Szybillo, and Jacqueline Busato-Schach (1977), “Information Acquisition Behavior in Brand Choice Situations,” Journal o f Consumer Research,3(March), 209-216.
Kaplan, Leon B., George J. Szybillo, and Jacob Jacoby (1974), “Components o f Perceived Risk in Product Purchase: A Cross-Validation,” Journal o f Applied Psychology, 59(#3), 287-291.
Keller, Kevin L. (1993), “Conceptualizing, Measuring, and Managing Customer-Based Brand Equity,” Journal o f Marketing, 57(January), 1-22.
140
Reproduced with permission of the copyright owner. Further reproduction prohibited without permission.

Kelly, Harold H. (1973), “The Processes of Causal Attributions,” American Psychologist, 28, 107-128.
Kelman, Herbert C. (1961), “Processes of Opinion Change,” Public Opinion Quarterly, 25(Spring), 57-78.
Lavidge, Robert J. and Gary A. Steiner (1961), “A Model For Predictive Measurements o f Advertising Effectiveness,” Journal o f Marketing, 25(October), 59-62.
Maclnnis, Deborah J. and Bernard J. Jaworski (1989), “Information Processing from Advertisements: Toward an Integrative Framework,” Journal o f Marketing,5 3 (October), 1-23.
McGinnies, Elliott, and Charles D. Ward (1980),”Better Liked than Right:Trustworthiness and Expertise as Factors in Credibility,” Personality and Social Psychology Bulletin, 6(September), 467-472.
Meyers-Levy, Joan and Prashant Malaviya (1999), “Consumers’ Processing of Persuasive Advertisements: An Integrative Framework o f Persuasion Theories,” Journal o f Marketing, 63(Special Issue), 45-60.
Mittal, Banwari (1995), “A Comparative Analysis of Four Scales o f Involvement,” Psychology and Marketing, 12(October), 663-682.
Mizerski, Robert W., Linda L. Golden and Jerome B. Keman (1979), “The Attributional Process in Consumer Decision Making,” Journal o f Consumer Research. 2(September), 123-140.
Murray, Keith B. and John L. Schlacter (1990), “The Impact o f Services Versus Goods on Consumers’ Assessment o f Perceived Risk and Variability,” Journal o f the Academy o f Marketing Science, 18(1), 51-65.
Nelson, Phillip (1970), “Information and Consumer Behavior,” Journal o f Political Economy, 78(March-April), 311-329.
Nelson, Phillip (1974), ’’Advertising as Information,” Journal o f Political Economy, 82(July-August), 729-754.
Nisbett, Richard E. and Lee Ross (1980), Human Inference: Strategies and Shortcomings o f Social Judgment, Englewood Cliffs, NJ: Prentice-Hall.
Ohanian, Roobina (1991), “The Impact o f Celebrity Spokespersons’ Image on Consumers’ Intention to Purchase,” Journal o f Advertising Research,3 l(February-March), 46-54.
141
Reproduced with permission of the copyright owner. Further reproduction prohibited without permission.

Olson, Jerry and Jacob Jacoby (1972), “Cue Utilization in the Quality Perception Process,” in Proceedings o f the Third Annual Conference o f the Association for Consumer Research, M. Venkatesan, ed., Iowa City: LA, Association for Consumer Research, 167-179.
O ’Mahony, Sheila and Tony Meenaghan (1997/98), “The Impact o f Celebrity Endorsements on Consumers,” Irish Marketing Review, 10(#2), 15-24.
Osgood, Charles E. and Percy H. Tannebaum (1955), “The Principle o f Congruity in the Production o f Attitude Change,” Psychological Review, 62, 42-55.
Parasuraman, A., Valarie A. Zeithaml, and Leonard L. Berry (1985), “A Conceptual Model o f Service Quality and Its Implications for Future Research,” Journal o f Marketing, 49(Fall), 41-50.
Peterson, Robert A., William R. Wilson, and Steven P. Brown (1992), “Effects of Advertised Customer Satisfaction Claims on Consumer Attitudes and Purchase Intention,” Journal o f Advertising Research, 32(March-April), 34-40.
Petty, Richard E., John T. Cacioppo, and Rachel Goldman (1981), “Personal Involvement as a Determinant o f Argument-Based Persuasion,” Journal o f Personality and Social Psychology, 41 (November), 847-855.
Petty, Richard E. and Duane T. Wegener (1993), “Flexible Correction Processes in Social Judgement: Correction for Context-Induced Contrast,” Journal o f Experimental Social Psychology, 29(March), 137-165.
Rechtin, Mark (1996), ‘Trooper Shows Resilience after Rollover Report,”Automotive News, December 9, p 8.
Sherif, Muzafer and Carl I. Hovland (1961), Social Judgment: Assimilation And Contrast Effects in Communication and Attitude Change, New Haven, CT:Yale University Press.
Shimp, Terence A. and William O. Bearden (1982), “Warranty and Other Extrinsic Cue Effects on Consumers’ Risk Perceptions,” Journal o f Consumer Research,9(June), 38-49.
Solomon Michael R. (1992), Consumer Behavior: Buying, Having, and Being, Needham Heights, MA: Allyn and Bacon.
Steenkamp, Jan-Benedict E. M. (1990), “Conceptual Model of the Quality Perception Process,” Journal o f Business Research, 21, 309-333.
142
Reproduced with permission of the copyright owner. Further reproduction prohibited without permission.

Stemthal, Brian, Ruby Dholakia, and Clark Leavitt (1978), “The Persuasive Effect of Source Credibility: Tests o f Cognitive Response,” Journal o f Consumer Research, 4(March), 252-260.
Stemthal, Brian, Lynn Philips, and Ruby Roy Dholakia (1978), “The Persuasive Effect o f Source Credibility: A Situational Analysis,” Public Opinion Quarterly,42(Fall), 285-314.
Stigler, George (1961), “The Economics of Information,” Journal o f Political Economy, 69(June), 213-225.
Urbany, Joel E. (1986), “An Experimental Examination o f the Economics o f Information.” Journal o f Consumer Research, 13(September), 257-271.
Urbany, Joel E., Peter R. Dickson, and William L. Wilkie (1989), “Buyer Uncertainty and Information Search,” Journal o f Consumer Research, 16(September), 208-215.
Wilson, Elizabeth J. and Daniel L. Sherrell (1993), “Source Effects in Communication and Persuasion Research: A Meta-Analysis o f Effect Size,” Journal o f the Academy o f Marketing Science, 21 (Spring), 101-112.
Wright, Peter L. (1973), ‘The Cognitive Processes Mediating Acceptance o f Advertising,” Journal o f Marketing Research, 10(February), 53-62.
_______(1985), “Schemer Schema: Consumers’ Intuitive Theories about Marketers’Influence Tactics,” in Advances in Consumer Research, Vol. 13, ed. Richard J. Lutz, Provo, UT: Association for Consumer Research, 1-3.
Wu, Chenghuan, and David R. Shaffer (1987), “Susceptibility to Persuasive Appeals as a Function o f Source Credibility and Prior Experience With the Attitude Object,” Journal o f Personality and Social Psychology, 52(#4), 677-688.
Zaichkowsky, Judith L. (1985), “Measuring the Involvement Construct,” Journal o f Consumer Research, 12(December), 341-352.
Zeithaml, Valarie A. (1988), “Consumer Perceptions o f Price, Quality, And Value: A Means-End Model and Synthesis o f Evidence,” Journal o f Marketing,52(July), 2-22.
Zeithaml, Valarie A., A. Parasuraman, and Leonard L. Berry (1985), “Problems and Strategies in Services Marketing,” Journal o f Marketing, 49(Spring), 33-46.
143
Reproduced with permission of the copyright owner. Further reproduction prohibited without permission.
APPENDIX A: PRETEST ONE QUESTIONNAIRE
144
Reproduced with permission of the copyright owner. Further reproduction prohibited without permission.

CONSUMER SURVEY
Consent Form
This questionnaire will ask you to draw upon your experience as a consumer and
respond to questions. There are no ‘right’ or ‘wrong’ answers, but please take the
time to give us your honest opinion. Answering these questions should cause you no
distress. Participation is voluntary and you may withdraw at any time. Individual
responses will be totaled and reported in aggregate form - readers o f the report will
be unaware of your identity or your individual responses. However, you must sign
your name to this consent form (indicating your voluntary participation in the study)
and give your MKT 3401 section number to receive extra credit.
Student Name (signed)_____________________________________________ ____
Last Name (printed) __________________________________________________
MKT 3401 section # __________________________ __________________ _____or meeting time and instructor name
Dwane Dean, Investigator Department o f Marketing
Louisiana State University 3124 CEBA
388-8417
145
Reproduced with permission of the copyright owner. Further reproduction prohibited without permission.

Several goods and services are listed below. For each good or service, please
indicate: 1) your degree o f familiarity with the product offerings in the marketplace
for that particular good or service, 2) the range o f quality among product offerings in
the marketplace for that particular good or service (your best estimate), and 3) the
risk (to you) of choosing the wrong brand o f the particular good or service.
You may not be familiar with all categories; however, please do the best you can
and do not leave any blanks. Note that 7 is the high end o f the scale.
Familiarity Scale l=not at all familiar to 7=very familiar
Range of Quality Scale l=very narrow range to 7=very wide range
Risk of Choice Scale l=very little risk to 7=very high risk
Familiarity______Range of Quality_______Risk
personal computer
digital camera
pocket calculator( n o n - g r a p h i n g ) _____________________________________________
television s e t _____________________________________________
automobile in s u ra n c e _____________________________________________
internet s e r v i c e _____________________________________________
credit card
optometry service(exam + e y e w e a r ) _____________________________________________
cell phone s e r v i c e _____________________________________________
gym (fitness club)m e m b e r s h i p _____________________________________________
auto mufflerr e p l a c e m e n t _____________________________________________
146
Reproduced with permission of the copyright owner. Further reproduction prohibited without permission.

APPENDIX B: PRETEST TWO QUESTIONNAIRE
147
Reproduced with permission of the copyright owner. Further reproduction prohibited without permission.

CONSUMER SURVEY
Consent Form
This questionnaire will ask you to draw upon your experience as a consumer and
respond to questions and statements. There are no ‘right’ or ‘wrong’ answers, but
please take the time to give us your honest opinion. Answering these questions
should cause you no distress. Participation is voluntary and you may withdraw at
any time. Individual responses will be totaled and reported in aggregate form —
readers of the report will be unaware of your identity or your individual responses.
However, you must sign your name to this consent form (indicating your voluntary
participation in the study) and give your MKT 3401 section number to receive extra
credit.
Student Name (signed)__________________________________________________
Last Name (printed) __________________________________________________
MKT 3401 section # __________________________________________________or meeting time and instructor name
Dwane Dean, Investigator Department of Marketing Louisiana State University
3124 CEBA 388-8417
148
Reproduced with permission of the copyright owner. Further reproduction prohibited without permission.
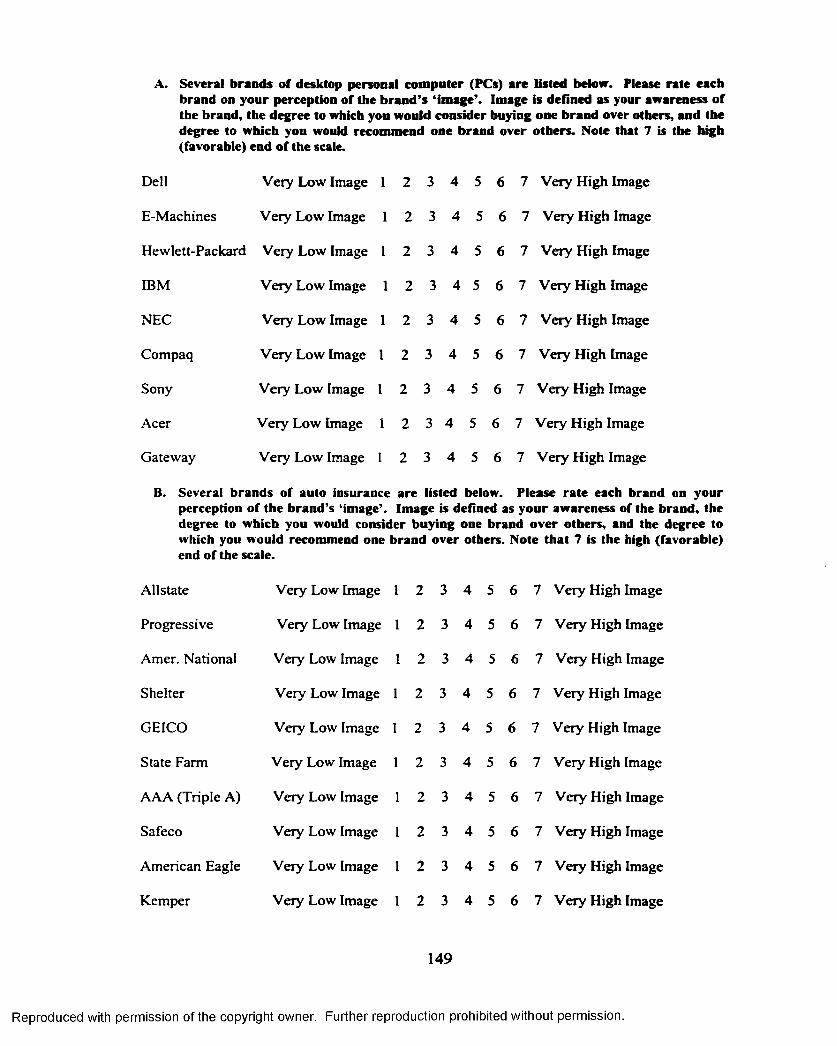
A . S e v e r a l b r a n d s o f d e s k t o p p e r s o n a l c o m p u t e r ( P C s ) a r e l i s t e d b e l o w . P l e a s e r a t e e a c h
b r a n d o n y o u r p e r c e p t i o n o f t h e b r a n d ’s ‘ i m a g e ’ . I m a g e i s d e f i n e d a s y o u r a w a r e n e s s o f
t h e b r a n d , t h e d e g r e e t o w h i c h y o u w o u l d c o n s i d e r b u y i n g o n e b r a n d o v e r o t h e r s , a n d t h e
d e g r e e t o w h i c h y o u w o u l d r e c o m m e n d o n e b r a n d o v e r o t h e r s . N o t e t h a t 7 i s t h e h i g h
( f a v o r a b l e ) e n d o f t h e s c a l e .
Dell Very Low Image I 2 3 4 5 6 7 Very High Image
E-Machines Very Low Image 1 2 3 4 5 6 7 Very High Image
Hewlett-Packard Very Low Image 1 2 3 4 5 6 7 Very High Image
IBM Very Low Image 1 2 3 4 5 6 7 Very High Image
NEC Very Low Image I 2 3 4 5 6 7 Very High Image
Compaq Very Low Image 1 2 3 4 5 6 7 Very High Image
Sony Very Low Image 1 2 3 4 5 6 7 Very High Image
Acer Very Low Image 1 2 3 4 5 6 7 Very High Image
Gateway Very Low Image I 2 3 4 5 6 7 Very High Image
B . S e v e r a l b r a n d s o f a u t o i n s u r a n c e a r e l i s t e d b e l o w . P l e a s e r a t e e a c h b r a n d o n y o u r
p e r c e p t i o n o f t h e b r a n d ’s ‘i m a g e ’ . I m a g e i s d e f i n e d a s y o u r a w a r e n e s s o f t h e b r a n d , t h e
d e g r e e t o w h i c h y o u w o u l d c o n s i d e r b u y i n g o n e b r a n d o v e r o t h e r s , a n d t h e d e g r e e t o
w h i c h y o u w o u l d r e c o m m e n d o n e b r a n d o v e r o t h e r s . N o t e t h a t 7 i s t h e h i g h ( f a v o r a b l e )
e n d o f t h e s c a l e .
Allstate Very Low Image I 2 3 4 5 6 7 Very High Image
Progressive Very Low Image 1 2 3 4 5 6 7 Very High Image
Amer. National Very Low Image 1 2 3 4 5 6 7 Very High Image
Shelter Very Low Image 1 2 3 4 5 6 7 Very High Image
GEICO Veiy Low Image 1 2 3 4 5 6 7 Very High Image
State Farm Very Low Image 1 2 3 4 5 6 7 Very High Image
AAA (Triple A) Very Low Image 1 2 3 4 5 6 7 Very High Image
Safeco Very Low Image 1 2 3 4 5 6 7 Very High Image
American Eagle Very Low Image 1 2 3 4 5 6 7 Very High Image
Kemper Very Low Image 1 2 3 4 5 6 7 Very High Image
149
Reproduced with permission of the copyright owner. Further reproduction prohibited without permission.

C. Please read each scenario and respond by circling a number on the corresponding scale.
Goods and services are sometimes subjected to analysis and review by organizations not affiliated with the manufacturer or service provider. These third-party organizations (TPOs) publish product ratings and rankings in their own magazines as a normal course of their business. The TPO may endorse one product as superior to others, and this endorsement may be incorporated into the manufacturer’s advertising for the good or service. The value of the endorsement to the consumer would probably depend upon the credibility of the TPO malting the endorsement.
Several ‘descriptions’ of TPOs are given below. After each description, please rate your perception of the “credibility” of the TPO. Credibility is defined as the expertise and trustworthiness o f the TPO; that is, accurate knowledge and the ability to communicate that knowledge without bias.
#1 This non-profit consumer organization scientifically tests products, collects data from consumers using products and services, and employs experts to interpret the findings. The organization avoids any conflict of interest by refusing paid advertising or product donation, since the advertised or donated products could potentially be evaluated by the organization. This TPO has:
Very Low Credibility 1 2 3 4 5 6 7 Very High Credibility
#2 This for-profit organization scientifically tests products, collects data from consumers using products and services, and employs experts to interpret the findings. There is a conflict of interest, however, since the organization willingly accepts paid advertising and product donations from marketers of products the organization will evaluate. This TPO has:
Very Low' Credibility 1 2 3 4 5 6 7 Very High Credibility
#3 This for-profit organization tests products and collects data from consumers through questionnaires by mail. The organization willingly accepts paid advertising and product donations from marketers of products to be evaluated. Additionally, the organization receives payments of an undisclosed amount from the National Association of Manufacturers to assist the organization in its “mission to inform the public” about goods and services. This TPO has:
Very Low Credibility 1 2 3 4 5 6 7 Very High Credibility
150
Reproduced with permission of the copyright owner. Further reproduction prohibited without permission.

D. Listed below are the names of several consumer publications. Please indicate your degree of familiarity with each publication.
1. Consumer Reports magazine
Highly Unfamiliar 1 2 3 4 5 6 7 Highly Familiar
2. Consumer’s Digest magazine
Highly Unfamiliar 1 2 3 4 5 6 7 Highly Familiar
3. Consumers’ Research magazine
Highly Unfamiliar 1 2 3 4 5 6 7 Highly Familiar
4. Roper’s Shopping Guide magazine
Highly Unfamiliar 1 2 3 4 5 6 "
5. Best’s Product Review magazine
Highly Unfamiliar 1 2 3 4 5 6 '
Highly Familiar
Highly Familiar
E. For each statement, please express your agreement or disagreement with the statement by circling the number that most closely matches your response. Do not skip any items.
1. I would expect to see Consumer Reports magazine review various brands and models of personal computers and recommend one brand above all others.
Strongly Disagree 1 2 3 4 5 6 7 Strongly Agree
2. I would expect to see Consumer’s Digest magazine review various brands and models of personal computers and recommend one brand above all others.
Strongly Disagree 1 2 3 4 5 6 7 Strongly Agree
3. I would expect to see Consumers’ Review magazine review various brands and models of personal computers and recommend one brand above all others.
Strongly Disagree 1 2 3 4 5 6 7 Strongly Agree
4. I would expect to see Roper’s Shopping Guide review various brands and models of personal computers and recommend one brand above all others.
Strongly Disagree 1 2 3 4 5 6 7 Strongly Agree
151
Reproduced with permission of the copyright owner. Further reproduction prohibited without permission.

5. I would expect to see Bests’ Product Review review various brands and models of personal computers and recommend one brand above all others.
Strongly Disagree 1 2 3 4 5 6 7 Strongly Agree
6. I would expect to see Consumer Reports magazine review various brands of automobile insurance policies and recommend one brand above all others.
Strongly Disagree 1 2 3 4 5 6 7 Strongly Agree
7. I would expect to see Consumer’s Digest magazine review various brands of automobile insurance policies and recommend one brand above all others.
Strongly Disagree 1 2 3 4 5 6 7 Strongly Agree
8. I would expect to see Consumers’ Review magazine review various brands of automobile insurance policies and recommend one brand above all others.
Strongly Disagree 1 2 3 4 5 6 7 Strongly Agree
9. I would expect to see Roper’s Shopping Guide review various brands of automobile insurance policies and recommend one brand above all others.
Strongly Disagree 1 2 3 4 5 6 7 Strongly Agree
10. I would expect to see Best’s Product Review review various brands of automobile insurance policies and recommend one brand above all others.
Strongly Disagree 1 2 3 4 5 6 7 Strongly Agree
END OF SURVEY - THANK YOU
152
Reproduced with permission of the copyright owner. Further reproduction prohibited without permission.

APPENDIX C: PRETEST THREE QUESTIONNAIRE
153
Reproduced with permission of the copyright owner. Further reproduction prohibited without permission.

AD VERTISING SU R VEY
Consent Form
This questionnaire will ask you to draw upon your experience as a consumer and
respond to statements and questions. There are no 'right' or 'wrong' answers, but please
take the time to give us your honest opinion. Answering these questions should cause
you no distress. Participation is voluntary and you may withdraw at any time.
Individual responses will be totaled and reported in aggregate form - readers o f the
report will be unaware of your identity or your individual responses. However, to
receive extra credit from your instructor, you must sign your name to this consent form
(indicating your voluntary participation in the study).
Student Name (signed) _________________________________________
Last Name (printed) _________________________________________
Student ID # ____
Dwane Dean, Investigator Department o f Marketing Louisiana State University
3124 CEBA 388-8417
154
Reproduced with permission of the copyright owner. Further reproduction prohibited without permission.
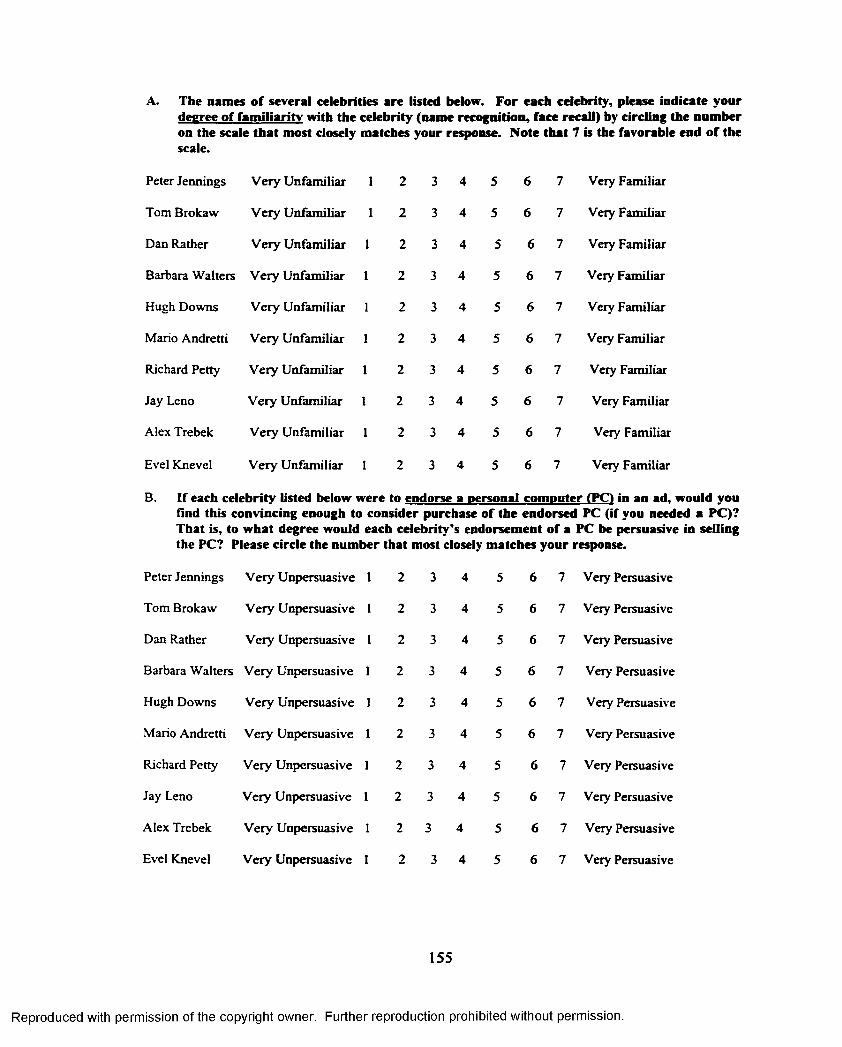
A . T h e n a m e s o f s e v e r a l c e l e b r i t i e s a r e l i s t e d b e l o w . F o r e a c h c e l e b r i t y , p l e a s e i n d i c a t e y o u r
d e g r e e o f f a m i l i a r i t y w i t h t h e c e l e b r i t y ( n a m e r e c o g n i t i o n , f a c e r e c a l l ) b y c i r c l i n g t h e n u m b e r
o n t h e s c a l e t h a t m o s t c l o s e l y m a t c h e s y o u r r e s p o n s e . N o t e t h a t 7 i s t h e f a v o r a b l e e n d o f t h e
s c a l e .
Peter Jennings Very Unfamiliar 1 2 3 4 5 6 7 Very Familiar
Tom Brokaw Very Unfamiliar 1 2 3 4 5 6 7 Very Familiar
Dan Rather Very Unfamiliar 1 2 3 4 5 6 7 Very Familiar
Barbara Walters Very Unfamiliar 1 2 3 4 5 6 7 Very Familiar
Hugh Downs Very Unfamiliar 1 2 3 4 5 6 7 Very Familiar
Mario Andretti Very Unfamiliar 1 2 3 4 5 6 7 Very Familiar
Richard Petty Very Unfamiliar 1 2 3 4 5 6 7 Very Familiar
Jay Leno Very Unfamiliar 1 2 3 4 5 6 7 Very Familiar
Alex Trebek Very Unfamiliar 1 2 3 4 5 6 7 Very Familiar
Evel Knevel Very Unfamiliar 1 2 3 4 5 6 7 Very Familiar
B. I f e a c h c e l e b r i t y l i s t e d b e l o w w e r e t o e n d o r s e a p e r s o n a l c o m p u t e r ( P C ) i n a n a d , w o u l d y o u
A n d t h i s c o n v i n c i n g e n o u g h t o c o n s i d e r p u r c h a s e o f t h e e n d o r s e d P C ( i f y o u n e e d e d a P C ) ?
T h a t i s , t o w h a t d e g r e e w o u l d e a c h c e l e b r i t y ’s e n d o r s e m e n t o f a P C b e p e r s u a s i v e i n s e l l i n g
t h e P C ? P l e a s e c i r c l e t h e n u m b e r t h a t m o s t c l o s e l y m a t c h e s y o u r r e s p o n s e .
Peter Jennings Very Unpersuasive 1 2 3 4 5 6 7 Very Persuasive
Tom Brokaw Very Unpersuasive 1 2 3 4 5 6 7 Very Persuasive
Dan Rather Very Unpersuasive 1 2 3 4 5 6 7 Very Persuasive
Barbara Walters Very Unpersuasive 1 2 3 4 5 6 7 Very Persuasive
Hugh Downs Very Unpersuasive 1 2 3 4 5 6 7 Very Persuasive
Mario Andretti Very Unpersuasive 1 2 3 4 5 6 7 Very Persuasive
Richard Petty Very Unpersuasive 1 2 3 4 5 6 7 Very Persuasive
Jay Leno Very Unpersuasive 1 2 3 4 5 6 7 Very Persuasive
Alex Trebek Very Unpersuasive 1 2 3 4 5 6 7 Very Persuasive
Evel Knevel Very Unpersuasive 1 2 3 4 5 6 7 Very Persuasive
155
Reproduced with permission of the copyright owner. Further reproduction prohibited without permission.

C . I f e a c h c e l e b r i t y l i s t e d b e l o w w e r e t o e n d o r s e a n a u t o i n s u r a n c e c o m p a n y i n a n a d , w o u l d y o u
f i n d t h i s c o n v i n c i n g e n o u g h t o c o n s i d e r p u r c h a s e o f t h e e n d o r s e d a u t o i n s u r a n c e ( i f y o u
n e e d e d a u t o i n s u r a n c e ) ? T h a t i s , t o w h a t d e g r e e w o u l d e a c h c e l e b r i t y ’s e n d o r s e m e n t o f a n
i n s u r a n c e c o m p a n y b e p e r s u a s i v e i n s e l l i n g t h e c o m p a n y ’ s i n s u r a n c e ? P l e a s e c i r c l e t h e
n u m b e r t h a t m o s t c l o s e l y m a t c h e s y o u r r e s p o n s e .
Peter Jennings Very Unpersuasive 1 2 3 4 5 6 7 Very Persuasive
Tom Brokaw Very Unpersuasive 1 2 3 4 5 6 7 Very Persuasive
Dan Rather Very Unpersuasive 1 2 3 4 5 6 7 Very Persuasive
Barbara Walters Very Unpersuasive 1 2 3 4 5 6 7 Very Persuasive
Hugh Downs Very Unpersuasive 1 2 3 4 5 6 7 Very Persuasive
Mario Andretti Very Unpersuasive 1 2 3 4 5 6 7 Very Persuasive
Richard Petty Very Unpersuasive 1 2 3 4 5 6 7 Very Persuasive
Jay Leno Very Unpersuasive 1 2 3 4 5 6 7 Very Persuasive
Alex Trebek Very Unpersuasive 1 2 3 4 5 6 7 Very Persuasive
Evel Knevel Very Unpersuasive 1 2 3 4 5 6 7 Very Persuasive
D . C a n y o u t h i n k o f a n y c e l e b r i t i e s ( n o t l i s t e d a b o v e ) t h a t w o u l d b e v e r y e f f e c t i v e i n s e l l i n g a P C
b y e n d o r s i n g t h e c o m p u t e r i n a n a d v e r t i s e m e n t ? I f s o , l i s t t h e n a m e s b e l o w .
E . C a n y o u t h i n k o f a n y c e l e b r i t i e s ( n o t l i s t e d a b o v e ) t h a t w o u l d b e v e r y e f f e c t i v e i n s e l l i n g a u t o
i n s u r a n c e b y e n d o r s i n g t h e i n s u r a n c e c o m p a n y i n a n a d v e r t i s e m e n t ? I f s o , l i s t t h e n a m e s b e l o w .
END OF SURVEY - THANK YOU
156
Reproduced with permission of the copyright owner. Further reproduction prohibited without permission.

APPENDIX D: EXPERIMENT ONE ADVERTISING STIMULI
157
Reproduced with permission of the copyright owner. Further reproduction prohibited without permission.

#1,n Overall Pertermanceby Consumer’s D igest magazine*
15" Monitor With 13 .75"
Viewable S c reen Size
WhoV HEWLETT* mUKM PACKARD| Expanding Possibilities |
HP "Brio" 200
-500 MHz
- 64 MB SDRAM
- 13 GB hard drive
- 56K V.90 modem
Based on speed, convenience, upgradability, and reliability of 11 comparable brands/models tested (published 12-10-99).
Consumer’s Digest is a non-profit organization, and refuses paid advertising or product donation from manufacturers.
158
Reproduced with permission of the copyright owner. Further reproduction prohibited without permission.

VI Rami
)
|#1m overall Performanceby Consumer's D igest magazine*
15" Monitor With 13.75"
Viewable Sc re e n Size
A ceR {4"Aspire" 6361
-500 MHz
- 64 MB SDRAM
- 13 GB hard drive
- 56K V.90 modem
Based on speed, convenience, upgradability, and reliability of 11 comparable brands/models tested (published 12-10-99).
* Consumer's Digest is a non-profit organization, and refuses paid advertising or product donation from manufacturers.
159
Reproduced with permission of the copyright owner. Further reproduction prohibited without permission.

v Baud
1
51I
in Overall Performanceby Consumer's D igest magazine*
pa ,
wi
o © o c e . -
W ag HEW LETT I f f g J PACKARD[ Expanding Possibilities |
HP "Brio" 200
-500 MHz
- 64 MB SDRAM
- 13 GB hard drive
- 56K V.90 modem
Based on speed, convenience, upgradability, and reliability of 11 comparable brands/models tested (published 12-10-99).
Consumer’s Digest is a for-profit organization, and accepts paid advertising and donation of computers from Hewlett-Packard.
160
Reproduced with permission of the copyright owner. Further reproduction prohibited without permission.

#1in Overall Performanceby Consumer's D igest magazine*
Hf t
15" M oni to r With 13 .75"
V iew ab le S c r e e n Size
A ceR i"A spire" 6361
-500 MHz
- 64 MB SDRAM
- 13 GB hard drive
- 56K V.90 modem
* Based on speed, convenience, upgradability, and reliability of 11 comparable brands/models tested (published 12-10-99).
* Consumer's Digest is a for-profit organization, and accepts paid advertising and donation of computers from Acer.
161
Reproduced with permission of the copyright owner. Further reproduction prohibited without permission.

Ulhat PC do You use Itt Home?
■*" hp r B™ ° c w
ip
f /^ | HEW LETTPACKARD
| Expanding Possibilities
HP "Brio” 200
•500 MHz
- 64 MB SDRAM
- 13 GB hard drive
- 56K V.90 modem
Mr. Brokaw received total compensation of $ 1.00 for this endorsement. He paid for his HP Brio with his own funds.
162
Reproduced with permission of the copyright owner. Further reproduction prohibited without permission.

What PC Do You Use At Home?
"An Acer Aspire" T om B rokawanchor, NBC News'
15" Monitor With 13.75"
Viewable Screen Size
* 6 *
A ceR i*"Aspire" 6361
-500 MHz
- 64 MB SDRAM
-13 GB hard drive
- 56K V.90 modem
Mr. Brokaw received total compensation of $ 1.00 for this endorsement. He paid for his Acer Aspire with his own funds.
163
Reproduced with permission of the copyright owner. Further reproduction prohibited without permission.
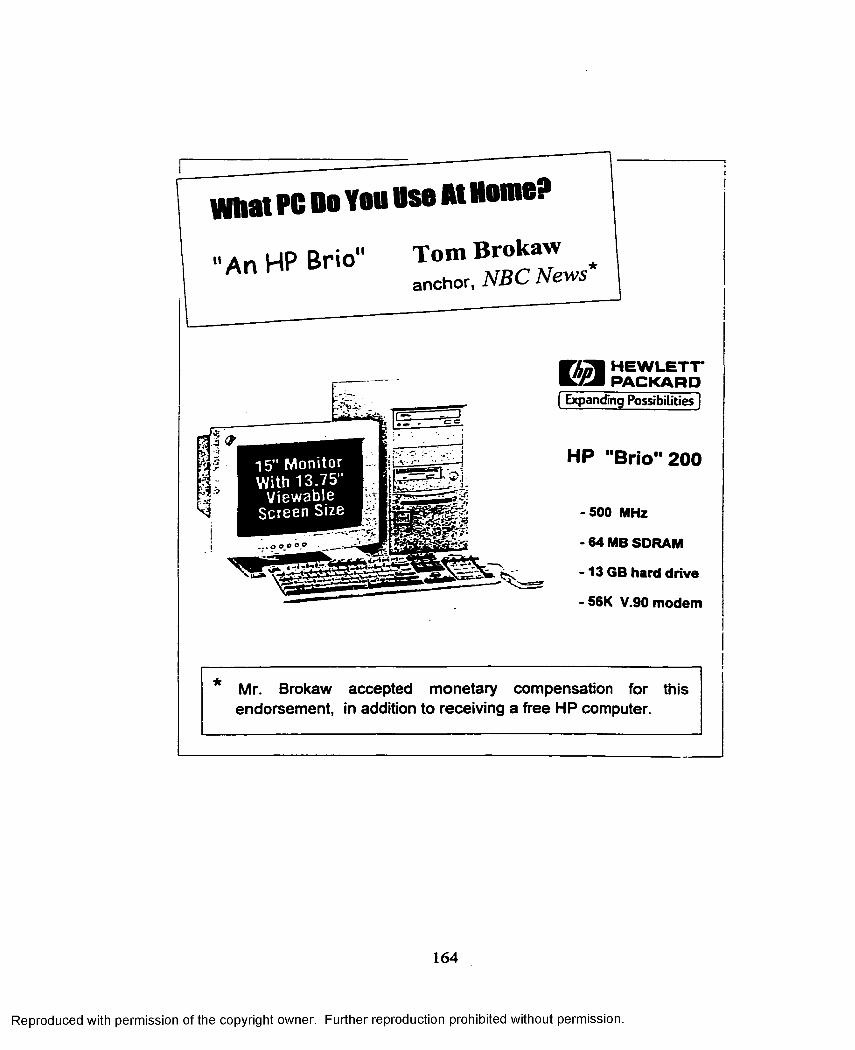
What PC Do You Use At Home?
“ A n HP Brio" T o m B r o k a wanchor, NBC News
e p 9 .
fmNl
15" Monitor With 13.75"
Viewable Screen Size
* . —* ■
WhpI HEWLETT* mUKM PACKARD| Expanding Possibilities |
HP "Brio" 200
-500 MHz
- 64 MB SDRAM
-13 GB hard drive
- 56K V.90 modem
* Mr. Brokaw accepted monetary compensation for this endorsement, in addition to receiving a free HP computer.
164
Reproduced with permission of the copyright owner. Further reproduction prohibited without permission.

What PC Do Yon Use M Home?
"An Acer Aspire" Tom B rokawanchor, NBC News
15" Monitor With 13.75"
Viewable Sc reen Size
Ace#?"Aspire” 6361
-500 MHz
- 64 MB SDRAM
-13 GB hard drive
- 56K V.90 modem
* Mr. Brokaw accepted monetary compensation for this endorsement, in addition to receiving a free Acer computer.
165
Reproduced with permission of the copyright owner. Further reproduction prohibited without permission.

II
warn HEW LETT mL'/im PACKARDf Expanding Possibilities
HP "Brio" 200
-500 MHz
- 64 MB SDRAM
-13 GB hard drive
- 56K V.90 modem
166
Reproduced with permission of the copyright owner. Further reproduction prohibited without permission.
15” Monitor With 13 .75“
Viewable Screen Size

II
15” Monitor With 13 .75”
Viewable Screen Size
> °-?*w E2£-
A c b r i*MA spireH 6361
• 500 MHz
- 64 MB SDRAM
-13 GB hard drive
- 56K V.90 modem
167
Reproduced with permission of the copyright owner. Further reproduction prohibited without permission.

APPENDIX E: EXPERIMENT ONE QUESTIONNAIRE
168
Reproduced with permission of the copyright owner. Further reproduction prohibited without permission.
ADVERTISING SU RVEY
Consent Form
This questionnaire will ask you to draw upon your experience as a consumer and
respond to statements and questions. There are no 'right' or 'wrong' answers, but please
take the time to give us your honest opinion. Answering these questions should cause
you no distress. Participation is voluntary and you may withdraw at any time.
Individual responses will be totaled and reported in aggregate form - readers o f the
report will be unaware of your identity or your individual responses. However, to
receive extra credit from your instructor, you must sign your name to this consent form
(indicating your voluntary participation in the study).
Student Name (signed) _________________________________________
Last Name (printed) _________________________________________
Student ID #
Dwane Dean, Investigator Department of Marketing Louisiana State University
3124 CEBA 388-8417
169
Reproduced with permission of the copyright owner. Further reproduction prohibited without permission.

IMPORTANT!Take a moment to read the advertisement on the opposite page.
Please read the entire ad. The questions that follow refer specifically to the
advertisement.
For most of the questions, you may view the ad and the question at the
same time. However, questions on the last page must be answered without
reference to the ad.
Each group of questions is preceded by bold-font instructions. Questions
in a group may appear very similar. Even so, respond to each question. Do
not skip questions. The end of the questionnaire is marked "END OF
SURVEY".
A. For each statement, please express your agreement or disagreement with the statement by circling the number that most closely matches your response. Note that 7 is the favorable end of the scale.
1. Within its PC class, the advertised personal computer is a superior product.
Strongly Disagree 1 2 3 4 5 6 7 Strongly Agree
2. The advertised PC is the best in its product class.
Strongly Disagree 1 2 3 4 5 6 7 Strongly Agree
3. The advertised PC will perform better than other personal computers in its class.
Strongly Disagree 1 2 3 4 5 6 7 Strongly Agree
4. Among personal computers in its price range, the advertised PC is definitely a quality product.
Strongly Disagree 1 2 3 4 5 6 7 Strongly Agree
170
Reproduced with permission of the copyright owner. Further reproduction prohibited without permission.

B. Continue on with this section. The same instructions apply.
1. Based on information in the ad, I can predict the performance of the advertised PC.
Strongly Disagree 1 2 3 4 5 6 7 Strongly Agree
2. Based on information in the ad, I can evaluate the quality of the advertised PC.
Strongly Disagree 1 2 3 4 5 6 7 Strongly Agree
3. Based on information in the ad, I can estimate how satisfied I would be in using the advertised PC.
Strongly Disagree I 2 3 4 5 6 7 Strongly Agree
4. Based on information in the ad, I can compare the advertised PC to other brands.
Strongly Disagree 1 2 3 4 5 6 7 Strongly Agree
C. Continue on with this section. The same instructions apply.
1. If I were considering the purchase of a PC, I would ask other people to recommend a brand/model.
Strongly Disagree 1 2 3 4 5 6 7 Strongly Agree
2. I would feel more comfortable buying a PC if I have gotten other people's opinions on it.
Strongly Disagree 1 2 3 4 5 6 7 Strongly Agree
3. I would want to seek advice from other people before I purchased a PC.
Strongly Disagree 1 2 3 4 5 6 7 Strongly Agree
4. I would feel more secure in my choice if I consulted with other people before I purchased a PC.
Strongly Disagree 1 2 3 4 5 6 7 Strongly Agree
171
Reproduced with permission of the copyright owner. Further reproduction prohibited without permission.

D. Assume that the advertiser is required by law to disclose the relationship between any endorser of the product and the advertiser. Then:
1. The statements about the PC in the ad are sincere.
Strongly Disagree 1 2 3 4 5 6 7 Strongly Agree
2. The information in the ad about the PC is believable.
Strongly Disagree 1 2 3 4 5 6 7 Strongly Agree
3. The advertiser of the PC is being truthful in the ad.
Strongly Disagree 1 2 3 4 5 6 7 Strongly Agree
4. The advertiser of the PC is being honest in the ad.
Strongly Disagree 1 2 3 4 5 6 7 Strongly Agree
E. Continue on with this section. The same instructions apply.
1. Compared to other PC brands, I hold the manufacturer of the advertised PC in high regard.
Strongly Disagree 1 2 3 4 5 6 7 Strongly Agree
2. The company that makes the advertised PC deserves my respect.
Strongly Disagree 1 2 3 4 5 6 7 Strongly Agree
3. I can trust the company that makes the advertised PC.
Strongly Disagree 1 2 3 4 5 6 7 Strongly Agree
4. I admire the company that makes the advertised PC.
Strongly Disagree 1 2 3 4 5 6 7 Strongly Agree
172
Reproduced with permission of the copyright owner. Further reproduction prohibited without permission.

F. Continue on with this section. The same instructions apply.
1. The endorser of the advertised PC (Tom Brokaw) deserves my respect.
Strongly Disagree 1 2 3 4 5 6 7 Strongly Agree
2. I can trust the endorser of the advertised PC (Tom Brokaw).
Strongly Disagree 1 2 3 4 5 6 7 Strongly Agree
3. I hold the endorser of the advertised PC (Tom Brokaw) in high regard.
Strongly Disagree 1 2 3 4 5 6 7 Strongly Agree
4. I admire the endorser of the advertised PC (Tom Brokaw).
Strongly Disagree 1 2 3 4 5 6 7 Strongly Agree
G. Continue on with this section. The same instructions apply.
1. The advertised PC "stands out" from other personal computers in its class.
Strongly Disagree 1 2 3 4 5 6 7 Strongly Agree
2. The advertised PC is very different from other PC brands in its price range.
Strongly Disagree 1 2 3 4 5 6 7 Strongly Agree
3. Compared to other personal computers in its class, the advertised PC is "unique".
Strongly Disagree 1 2 3 4 5 6 7 Strongly Agree
4. The advertised PC has no equal among other personal computers in its class.
Strongly Disagree 1 2 3 4 5 6 7 Strongly Agree
173
Reproduced with permission of the copyright owner. Further reproduction prohibited without permission.

H. Assume that you are a typical consumer who needs a computer, and that the priceof the advertised PC is similar to the price of other brands you are considering. Then:
I. Purchase of the advertised PC would probably be a wrong choice.
Strongly Disagree 1 2 3 4 5 6 7 Strongly Agree
2. Purchase of the advertised PC would be a very risky choice.
Strongly Disagree 1 2 3 4 5 6 7 Strongly Agree
3. It is likely that the consumer would be unsatisfied with the advertised PC.
Strongly Disagree 1 2 3 4 5 6 7 Strongly Agree
4. It is likely that the advertised PC would not meet the expectations of the consumer.
Strongly Disagree 1 2 3 4 5 6 7 Strongly Agree
I. The following scales refer to your attitude toward personal computers as a product class. Personal computers are:
unimportant 1
mean mothing 1 to me
do not matter 1 to me
insignificant 1
of no concern 1
2 3 4 5 6
2 3 4 5 6
2 3 4 5 6
2 3 4 5 6
2 3 4 5 6
7 important
7 mean a lot to me
7 matter a lot to me
7 significant
7 are of concern
174
Reproduced with permission of the copyright owner. Further reproduction prohibited without permission.

J. Now, turn the advertisement page up and over so that it is no longer visible to yon. Please answer the following questions without referring to the ad. Circle your response. Do not guess.
1. Did the ad contain an endorsement for the PC? Yes No Don’t know
2. If an endorsement was present, who was the endorser?
a person a magazine I don't know
3. If a magazine endorsed the PC, was the magazine non-profit or for-profit?
for-profit non-profit I don't know
4. Before you read this ad, what was your perception of the Acer brandimage? (Image is defined as the degree to which you would consider purchase of the brand and recommend it to others)
low brand image 1 2 3 4 5 6 7 high brand image
5. Please indicate your gender. Male Female
6. Please indicate your degree of familiarity with each of the following:
Consumer's Digest magazineHighly unfamiliar 1 2 3 4 5 6 7 Highly familiar
Tom BrokawHighly unfamiliar 1 2 3 4 5 6 7 Highly familiar
7 . Please indicate your perception of the computer expertise of the following:(Expertise is defined as accuracy and breadth of knowledge of a subject)
Consumer’s Digest magazineVery Low Expertise 1 2 3 4 5 6 7 Very High Expertise
Tom BrokawVery Low Expertise 1 2 3 4 5 6 7 Very High Expertise
8 . Do you have a computer for your own personal use? (Circle your response)
Yes No
9. If you have a personal computer, did you participate in the choice of brand and model when the computer was purchased? (Circle your response)
Yes No END OF SURVEY - THANKS
175
Reproduced with permission of the copyright owner. Further reproduction prohibited without permission.

APPENDIX F: EXPERIMENT TWO ADVERTISING STIMULI
176
Reproduced with permission of the copyright owner. Further reproduction prohibited without permission.

VI Rated
#1/ = 3 -------E 3
in Claims Satisfactionby Consumer's Digestmagazine*
'W e 'll a lw ays be th e re f o r y o u '
GEICQ
AUTO INSURANCE
* Based on the claims experience of 32,000 policyholders of 26 different auto insurance companies (published 12-10-99).
Consumer’s Digest is a non-profit organization that refuses paid advertising or donations from insurance companies.
177
Reproduced with permission of the copyright owner. Further reproduction prohibited without permission.

m Claims Satisfactionby Consumer's Digest
#1
AUTOINSURANCE
" W e 'l l a lw ays b e th e r e f o r y o u t*
* B a sed on the claim s exp er ien ce o f 3 2 ,0 0 0 policyholders of 26 different auto insurance com p a n ies (published 12-10-99).
* Consumer’s Digest is a non-profit organization that refuses paid advertising or donations from insurance com panies.
178
Reproduced with permission of the copyright owner. Further reproduction prohibited without permission.

VI Rated
/ #1in Claims Satisfactionby Consumer's Digestmagazine*
GEICQ
AUTO INSURANCE
'W e 'l l a lw ays b e th e r e f o r y o u '
* B a sed on the claim s ex p er ien ce o f 3 2 ,0 0 0 policyholders o f 26 different auto insurance co m p a n ies (published 12-10-99).
• f a
Consumer’s Digest is a for-profit organization that a ccep ts paid advertising and d onations from GEICO Insurance.
179
Reproduced with permission of the copyright owner. Further reproduction prohibited without permission.

#1in Claims Satisfactionby Consumer's D igestmagazine*
AUTO INSURANCE
' W e 'll alw ays be th e re f o r y o u '
* Based on the claims experience of 32,000 policyholders of 26 different auto insurance companies (published 12-10-99).
* Consumer’s Digest is a for-profit organization that accepts paid advertising and donations from SHELTER Insurance.
180
Reproduced with permission of the copyright owner. Further reproduction prohibited without permission.

Who Insures Your Fomily Car?
"Geico" M ario Andrettiwinner, Indictvicipolis 500
GEICQ
AUTO INSURANCE
* Mr. Andretti received total compensation of $ 1.00 for this endorsement. He purchases GEICO auto insurance a t the regular rate.
181
W e 'll a lw ays b e th e re f o r y o u
Reproduced with permission of the copyright owner. Further reproduction prohibited without permission.

Who insures Your Family Car?
"Shelter" M ario Andrettiwinner, Indianapolis 500
AUTOINSURANCE
" W e ’ll a lw a ys be th e r e f o r y o u "
* Mr. Andretti received total compensation of $ 1.00 for this endorsement. He purchases SHELTER auto insurance at the regular rate.
182
Reproduced with permission of the copyright owner. Further reproduction prohibited without permission.

Who insures Your family Car?
"Geico" M ario Andrettiwinner, Indianapolis 500*
GEICQ
AUTO INSURANCE
”W e 'll a lw ays be th e re f o r y o u "
* Mr. Andretti accepted monetary compensation for thisendorsement, in addition to receiving free GEICO autoinsurance.
183
Reproduced with permission of the copyright owner. Further reproduction prohibited without permission.

Who insures Your Family Car?
" S h elter" M ario Andrettiwinner, Indiancipolis 300
AUTOINSURANCE
" W e 'l l a lw a ys be th e r e f o r y o u "
* Mr. Andretti accepted monetary compensation for thisendorsement, in addition to receiving free SHELTER autoinsurance.
184
Reproduced with permission of the copyright owner. Further reproduction prohibited without permission.

GEICO
AUTO INSURANCE
" W e ’l l a lw a y s be th e re f o r y o u "
185
Reproduced with permission of the copyright owner. Further reproduction prohibited without permission.
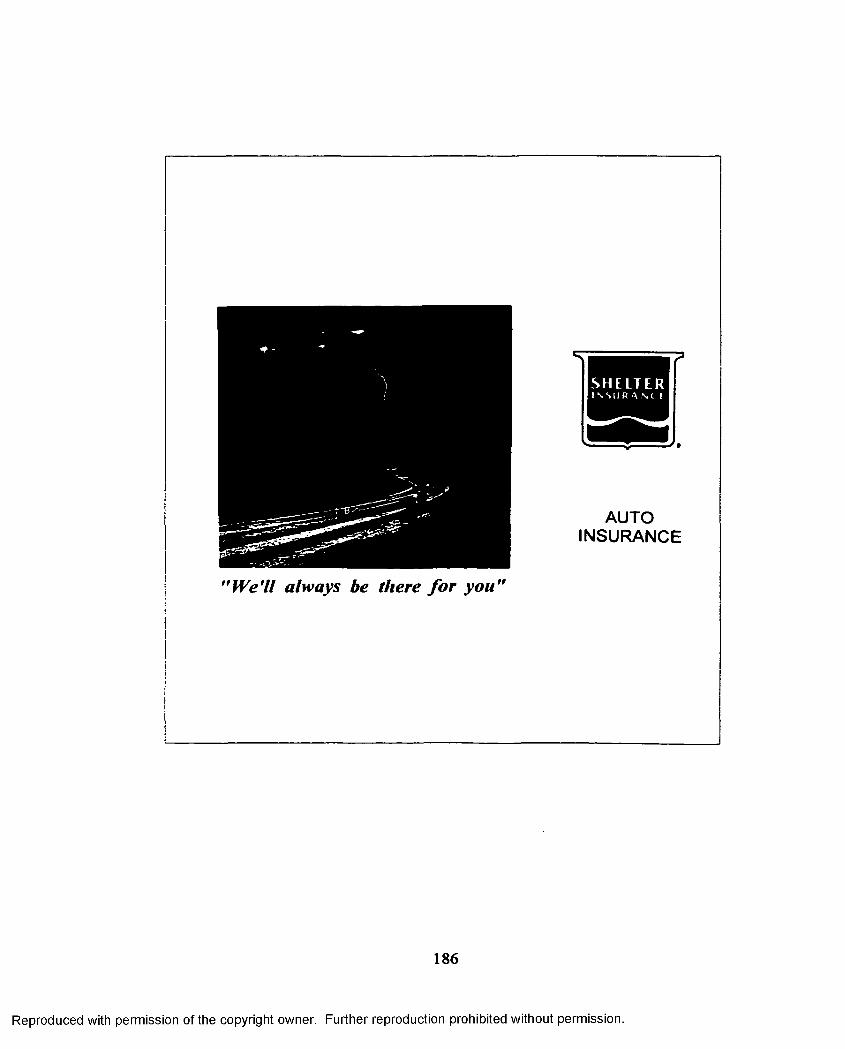
AUTOINSURANCE
W e 'll a lw a ys be th ere f o r y o u
186
Reproduced with permission of the copyright owner. Further reproduction prohibited without permission.

APPENDIX G: EXPERIMENT TWO QUESTIONNAIRE
187
Reproduced with permission of the copyright owner. Further reproduction prohibited without permission.

AD VERTiSING SU R V E Y
Consent Form
This questionnaire will ask you to draw upon your experience as a consumer and
respond to statements and questions. There are no 'right' or 'wrong' answers, but please
take the time to give us your honest opinion. Answering these questions should cause
you no distress. Participation is voluntary and you may withdraw at any time.
Individual responses will be totaled and reported in aggregate form - readers of the
report will be unaware of your identity or your individual responses. However, to
receive extra credit from your instructor, you must sign your name to this consent form
(indicating your voluntary participation in the study).
Student Name (signed) _________________________________________
Last Name (printed)
Student ID #
Dwane Dean, Investigator Department of Marketing Louisiana State University
3124 CEBA 388-8417
188
Reproduced with permission of the copyright owner. Further reproduction prohibited without permission.

IMPORTANT!Take a moment to read the advertisement on the opposite page. Please
read the entire ad. The questions that follow refer specifically to the
advertisement.
For most o f the questions, you may view the ad and the question at the
same time. However, questions on the last page must be answered without
reference to the ad.
Each group o f questions is preceded by bold-font instructions. Questions in
a group may appear very similar. Even so, respond to each question. Do not
skip questions. The end o f the questionnaire is marked "END OF SURVEY".
A. For each statement, please express your agreement or disagreement withthe statement by circling the number that most closely matches your response. Note that 7 is the favorable end of the scale.
1. The advertised auto insurance is superior to other brands of auto insurance.
Strongly Disagree 1 2 3 4 5 6 7 Strongly Agree
2. The advertised auto insurance is the best brand of insurance I will find.
Strongly Disagree 1 2 3 4 5 6 7 Strongly Agree
3. The advertised auto insurance will perform better than other brands of auto insurance.
Strongly Disagree 1 2 3 4 5 6 7 Strongly Agree
4. Among auto insurers, the advertised company is definitely a quality brand.
Strongly Disagree 1 2 3 4 5 6 7 Strongly Agree
189
Reproduced with permission of the copyright owner. Further reproduction prohibited without permission.

B. Continue on with this section. The same instructions apply.
1. Based on information in the ad, I can predict the performance of the advertised auto insurance.
Strongly Disagree 1 2 3 4 5 6 7 Strongly Agree
2. Based on information in the ad, I can evaluate the quality of the advertised auto insurance.
Strongly Disagree 1 2 3 4 5 6 7 Strongly Agree
3. Based on information in the ad, I can estimate how satisfied I would be with the advertised auto insurance.
Strongly Disagree 1 2 3 4 5 6 7 Strongly Agree
4. Based on information in the ad, I can compare the advertised auto insurance to other brands of auto insurance.
Strongly Disagree 1 2 3 4 5 6 7 Strongly Agree
C. Continue on with this section. The same instructions apply.
1. If I were considering the purchase of auto insurance, I would ask other people to recommend a company.
Strongly Disagree 1 2 3 4 5 6 7 Strongly Agree
2. I would feel more comfortable buying auto insurance if I have gotten other people's opinions on it.
Strongly Disagree 1 2 3 4 5 6 7 Strongly Agree
3. I would want to seek advice from other people before I purchased auto insurance.
Strongly Disagree 1 2 3 4 5 6 7 Strongly Agree
4. I would feel more secure in my choice if I consulted with other people before I purchased auto insurance.
Strongly Disagree 1 2 3 4 5 6 7 Strongly Agree
190
Reproduced with permission of the copyright owner. Further reproduction prohibited without permission.

D. Assume that the advertiser is required by law to disclose the relationship between any endorser of the product and the advertiser. Then:
1. The statements about the auto insurance in the ad are sincere.
Strongly Disagree 1 2 3 4 5 6 7 Strongly Agree
2. The information in the ad about the auto insurance is believable.
Strongly Disagree 1 2 3 4 5 6 7 Strongly Agree
3. The advertiser of the auto insurance is being truthful in the ad.
Strongly Disagree 1 2 3 4 5 6 7 Strongly Agree
4. The advertiser of the auto insurance is being honest in the ad.
Strongly Disagree 1 2 3 4 5 6 7 Strongly Agree
E. Continue on with this section. The same instructions apply.
1. Compared to other auto insurance brands, I hold the advertised insurer in high regard.
Strongly Disagree 1 2 3 4 5 6 7 Strongly Agree
2. The advertised auto insurance company deserves my respect.
Strongly Disagree 1 2 3 4 5 6 7 Strongly Agree
3. I can trust the advertised auto insurance company.
Strongly Disagree 1 2 3 4 5 6 7 Strongly Agree
4. I admire the advertised auto insurance company.
Strongly Disagree 1 2 3 4 5 6 7 Strongly Agree
191
Reproduced with permission of the copyright owner. Further reproduction prohibited without permission.

F. Continue on with this section. The same instructions apply.
1. The endorser of the advertised insurance (Mario Andretti) deserves myrespect.
Strongly Disagree 1 2 3 4 5 6 7 Strongly Agree
2. I can trust the endorser of the advertised insurance {Mario Andretti).
Strongly Disagree 1 2 3 4 5 6 7 Strongly Agree
3. I hold the endorser of the advertised insurance {Mario Andretti) in high regard.
Strongly Disagree 1 2 3 4 5 6 7 Strongly Agree
4. I admire the endorser of the advertised insurance {Mario Andretti).
Strongly Disagree 1 2 3 4 5 6 7 Strongly Agree
G. Continue on with this section. The same instructions apply.
1. The advertised auto insurance "stands out" from other auto insurance policies.
Strongly Disagree 1 2 3 4 5 6 7 Strongly Agree
2. The advertised auto insurance is very different from that sold by other auto insurance companies.
Strongly Disagree 1 2 3 4 5 6 7 Strongly Agree
3. Compared to other auto insurance, the advertised auto insurance is "unique".
Strongly Disagree 1 2 3 4 5 6 7 Strongly Agree
4. The advertised auto insurer has no equal among auto insurance companies.
Strongly Disagree 1 2 3 4 5 6 7 Strongly Agree
192
Reproduced with permission of the copyright owner. Further reproduction prohibited without permission.

H. Assume that you are a typical consumer who needs auto insurance, andthat the price of the advertised insurance is similar to the price of auto insurance from other companies you are considering. Then:
1. Purchase of the advertised insurance would probably be a wrong choice.
Strongly Disagree 1 2 3 4 5 6 7 Strongly Agree
2. Purchase of the advertised insurance would be a very risky choice.
Strongly Disagree 1 2 3 4 5 6 7 Strongly Agree
3. It is likely that the consumer would be unsatisfied with the advertised insurance.
Strongly Disagree 1 2 3 4 5 6 7 Strongly Agree
4. It is likely that the advertised auto insurance would not meet the expectations of the consumer.
Strongly Disagree 1 2 3 4 5 6 7 Strongly Agree
I. The following scales refer to your attitude toward auto insurance as aproduct class. Auto insurance is:
unimportant 1 2 3 4 5 6 7 important
means mothing 1 2 3 4 5 6 7 means a lotto me to me
does not matter 1 2 3 4 5 6 7 matters a lotto me to me
insignificant 1 2 3 4 5 6 7 significant
of no concern 1 2 3 4 5 6 7 of concern
193
Reproduced with permission of the copyright owner. Further reproduction prohibited without permission.

J. Now, turn the advertisement page up and over so that it is no longer visible to yon. Please answer the following questions without referring to the ad. Circle your response. Do not guess.
1. Did the ad contain an endorsement for the insurance? Yes No Don’t know
2. If an endorsement was present, who was the endorser?
a person a magazine I don't know
3. If a magazine endorsed the insurance, was the magazine non-profit or for-profit?
for-profit non-profit I don't know
4. Before you read this ad, what was your perception of the SHELTER brand image? (Image is defined as the degree to which you would consider purchase of the brand and recommend it to others)
low brand image 1 2 3 4 5 6 7 high brand image
5. Please indicate your gender. Male Female
6. Please indicate your degree of familiarity with each of the following:
Consumer's Digest magazineHighly unfamiliar 1 2 3 4 5 6 7 Highly familiar
Mario AndrettiHighly unfamiliar 1 2 3 4 5 6 7 Highly familiar
7. Please indicate your perception of the auto insurance expertise of the following: (Expertise is defined as accuracy and breadth of knowledge of a subject)
Consumer's Digest magazineVery Low Expertise 1 2 3 4 5 6 7 Very High Expertise
Mario AndrettiVery Low Expertise 1 2 3 4 5 6 7 Very High Expertise
8. Do you have an auto insurance policy in your name? (Circle your response)
Yes No
9. If you have an auto insurance policy in your name, did you actively choose the insurance company or did you blindly follow the choice of your parents/family member/friend? (Circle your response)Active Choice Blindly Followed END OF SURVEY - THANKS
194
Reproduced with permission of the copyright owner. Further reproduction prohibited without permission.

VITA
Dwane Hal Dean was bom in Stillwater, Oklahoma, on November 30, 1951. His
early career focused on the dental profession. Dwane received a bachelor o f science
degree in pre-medical science from Oklahoma State University in 1974, and the
degree of Doctor o f Dental Surgery from the University o f Oklahoma in 1977. He
completed specialty training in oral pathology at the University of Alabama School of
Dentistry, and he was subsequently awarded Diplomate status by the American Board
of Oral Pathology.
Concurrent with his oral pathology training, Dwane pursued an interest in
laboratory research. He received a Postdoctoral Research Fellowship from the
National Institute of Dental Research to fund his education and research in oral
biology. From studies during this period, Dwane received a master’s degree in
experimental pathology from the University o f Alabama at Birmingham in 1983.
More recently, Dwane has pursued a career in academic marketing. He will
receive the degree of Doctor o f Philosophy in business administration (marketing)
from Louisiana State University in August, 2000.
195
Reproduced with permission of the copyright owner. Further reproduction prohibited without permission.

DOCTORAL EXAMINATION AND DISSERTATION REPORT
Candidate:
Major Field:
Title of Dissertation:
Date off Kranination:
June 19, 2000
Dwane Hal Dean
Business Administration (Marketing)
Third-Party Organization Endorsement of Products: An Advertising Cue Affecting Consumer Pre-Purchase Evaluation of Goods and Services
andjor Profes
iuate School
EXAMINING COMMITTEE:
<r
Reproduced with permission of the copyright owner. Further reproduction prohibited without permission.