Embed Size (px)
Citation preview

ALFA, S.A.B. DE C.V.
THIRD QUARTER 2018 FINANCIAL REPORT
ALFA reports record EBITDA of US $666 million in 3Q18, up 66% year-over-year
Monterrey, N.L., Mexico, October 15, 2018.- ALFA, S.A.B. de C.V. (ALFA), reported today its 3Q18 unaudited financial results. Total revenues were US $4,950 million, up 16% year-on-year due to higher sales at Alpek and Nemak. EBITDA was US $666 million, a 66% increase vis-à-vis 3Q17 and 28% increase when excluding extraordinary items in both quarters.
Commenting on the Company’s results Mr. Alvaro Fernandez, ALFA’s President, said: “EBITDA increased year-on-year across all major businesses, reflecting their leading market positions and the successful execution of their strategies. Alpek set another record for quarterly EBITDA supported by continued high global PET margins. Likewise, the full consolidation of the acquisition in Brazil and an improved oil price environment were positive contributors to financial results. Nemak’s financial performance also improved year-on-year supported by strong volume from North America. In Europe, the company invested to strengthen its organization to support the development of structural components and parts for electrical vehicles. At Sigma, performance in Mexico continued to drive results, and in Europe we are pleased with the operations of the La Bureba facility. Finally, supported by a solid performance from the enterprise and government segment, Axtel grew its EBITDA year-on-year when excluding 3Q17’s tower sales.”
Consolidated capital expenditures and acquisitions amounted to US $198 million during 3Q18. Net Debt at the close of the quarter reached US $6,901 million, 5% higher when compared to US $6,545 million in 3Q17 reflecting mainly the acquisition of PetroquimicaSuape and Citepe (“Suape/Citepe”) by Alpek in 2Q18. At the end of the quarter, financial ratios were: Net Debt to EBITDA: 2.7 times; Interest Coverage: 5.2 times.
Majority Net Income was US $72 million in 3Q18, 122% higher than the US $333 million loss reported in 3Q17. This improvement is mainly explained by increased margins at Alpek that resulted in higher year-on-year operating income and by the impairments in the year-ago quarter related to M&G’s financial difficulties.
Selected Financial Information (US $ million)
3Q18 2Q18 3Q17
CH. % vs.
2Q18
CH. % vs.
3Q17 YTD.
‘18 YTD.
‘17
YTD Chg.
%
Consolidated Revenues 4,950 4,837 4,278 2 16 14,363 12,507 15 Sigma 1,601 1,587 1,608 1 - 4,740 4,461 6 Alpek 1,941 1,759 1,312 10 48 5,232 3,910 34 Nemak 1,152 1,239 1,099 (7) 5 3,626 3,387 7 Axtel 202 199 211 2 (4) 600 596 1 Newpek 27 25 21 7 30 85 76 12
Consolidated EBITDA 1 666 676 400 (1) 66 1,971 1,450 36 Sigma 180 168 179 7 - 510 481 6 Alpek 274 239 3 14 - 694 243 185 Nemak 160 207 153 (23) 5 563 550 3 Axtel 69 73 74 (5) (7) 216 213 1 Newpek (2) 1 1 (271) (324) 15 (1) -
Majority Net Income 72 184 (333) (61) 122 445 (103) 530 Capital Exp. & Acquisitions 198 651 326 (70) (39) 1,034 851 22 Net Debt 6,901 7,014 6,545 (2) 5 6,901 6,545 5
Net Debt/LTM EBITDA * 2.7 3.1 3.3 LTM Interest Coverage * 5.2 4.7 5.1
* Times. LTM = Last 12 months 1 EBTIDA = Operating Income + depreciation and amortization + impairment of assets.
CONTENT: SUMMARY OF GROUPS…2 | ALFA FINANCIAL TABLES…6 | ALFA GROUPS FINANCIAL INFORMATION…10 |

ALFA´S THIRD QUARTER 2018
2
Summary of subsidiary performance during 3Q18 Sigma’s revenues amounted to US $1,601 million, similar to 3Q17. Mexico sales increased 7% in pesos. European sales in euros increased 1%, benefiting from the consolidation of the September 2017 acquisition of Caroli. U.S. and Latin American sales were 1% and 2% lower than 3Q17, respectively.
Sigma reported 3Q18 EBITDA of US $180 million, similar year-on-year. Excluding Europe´s extraordinary items related to gains in the acquisition of Caroli and a provision for the closure of a manufacturing facility, EBITDA increased 3%. EBITDA benefited from a solid performance of the Mexican and European operations.
During 3Q18, capital expenditures totaled US $41 million. The funds were utilized for expansion and maintenance projects across the company.
Sigma had strong cash flow generation during 3Q18, reducing its Net Debt to US $1,932 million, 5% lower than 3Q17. Net Debt to EBITDA improved from 3.1x in 3Q17 to 2.7x, while Interest Coverage improved from 4.6x in 3Q17 to 5.3x.
(See appendix “A” for more comprehensive analysis of Sigma´s 3Q18 financial results)
Alpek´s revenues for 3Q18 totaled US $1,941 million, up 48% year-on-year, including US $207 million from PetroquímicaSuape and Citepe (“Suape/Citepe”), the two Brazilian companies acquired last quarter. Excluding Suape and Citepe, revenues were up 32% year-on-year driven by higher average prices which rose 34% in the period reflecting higher oil and feedstock prices.
3Q18 EBITDA was US $274 million, including a net gain of US $40 million from the following three non-operating items: i) a US $33 million non-cash inventory gain, ii) a US $9 million insurance gain, and iii) US $1 million in non-recurring legal fees/expenses. Adjusting for these items, EBITDA was US $234 million and US $108 million in 3Q18 and 3Q17 respectively. 3Q18 EBITDA benefited from a strong year-over-year recovery in global polyester margins and solid sequential EBITDA growth in Suape/Citepe, among others.
Alpek completed the required repairs and restarted two production lines of its PTA plant in Altamira, Mexico early September, following a fire that affected a section of the facility on July 15. Also, Hurricane Florence caused short disruptions at the three polyester sites located in North and South Carolina. Alpek worked diligently to mitigate both the impact of the Altamira plant’s unplanned shutdown and the temporary disruptions associated with the hurricane, by leveraging its broader integrated polyester platform.
With respect to the Mossi & Ghisolfi (“M&G”) bankruptcy, Alpek continued to support M&G Mexico’s PET operations through secured financing as the process to implement a definitive restructuring solution advanced during 3Q18. In addition, the process to obtain the required governmental approvals to acquire the Corpus Christi project from M&G USA is also underway.
During the quarter, the U.S. Department of Commerce (“USDOC”) announced affirmative final determinations in the PET antidumping duty investigations. Final rates on PET imports from Brazil, Indonesia, Korea, Pakistan and Taiwan range from 5% to 276%. Next, the U.S. International Trade Commission (“USITC”) is expected to issue its final determinations in 4Q18.
Capex for the quarter reached US $37 million. The largest investment year-to-date is in the construction of the 350 MW Altamira cogeneration power plant that reached 98% completion and is expected to begin operations in the coming months. In anticipation of the facility’s start-up, Alpek resumed the sale of Altamira’s power via long-term contracts amid a sustained rise in Mexican power tariffs. Simultaneously, the process to finalize the potential sale of the Cosoleacaque and Altamira cogeneration power plants advanced during 3Q18.

ALFA´S THIRD QUARTER 2018
3
Net Debt as of the end of the quarter was US $1,603 million, up 34% year-on-year, mainly as a result of the Suape/Citepe acquisition in 2Q18. At quarter end, financial ratios were as follows: Net Debt to EBITDA of 1.9 times and Interest Coverage of 7.8 times.
(See appendix “B” for Alpek´s 3Q18 financial report)
Nemak´s 3Q18 sales volume was 12.3 million equivalent units, 5% higher than 3Q17, as higher sales in North America (NA) and Rest of the World (RoW) more than offset declines in Europe. Continuing with recent trends, NA volumes improved mainly reflecting better performance among Detroit 3 automakers. In Europe, Nemak´s volumes declined mainly due to the effect of lower sales to diesel engine applications together with production delays among OEMs caused by the implementation of new emissions testing standards. RoW volumes improved year-on-year as new program launches in South America more than offset lower sales to customers in China.
Revenues were US $1,152 million, up 5% year-over-year, supported by higher sales volume and aluminum prices. In turn, 3Q18 EBITDA totaled US $160 million, up 5% year-on-year, mainly driven by higher sales volumes and operational efficiencies. 3Q18 EBITDA per equivalent unit was US $13.00, compared to US $13.10 in 3Q17.
During the quarter, Nemak invested US $72 million to support new program launches and to drive operational efficiency across the company.
Net Debt at the end of 3Q18 totaled US $1,304 million, down 6% from 3Q17, reflecting cash generation during the period. Financial ratios in 3Q18 were: Net Debt to EBITDA of 1.8 times, and Interest Coverage of 8.4 times.
(See appendix “C” for Nemak´s 3Q18 financial report)
Axtel´s revenues in the second quarter totaled US $202 million, down 4% year-on-year, explained by lower revenues in the Mass Market segment as the legacy Wimax service continued to decline, offsetting growth in FTTx. By contrast, the core Enterprise and Government segment, which represented 82% of revenues in the quarter, continued to grow in IT services and Managed Networks. In peso terms, core Enterprise and Government segment revenues increased 4% in the quarter.
3Q18 reported EBITDA was US $69 million, down 7% year-on-year. However, EBITDA advanced 8% year-on-year when excluding the extraordinary gain of US $10 million in 3Q17 from the sale of transmission towers. This increase is explained by better performance from the Enterprise and Government segment.
Capital expenditures totaled US $37 million in 3Q18, including investments to provide last-mile access to connect customers and to deploy IT infrastructure. At the end of 3Q18, Net Debt was US $1,027 million, flat year-on-year. Financial ratios at the end of 3Q18 were: Net Debt to EBITDA of 3.5 times and Interest Coverage of 3.0 times.
(See appendix “D” for Axtel´s 3Q18 financial report)
Newpek´s revenues were US $27 million, up 30% from 3Q17, mainly explained by higher revenues in Mexico which offset lower U.S. production.
At the end of 3Q18 Newpek had 555 producing wells at the Eagle Ford Shale (“EFS”) in South Texas, down from 639 wells in production at the end of 3Q17, due to the partial acreage sale to Sundance Energy earlier in the year. Additionally, Newpek has 14 wells producing in the Wilcox formation, and 34 in the Edwards formation, both in South Texas, where Newpek has a 20% working interest. Production in the U.S. averaged 4.0 thousand barrels of oil equivalent per day (MBOED) during 3Q18, down 7% from 3Q17. In Mexico, production averaged 3.4 MBOED during 3Q18, the same as 3Q17.

ALFA´S THIRD QUARTER 2018
4
During 3Q18 the company reported an EBITDA loss of US $2 million, compared to positive US $1 million in 3Q17 mainly explained by higher expenses in Mexico during the quarter. Capital expenditures were US $8 million, while net debt was US $18 million at the end of the quarter.
The process to divest the remaining Eagle Ford Shale acreage position continues.
(See appendix “E” for more comprehensive analysis of Newpek´s 3Q18 financial results)
Consolidated financial results 3Q18 consolidated revenues were US $4,950 million, up 16% from US $4,278 million reported in 3Q17. The increase is mainly explained by higher sales at Alpek due to higher average prices and the consolidation of Suape/Citepe, and larger volumes at Nemak. During the quarter, foreign sales represented 67% of the total, up from 65% in 3Q17. Year-to-date, revenues were US $14,363, up 15% from 2017 driven by growth across all business units.
3Q18 Consolidated Operating Income totaled US $402 million, up US $704 million from a loss of US $302 million in 3Q17. Both quarters include extraordinary items as follows:
Extraordinary Items (US $ million)
Company Extraordinary Item 3Q18 3Q17
Alpek M&G A/R impairment - (113) M&G Corpus Christi asset impairment - (435) Inventory revaluation 32 9 Insurance payment Altamira plant fire 9 -
Sigma Legal fees
Caroli acquisition gain
(1)
10
-
10 European plant closure provision charge (4) -
Axtel Tower sales - 10 Total 46 (519)
Excluding the effects of extraordinary items in both quarters, Operating Income increased 64% year-on-year to US $356 million in 3Q18 from US $217 million and in 3Q17. Growth is mostly explained by a continued strong performance in Alpek, due to better polyester margins, a favorable oil price environment, plus the full consolidation of Suape and Citepe. At Sigma, a solid performance in Mexico was the main driver behind a 7% increase in operating income, when excluding non-recurring items. Nemak reported a 5% year-on-year increase in operating income, reflecting higher volume and operational efficiencies. At Axtel, comparable operating income increased 10% mainly explained by growth in the Enterprise and Government segments along with productivity initiatives. Accumulated Operating Income was US $1,216 million, up 351% from 2017.
3Q18 EBITDA was US $666 million, up 66% year-on-year, reflecting the increase in Operating Income explained above. Excluding extraordinary items, except the US $435 million non-cash asset impairment related to M&G’s Corpus Christi project which did not impact EBITDA, 3Q18 EBITDA increased 28% from 3Q17. Year-to-date EBITDA was US $1,971 million, up 36% from 2017.
ALFA reported 3Q18 Comprehensive Financing Expense (CFE) of US $133 million, compared to CFE of US $271 million in 3Q17, mainly explained by 3Q17’s US $95 million financial asset impairment related to M&G and lower foreign exchange losses during the quarter, as compared to those recorded in 3Q17.

ALFA´S THIRD QUARTER 2018
5
Majority Net Income was US $72 million in 3Q18, up US $405 million from a loss of US $333 million in 3Q17. This year-on-year improvement is mainly explained by higher Operating Income and lower CFE already described, which was partially offset by higher taxes resulting from FX gains in 3Q18. Year-to-date, Majority Net Income was US $445 million, up from a loss of US $103 million in the same period in 2017.
Capital expenditures and acquisitions; Net debt Consolidated capital expenditures and acquisitions totaled US $198 million in 3Q18. All subsidiaries continued to make progress on their investment plans as discussed in the initial section of this report. Year-to-date, capital expenditures were US $1,034 million, including US $435 million by Alpek for the acquisition of Suape and Citepe in Brazil during 2Q18.
ALFA’s Net Debt amounted to US $6,901 million at the close of 3Q18, 5% higher than the year-ago quarter, mostly reflecting the acquisition of Suape and Citepe mentioned above. At the end of the quarter, financial ratios were: Net Debt to EBITDA of 2.7 times and Interest Coverage of 5.2 times. These ratios compare to 3.3 times and 5.1 times, respectively, in 3Q17.

ALFA´S THIRD QUARTER 2018
6
ALFA Table 1 | Volume and Price Changes (%)
3Q18 vs. YTD. 18 vs. YTD. 17 2Q18 3Q17
Total Volume (0.4) 9.9 9.0 Domestic Volume 0.8 5.5 6.4 Foreign Volume (1.5) 14.5 11.7 Avg. Ps. Prices 0.6 12.1 6.2 Avg. US $ Prices 2.8 5.3 5.3 Table 2 | Revenues
(%) 3Q18 vs. 3Q18 2Q18 3Q17 2Q18 3Q17 YTD. ‘18 YTD.'17 Chg.%
Total Revenues Ps. Millions 93,940 93,738 76,235 - 23 273,528 236,282 16 US $ Millions 4,950 4,837 4,278 2 16 14,363 12,507 15
Domestic Revenues Ps. Millions 30,559 30,026 26,719 2 14 88,486 83,025 7 US $ Millions 1,611 1,551 1,499 4 7 4,648 4,396 6
Foreign Revenues Ps. Millions 63,381 63,712 49,516 (1) 28 185,042 153,257 21 US $ Millions 3,340 3,286 2,779 2 20 9,715 8,111 20 Foreign / Total (%) 67 68 65 68 65 Table 3 | Operating Income and EBITDA
(%) 3Q18 vs. 3Q18 2Q18 3Q17 2Q18 3Q17 YTD. ‘18 YTD.'17 Chg.%
Operating Income Ps. Millions 7,627 8,532 (5,367) (11) 242 23,205 5,748 304 US $ Millions 402 438 (302) (8) 233 1,216 269 351
EBITDA Ps. Millions 12,638 13,129 7,134 (4) 77 37,555 27,561 36 US $ Millions 666 676 400 (1) 66 1,971 1,450 36 Table 4 | Comprehensive Financing (Expense) / Income (CFI) (US $ millions)
(%) 3Q18 vs. 3Q18 2Q18 3Q17 2Q18 3Q17 YTD. ‘18 YTD.'17 Chg.%
Financial Expenses (129) (144) (114) 11 (13) (416) (353) (18) Financial Income 11 10 8 3 31 36 26 39 Net Financial Expenses (118) (134) (106) 12 (11) (380) (327) (16) Fx Gains (Losses) (20) (44) (74) 54 73 49 145 (66) Financial Asset Impairment 0 0 (95) - (100) 0 (95) (100) Capitalized CFE 5 5 4 4 17 15 11 34 CFE (133) (173) (271) 23 51 (316) (266) (19) Avg. Cost of Borrowed Funds (%) 5.0 5.6 4.7 5.4 5.0

ALFA´S THIRD QUARTER 2018
7
ALFA Table 5 | Majority Net Income (US $ millions)
(%) 3Q18 vs. 3Q18 2Q18 3Q17 2Q18 3Q17 YTD. ‘18 YTD.'17 Chg.%
Consolidated Net Income (Loss) 103 213 (417) (52) 125 578 (65) 984 Minority Interest 31 29 (83) 5 137 134 38 252 Majority Net Income (Loss) 72 184 (333) (61) 122 445 (103) 530 Per Share (US Dollars) 0.01 0.04 (0.07) (61) 122 0.09 (0.02) 535 Avg. Outstanding Shares (Millions)
5,055 5,055 5,086 5,055 5,095
Table 6 | Cash Flow (US $ millions)
(%) 3Q18 vs.
3Q18 2Q18 3Q17 2Q18 3Q17 YTD. ‘18 YTD.'17 Chg.%
EBITDA 666 676 400 (1) 66 1,971 1,450 36 Net Working Capital & Others (138) (9) 56 - (346) (626) (218) (187) Capital Expenditures & Acquisitions
(198) (651) (326) 70 39 (1,034) (851) (22)
Net Financial Expenses (116) (129) (103) 10 (13) (381) (330) (15) Taxes (86) (202) (57) 57 (51) (317) (198) (60) Dividends (ALFA, S.A.B.) 0 0 0 - - (169) (170) 1 Other Sources / Uses (15) 42 (114) (136) 87 (45) (384) 88 Decrease (Increase) in Net Debt 113 (273) (144) 141 178 (601) (701) 14 Table 7 | Selected Balance Sheet Information & Financial Ratios (US $ millions) 3Q18 2Q18 3Q17 YTD.’17 YTD.’18 Assets 18,853 18,660 18,002 18,853 18,002 Liabilities 14,057 14,042 13,182 14,057 13,182 Stockholders’ Equity 4,796 4,617 4,821 4,796 4,821 Majority Equity 3,600 3,456 3,608 3,600 3,608 Net Debt 6,901 7,014 6,545 6,901 6,545 Net Debt/EBITDA* 2.7 3.1 3.3 2.7 3.3 Interest Coverage* 5.2 4.7 5.1 5.2 5.1
* Times: LTM = Last 12 months

ALFA´S THIRD QUARTER 2018
8
ALFA Appendix A ALFA, S.A.B. de C.V. and Subsidiaries BALANCE SHEET Information in millions of Nominal Mexican Pesos (%) Sep 18 vs. Sep 18 Jun 18 Sep 17 Jun 18 Sep 17 Assets CURRENT ASSETS: Cash and cash equivalents 21,494 22,943 23,646 (6) (9) Trade accounts receivable 34,007 33,188 26,180 2 30 Other accounts and notes receivable 5,024 6,633 6,816 (24) (26) Inventories 48,092 50,526 40,515 (5) 19 Other current assets 11,662 11,235 11,633 4 - Total current assets 120,279 124,525 108,790 (3) 11 INVESTMENTS IN ASSOCIATES AND JOINT VENTURES 2,774 2,545 1,299 9 114 PROPERTY, PLANT AND EQUIPMENT 151,881 160,145 143,556 (5) 6 INTANGIBLE ASSETS 52,741 55,075 53,433 (4) (1) OTHER NON-CURRENT ASSETS 26,985 28,353 20,529 (5) 31 Total assets 354,660 370,643 327,607 (4) 8 LIABILITIES AND STOCKHOLDER'S EQUITY CURRENT LIABILITIES: Current portion of long-term debt 841 2,795 2,591 (70) (68) Bank loans and notes payable 10,520 13,246 11,149 (21) (6) Suppliers 59,759 62,412 51,131 (4) 17 Other current liabilities 24,231 23,630 20,176 3 20 Total current liabilities 95,351 102,084 85,048 (7) 12 LONG-TERM LIABILITIES: Long-term debt 140,929 147,482 130,865 (4) 8 Deferred income taxes 12,245 13,009 13,577 (6) (10) Other liabilities 10,822 11,221 5,759 (4) 88 Estimated liabilities for seniority premiums and pension plans 5,100 5,133 4,626 (1) 10 Total liabilities 264,447 278,929 239,876 (5) 10 STOCKHOLDERS' EQUITY: Controlling interest: Capital stock 211 211 212 - - Earned surplus 67,509 68,434 65,445 (1) 3 Total controlling interest 67,720 68,645 65,657 (1) 3 Total Non-controlling interest 22,494 23,069 22,073 (2) 2 Total stockholders' equity 90,214 91,713 87,731 (2) 3 Total liabilities and stockholders' equity 354,660 370,643 327,607 (4) 8 Current ratio 1.26 1.22 1.28 Debt to equity 2.93 3.04 2.73

ALFA´S THIRD QUARTER 2018
9
ALFA Appendix BALFA, S.A.B. DE C.V. and SubsidiariesSTATEMENT OF COMPREHENSIVE INCOMEInformation in millions of Nominal Mexican Pesos
3Q18 vs. (%)
3Q18 2Q18 3Q17 YTD´18 YTD´17 2Q18 3Q17
Net sales 93,940 93,738 76,235 273,528 236,282 - 23 Domestic 30,559 30,026 26,719 88,486 83,025 2 14 Export 63,381 63,712 49,516 185,042 153,257 (1) 28
Cost of sales (75,193) (73,589) (61,368) (216,980) (189,467) (2) (23) Gross profit 18,747 20,149 14,867 56,549 46,815 (7) 26 Operating expenses and others (11,120) (11,618) (20,233) (33,344) (41,068) 4 45 Operating income 7,627 8,532 (5,367) 23,205 5,748 (11) 242 Comprehensive financing expense, net (2,527) (3,344) (4,823) (6,019) (4,690) 24 48 Equity in income (loss) of associates 33 15 5 136 76 120 560 Income before the following provision 5,133 5,203 (10,184) 17,322 1,133 (1) 150 Provisions for: Income tax (3,187) (1,030) 2,759 (6,265) (1,720) (209) (216) Consolidated net income 1,945 4,173 (7,426) 11,056 (587) (53) 126 Income (loss) corresponding to minority interest
588 586 (1,487) 2,558 875 - 140
Net income (loss) corresponding to majority interest
1,358 3,587 (5,939) 8,499 (1,462) (62) 123
EBITDA 12,638 13,129 7,134 37,555 27,561 (4) 77 Interest coverage* 5.2 4.8 5.2 5.2 5.2 * LTM

ALFA´S THIRD QUARTER 2018
10
LuisOchoa+52(81)[email protected]
Juan Andrés Martín +52(81)[email protected]
Eugenia Villarreal +52(81)[email protected]
InspIR Group
Susan Borinelli +1(646)[email protected]
This release may contain forward-looking information based on numerous variables and assumptions that are inherently uncertain. They involve judgments with respect to, among other things, future economic, competitive and financial market conditions and future business decisions, all of which are difficult or
impossible to predict accurately. Accordingly, results could vary from those set forth in this release. The report presents unaudited financial information. Figures are presented in Mexican pesos or US Dollars, as indicated. Where applicable, peso amounts were translated into US Dollars using the average
exchange rate of the months during which the operations were recorded. Financial ratios are calculated in US Dollars. Due to the rounding up of figures, small differences may occur when calculating percent changes from one period to the other.
APPENDIX: A SIGMA 11 B ALPEK 17 C NEMAK 30 D AXTEL 38 E NEWPEK 47

ALFA´S THIRD QUARTER 2018
11
Food products 33% of ALFA´s revenues and 26% of ALFA’s EBITDA in 3Q18
Sigma is a leading multinational food company that produces, markets and distributes quality branded foods, including packaged meats, cheese, yogurt and other refrigerated and frozen foods. Sigma has a diversified portfolio of leading brands and operates 70 plants in 18 countries across its four key regions: Mexico, Europe, the United States, and Latin America.
Key figures (US $ million)
3Q18 2Q18 3Q17
Ch % vs. 2Q18
Ch % vs. 3Q17 YTD.’18 YTD.’17
YTD. Chg. %
Total Revenues 1,601 1,587 1,608 1 - 4,740 4,461 6 Total EBITDA 180 168 179 7 - 510 481 6 Capex 41 39 34 8 21 107 117 (8) Net Debt/ EBITDA
2.7 2.9 3.1 2.7 3.1
Revenues amounted to US $1,601 million, similar to 3Q17. Mexico sales increased 7% in pesos. European sales in euros increased 1%, benefiting from the consolidation of the September 2017 acquisition of Caroli. U.S. and Latin American sales were 1% and 2% lower than 3Q17, respectively. Accumulated 2018 revenues totaled US $4,740 million, a 6% increase from the first nine months of 2017.
Sigma reported 3Q18 EBITDA of US $180 million, similar year-on-year. Excluding Europe´s extraordinary items explained below, EBITDA increased 3%. EBITDA benefited from a solid performance of the Mexican and European operations. Accumulated 2018 EBITDA totaled US $510 million, up 6% from the same period in 2017.
During 3Q18, capital expenditures totaled US $41 million. The funds were utilized for expansion and maintenance projects across the company.
Sigma had strong cash flow generation during 3Q18, reducing its Net Debt to US $1,932 million, 5% lower than 3Q17. Net Debt to EBITDA improved from 3.1x in 3Q17 to 2.7x, while Interest Coverage improved from 4.6x in 3Q17 to 5.3x.
Industry comments Consumer confidence was mixed during the quarter, while food retail sales increased across all regions. In Europe, according to the European Commission, the average consumer confidence index decreased slightly from -1.5 in 3Q17 to -1.8 during 3Q18, and food retail sales according to Eurostat increased 1%. In Mexico, the average consumer confidence index reported by INEGI (Instituto Nacional de Estadística y Geografía – National Institute for Statistics and Geography) grew 17% year-on-year and 18% vs 2Q18, while same-store-sales reported by the National Association of Supermarkets and Department Stores (ANTAD) increased 5% year-on-year in nominal pesos. In the U.S., the average consumer confidence index increased 11% year-on-year as reported by The Conference Board, and food retail sales increased 4% year-on-year, reported by the U.S. Census Bureau.

ALFA´S THIRD QUARTER 2018
12
Key raw material prices were varied during the quarter. In Europe, prices for pork ham during 3Q18 remained stable and pork shoulder decreased 3% vs previous quarter. Year-on-year, 3Q18 pork ham and pork shoulder prices were 14% and 16% lower, respectively. In the U.S., compared to the previous quarter, pork ham, chicken and turkey thigh prices were similar on average, while turkey breast increased 9%. Compared to 3Q17, pork ham prices were 19% lower. By contrast, chicken was 7% higher and turkey breast and turkey thighs were 30% and 27% higher year on year, respectively. For Mexico, pork prices were impacted by the tariffs imposed on June 5th.
Additionally, prices for pork belly and pork trims, which are mainly used for the U.S. operations increased 6% and 30% vs 2Q18, respectively.
Financial results by region For 3Q18, sales in Mexico accounted for 42% of the quarter’s total, while Europe represented 35%, the U.S. 16%, and Latin America 7%.
Europe
Sales in Europe during 3Q18 in euros increased 1% year-on-year. 3Q18 EBITDA in euros increased 2% vs. 3Q17, this includes 3.4 M € in a nonrecurring provision from the closure of one manufacturing facility, as well as extraordinary gains of approximately 8 M € in both 3Q17 and 3Q18 related to the September 2017 acquisition of Caroli. Excluding these extraordinary items, 3Q18 EBITDA was 15% higher year-on-year, benefiting from better margins due to lower raw material costs, production efficiencies from the new Bureba plant and the Caroli acquisition which is exceeding management’s expectations.
Mexico
The Mexican operations continue reporting solid results. During 3Q18 Mexican sales and EBITDA in pesos increased 7% and 16% year-on-year, respectively. In turn, EBITDA margin increased 120 basis points year over year to 14.5%.
USA
3Q18 U.S. sales decreased 1% year-on-year and EBITDA decreased 24% year-on-year. The U.S. results were significantly impacted by higher raw materials costs, along with continued high freight costs associated with the new transportation regulation, and a non-recurring stoppage at one of our main facilities in the U.S. related to necessary updates.
Latam
Third quarter 2018 Latin America sales in USD terms decreased 2% year-on-year. By contrast, EBITDA increased 18% year-on-year. This improvement includes solid results at the Peruvian operations, with better than expected PMI results, and improved performance in Dominican Republic.

ALFA´S THIRD QUARTER 2018
13
Selected financial information Selected Financial Information (US $ million)
3Q18 2Q18 3Q17 Ch % vs.
2Q18 Ch % vs.
3Q17 YTD.’18 YTD.’17 YTD.
Ch. % Total Revenues 1,601 1,587 1,608 1 - 4,740 4,461 6
Europe 568 558 571 2 (1) 1,686 1,539 10 Mexico 668 647 668 3 - 1,951 1,860 5 USA 248 264 251 (6) (1) 752 739 2 Latam 117 118 119 (1) (2) 351 323 9
Total EBITDA 180 168 179 7 - 510 481 6 Europe 45 39 45 15 - 120 113 6 Mexico 97 88 90 11 9 270 238 14 USA 27 33 36 (16) (24) 92 104 (12) Latam 10 8 9 22 18 29 27 7
Capex 41 39 34 8 21 107 117 (8) Net Debt 1,932 2,030 2,037 (5) (5) 1,932 2,037 (5)
Net Debt / EBITDA 2.7 2.9 3.1 2.7 3.1 LTM Interest Coverage
5.3 5.2 4.6 5.3 4.6

ALFA´S THIRD QUARTER 2018
14
SIGMA Table 1 | Volume and Price Changes (%)
3Q18 vs. YTD. ‘18 vs. YTD. ‘17 2Q18 3Q17
Total Volume (2.0) 0.6 2.7 Avg. Ps. Prices 0.8 5.4 4.6 Avg. US $ Prices 2.9 (1.0) 3.5 Table 2 | Revenues
(%) 3Q18 vs. 3Q18 2Q18 3Q17 2Q18 3Q17 YTD. ‘18 YTD.'17 Chg.%
Total Revenues Ps. Millions 30,384 30,755 28,658 (1) 6 90,249 84,060 7 US $ Millions 1,601 1,587 1,608 1 - 4,740 4,461 6
Domestic Revenues Ps. Millions 12,682 12,525 11,902 1 7 37,136 35,037 6 US $ Millions 668 647 668 3 - 1,951 1,860 5
Foreign Revenues Ps. Millions 17,701 18,230 16,757 (3) 6 53,113 49,024 8 US $ Millions 933 940 940 (1) (1) 2,789 2,601 7 Foreign / Total (%) 58 59 58 59 58 Table 3 | Operating Income and EBITDA
(%) 3Q18 vs. 3Q18 2Q18 3Q17 2Q18 3Q17 YTD. ‘18 YTD.'17 Chg.%
Operating Income Ps. Millions 2,433 2,210 2,229 10 9 6,668 6,096 9 US $ Millions 128 114 125 12 3 350 326 7
EBITDA Ps. Millions 3,412 3,250 3,192 5 7 9,706 9,026 8 US $ Millions 180 168 179 7 - 510 481 6 Table 4 | Selected Balance Sheet Information & Financial Ratios (US $ millions) 3Q18 2Q18 3Q17 YTD.’18 YTD.’17 Assets 5,185 5,166 5,365 5,185 5,365 Liabilities 4,215 4,235 4,407 4,215 4,407 Stockholders’ Equity 970 931 958 970 958 Majority Equity 936 898 925 936 925 Net Debt 1,932 2,030 2,037 1,932 2,037 Net Debt/EBITDA* 2.7 2.9 3.1 2.7 3.1 Interest Coverage* 5.3 5.2 4.6 5.3 4.6
* Times: LTM = Last 12 months

ALFA´S THIRD QUARTER 2018
15
SIGMA Appendix A Sigma Alimentos, S.A. de C.V. and Subsidiaries BALANCE SHEET Information in millions of Nominal Mexican Pesos (%) Sep 18 vs. Sep 18 Jun 18 Sep 17 Jun 18 Sep 17 ASSETS CURRENT ASSETS: Cash and cash equivalents 10,603 10,847 10,098 (2) 5 Restricted cash 51 85 149 (41) (66) Customers, net 4,941 5,351 6,201 (8) (20) Income tax recoverable 336 450 827 (25) (59) Inventories 14,831 15,387 14,584 (4) 2 Other current assets 2,809 2,698 3,168 4 (11) Total current assets 33,570 34,818 35,028 (4) (4)
NON-CURRENT ASSTES: Property, plant and equipment, net 32,969 34,427 32,808 (4) - Intangible assets, net 15,453 15,623 14,516 (1) 6 Goodwill 12,941 14,090 12,946 (8) - Deferred income tax 2,238 2,666 2,101 (16) 7 Investments in associates and joint ventures 103 89 89 16 15 Other non-current assets 263 909 142 (71) 85 Total non-current assets 63,966 67,803 62,602 (6) 2 Total assets 97,536 102,621 97,630 (5) - LIABILITIES AND STOCKHOLDER'S EQUITY CURRENT LIABILITIES: Current debt 652 2,234 2,470 (71) (74) Notes payables 82 87 65 (6) 26 Suppliers 18,248 19,020 18,221 (4) - Income tax payable 1,889 1,652 1,740 14 9 Provisions 189 130 182 45 4 Other current liabilities 5,546 5,573 5,044 - 10 Total current liabilities 26,606 28,696 27,722 (7) (4) NON-CURRENT LIABILITIES:
Non-current debt 45,688 48,323 44,109 (5) 4 Notes payables 250 274 314 (9) (20) Deferred income taxes 3,474 3,594 4,114 (3) (16) Employees benefits 1,404 1,417 1,190 (1) 18 Provisions 96 98 154 (2) (37) Income tax payable 1,277 1,264 2,121 1 (40) Other non-current liabilities 500 457 468 9 7 Total non-current liabilities 52,688 55,425 52,470 (5) - Total liabilities 79,294 84,122 80,192 (6) (1) STOCKHOLDERS' EQUITY: Total controlling interest 17,607 17,837 16,828 7 18 Total Non-controlling interest 635 662 610 - 16 Total stockholders' equity 18,242 18,499 17,438 (1) 5 Total liabilities and stockholders' equity 97,536 102,621 97,630 (5) -

ALFA´S THIRD QUARTER 2018
16
SIGMA Appendix BSigma Alimentos, S.A. de C.V. and SubsidiariesSTATEMENT OF COMPREHENSIVE INCOMEInformation in millions of Nominal Mexican Pesos
3Q18 vs. (%)
3Q18 2Q18 3Q17 YTD´18 YTD´17 2Q18 3Q17
Revenue 30,384 30,755 28,658 90,249 84,060 (1) 6
Cost of sales (21,815) (22,165) (20,695) (64,916) (60,807) (2) 5
Gross profit
8,569 8,590 7,963 25,333 23,253 - 8
Selling expenses
(4,974) (5,061) (4,654) (14,882) (13,590) (2) 7
Administrative expenses
(1,314) (1,343) (1,272) (4,044) (3,708) (2) 3
Other income (expenses), net
153 24 192 262 141 530 (20)
Operating profit
2,433 2,210 2,229 6,668 6,096 10 9
Comprehensive financing expense, net
(531) (204) (889) (1,452) (3,332) 160 (40)
Equity in income (loss) of associates
17 (0) 9 16 16 - 83
Profit before income tax
1,918 2,006 1,349 5,233 2,781 (4) 42 Provisions for: Income tax (1,293) (85) (330) (2,410) (2,402) - 292
Net consolidated profit
626 1,921 1,019 2,823 379 (67) (39)
Non-controlling interest
11 (15) 13 (2) 20 (178) (11)
Controlling interest
614 1,936 1,007 2,825 359 (68) (39)

Third Quarter 2018 (3Q18) |
This release contains forward‐looking information based on numerous variables and assumptions that are inherently uncertain. They involve judgments with respect to, among other things, future economic, competitive and financial market conditions and future business decisions, all of which are difficult or impossible to predict accurately. Accordingly, results could vary from those set forth in this release. The report presents unaudited financial information based on International Financial Reporting Standards (IFRS). Figures are stated in nominal Mexican pesos ($) and in current U.S. Dollars (U.S. $), as indicated. Where applicable, peso amounts were translated into U.S. Dollars using the average exchange rate of the months during which operations were recorded. Financial ratios are calculated in U.S. Dollars. Due to the rounding up of figures, small differences may occur when calculating percent changes from one period to the other.
Monterrey, Mexico. October 15, 2018 – Alpek, S.A.B. de C.V. (BMV: ALPEK)
Alpek reports 3Q18 EBITDA of U.S. $274 million
Selected Financial Information (U.S. $ Millions)
(%) 3Q18 vs.
3Q18 2Q18 3Q17 2Q18 3Q17 YTD18 YTD17 Ch.%
Total Volume (ktons) 1,174 1,151 1,012 2 16 3,341 3,036 10
Polyester 941 912 788 3 19 2,639 2,353 12
Plastics & Chemicals 233 239 225 (3) 4 701 683 3
Consolidated Revenues 1,941 1,759 1,312 10 48 5,232 3,910 34
Polyester 1,450 1,320 945 10 53 3,879 2,791 39
Plastics & Chemicals 451 439 367 3 23 1,313 1,119 17
Consolidated EBITDA 274 239 3 14 8,358 694 243 185
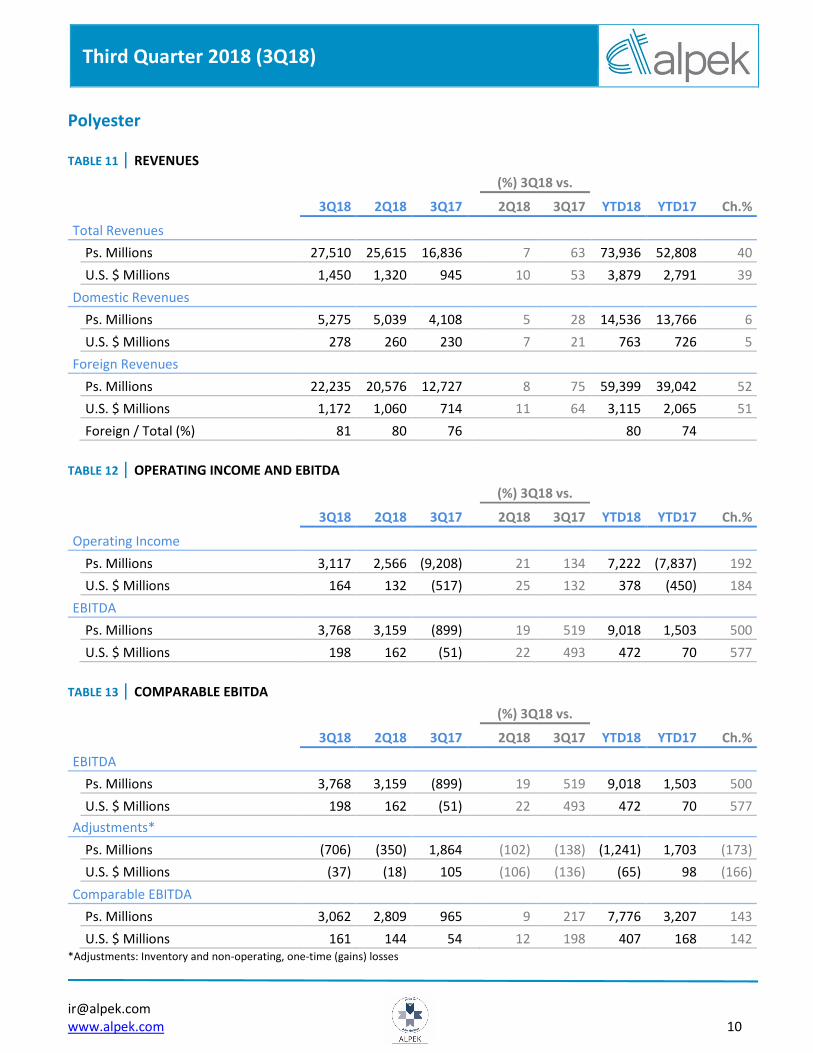
Polyester 198 162 (51) 22 493 472 70 577
Plastics & Chemicals 76 78 54 (3) 42 224 173 29
Profit Attributable to Controlling Interest 80 142 (400) (44) 120 304 (289) 205
CAPEX and Acquisitions 37 471 64 (92) (43) 564 206 174
Net Debt 1,603 1,637 1,192 (2) 34
Net Debt/LTM EBITDA(1) 1.9 2.9 3.2
Interest Coverage(1) 7.8 5.9 5.4 (1) Times: Last 12 months
Operating & Financial Highlights (3Q18)
Alpek
• Record high consolidated 3Q18 EBITDA of U.S. $274 million, including a U.S. $33 million
non-cash inventory gain, a U.S. $9 million insurance gain, and U.S. $1 million non-recurring
legal fees/expenses. Comparable 3Q18 EBITDA of U.S. $234 million
• 1.9 times Net Debt/LTM EBITDA; down from 3.3 times at the close of 2017
• Ongoing process to finalize the sale of two cogeneration power plants in Mexico
Polyester
• 3Q18 Polyester EBITDA of U.S. $198 million, including a U.S. $30 million non-cash inventory
gain, a U.S. $9 million insurance gain, and U.S. $1 million non-recurring legal fees/expenses;
comparable 3Q18 Polyester EBITDA of U.S. $161 million; up 12% q-o-q
• Completed repairs and restarted operations at Altamira PTA plant in early September
• Suape/Citepe volume, sales and EBITDA up versus 2Q18
Plastics &
Chemicals
(P&C)
• 3Q18 P&C EBITDA of U.S. $76 million, including a U.S. $3 million non-cash inventory gain
• Comparable 3Q18 P&C EBITDA up +36% yoy and down -3% qoq driven by polypropylene (PP)
• Lower polypropylene (PP) volume yoy and qoq offset by higher margin

Third Quarter 2018 (3Q18) |
www.alpek.com 2
Message from the CEO
Alpek’s third quarter 2018 Consolidated EBITDA was U.S. $274 million, up year-over-year and quarter-on-
quarter driven mainly by strong Polyester segment performance. The impact associated to the fire in a section of the
Altamira PTA plant and the temporary disruptions caused by Hurricane Florence were more than offset by better-
than-expected global reference polyester margins, a favorable feedstock price environment and the consolidation of
PetroquímicaSuape and Citepe (“Suape/Citepe”), among others.
Feedstock prices rallied during the third quarter as the spot Brent crude oil price rose above U.S. $80 per
barrel for the first time since 2014. The U.S. reference paraxylene (“Px”) and propylene (“PGP”) contract prices
increased 29% and 2% from June to September, respectively. Higher feedstock prices resulted in a U.S. $33 million
non-cash inventory gain during the third quarter and a U.S. $69 million gain year-to-date.
3Q18 Polyester segment EBITDA was U.S. $198 million, including a U.S. $30 million non-cash inventory gain,
a U.S. $9 million one-time gain from an advanced insurance payment associated to the Altamira fire, and U.S. $1
million in non-recurring legal fees/expenses. Adjusting for these three items, 3Q18 Comparable Polyester EBITDA
was U.S. $161 million, up 198% and 12% when compared to 3Q17 and 2Q18, respectively, driven mainly by the strong
year-over-year recovery in global polyester margins and solid sequential EBITDA growth in Suape/Citepe, among
others.
Alpek completed the required repairs and restarted the two production lines of its PTA plant in Altamira,
Mexico in early September, following a fire that affected a section of the facility on July 15. Also, Hurricane Florence
caused short disruptions at the three polyester sites located in North and South Carolina. Alpek worked diligently to
mitigate both the impact of the Altamira plant’s unplanned shutdown and the temporary disruptions associated to
the hurricane, by leveraging its broader integrated polyester platform.
Related to the Mossi & Ghisolfi (“M&G”) bankruptcy, Alpek continued to support M&G Mexico’s PET
operations through secured financing as the process to implement a definitive restructuring solution advanced during
3Q18. In addition, the process to obtain the required governmental approvals to acquire the Corpus Christi project
from M&G USA is underway.
A noteworthy U.S. polyester industry development in 3Q18 was the announcement of affirmative final
determinations in the PET antidumping (“AD”) duty investigations conducted by the U.S. Department of Commerce
(“USDOC”). Final rates on PET imports from Brazil, Indonesia, Korea, Pakistan and Taiwan range from 5% to 276%.
Next, the U.S. International Trade Commission (“USITC”) is expected to issue its final injury determinations in 4Q18.
Plastics & Chemicals (“P&C”) EBITDA was U.S. $76 million in 3Q18. Adjusting for non-cash inventory gains,
comparable P&C EBITDA was U.S. $73 million, up 36% year-on-year and down 3% quarter-on-quarter. Higher margins
offset lower volume and incremental costs related to domestic feedstock supply constraints (e.g. propylene,
ammonia and ethylene oxide).
On the investment front, 3Q18 Capex totaled U.S. $37 million as construction of the 350 MW Altamira
cogeneration power plant reached 98% completion and is expected to begin operations in the coming months. In
anticipation to the facility’s start-up, Alpek resumed the sale of Altamira’s power via long-term contracts amid a
sustained rise in Mexican power tariffs. Simultaneously, the process to finalize the potential sale of the Cosoleacaque
and Altamira cogeneration power plants advanced during 3Q18.

Third Quarter 2018 (3Q18) |
www.alpek.com 3
Alpek’s financial position has improved consistently year-to-date, even after the Suape/Citepe acquisition.
Moreover, 3Q18 marks 12 months since the recognition of provisions and impairments related to the M&G
bankruptcy, which affected certain financial metrics. At the close of 3Q18, Net Debt totaled U.S. $1.603 billion and
the leverage ratio (Net Debt to LTM EBITDA) was 1.9 times; down from 3.3 times at the close of 2017.
Consolidated EBITDA is on track to exceed Alpek’s revised 2018 Guidance of U.S. $750 million by more than
U.S. $100 million as a result of higher oil and feedstock prices, better-than-expected global reference polyester
margins, the consolidation of Suape/Citepe and a lower-than-expected impact from the unplanned Altamira plant
shutdown, among others. For the remainder of the year, we expect a lower EBITDA than 3Q18 and 2Q18 based on
demand seasonality, normalized Asian integrated PET margins following the mid-2018 spike and a potential inventory
loss assuming feedstock prices come down from peak 3Q18 levels.
Third Quarter 2018 (3Q18) |
www.alpek.com 4
Results by Business Segment
Polyester (Purified Terephthalic Acid (PTA), Polyethylene Terephthalate (PET), Polyester fibers – 73% of Alpek’s Net Sales)
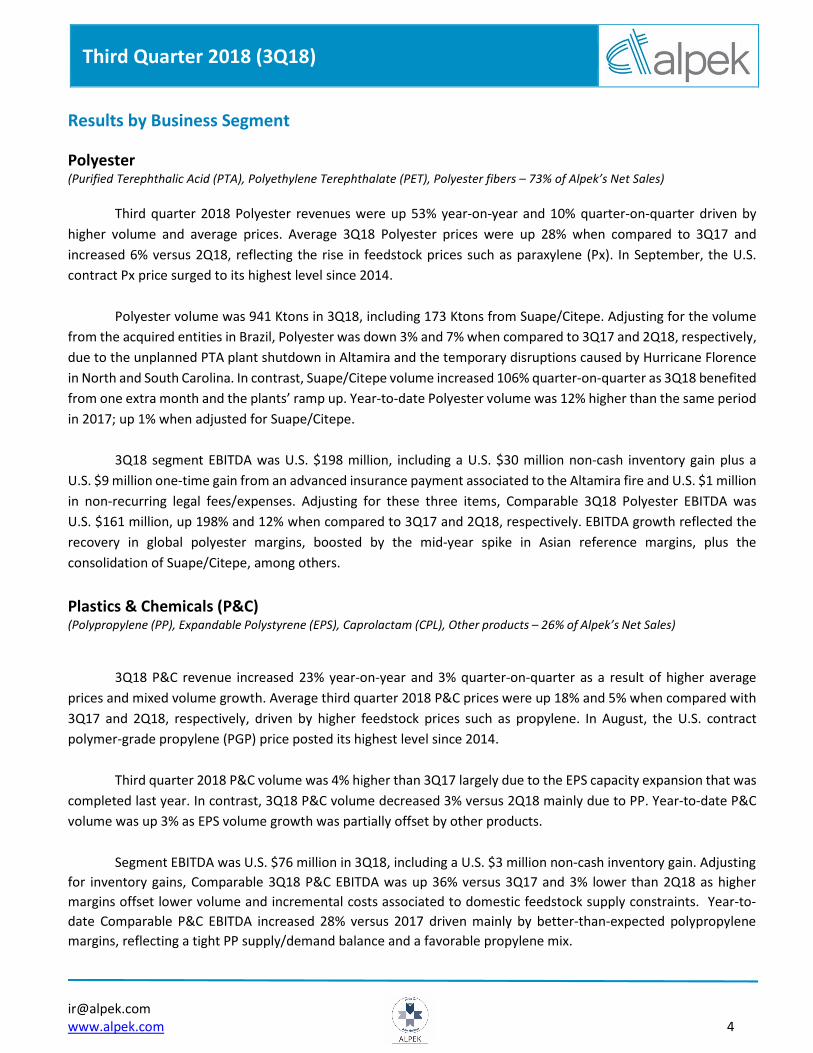
Third quarter 2018 Polyester revenues were up 53% year-on-year and 10% quarter-on-quarter driven by
higher volume and average prices. Average 3Q18 Polyester prices were up 28% when compared to 3Q17 and
increased 6% versus 2Q18, reflecting the rise in feedstock prices such as paraxylene (Px). In September, the U.S.
contract Px price surged to its highest level since 2014.
Polyester volume was 941 Ktons in 3Q18, including 173 Ktons from Suape/Citepe. Adjusting for the volume
from the acquired entities in Brazil, Polyester was down 3% and 7% when compared to 3Q17 and 2Q18, respectively,
due to the unplanned PTA plant shutdown in Altamira and the temporary disruptions caused by Hurricane Florence
in North and South Carolina. In contrast, Suape/Citepe volume increased 106% quarter-on-quarter as 3Q18 benefited
from one extra month and the plants’ ramp up. Year-to-date Polyester volume was 12% higher than the same period
in 2017; up 1% when adjusted for Suape/Citepe.
3Q18 segment EBITDA was U.S. $198 million, including a U.S. $30 million non-cash inventory gain plus a
U.S. $9 million one-time gain from an advanced insurance payment associated to the Altamira fire and U.S. $1 million
in non-recurring legal fees/expenses. Adjusting for these three items, Comparable 3Q18 Polyester EBITDA was
U.S. $161 million, up 198% and 12% when compared to 3Q17 and 2Q18, respectively. EBITDA growth reflected the
recovery in global polyester margins, boosted by the mid-year spike in Asian reference margins, plus the
consolidation of Suape/Citepe, among others.
Plastics & Chemicals (P&C) (Polypropylene (PP), Expandable Polystyrene (EPS), Caprolactam (CPL), Other products – 26% of Alpek’s Net Sales)
3Q18 P&C revenue increased 23% year-on-year and 3% quarter-on-quarter as a result of higher average
prices and mixed volume growth. Average third quarter 2018 P&C prices were up 18% and 5% when compared with
3Q17 and 2Q18, respectively, driven by higher feedstock prices such as propylene. In August, the U.S. contract
polymer-grade propylene (PGP) price posted its highest level since 2014.
Third quarter 2018 P&C volume was 4% higher than 3Q17 largely due to the EPS capacity expansion that was
completed last year. In contrast, 3Q18 P&C volume decreased 3% versus 2Q18 mainly due to PP. Year-to-date P&C
volume was up 3% as EPS volume growth was partially offset by other products.
Segment EBITDA was U.S. $76 million in 3Q18, including a U.S. $3 million non-cash inventory gain. Adjusting
for inventory gains, Comparable 3Q18 P&C EBITDA was up 36% versus 3Q17 and 3% lower than 2Q18 as higher
margins offset lower volume and incremental costs associated to domestic feedstock supply constraints. Year-to-
date Comparable P&C EBITDA increased 28% versus 2017 driven mainly by better-than-expected polypropylene
margins, reflecting a tight PP supply/demand balance and a favorable propylene mix.

Third Quarter 2018 (3Q18) |
www.alpek.com 5
Consolidated Financial Results
Net Sales: Net Sales for the third quarter totaled U.S. $1.941 billion, including U.S. $207 million from Suape/Citepe.
Adjusting for the acquired entities in Brazil, Net Sales were up 32% year-on-year and 4% quarter-on-quarter, due to
higher average consolidated prices. Adjusted average 3Q18 consolidated prices were 34% higher than 3Q17 and
increased 11% versus 2Q18, driven mainly by feedstock price movements. Accumulated net sales as of September
30, 2018 totaled U.S. $5.232 billion, 34% higher than the same period last year; up 26% when adjusted for
Suape/Citepe.
EBITDA: 3Q18 EBITDA was U.S. $274 million, including a net gain of U.S. $40 million from the following three non-
operating items: i) a U.S. $33 million non-cash inventory gain, ii) a U.S. $9 million insurance gain and iii) U.S. $1 million
in non-recurring legal fees/expenses. Adjusting for these items, Comparable Consolidated EBITDA was U.S. $234
million, U.S. $218 million and U.S. $108 million in 3Q18, 2Q18 and 3Q17, respectively. 3Q18 Comparable Consolidated
EBITDA benefited from a strong year-over-year recovery in global polyester margins and solid sequential EBITDA
growth in Suape/Citepe, among others. Accumulated EBITDA as of September 30, 2018 was U.S. $694 million and
accumulated Comparable Consolidated EBITDA totaled U.S. $622 million, up 84% versus 2017.
Profit (Loss) Attributable to Controlling Interest: Profit Attributable to Controlling Interest for the
third quarter of 2018 was U.S. $80 million, compared to U.S. $142 million in 2Q18 and a U.S. $400 million loss in 3Q17
due to the non-recurring charges associated to the M&G bankruptcy. 3Q18 Profit Attributable to Controlling Interest
decreased versus 2Q18 as a result of higher non-cash Fx losses and taxes, resulting mainly from the appreciation of
the Mexican Peso and higher Operating Income, respectively. Accumulated Profit Attributable to Controlling Interest
as of September 30, 2018 was U.S. $304 million, up 205% when compared to the same period in 2017.
Capital Expenditures and Acquisitions (Capex): 3Q18 Capex was U.S. $37 million, compared to U.S. $64
million and U.S. $ 471 million in 3Q17 and 2Q18, respectively. The largest organic investment year-to-date is the 350
MW Altamira cogeneration power plant’s construction which reached 98% completion in 3Q18. Accumulated Capex
as of September 30, 2018 totaled U.S. $564 million, which includes the Suape/Citepe acquisition for a total amount
of U.S. $435 million and the initial contributions to CC Polymers JV for the acquisition of the Corpus Christi project.
Net Debt: Consolidated Net Debt as of September 30, 2018 was U.S. $1.603 billion, up 34% year-on-year and down
2% quarter-on-quarter. On an absolute basis, Net Debt increased U.S. $341 million year-to-date as the U.S. $435
million investment in the Suape/Citepe acquisition was partially offset by better-than-expected EBITDA. As of
September 30, 2018, Gross Debt was U.S. $1.832 billion and Cash totaled U.S. $229 million. Financial ratios at the
close of 3Q18 were: Net Debt to EBITDA of 1.9 times and Interest Coverage of 7.8 times. This quarter marks 12
months since the recognition of provisions and impairments related to the Mossi & Ghisolfi (M&G) bankruptcy, which
is relevant for certain financial metrics that are based on trailing 12-month EBITDA.

Third Quarter 2018 (3Q18) |
www.alpek.com 6
Appendix A - Tables
TABLE 1 | VOLUME (KTONS)
(%) 3Q18 vs.
3Q18 2Q18 3Q17 2Q18 3Q17 YTD18 YTD17 Ch.%
Total Volume 1,174 1,151 1,012 2 16 3,341 3,036 10
Polyester 941 912 788 3 19 2,639 2,353 12
Plastics and Chemicals 233 239 225 (3) 4 701 683 3
TABLE 2 | PRICE CHANGES (%)
(%) 3Q18 vs. YTD18 vs.
2Q18 3Q17 YTD17
Polyester
Avg. Ps. Prices 4 37 25
Avg. U.S. $ Prices 6 28 24
Plastics and Chemicals
Avg. Ps. Prices 3 26 15
Avg. U.S. $ Prices 5 18 14
Total
Avg. Ps. Prices 6 36 22
Avg. U.S. $ Prices 8 28 22
TABLE 3 | INCOME STATEMENT (U.S. $ Millions)
(%) 3Q18 vs.
3Q18 2Q18 3Q17 2Q18 3Q17 YTD18 YTD17 Ch.%
Total Revenues 1,941 1,759 1,312 10 48 5,232 3,910 34
Gross Profit 288 266 126 8 129 756 382 98
Operating expenses and others (56) (64) (596) 12 91 (179) (680) 74
Operating income 232 202 (470) 15 149 578 (298) 294
Financial cost, net (81) (10) (130) (694) 37 (96) (119) 19
Share of losses of associates - - - - - - - -
Income Tax (50) (33) 206 (51) (124) (119) 168 (171)
Consolidated net income 101 159 (394) (36) 126 362 (251) 245
Controlling Interest 80 142 (400) (44) 120 304 (289) 205
Third Quarter 2018 (3Q18) |
www.alpek.com 7
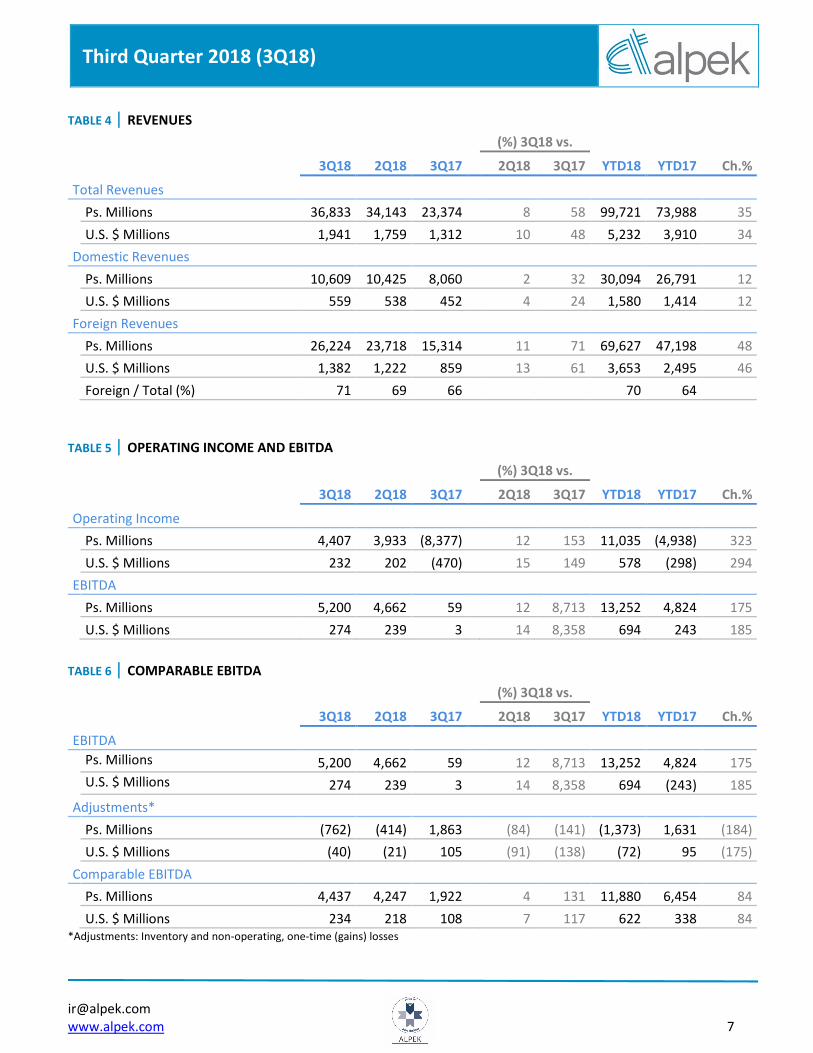
TABLE 4 | REVENUES
(%) 3Q18 vs.
3Q18 2Q18 3Q17 2Q18 3Q17 YTD18 YTD17 Ch.%
Total Revenues
Ps. Millions 36,833 34,143 23,374 8 58 99,721 73,988 35
U.S. $ Millions 1,941 1,759 1,312 10 48 5,232 3,910 34
Domestic Revenues
Ps. Millions 10,609 10,425 8,060 2 32 30,094 26,791 12
U.S. $ Millions 559 538 452 4 24 1,580 1,414 12
Foreign Revenues
Ps. Millions 26,224 23,718 15,314 11 71 69,627 47,198 48
U.S. $ Millions 1,382 1,222 859 13 61 3,653 2,495 46
Foreign / Total (%) 71 69 66 70 64
TABLE 5 | OPERATING INCOME AND EBITDA
(%) 3Q18 vs.
3Q18 2Q18 3Q17 2Q18 3Q17 YTD18 YTD17 Ch.%
Operating Income
Ps. Millions 4,407 3,933 (8,377) 12 153 11,035 (4,938) 323
U.S. $ Millions 232 202 (470) 15 149 578 (298) 294
EBITDA
Ps. Millions 5,200 4,662 59 12 8,713 13,252 4,824 175
U.S. $ Millions 274 239 3 14 8,358 694 243 185
TABLE 6 | COMPARABLE EBITDA
(%) 3Q18 vs.
3Q18 2Q18 3Q17 2Q18 3Q17 YTD18 YTD17 Ch.%
EBITDA
Ps. Millions 5,200 4,662 59 12 8,713 13,252 4,824 175
U.S. $ Millions 274 239 3 14 8,358 694 (243) 185
Adjustments*
Ps. Millions (762) (414) 1,863 (84) (141) (1,373) 1,631 (184)
U.S. $ Millions (40) (21) 105 (91) (138) (72) 95 (175)
Comparable EBITDA
Ps. Millions 4,437 4,247 1,922 4 131 11,880 6,454 84
U.S. $ Millions 234 218 108 7 117 622 338 84 *Adjustments: Inventory and non-operating, one-time (gains) losses

Third Quarter 2018 (3Q18) |
www.alpek.com 8
TABLE 7 | FINANCIAL COST, NET (U.S. $ Millions)
(%) 3Q18 vs.
3Q18 2Q18 3Q17 2Q18 3Q17 YTD18 YTD17 Ch.%
Financial Expenses (33) (28) (19) (15) (76) (84) (55) (54)
Financial Income 5 4 2 18 199 15 8 78
Net Financial Expenses (28) (24) (17) (15) (64) (70) (46) (50)
Financial Assets Impairment - - (95) - 100 - (95) 100
Fx Gains (Losses) (53) 14 (18) (480) (201) (27) 22 (220)
Financial Cost, Net (81) (10) (130) (694) 37 (96) (119) 19
TABLE 8 | NET INCOME (U.S. $ Millions)
(%) 3Q18 vs.
3Q18 2Q18 3Q17 2Q18 3Q17 YTD18 YTD17 Ch.%
Consolidated Net Income 101 159 (394) (36) 126 362 (251) 245
Non-Controlling Interest 21 17 6 25 235 58 38 51
Controlling Interest 80 142 (400) (44) 120 304 (289) 205
Earnings per Share (U.S. Dollars) 0.04 0.07 (0.19) (44) 120 0.14 (0.14) 205
Avg. Outstanding Shares (Millions)* 2,117 2,117 2,117 2,117 2,117 * The same number of equivalent shares are considered in the periods presented
TABLE 9 | CASH FLOW (U.S. $ Millions)
(%) 3Q18 vs.
3Q18 2Q18 3Q17 2Q18 3Q17 YTD18 YTD17 Ch.%
EBITDA 274 239 3 14 8,358 694 243 185
Net Working Capital & Others (125) (66) 29 (91) (530) (275) 121 (328)
Capital Expenditures & Acq. (37) (471) (64) 92 43 (564) (206) (174)
Financial Expenses (30) (26) (17) (14) (72) (79) (50) (57)
Income tax (34) (33) (19) (4) (85) (75) (78) 4
Dividends - (28) (71) 100 100 (28) (168) 83
Payment affiliated companies - 10 - (100) - 10 1 1,308
Other Sources / Uses (14) 8 5 (280) (392) (24) (13) (87)
Decrease (Increase) in Net Debt 34 (367) (135) 109 125 (341) (151) (126)

Third Quarter 2018 (3Q18) |
www.alpek.com 9
TABLE 10 | STATEMENT OF FINANCIAL POSITION & FINANCIAL RATIOS (U.S. $ Millions)
(%) 3Q18 vs.
3Q18 2Q18 3Q17 2Q18 3Q17
Assets
Cash and cash equivalents 229 223 447 3 (49)
Trade accounts receivable 942 773 507 22 86
Inventories 1,042 1,036 726 1 44
Other current assets 271 279 296 (3) (8)
Total current assets 2,483 2,311 1,975 7 26
Investment in associates and others 97 80 33 21 198
Property, plant and equipment, net 2,453 2,480 2,117 (1) 16
Goodwill and intangible assets, net 208 198 211 5 (1)
Other non-current assets 488 454 227 8 115
Total assets 5,730 5,522 4,563 4 26
Liabilities & stockholders' equity
Debt 280 305 380 (8) (26)
Suppliers 1,094 1,038 741 5 48
Other current liabilities 285 250 186 14 53
Total current liabilities 1,659 1,593 1,307 4 27
Debt (include debt issuance cost) 1,547 1,550 1,254 - 23
Employees´ benefits 54 54 61 - (12)
Other long term liabilities 631 635 312 (1) 102
Total liabilities 3,891 3,832 2,935 2 33
Total stockholders' equity 1,839 1,691 1,628 9 13
Total liabilities & stockholders' equity 5,730 5,522 4,563 4 26
Net Debt 1,603 1,637 1,192 (2) 34
Net Debt/EBITDA* 1.9 2.9 3.2
Interest Coverage* 7.8 5.9 5.4 * Times: last 12 months
Third Quarter 2018 (3Q18) |
www.alpek.com 10
Polyester
TABLE 11 | REVENUES
(%) 3Q18 vs.
3Q18 2Q18 3Q17 2Q18 3Q17 YTD18 YTD17 Ch.%
Total Revenues
Ps. Millions 27,510 25,615 16,836 7 63 73,936 52,808 40
U.S. $ Millions 1,450 1,320 945 10 53 3,879 2,791 39
Domestic Revenues
Ps. Millions 5,275 5,039 4,108 5 28 14,536 13,766 6
U.S. $ Millions 278 260 230 7 21 763 726 5
Foreign Revenues
Ps. Millions 22,235 20,576 12,727 8 75 59,399 39,042 52
U.S. $ Millions 1,172 1,060 714 11 64 3,115 2,065 51
Foreign / Total (%) 81 80 76 80 74
TABLE 12 | OPERATING INCOME AND EBITDA
(%) 3Q18 vs.
3Q18 2Q18 3Q17 2Q18 3Q17 YTD18 YTD17 Ch.%
Operating Income
Ps. Millions 3,117 2,566 (9,208) 21 134 7,222 (7,837) 192
U.S. $ Millions 164 132 (517) 25 132 378 (450) 184
EBITDA
Ps. Millions 3,768 3,159 (899) 19 519 9,018 1,503 500
U.S. $ Millions 198 162 (51) 22 493 472 70 577
TABLE 13 | COMPARABLE EBITDA
(%) 3Q18 vs.
3Q18 2Q18 3Q17 2Q18 3Q17 YTD18 YTD17 Ch.%
EBITDA
Ps. Millions 3,768 3,159 (899) 19 519 9,018 1,503 500
U.S. $ Millions 198 162 (51) 22 493 472 70 577
Adjustments*
Ps. Millions (706) (350) 1,864 (102) (138) (1,241) 1,703 (173)
U.S. $ Millions (37) (18) 105 (106) (136) (65) 98 (166)
Comparable EBITDA
Ps. Millions 3,062 2,809 965 9 217 7,776 3,207 143
U.S. $ Millions 161 144 54 12 198 407 168 142 *Adjustments: Inventory and non-operating, one-time (gains) losses

Third Quarter 2018 (3Q18) |
www.alpek.com 11
Plastics & Chemicals
TABLE 14 | REVENUES
(%) 3Q18 vs.
3Q18 2Q18 3Q17 2Q18 3Q17 YTD18 YTD17 Ch.%
Total Revenues
Ps. Millions 8,559 8,522 6,538 - 31 25,015 21,180 18
U.S. $ Millions 451 439 367 3 23 1,313 1,119 17
Domestic Revenues
Ps. Millions 5,253 5,385 3,952 (2) 33 15,476 13,024 19
U.S. $ Millions 277 278 222 - 25 812 688 18
Foreign Revenues
Ps. Millions 3,307 3,136 2,587 5 28 9,540 8,156 17
U.S. $ Millions 174 162 145 8 20 501 430 16
Foreign / Total (%) 39 37 40 38 38
TABLE 15 | OPERATING INCOME AND EBITDA
(%) 3Q18 vs.
3Q18 2Q18 3Q17 2Q18 3Q17 YTD18 YTD17 Ch.%
Operating Income
Ps. Millions 1,306 1,390 832 (6) 57 3,854 2,894 33
U.S. $ Millions 69 71 47 (4) 47 202 151 34
EBITDA
Ps. Millions 1,448 1,526 959 (5) 51 4,275 3,316 29
U.S. $ Millions 76 78 54 (3) 42 224 173 29
TABLE 16 | COMPARABLE EBITDA
(%) 3Q18 vs.
3Q18 2Q18 3Q17 2Q18 3Q17 YTD18 YTD17 Ch.%
EBITDA
Ps. Millions 1,448 1,526 959 (5) 51 4,275 3,316 29
U.S. $ Millions 76 78 54 (3) 42 224 173 29
Adjustments*
Ps. Millions (57) (64) (2) 12 (3,433) (131) (72) (81)
U.S. $ Millions (3) (3) - 2 (100) (6) (3) (107)
Comparable EBITDA
Ps. Millions 1,391 1,462 958 (5) 45 4,144 3,244 28
U.S. $ Millions 73 75 54 (3) 36 218 170 28 *Adjustments: Inventory and non-operating, one-time (gains) losses

Third Quarter 2018 (3Q18) |
www.alpek.com 12
Appendix B – Financial Statements
Sep 18 Jun 18 Sep 17 Jun 18 Sep 17
ASSETS
CURRENT ASSETS:
Cash and cash equivalents 4,299 4,426 7,427 (3) (42)
Restricted cash 3 3 704 - (100)
Trade accounts receivable 17,713 15,358 9,222 15 92
Other accounts and notes receivable 3,232 4,133 3,938 (22) (18)
Inventories 19,602 20,570 13,204 (5) 48
Other current assets 1,860 1,407 1,441 32 29
Total current assets 46,709 45,897 35,936 2 30
Investment in associates and others 1,828 1,593 594 15 208
Property, plant and equipment, net 46,150 49,254 38,518 (6) 20
Goodwill and intangible assets,net 3,922 3,933 3,845 (0) 2
Other non-current assets 9,183 9,013 4,138 2 122
Total assets 107,792 109,690 83,031 (2) 30
LIABILITIES AND STOCKHOLDER'S EQUITY
CURRENT LIABILITIES:
Debt 5,263 6,058 6,910 (13) (24)
Suppliers 20,574 20,624 13,493 (0) 52
Other current liabilities 5,366 4,960 3,385 8 59
Total current liabilities 31,203 31,642 23,788 (1) 31
NON-CURRENT LIABILITIES:
Debt (include debt issuance cost) 29,106 30,788 22,818 (5) 28
Deferred income taxes 4,382 4,639 4,136 (6) 6
Other non-current liabilities 7,486 7,969 1,549 (6) 383
Employees´ benefits 1,012 1,069 1,118 (5) (9)
Total liabilities 73,189 76,107 53,409 (4) 37
STOCKHOLDERS´ EQUITY:
Controlling interest:
Capital stock 6,052 6,052 6,048 - -
Share premium 9,071 9,071 9,071 - -
Contributed capital 15,123 15,123 15,119 - -
Earned surplus 14,391 13,508 10,153 7 42
Total controlling interest 29,514 28,631 25,272 3 17
Non-controlling interest 5,089 4,952 4,350 3 17
Total stockholders´equity 34,603 33,583 29,622 3 17
Total liabilities and stockholders´ equity 107,792 109,690 83,031 (2) 30
ALPEK, S.A.B. DE C.V. and Subsidiaries
(%) Sep 18 vs.
STATEMENT OF FINANCIAL POSITION
Information in Millions of Mexican Pesos
Third Quarter 2018 (3Q18) |
www.alpek.com 13
ALPEK, S.A.B. DE C.V. and Subsidiaries
Information in Millions of Mexican Pesos
YTD18 vs. (%)
3Q18 2Q18 3Q17 2Q18 3Q17 YTD18 YTD17 YTD17
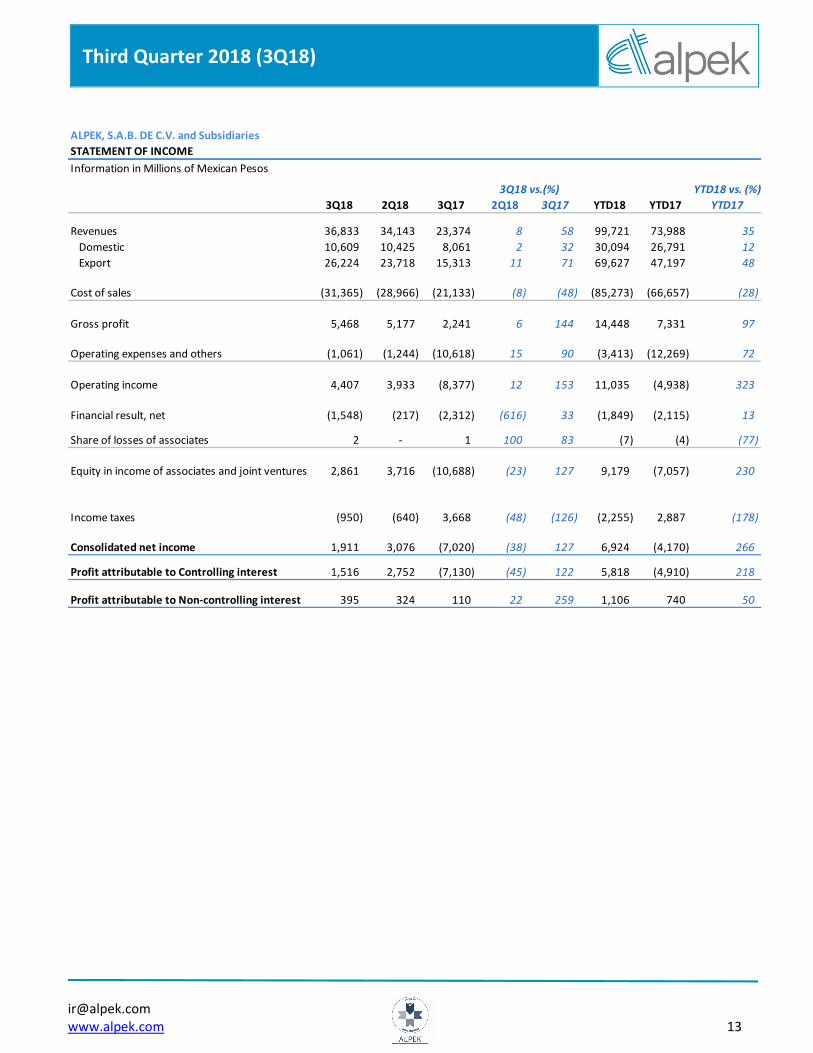
Revenues 36,833 34,143 23,374 8 58 99,721 73,988 35
Domestic 10,609 10,425 8,061 2 32 30,094 26,791 12
Export 26,224 23,718 15,313 11 71 69,627 47,197 48
Cost of sales (31,365) (28,966) (21,133) (8) (48) (85,273) (66,657) (28)
Gross profit 5,468 5,177 2,241 6 144 14,448 7,331 97
Operating expenses and others (1,061) (1,244) (10,618) 15 90 (3,413) (12,269) 72
Operating income 4,407 3,933 (8,377) 12 153 11,035 (4,938) 323
Financial result, net (1,548) (217) (2,312) (616) 33 (1,849) (2,115) 13
Share of losses of associates 2 - 1 100 83 (7) (4) (77)
Equity in income of associates and joint ventures 2,861 3,716 (10,688) (23) 127 9,179 (7,057) 230
Income taxes (950) (640) 3,668 (48) (126) (2,255) 2,887 (178)
Consolidated net income 1,911 3,076 (7,020) (38) 127 6,924 (4,170) 266
Profit attributable to Controlling interest 1,516 2,752 (7,130) (45) 122 5,818 (4,910) 218
Profit attributable to Non-controlling interest 395 324 110 22 259 1,106 740 50
STATEMENT OF INCOME
3Q18 vs.(%)

October 15, 2018 1
}
Nemak reports 3Q18 results
- Quarterly revenues and EBITDA both grew 5% y-o-y to US$1.2 billion and US$160 million, respectively.
Monterrey, Mexico. October 15, 2018. - Nemak, S.A.B. de C.V. (“Nemak”) (BMV: NEMAK), a leading provider of innovative lightweighting solutions for the global automotive industry, announced today its operational and financial results for the third quarter of 2018 ("3Q18"). What follows is an overview of the quarter’s highlights: Key Figures
Nemak sold 12.3 million equivalent units ("MEU") during 3Q18, up 5.1% year-on-year ("y-o-y"). The North America ("NA") and Rest of World ("RoW") regions reported growth, while Europe ("EU") showed a reduction. Revenues in the period amounted to US$1,152 million, up 4.8% y-o-y, thanks mainly to higher volumes.
3Q18 EBITDA was US$160 million, up 4.6% y-o-y mainly due to higher revenues and operating efficiencies, which more than compensated for incremental expenses associated with staffing for the structural and electric vehicle components business, plus higher energy costs in Mexico.
Capital expenditures amounted to US$72 million during 3Q18. As in past quarters, Nemak continued investing to meet demand from customers for its powertrain and structural and electric vehicle components. At the end of the quarter, Nemak´s financial ratios were as follows: Net Debt to EBITDA, 1.8 times; Interest Coverage, 8.4 times.
October 15, 2018 2
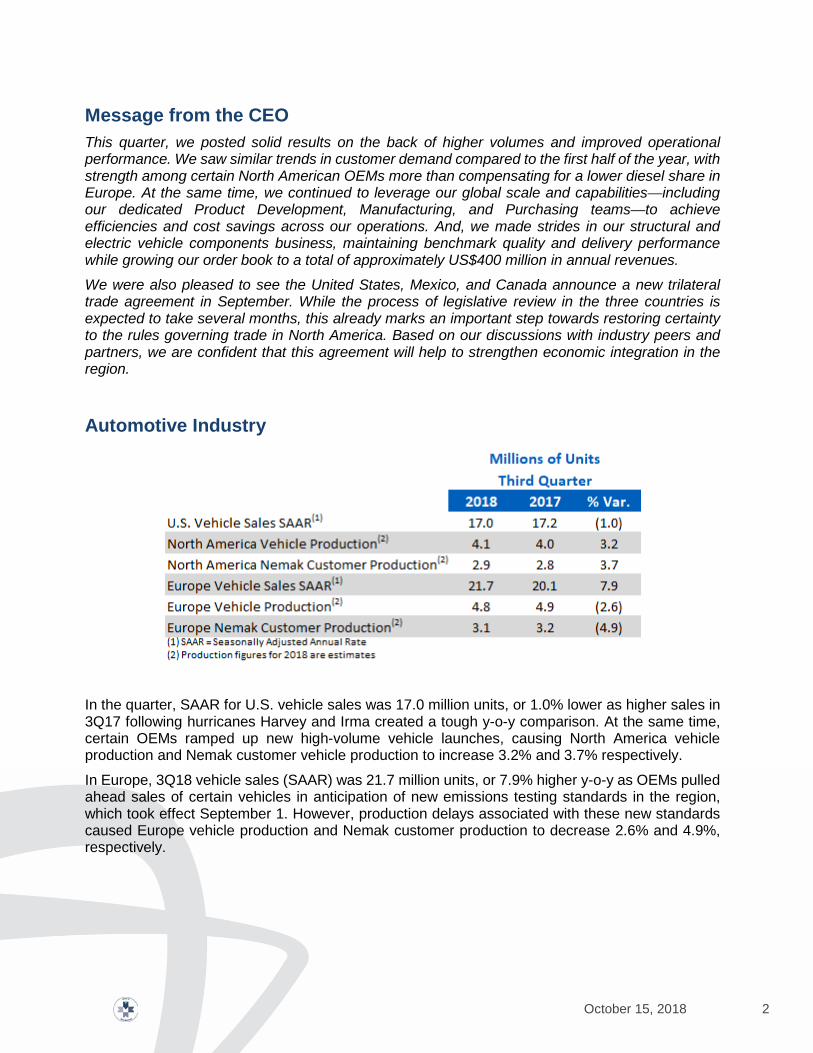
Message from the CEO This quarter, we posted solid results on the back of higher volumes and improved operational performance. We saw similar trends in customer demand compared to the first half of the year, with strength among certain North American OEMs more than compensating for a lower diesel share in Europe. At the same time, we continued to leverage our global scale and capabilities—including our dedicated Product Development, Manufacturing, and Purchasing teams—to achieve efficiencies and cost savings across our operations. And, we made strides in our structural and electric vehicle components business, maintaining benchmark quality and delivery performance while growing our order book to a total of approximately US$400 million in annual revenues. We were also pleased to see the United States, Mexico, and Canada announce a new trilateral trade agreement in September. While the process of legislative review in the three countries is expected to take several months, this already marks an important step towards restoring certainty to the rules governing trade in North America. Based on our discussions with industry peers and partners, we are confident that this agreement will help to strengthen economic integration in the region.
Automotive Industry
In the quarter, SAAR for U.S. vehicle sales was 17.0 million units, or 1.0% lower as higher sales in 3Q17 following hurricanes Harvey and Irma created a tough y-o-y comparison. At the same time, certain OEMs ramped up new high-volume vehicle launches, causing North America vehicle production and Nemak customer vehicle production to increase 3.2% and 3.7% respectively.
In Europe, 3Q18 vehicle sales (SAAR) was 21.7 million units, or 7.9% higher y-o-y as OEMs pulled ahead sales of certain vehicles in anticipation of new emissions testing standards in the region, which took effect September 1. However, production delays associated with these new standards caused Europe vehicle production and Nemak customer production to decrease 2.6% and 4.9%, respectively.

October 15, 2018 3
Recent Developments • Nemak achieved peak volume levels of its first program to produce structural
components in Slovakia, supplying several SUV and sports car models of customer Volkswagen Group.
• Earned a special recognition from Audi for its successful track record of providing structural components with zero defects for the customer’s Q5 SUV.
• In Turkey, started to launch new cylinder heads business which is expected to drive the site’s revenues more than 30% higher by 2020.
Financial Results Summary
What follows is an explanation of the results shown in the table above:
3Q18 total volume increased 5.1% y-o-y mainly driven by better performance among Detroit 3 customers in NA which more than offset lower EU volumes. In EU, Nemak´s 3Q18 volumes declined y-o-y as higher sales of gasoline engine applications were not enough to offset the combined effect of reductions in demand for diesel engine applications and customer production delays associated with the rollout of new regional emissions testing standards. As explained in past reports, European consumers are choosing more gasoline-powered vehicles instead of diesel and the company is gradually adapting to this new circumstance. In RoW, South America reported higher y-o-y volumes, which more than offset a decrease in Asia. On a cumulative basis, Nemak´s consolidated sales volume for the first nine months of 2018 were 1.6% higher than 2017, mainly due to the strength of the NA market.
Turning to revenues, higher volumes more than offset foreign exchange headwinds, driving a 4.8% y-o-y increase in 3Q18. For the first nine months of 2018, revenues were 7.1% higher than the same period of 2017 on account of the same factors as the y-o-y comparison.
Regarding Operating Income, a combination of higher volumes and operational efficiencies drove a 4.5% y-o-y increase. On a cumulative basis, Operating Income for the first nine months of 2018 was 3.0% higher, basically for the same reasons.
3Q18 EBITDA was 4.6% higher y-o-y mainly due to higher revenues and operational efficiencies. 3Q18 EBITDA per equivalent unit was US$13.00, slightly lower than the US$13.10 reported in

October 15, 2018 4
3Q17. On a cumulative basis, Nemak´s EBITDA for the first nine months of 2018 was 2.4% higher than 2017. Cumulative 2018 EBITDA per unit was US$14.60, slightly higher than the US$14.50 reported in the same period of 2017.
3Q18 Net Income increased US$38 million compared to 3Q17 through a combination of higher Operating Income, plus foreign exchange gains, and slightly lower deferred taxes. However, Nemak´s Net Income for the first nine months of 2018 was 9% lower than in 2017, as higher Operating Income and lower deferred taxes were not enough to offset higher financial expenses, net.
Capital expenditures amounted to US$72 million during 3Q18, for a total of US$271 million so far in 2018. As explained, investments have been made to support new program launches and to drive operational efficiency across the company’s regions.
As of September 30, 2018, Nemak reported Net Debt in the amount of US$1.3 billion. Financial ratios were: Debt, net of Cash, to EBITDA, 1.8 times; and Interest Coverage, 8.4 times. These ratios compared to 1.9 and 10.1, respectively, in 3Q17.
Regional Results North America
In 3Q18, revenues increased 10.6% y-o-y mainly due to higher volumes among Detroit 3 customers. EBITDA was 15.6% higher y-o-y as volumes and operational efficiencies more than compensated for the adverse impact of higher energy costs and expenditures on staffing for the company’s structural and electric vehicle components business.
Europe 3Q18 revenues increased 1.6% y-o-y as higher aluminum prices drove selling prices higher, outweighing lower volumes and the depreciation of the euro against the U.S. dollar. However, 3Q18 EBITDA was 5.9% lower y-o-y due to the volume and foreign exchange effects just mentioned together with increased expenses associated with staffing for the company’s structural and electric vehicle components business.
Rest of the World (RoW) In 3Q18, revenues in RoW decreased by 13.0% y-o-y due mainly to a less favorable product mix and the depreciation of the Brazilian reis against the U.S. dollar. EBITDA for the period was down US$5 million basically for the same reasons.
------------------

October 15, 2018 5
Methodology for presentation of results The report presents unaudited financial information. Figures are in Mexican pesos or US dollars, as indicated. For income statement items, peso amounts were translated into dollars using the average exchange rate of the months during which the operations were recorded. For balance sheet items, peso amounts were translated into dollars using the end-of-period exchange rate. Financial ratios were calculated in dollars. Due to rounding, small differences may occur when calculating percent changes from one period to another. Conference call information Nemak’s Third Quarter 2018 Conference Call will be held on Tuesday, October 16, 2018, 11:30 a.m. Eastern Time (10:30 a.m. Mexico City Time). To participate in the conference call, please dial: Domestic U.S.: (877) 407-0784; International: 1-201-689-8560; Mexico Toll Free: 01 800 522 0034. The conference call will be webcast live through streaming audio. If you are unable to participate, the conference call audio and script will be available on Nemak’s website. For more information, please visit investors.nemak.com Forward-looking statements
This report may contain certain forward-looking statements concerning Nemak’s future performance that should be considered as good faith estimates made by the company. These forward-looking statements reflect management’s expectations and are based upon currently available data and analysis. Actual results are subject to future events and uncertainties, which could materially impact Nemak’s actual performance and results. About Nemak Nemak is a leading provider of innovative lightweighting solutions for the global automotive industry, specializing in the development and manufacturing of aluminum components for powertrain and body structure applications. The company employs more than 22,000 people at 38 facilities worldwide. In 2017, it generated revenues of US$4.5 billion. For more information about Nemak, visit http://www.nemak.com
Three pages of tables to follow

October 15, 2018 6

October 15, 2018 7

October 15, 2018 8
Highlights:
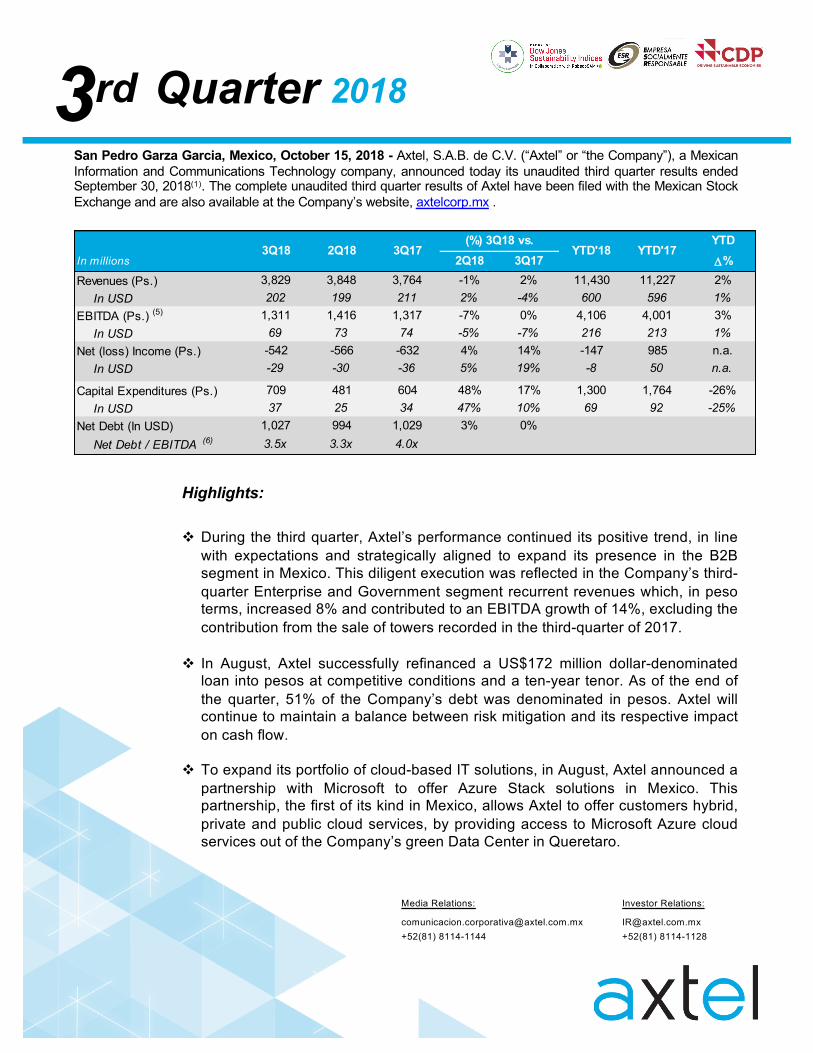
v During the third quarter, Axtel’s performance continued its positive trend, in linewith expectations and strategically aligned to expand its presence in the B2Bsegment in Mexico. This diligent execution was reflected in the Company’s third-quarter Enterprise and Government segment recurrent revenues which, in pesoterms, increased 8% and contributed to an EBITDA growth of 14%, excluding thecontribution from the sale of towers recorded in the third-quarter of 2017.
v In August, Axtel successfully refinanced a US$172 million dollar-denominatedloan into pesos at competitive conditions and a ten-year tenor. As of the end ofthe quarter, 51% of the Company’s debt was denominated in pesos. Axtel willcontinue to maintain a balance between risk mitigation and its respective impacton cash flow.
v To expand its portfolio of cloud-based IT solutions, in August, Axtel announced apartnership with Microsoft to offer Azure Stack solutions in Mexico. Thispartnership, the first of its kind in Mexico, allows Axtel to offer customers hybrid,private and public cloud services, by providing access to Microsoft Azure cloudservices out of the Company’s green Data Center in Queretaro.
Investor Relations:
[email protected]+52(81) 8114-1128
3rd 2018Quarter
Media Relations:
[email protected]+52(81) 8114-1144
San Pedro Garza Garcia, Mexico, October 15, 2018 - Axtel, S.A.B. de C.V. (“Axtel” or “the Company”), a MexicanInformation and Communications Technology company, announced today its unaudited third quarter results endedSeptember 30, 2018(1). The complete unaudited third quarter results of Axtel have been filed with the Mexican StockExchange and are also available at the Company’s website, axtelcorp.mx .
YTDIn millions 2Q18 3Q17 D%Revenues (Ps.) 3,829 3,848 3,764 -1% 2% 11,430 11,227 2%
In USD 202 199 211 2% -4% 600 596 1%EBITDA (Ps.) (5) 1,311 1,416 1,317 -7% 0% 4,106 4,001 3%
In USD 69 73 74 -5% -7% 216 213 1%Net (loss) Income (Ps.) -542 -566 -632 4% 14% -147 985 n.a.
In USD -29 -30 -36 5% 19% -8 50 n.a.
Capital Expenditures (Ps.) 709 481 604 48% 17% 1,300 1,764 -26%In USD 37 25 34 47% 10% 69 92 -25%
Net Debt (In USD) 1,027 994 1,029 3% 0%Net Debt / EBITDA (6) 3.5x 3.3x 4.0x
YTD'18 YTD'173Q18 3Q172Q18(%) 3Q18 vs.

YTDIn million USD 2Q18 3Q17 D%
TELECOM 117 113 124 3% -6% 349 348 0%Voice 25 27 32 -9% -21% 80 95 -16%Data and Internet 47 44 50 5% -6% 137 135 1%Managed Networks 45 41 42 9% 6% 132 118 12%
IT 17 16 15 6% 10% 48 41 18%TOTAL ENTERPRISE 134 129 139 3% -4% 397 389 2%
3Q18 2Q18 3Q17 (%) 3Q18 vs. YTD'18 YTD'17
YTDIn millions 2Q18 3Q17 D%
ENTERPRISE (Ps.) 2,539 2,505 2,482 1% 2% 7,555 7,333 3%In USD 134 129 139 3% -4% 397 389 2%
GOVERNMENT (Ps.) 592 641 540 -8% 10% 1,762 1,631 8%In USD 31 33 30 -6% 3% 92 87 7%
MASS MARKET (Ps.) 698 703 742 -1% -6% 2,113 2,263 -7%In USD 37 36 42 1% -12% 111 120 -7%
TOTAL (Ps.) 3,829 3,848 3,764 -1% 2% 11,430 11,227 2%In USD 202 199 211 2% -4% 600 596 1%
3Q18 2Q18 3Q17 YTD'18 YTD'17(%) 3Q18 vs.
2
Sources of Revenues
Quarterly revenues totaled $134 million, compared to $139 million in the same period in2017, a 4% decrease. In peso terms, Enterprise revenues increased 2% due to an improvementin IT and Managed Network revenues.
Telecom revenues in the third quarter 2018 decreased 6% compared to the third quarterin the previous year. In peso terms, revenues stood flat compared to the third quarter inthe previous year, mainly due to an increase of 13% in Managed Networks, thatcompensated a decrease of 16% in Voice revenues; the latter due to declines in fix-to-mobile and long distance revenues.
IT revenues increased 10% year-over-year. In peso terms, revenues increased 17%year-over-year, mainly due to a 20% increase in hosting, a 49% incline in cloud servicesand a 33% increase from security services. Managed Applications revenues declined17% year-over-year.
Enterprise
Total revenues decreased 4% in the third quarter of 2018 compared to the same period in2017. In peso terms, revenues reached Ps. 3,829 million, compared to Ps. 3,764 million in thesame period in 2017, a 2% increase, mainly due to 2% and 10% increases in the Enterprise andGovernment segments respectively, which compensated the 6% decline in the mass marketsegment.
3Q17 3Q18
FTTx proportion within the revenue mix increased from 15% to 16%; wireless declined from 5% to 2%; Enterpriseremained flat at 66% and Government increased from 14% to 15%, in peso terms.
80%
20%
Enterprise & Gov'tMass Market
82%
18%
Enterprise & Gov'tMass Market

YTDIn million USD 2Q18 3Q17 D%
TELECOM 21 22 20 -5% 4% 61 54 13%Voice 2 2 2 -4% -3% 6 7 -11%Data and Internet 6 5 6 16% -1% 14 14 -6%Managed Networks 13 15 12 -12% 7% 41 33 27%
IT 11 11 11 -7% 1% 31 33 -4%TOTAL GOVERNMENT 31 33 30 -6% 3% 92 87 7%
3Q18 2Q18 3Q17 (%) 3Q18 vs. YTD'18 YTD'17
4,634 5,067 5,519
12,980 11,588
12,517 12,870
2012 2013 2014 2015 2016 2017 2018
Alestra Enterprise Government
3
Government revenues amounted $31 million in the third quarter 2018, compared to $30million in the same period in 2017, a 3% increase. In peso terms, Government revenuesincreased 10% due to a rise in both Telecom and IT revenues. Recurrent revenues, whichrepresented 94% of total Government revenues in the quarter, increased 14% compared to thesame period in 2017.
Telecom revenues increased 4% year-over-year. In peso terms, revenues increased11%. Voice revenues increased 3% and Data and internet revenues increased 5% due toa rise of 28% in Internet services that compensated a decline in Data revenues.Managed networks increased 14% due to a positive performance in VPN solutions,Ethernet and Collaboration revenues.
IT revenues increased 1% in the third quarter of 2018. In peso terms, revenuesincreased 8% due to a strong increase inManaged Applications revenues.
Government
Enterprise and Government Segment Evolution
(Revenues in MPs.)
* Pro forma figures include Axtel and Alestra as of the beginning of each year.
(Pro forma)*(Pro forma)* LTM

YTDIn million USD 2Q18 3Q17 D%
FTTx 32 31 32 4% 1% 94 89 6%Legacy Technologies 5 6 10 -15% -52% 17 31 -45%
TOTAL MASS MARKET 37 36 42 1% -12% 111 120 -7%
3Q18 2Q18 3Q17 (%) 3Q18 vs. YTD'18 YTD'17
4
Revenues for the mass market totaled $37 million in the third quarter of 2018, compared to$42 million in the same period in 2017, a 12% decline due to a drop in the wireless segment. Inpeso terms, mass market quarterly revenues declined 6%.
FTTx revenues increased 1% year-over-year, totaling $32 million in the third quarter ofboth 2018 and 2017. While customers increased 13% year-over-year, in peso terms,FTTx revenues increased only 8% due to a decline in video penetration within thecustomer base from 48% in the third quarter 2017 to 43% this quarter, resulting in a 4%decline in Video revenues. Voice revenues decreased 4% resulting from a 3% decreasein monthly rent revenues. Internet revenues increased 27%.
Legacy wireless technologies revenues amounted to $5 million in the third quarter of2018, a 52% decline year-over-year. In peso terms, revenues decreased 49% comparedto the same period in 2017, explained by a 54% decline in customers.
Mass Market (2)

74
213
69
216
87
240
87
245
51
143
46
139
17 1718 18YTDQTR
17 1718 18YTDQTR
17 1718 18YTDQTR
5
Cost of Revenues(in Mdlls.)
Expenses(in Mdlls.)
EBITDA(in Mdlls.)
Cost of revenues, Operating and other expenses and EBITDA
Cost of revenues(3) For the three month period ended inSeptember 30, 2018, the cost of revenues represented $46 million, a 10%decrease compared to the same period in 2017. In peso terms, the cost ofrevenues decreased 4% compared to the same period of year 2017, dueto 9% and 3% declines in mass-market and enterprise and governmentcosts, respectively. Cost reductions in the mass-market segment areexplained by the lower video penetration and for the enterprise andgovernment segment, better a cost structure for Telecom servicescompensated higher IT-related costs. In addition, as part of thehomologation accounting process between Axtel and Alestra, costs thatwere previously classified as operating expenses related to billing,collection and maintenance directly associated with customers are beingrecorded as costs as of 2017. This adjustment represents an increase ofPs. 191 million in LTM3Q18 vs LTM3Q17.
Operating and other expenses(4) (excludes depreciation andamortization expense). In the third quarter of 2018, total expensesremained flat year-over-year, totaling $87 million in both periods. In pesoterms, total expenses increased 7% compared to the expenses recordedin the same period in 2017, mainly due to the positive effect of the towersale of Ps. 170 million in 3Q17. Operating expenses in the third quarterincreased only 1%, despite the effects from a 6.1% peso depreciation and5.0% inflation that affect dollar and inflation –indexed expenses. Dollar orinflation -indexed items including personnel, maintenance and tower rentexpenses, increased 4%, 13% and 11% year-over-year, respectively
EBITDA(5). For the third quarter of 2018, EBITDA totaled $69million, a 7% decrease compared to the same period in year 2017.However, 2017’s figure includes $10 million of other income related to thesale of towers to American Tower Corporation. In peso terms, EBITDAdecreased slightly year-over-year. However without the effect of the saleof towers in 2017, EBITDA increased Ps. 164 million or 14% higher thanthe third quarter 2017, and 12% from LTM3Q17 to LTM 3Q18.
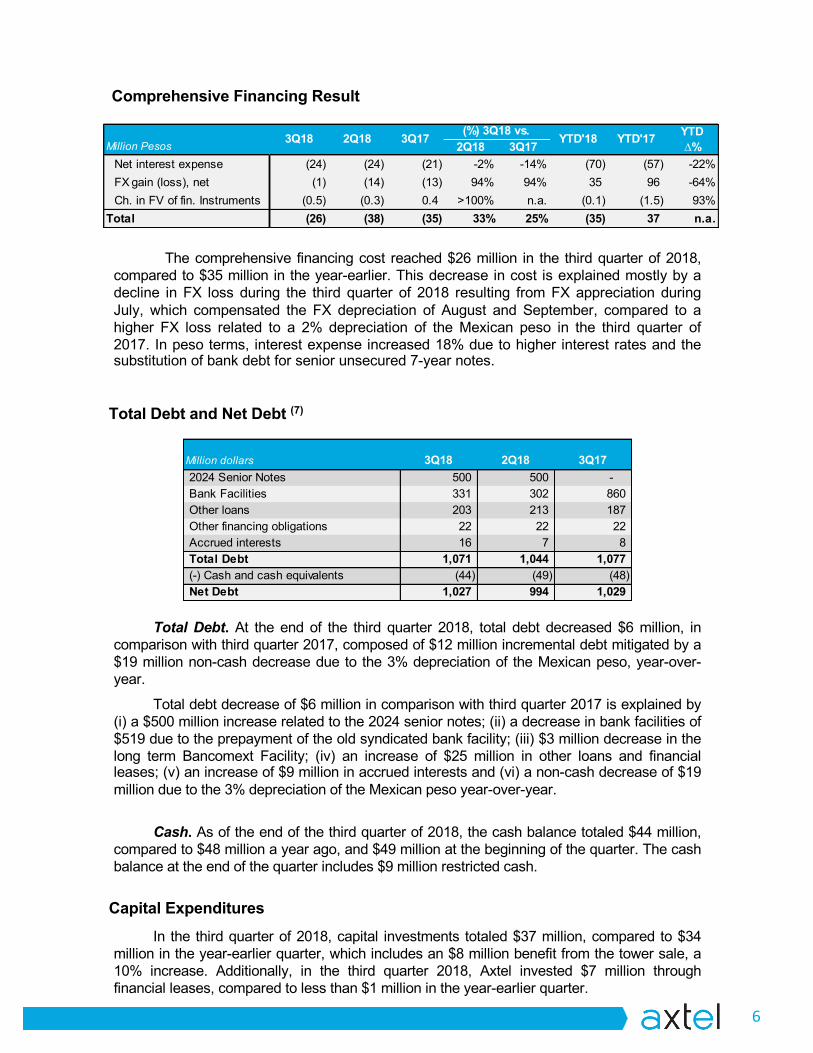
Million dollars 3Q18 2Q18 3Q172024 Senior Notes 500 500 - Bank Facilities 331 302 860 Other loans 203 213 187 Other financing obligations 22 22 22 Accrued interests 16 7 8 Total Debt 1,071 1,044 1,077 (-) Cash and cash equivalents (44) (49) (48) Net Debt 1,027 994 1,029
6
Comprehensive Financing Result
Total Debt. At the end of the third quarter 2018, total debt decreased $6 million, incomparison with third quarter 2017, composed of $12 million incremental debt mitigated by a$19 million non-cash decrease due to the 3% depreciation of the Mexican peso, year-over-year.
Total debt decrease of $6 million in comparison with third quarter 2017 is explained by(i) a $500 million increase related to the 2024 senior notes; (ii) a decrease in bank facilities of$519 due to the prepayment of the old syndicated bank facility; (iii) $3 million decrease in thelong term Bancomext Facility; (iv) an increase of $25 million in other loans and financialleases; (v) an increase of $9 million in accrued interests and (vi) a non-cash decrease of $19million due to the 3% depreciation of the Mexican peso year-over-year.
Cash. As of the end of the third quarter of 2018, the cash balance totaled $44 million,compared to $48 million a year ago, and $49 million at the beginning of the quarter. The cashbalance at the end of the quarter includes $9 million restricted cash.
Total Debt and Net Debt (7)
The comprehensive financing cost reached $26 million in the third quarter of 2018,compared to $35 million in the year-earlier. This decrease in cost is explained mostly by adecline in FX loss during the third quarter of 2018 resulting from FX appreciation duringJuly, which compensated the FX depreciation of August and September, compared to ahigher FX loss related to a 2% depreciation of the Mexican peso in the third quarter of2017. In peso terms, interest expense increased 18% due to higher interest rates and thesubstitution of bank debt for senior unsecured 7-year notes.
In the third quarter of 2018, capital investments totaled $37 million, compared to $34million in the year-earlier quarter, which includes an $8 million benefit from the tower sale, a10% increase. Additionally, in the third quarter 2018, Axtel invested $7 million throughfinancial leases, compared to less than $1 million in the year-earlier quarter.
Capital Expenditures
YTDMillion Pesos 2Q18 3Q17 ∆%
Net interest expense (24) (24) (21) -2% -14% (70) (57) -22%FX gain (loss), net (1) (14) (13) 94% 94% 35 96 -64%Ch. in FV of fin. Instruments (0.5) (0.3) 0.4 >100% n.a. (0.1) (1.5) 93%
Total (26) (38) (35) 33% 25% (35) 37 n.a.
3Q18 YTD'17YTD'18(%) 3Q18 vs.3Q172Q18

In thousands Q3 2018 Q2 2018 Q3 2017FTTX
Customers 286 277 253 RGUs 769 750 693
Lines in service 357 348 317 Broadband subscribers 289 280 255 Video subscribers 123 122 121
LEGACY TECHNOLOGIESCustomers 63 77 135 RGUs 123 150 263
Lines in service 72 87 150 Broadband subscribers 51 63 113
Appendix – Other important information
1) Financial information presented is based on International Financial Reporting Standards(IFRS) in nominal pesos for the following periods:
– Consolidated income statement information for the three month periods ending on September30, 2018 and 2017, and June 30, 2018; and year-to-date periods ending on September 30,2018 and 2017, and
– Balance sheet information as of September 30, 2018 and 2017; and June 30, 2018.
2) Mass market operating data:
3) Costs of revenues include expenses related to the termination of our customers’ cellular andlong distance calls in other carriers’ networks, as well as expenses related to billing,payment processing, operator services and our leasing of private circuit links. Costs thatwere previously classified as operating expenses related to billing, collection andmaintenance directly associated with customers are being recorded as costs as of 2017.
4) Operating and other expenses are those incurred in connection with general andadministrative matters, such as personnel, land and tower leases, sales and marketing,maintenance of our network and net other not recurrent expenses including merger andintegration expenses.
5) EBITDA is defined as operating income (loss) plus depreciation and amortization, plusimpairment of assets.
6) Net Debt to EBITDA ratio: Net debt translated into U.S. Dollars using the end-of-periodexchange rate divided by the respective LTM pro forma EBITDA translated into U.S. Dollarsusing the average exchange rate for each month.
7) Total debt includes accrued interests for each period. Net debt is calculated subtracting cashand equivalents, including non-current restricted cash, from total debt.
* Revenue Generating Units, represent individual service subscriptions (line, broadband, video) which generate recurring revenues for the Company.
7
8) To reduce exposure to exchange rate risk, Axtel hasentered into exchange rate forward transactions for anoutstanding amount as of 3Q18 of ~US$22 million at anaverage exchange rate of 19.4 MXN/USD. Additionally, toreduce exposure to interest rate risk, Axtel entered into aninterest rate swap (IRS) transaction for Ps. 3,380 million ofits bank loan, receiving TIIE and paying a fix rate of8.355%. During the quarter, one forward contract expiredand two others were “unwinded” before stated expiration,which resulted in a net benefit of Ps. 71 million on acombined basis, compared to the applicable spotMXN/USD exchange rates.
Expiration Date
Amount(Mdlls)
Avg.FX rate
Nov’18 22.1 19.39
Amount (MPs)
Axtel receives
Axtel pays
3,380 TIIE 8.355%
Forwards:
Interest Rate Swaps:

(%) Sep-18 vs.Sep-18 Jun-18 Sep-17 Sep-17
ASSETSCURRENT ASSETSCash and equivalents 651,777 811,446 721,797 (10)Restricted cash - - - n.a.Accounts receivable 3,024,035 2,953,795 3,204,734 (6)Allowance for doubtful accounts (2,183,612) (2,149,394) (1,997,914) 9Related parties 40,804 34,569 25,696 59Refundable taxes and other accounts receivable 986,250 933,152 781,338 26Advances to suppliers 652,597 652,200 547,883 19Inventories 295,583 224,054 216,397 37Financial Instruments - 633,832 - n.a.Financial Instruments (Zero Strike Call) 162,105 172,535 187,746 (14)Total current assets 5,813,149 6,415,584 5,685,590 2
NON CURRENT ASSETSRestricted cash 170,644 167,700 159,908 7Property, plant and equipment, net 18,276,700 18,596,113 19,258,561 (5)Long-term accounts receivable 8,716 17,432 - n.a.Intangible assets, net 1,413,064 1,393,135 1,531,669 (8)Deferred income taxes 3,566,299 3,815,654 3,395,906 5Investment in shares of associated co. & other 157,295 157,295 22,260 >100Other assets 400,316 375,524 222,715 80Total non current assets 23,993,033 24,522,853 24,591,019 (2)
TOTAL ASSETS 29,806,182 30,938,437 30,276,609 (2)
LIABILITIES & STOCKHOLDERS' EQUITYCURRENT LIABILITIESAccount payable & Accrued expenses 3,482,360 3,540,108 3,423,677 2Accrued Interest 294,305 145,182 139,241 >100Short-term debt - 206,702 300,000 n.a.Current portion of long-term debt 488,394 717,063 434,440 12Taxes payable 38,812 37,722 39,504 (2)Financial Instruments 25,627 54,094 - n.a.Deferred Revenue 279,386 486,647 284,416 (2)Provisions 21,440 27,825 23,906 (10)Other accounts payable 3,044,866 2,940,244 1,846,816 65Total current liabilities 7,675,191 8,155,589 6,492,001 18
LONG-TERM LIABILITIESLong-term debt 19,139,025 19,442,872 18,617,083 3Derivative Financial Instruments 41,034 - - n.a.Employee Benefits 646,049 612,392 540,628 19Deferred revenue - - - n.a.Long-term provisions - - - n.a.Other LT liabilities 3,279 2,788 986,429 (100)Total long-term debt 19,829,387 20,058,052 20,144,140 (2)
TOTAL LIABILITIES 27,504,577 28,213,641 26,636,141 3
STOCKHOLDERS EQUITYCapital stock 464,371 464,371 464,371 0Additional paid-in capital 159,551 159,551 522,907 (69)Reserve for repurchase of shares - - - n.a.Cumulative earnings (losses) 1,677,683 2,100,875 2,653,190 (37)Other - - - n.a.
TOTAL STOCKHOLDERS' EQUITY 2,301,605 2,724,796 3,640,468 (37)
TOTAL LIABILITIES AND STOCKHOLDERS' EQUITY 29,806,182 30,938,437 30,276,609 (2)
8
Axtel, S.A.B. de C.V. and SubsidiariesUnaudited Consolidated Balance Sheet(in Thousand Mexican pesos)

3Q18 2Q18 3Q17 2Q18 3Q17 YTD'18 YTD'17 D%
Total Revenues 3,828,986 3,848,377 3,764,081 (1) 2 11,430,249 11,226,695 2
Operating cost and expenses
Cost of sales and services (871,123) (953,710) (904,076) (9) (4) (2,659,845) (2,689,016) (1)
Selling, administrative and other expenses (1,646,560) (1,479,157) (1,542,619) 11 7 (4,664,712) (4,536,259) 3
Asset impairment (16,335) (37,752) (7,725) (57) >100 (62,712) (10,188) >100
Depreciation and amortization Cost (961,289) (917,202) (858,880) 5 12 (2,755,667) (2,600,374) 6
Depreciation and amortization Expenses (175,448) (162,467) (145,803) 8 20 (487,851) (423,837) 15
(3,670,755) (3,550,288) (3,459,104) 3 6 (10,630,787) (10,259,675) 4
Operating income (loss) 158,231 298,090 304,977 (47) (48) 799,462 967,020 (17)
Comprehensive financing result:
Interest expense (472,961) (471,103) (399,561) 0 18 (1,363,152) (1,114,994) 22
Interest income 9,948 9,783 17,350 2 (43) 34,413 38,359 (10)
Foreign exchange gain (loss), net (12,218) (264,497) (238,407) (95) (95) 665,972 1,865,024 (64)
Change in fair value of fin. instruments (10,003) (5,642) 6,232 77 n.a. (2,173) (28,598) (92)
Comprehensive financing result, net (485,235) (731,459) (614,386) (34) (21) (664,940) 759,790 n.a.
Equity in results of associated company 0 0 (0) 82 n.a. 0 (0) n.a.
Income (loss) before income taxes, (327,003) (433,369) (309,409) (25) 6 134,522 1,726,810 (92)
Income taxes:
Current (15,869) (38,969) 95,472 (59) n.a. (91,502) (90,332) 1
Deferred (198,631) (93,266) (418,400) >100 (53) (190,165) (651,291) (71)
Total income taxes (214,501) (132,235) (322,928) 62 (34) (281,667) (741,622) (62)
Net Income (Loss) (541,504) (565,605) (632,337) (4) (14) (147,145) 985,188 n.a.
(%) 3Q18 vs.
9
Axtel, S.A.B. de C.V. and SubsidiariesUnaudited Consolidated Income Statement(in Thousand Mexican pesos)
About AXTELAxtel is a Mexican Information and Communication Technology Company that serves the enterprise, government andresidential markets with a robust portfolio of solutions through its brand Alestra (enterprise and government services)and its brand Axtel (residential and small businesses services).
With a network infrastructure of over 40 thousand kilometers of fiber and more than 7 thousand square meters of datacenter, Axtel enables organizations to be more productive and brings people together to improve their quality of life.
As of February 15, 2016, Axtel is a subsidiary of Alfa, which owns 52.8% of its equity.
Axtel shares, represented by Ordinary Participation Certificates, or CPOs, trade on the Mexican Stock Market under thesymbol “AXTELCPO” since 2005.
Axtel’s Investor Relations Center: axtelcorp.mxEnterprise and Government services website: alestra.mxMass Market services website: axtel.mx

ALFA´S THIRD QUARTER 2018
47
Natural gas and hydrocarbons 1% ALFA´s revenues and 0% of ALFA’s EBITDA in 3Q18
Newpek is an oil & gas exploration and production company with operations in the United States and Mexico. The company owns mineral rights in several states within the US where it extracts oil, natural gas and liquids. In Mexico, its operations are concentrated in two mature oil fields under a service agreement with Petróleos Mexicanos (PEMEX) and the rights for two license agreements with CNH.
Industry comments Hydrocarbon prices exhibited an improvement during the quarter, as crude oil prices rose to levels not seen since 2014, and average natural gas prices were higher compared to 2Q18. West Texas Intermediate oil prices averaged US $69.8 per barrel, up 2.7% compared to 2Q18, while Henry Hub natural gas prices averaged US $2.92 per MMBTU, 2% higher than the previous quarter. During the third quarter, OPEC + allies were pressured by significant declines in production from Venezuela, Libya, Angola, and Canada, as well as renewed Iranian sanctions imposed by the US, which began to show declining Iranian exports. As a result OPEC and other cooperating countries agreed to periodically increase output, but a rally was nonetheless seen as spare capacity began to decrease. Even with prices on the rise, the U.S. rig count increased only 0.4% compared with 2Q18, which allowed for a small increase in production. Henry Hub prices started the quarter falling even as weekly inventory data continued to reflect a lower injection rate, as well as total inventories continued below the 5-year average level, as substantial increases in production are expected for 2H18. Prices eventually increased to pass the 3.2 US$/MMBtu mark.
Operations in the U.S. At the end of 3Q18 Newpek had 555 producing wells at the Eagle Ford Shale (“EFS”) in South Texas, down from 639 wells in production at the end of 3Q17, due to the partial acreage sale to Sundance Energy earlier in the year. Additionally, Newpek has 14 wells producing in the Wilcox formation, and 34 in the Edwards formation, both in South Texas, where Newpek has a 20% working interest. Sales volume in the U.S. averaged 4.0 MBOED during 3Q18, down 8% from 3Q17, due to fewer number of wells. Liquids and oil represented 67% of the total volume for the quarter, unchanged from a year ago.
Operations in Mexico In Mexico, production averaged 3.4 MBOED during 3Q18, the same as 3Q17. The San Andrés field represented 68% of the total production for the quarter, essentially flat year-on-year. There were 134 wells in production in Mexico at quarter’s end, a 2% increase from the 132 wells in production at the end of 3Q17.
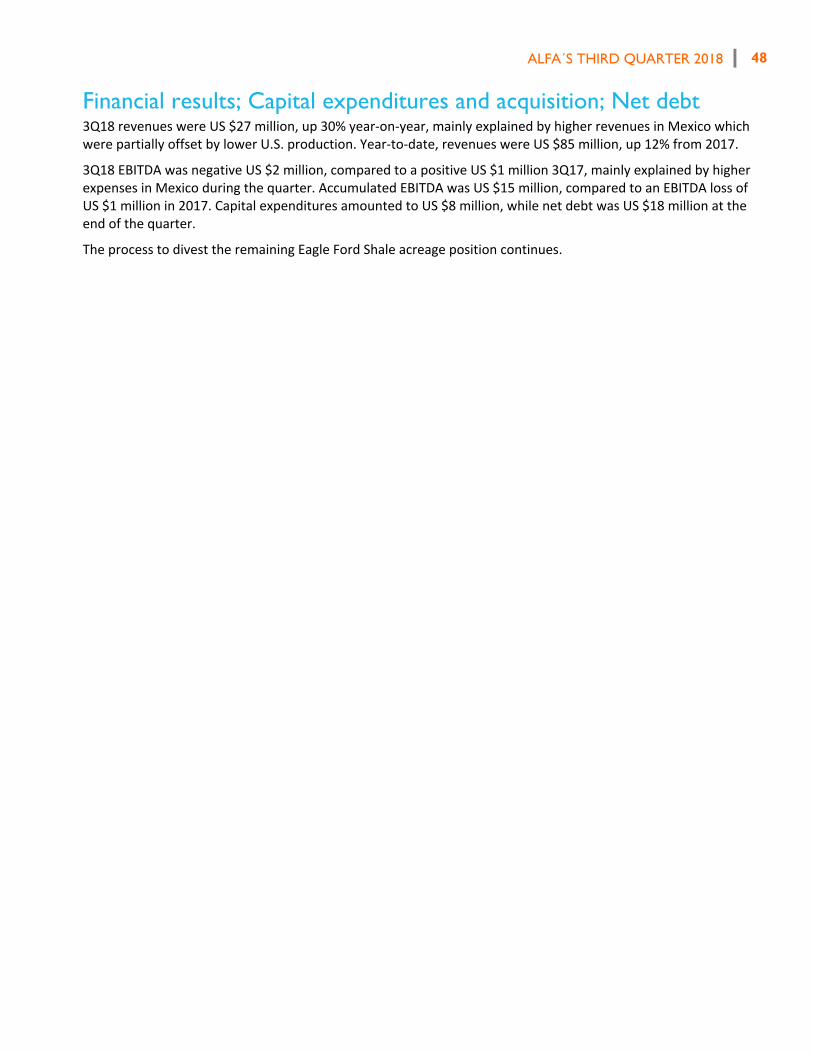
ALFA´S THIRD QUARTER 2018
48
Financial results; Capital expenditures and acquisition; Net debt 3Q18 revenues were US $27 million, up 30% year-on-year, mainly explained by higher revenues in Mexico which were partially offset by lower U.S. production. Year-to-date, revenues were US $85 million, up 12% from 2017.
3Q18 EBITDA was negative US $2 million, compared to a positive US $1 million 3Q17, mainly explained by higher expenses in Mexico during the quarter. Accumulated EBITDA was US $15 million, compared to an EBITDA loss of US $1 million in 2017. Capital expenditures amounted to US $8 million, while net debt was US $18 million at the end of the quarter.
The process to divest the remaining Eagle Ford Shale acreage position continues.

ALFA´S THIRD QUARTER 2018
49
NEWPEK Table 1 | Revenues
(%) 3Q18 vs. 3Q18 2Q18 3Q17 2Q18 3Q17 YTD. ‘18 YTD.'17 Chg.%
Total Revenues Ps. Millions 511 488 368 5 39 1,622 1,445 12 US $ Millions 27 25 21 7 30 85 76 12
Domestic Revenues Ps. Millions 293 207 141 42 107 773 713 8 US $ Millions 15 11 8 45 94 41 38 9
Foreign Revenues Ps. Millions 218 281 227 (23) (4) 849 732 16 US $ Millions 11 15 13 (21) (10) 45 39 16 Foreign / Total (%) 43 58 62 52 51
Volume Thousands of Barrels of Oil Equivalent Per Day (MBOEPD)
4.0 4.7 4.3 4.8 4.5
Liquid & others as % of total volume
64 67 67 67 67
Table 2 | Operating Income and EBITDA
(%) 3Q18 vs. 3Q18 2Q18 3Q17 2Q18 3Q17 YTD. ‘18 YTD.'17 Chg.%
Operating Income Ps. Millions (133) (77) (174) (72) 24 2 (465) 100 US $ Millions (7) (4) (10) (79) 28 0 (25) 102
EBITDA Ps. Millions (36) 20 15 (276) (338) 282 (15) - US $ Millions (2) 1 1 (271) (324) 15 (1) - Table 3 | Selected Balance Sheet Information & Financial Ratios (US $ millions) 3Q18 2Q18 3Q17 YTD.’18 YTD.’17 Assets 700 666 346 700 346 Liabilities 336 323 313 336 313 Stockholders’ Equity 364 343 33 364 33 Net Debt 18 25 30 18 30 Net Debt/EBITDA* 1.0 1.2 2.7 1.0 2.7 Interest Coverage* (4.7) (18.5) 1.8 (4.7) 1.8
* Times: LTM = Last 12 months


![Pacific Basin 3Q18 Presentation FINAL 20181127 [Read-Only] · Pacific Basin 9 3Q18 Performance and 2018 / 2019 Cover US$/day Handysize Supramax PB daily TCE net rate 3Q18 10,080 12,180](https://img.pdfslide.net/doc/110x75/604f51407d10af639f47c535/pacific-basin-3q18-presentation-final-20181127-read-only-pacific-basin-9-3q18.jpg)