Embed Size (px)
Citation preview

First Quarter 2021 Summary Investment Presentation
Jim Callahan, CFA President
Anne Heaphy Senior Vice President
June 16, 2021
D.1

Economic and Capital Markets Review
D.1

3
Continued Surge in Global Equity Markets in 1Q21
Global equity continued to surge in 1Q – Year-over-year returns from the bottom of the
pandemic market crash are eye-popping: – S&P 500: +56% – MSCI World ex-USA: +46% – Emerging Markets: +58% – U.S. Small Cap: +95% (!)
– The initial recovery was concentrated in a few stocks (FAANG) and U.S. mega cap.
– Market rotation to small cap and value with the flip from a “COVID trade” to a “GDP growth trade” in November, with the announcement of vaccines.
– As COVID-19 infections surged in the new year, re-openings were reversed in many states and localities, but only temporarily.
– Economic recovery now looking very strong in 2021, into 2022. Fed projects GDP growth of 6.5% in 2021.
– Distribution challenges have kept widespread inoculation from being achieved until mid-year in the U.S.; it could be much later in countries around the globe.
Small cap leads in both U.S. and global ex-U.S. markets
*Cambridge PE data through 09/30/20 Sources: Bloomberg, Bloomberg Barclays, Callan, Cambridge, Credit Suisse, FTSE Russell, MSCI, NCREIF, S&P Dow Jones Indices
1 Quarter 1 Year 5 Years 10 Years 25 YearsU.S. EquityRussell 3000 6.35 62.53 16.64 13.79 9.71S&P 500 6.17 56.35 16.29 13.91 9.59Russell 2000 12.70 94.85 16.35 11.68 9.36Global ex-U.S. EquityMSCI World ex USA 4.04 45.86 8.92 5.21 5.21MSCI Emerging Markets 2.29 58.39 12.07 3.65 --MSCI ACWI ex USA Small Cap 5.53 69.82 10.40 6.32 6.51Fixed IncomeBloomberg Barclays Aggregate -3.37 0.71 3.10 3.44 5.0990-day T-Bill 0.03 0.12 1.19 0.63 2.22Bloomberg Barclays Long Gov/Credit -10.41 -2.05 5.47 6.98 7.22Bloomberg Barclays Global Agg ex-US -5.29 7.15 2.13 1.26 3.80Real EstateNCREIF Property 1.15 2.04 5.69 8.76 9.04FTSE Nareit Equity 8.87 37.78 5.33 8.56 9.92AlternativesCS Hedge Fund 2.85 20.19 5.12 3.88 7.20Cambridge Private Equity* 10.38 17.87 13.87 13.82 15.05Bloomberg Commodity 6.92 35.04 2.31 -6.28 0.97Gold Spot Price -9.47 7.45 6.78 1.77 6.01Inflation - CPI-U 1.69 2.62 2.15 1.71 2.15
Returns for Periods ended 3/31/21
D.1

4
U.S. Stock Market Sector Leadership Through the Pandemic COVID trade flipped to a ‘GDP growth trade’ with the announcement of vaccines in November
Source: FactSet, Standard & Poor’s, J.P. Morgan Asset Management. Nov. 6, 2020, chosen as the last business day before vaccine candidate is revealed to have more than 90% efficacy against the COVID-19 virus in global trials. Guide to the Markets – U.S. Data are as of March 31, 2021.
Best-performing sectors employ far fewer workers than many of the underperforming sectors (health care, capital markets, banks, hospitality, transportation, energy).
D.1

5
U.S. Equity Performance: 1Q21
Russell 3000Russell 1000
Russell 1000 GrowthRussell 1000 Value
S&P 500Russell Midcap
Russell 2500Russell 2000
U.S. Equity: Quarterly Returns
6.3%5.9%
0.9%11.3%
6.2%8.1%
10.9%12.7%
U.S. Equity: One-Year Returns
Russell 3000Russell 1000
Russell 1000 GrowthRussell 1000 Value
S&P 500Russell Midcap
Russell 2500Russell 2000
62.5%60.6%62.7%
56.1%56.4%
73.6%89.4%
94.8%
Markets continue setting all-time highs – The S&P 500 Index hit record highs in 1Q21, gaining 6.2%. – Since the prior peak (February 2020) the S&P is up over 19.6%,
with only Energy (-4.7%) and Utilities (-4.9%) declining from peak-to-peak.
– Since March 2020 market low, S&P up over 80.7%, with all sectors posting gains over 40%; Energy +116.2%
– 1Q21 top sectors were Energy and Financials, while Industrials and Consumer Staples underperformed.
– “Re-opening” sectors (airlines, retail REITs, hospitality) outperformed while “work from home” sectors (online retail, home improvement) lagged.
Value and small cap trends continue through 1Q21 – Value outperformed growth across the market cap spectrum. – Small caps outperformed large in 1Q. – Small value was the top-performing asset class for the quarter
(+21.2%) and from the March 2020 low (+127.7%).
New market peaks in year of the pandemic
Sources: FTSE Russell, S&P Dow Jones Indices
Industry Sector Quarterly Performance (S&P 500)
Last Quarter
8.1%3.1% 1.1%
30.9%
16.0%
3.2% 2.0%11.4% 9.1% 9.0%
2.8%
ServicesCommunication
DiscretionaryConsumer
StaplesConsumer Energy Financials Health Care Industrials
TechnologyInformation Materials Real Estate Utilities
D.1

6
Global ex-U.S. Equity Performance: 1Q21
Nearly 100 million people fully vaccinated worldwide – Markets responded positively to the global rollout of the
COVID-19 vaccine. – Most risk assets continued to outperform as global
businesses reopen. – Small cap outperformed large over the quarter on continued
economic optimism. – Emerging markets trailed developed markets; COVID-19
outbreaks and vaccination challenges hindered EM results.
Market continues to favor cyclicals – Sustained market recovery and rising interest rates buoyed
cyclical stocks; Energy, Financials, and Industrials drove the market.
– Factor performance showed a preference for beta and volatility, similar to 4Q20.
U.S. dollar vs. other currencies – The U.S. stimulus package announcement, combined with
yields rising on economic confidence, fueled the U.S. dollar.
Growth vs. value – Value outpaced growth for the second consecutive quarter.
EAFEACWIWorld
ACWI ex USAWorld ex USA
ACWI ex USA Small CapWorld ex USA Small Cap
Europe ex UKUnited KingdomPacific ex Japan
JapanEmerging Markets
ChinaFrontier Markets
Global Equity: Quarterly Returns
3.5%4.6%
4.9%3.5%
4.0%5.5%
4.9%3.5%
6.2%4.6%
1.6%2.3%
-0.4%0.8%
EAFEACWIWorld
ACWI ex USAWorld ex USA
ACWI ex USA Small CapWorld ex USA Small Cap
Europe ex UKUnited KingdomPacific ex Japan
JapanEmerging Markets
ChinaFrontier Markets
Global Equity: One-Year Returns
44.6%54.6%54.0%
49.4%45.9%
69.8%65.2%
48.6%33.5%
54.0%39.7%
58.4%43.6%
39.3%
Source: MSCI
D.1
7
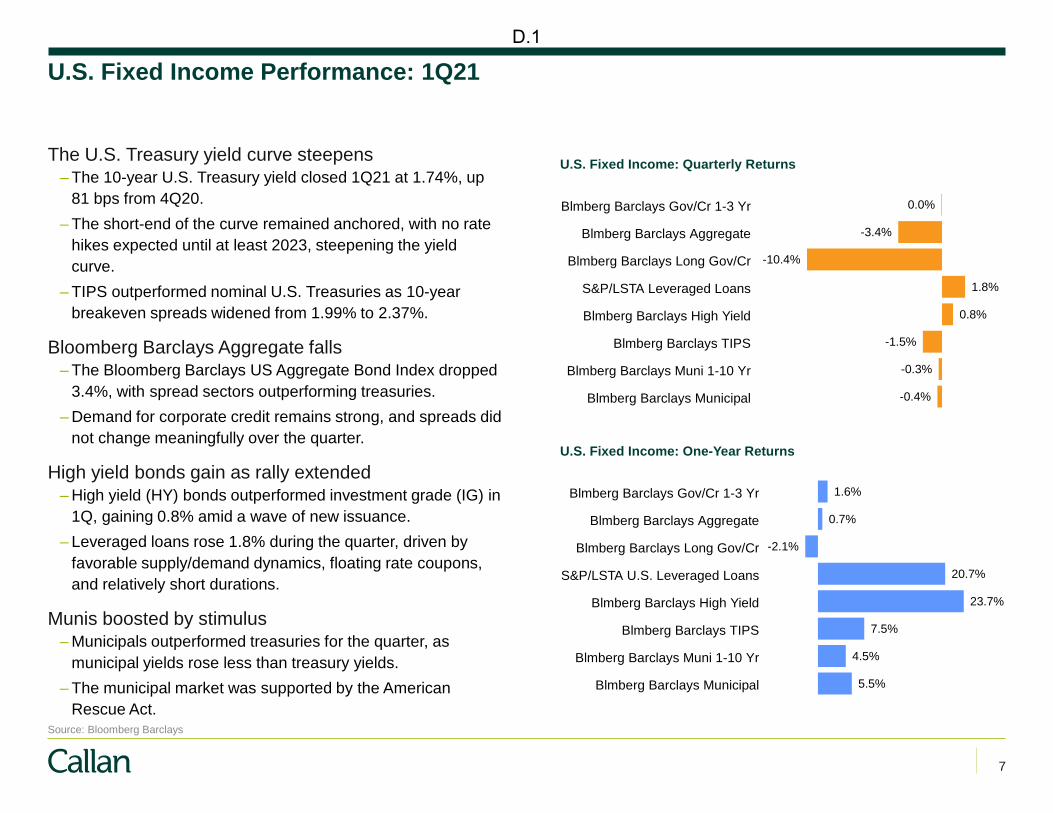
U.S. Fixed Income Performance: 1Q21
The U.S. Treasury yield curve steepens – The 10-year U.S. Treasury yield closed 1Q21 at 1.74%, up
81 bps from 4Q20. – The short-end of the curve remained anchored, with no rate
hikes expected until at least 2023, steepening the yield curve.
– TIPS outperformed nominal U.S. Treasuries as 10-year breakeven spreads widened from 1.99% to 2.37%.
Bloomberg Barclays Aggregate falls – The Bloomberg Barclays US Aggregate Bond Index dropped
3.4%, with spread sectors outperforming treasuries. – Demand for corporate credit remains strong, and spreads did
not change meaningfully over the quarter.
High yield bonds gain as rally extended – High yield (HY) bonds outperformed investment grade (IG) in
1Q, gaining 0.8% amid a wave of new issuance. – Leveraged loans rose 1.8% during the quarter, driven by
favorable supply/demand dynamics, floating rate coupons, and relatively short durations.
Munis boosted by stimulus – Municipals outperformed treasuries for the quarter, as
municipal yields rose less than treasury yields. – The municipal market was supported by the American
Rescue Act.
Blmberg Barclays Gov/Cr 1-3 Yr
Blmberg Barclays Aggregate
Blmberg Barclays Long Gov/Cr
S&P/LSTA Leveraged Loans
Blmberg Barclays High Yield
Blmberg Barclays TIPS
Blmberg Barclays Muni 1-10 Yr
Blmberg Barclays Municipal
U.S. Fixed Income: Quarterly Returns
0.0%
-3.4%
-10.4%
1.8%
0.8%
-1.5%
-0.3%
-0.4%
Blmberg Barclays Gov/Cr 1-3 Yr
Blmberg Barclays Aggregate
Blmberg Barclays Long Gov/Cr
S&P/LSTA U.S. Leveraged Loans
Blmberg Barclays High Yield
Blmberg Barclays TIPS
Blmberg Barclays Muni 1-10 Yr
Blmberg Barclays Municipal
U.S. Fixed Income: One-Year Returns
1.6%
0.7%
-2.1%
20.7%
23.7%
7.5%
4.5%
5.5%
Source: Bloomberg Barclays
D.1

8
Global Fixed Income Performance: 1Q21
Global fixed income posts negative returns – Global fixed income fell as developed market rates rose and
the U.S. dollar strengthened. – The U.S. dollar gained nearly 4% versus a basket of
currencies, 6.6% versus the yen, and nearly 4% versus the euro.
Emerging market debt sells off – Emerging market debt indices fell in 1Q21, with EM
corporates faring better than hard and local currency sovereigns amid improving corporate fundamentals.
– U.S. dollar-denominated index (EMBI Global Diversified) fell 4.5% as rising U.S. rates spilled into emerging markets; returns were largely negative across the 70+ constituents.
– Local currency index (GBI-EM Global Diversified) fared worse than hard currency, as real yields rose higher than in the U.S.
Blmberg Barclays Gl Aggregate
Blmberg Barclays Gl Agg (hdg)
Blmberg Barclays Gl Agg ex US
Blmberg Barclays Gl Agg ex US (hdg)
Blmberg Barclays Gl High Yield
JPM EMBI Global Diversified
JPM GBI-EM Global Diversified
JPM EMBI Gl Div / JPM GBI-EM Gl Div
JPM CEMBI
Global Fixed Income: Quarterly Returns
-4.5%
-2.5%
-5.3%
-1.9%
-1.0%
-4.5%
-6.7%
-5.6%
-1.1%
Blmberg Barclays Gl Aggregate
Blmberg Barclays Gl Agg (hdg)
Blmberg Barclays Gl Agg ex US
Blmberg Barclays Gl Agg ex US (hdg)
Blmberg Barclays Gl High Yield
JPM EMBI Global Diversified
JPM GBI-EM Global Diversified
JPM EMBI Gl Div / JPM GBI-EM Gl Div
JPM CEMBI
Global Fixed Income: One-Year Returns
4.7%
1.5%
7.2%
1.5%
24.7%
16.0%
13.0%
14.5%
16.4%
Sources: Bloomberg Barclays, JPMorgan Chase
D.1

9
Last
Quarter Last Year Last 3 Years
Last 5 Years
Last 10 Years
NCREIF ODCE 1.9% 1.5% 4.0% 5.3% 8.7%
Income 0.8% 3.0% 3.2% 3.3% 3.7%
Appreciation 1.1% -1.5% 0.8% 1.9% 4.8%
NCREIF Property Index 1.7% 2.6% 4.9% 5.9% 9.0%
Income 1.0% 4.1% 4.4% 4.5% 5.0%
Appreciation 0.7% -1.5% 0.5% 1.3% 3.7%
U.S. Private Real Estate Market Trends
Results – Hotel and Retail are the most challenged
sectors while Office faces uncertainty; Industrial remains the best performer.
– Income remains positive except in Hotel sector.
– Appraisers have more certainty on pandemic’s impact on valuations.
– Return dispersion by manager within the ODCE Index due to composition of underlying portfolios
Source: NCREIF
NCREIF Property Index Returns by Region and Property Type
0.3% 0.0%
0.6% 1.1%
0.8%
-0.5%
3.6%
-0.1%
-1.5%
0.7% 1.0% 1.1% 1.1% 1.0% 0.9%
-1.1%
1.1% 1.1% 1.1% 1.0%
East Midwest South West Apartment Hotel Industrial Office Retail Total
Appreciation Income
D.1

10
Private Equity Performance
– Private equity 4Q20 gains ahead of those of public equity
– Private equity performance positive for 2020, notably outperforming public equity
– Private equity ahead of public equity across all longer-term time horizons, although only marginally over the last 10 years
Gains YTD, outpacing public equity
15.5
1%
29.2
5%
18.1
8%
16.4
9%
14.0
9%
12.4
9%
11.3
2%
12.5
2%
12.1
5%
18.6
8%
14.2
6%
15.2
2%
13.8
6%
10.3
1%
9.20
%
9.10
% 14
.68%
21.2
2%
14.6
1%
15.4
6%
13.7
6%
10.4
2%
9.43
%
9.33
%
0%
10%
20%
30%
LastQuarter
1 Year 3 Years 5 Years 10 Years 15 years 20 Years 25 Years
Net IRRs as of 12/31/20
Private Equity S&P 500 PME Russell 3000 PME
Source: Refinitiv/Cambridge
D.1
11
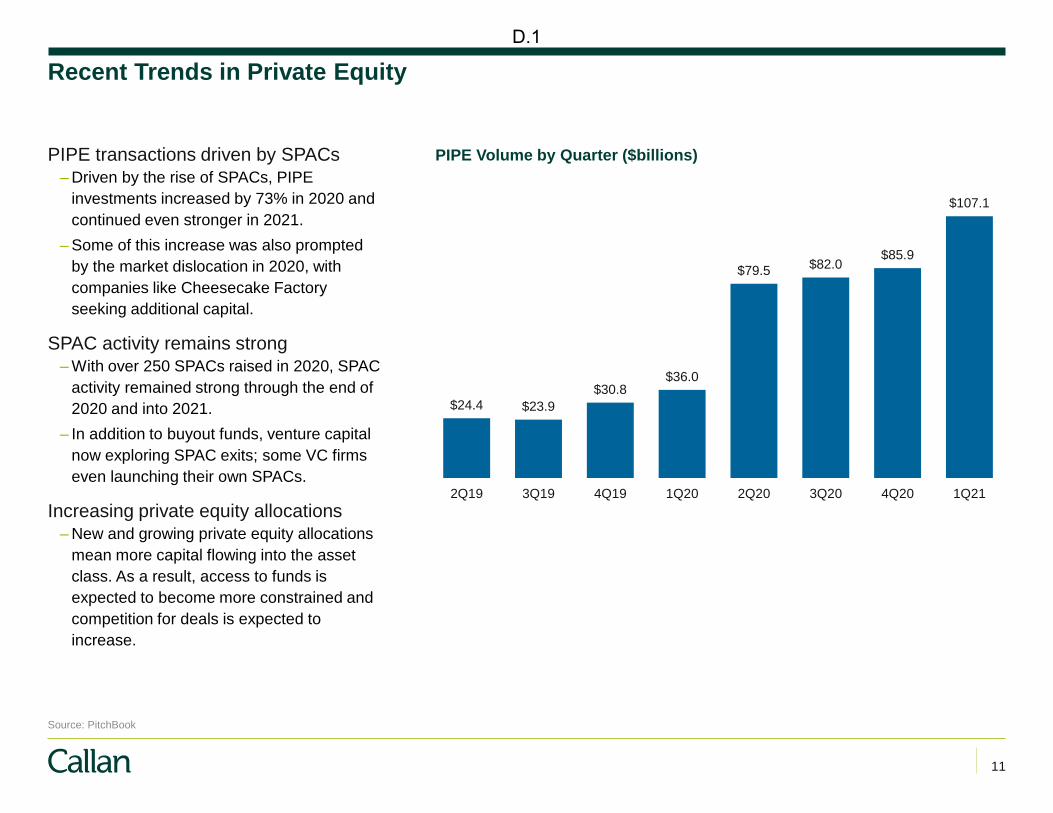
Recent Trends in Private Equity
PIPE transactions driven by SPACs – Driven by the rise of SPACs, PIPE
investments increased by 73% in 2020 and continued even stronger in 2021.
– Some of this increase was also prompted by the market dislocation in 2020, with companies like Cheesecake Factory seeking additional capital.
SPAC activity remains strong – With over 250 SPACs raised in 2020, SPAC
activity remained strong through the end of 2020 and into 2021.
– In addition to buyout funds, venture capital now exploring SPAC exits; some VC firms even launching their own SPACs.
Increasing private equity allocations – New and growing private equity allocations
mean more capital flowing into the asset class. As a result, access to funds is expected to become more constrained and competition for deals is expected to increase.
Source: PitchBook
$24.4 $23.9 $30.8
$36.0
$79.5 $82.0 $85.9
$107.1
2Q19 3Q19 4Q19 1Q20 2Q20 3Q20 4Q20 1Q21
PIPE Volume by Quarter ($billions)
D.1

12
Private Equity Global Fundraising
– Fundraising for 2020 at 84% of 2019 levels – Many fundraises pushed out to 2021 due to
worries over investor appetite and inability of funds to deploy capital during the onset of the pandemic
– Fundraising off to a strong start in 1Q21, and may reach a new high in 2021 if it continues on the same trajectory
Slowdown during pandemic
304 353 435 534 505 590 716 734 748 657 212
1,253 1,332 1,441
1,987 1,987 2,132 2,199 2,140 2,124
1,466
385
0
200
400
600
800
1,000
1,200
1,400
1,600
1,800
2,000
2,200
2,400
0
100
200
300
400
500
600
700
800
2011 2012 2013 2014 2015 2016 2017 2018 2019 2020 1Q21YTD
Annual Fundraising
Amount Raised ($bn) # of Funds
Source: PitchBook, includes private equity and private debt
D.1
13
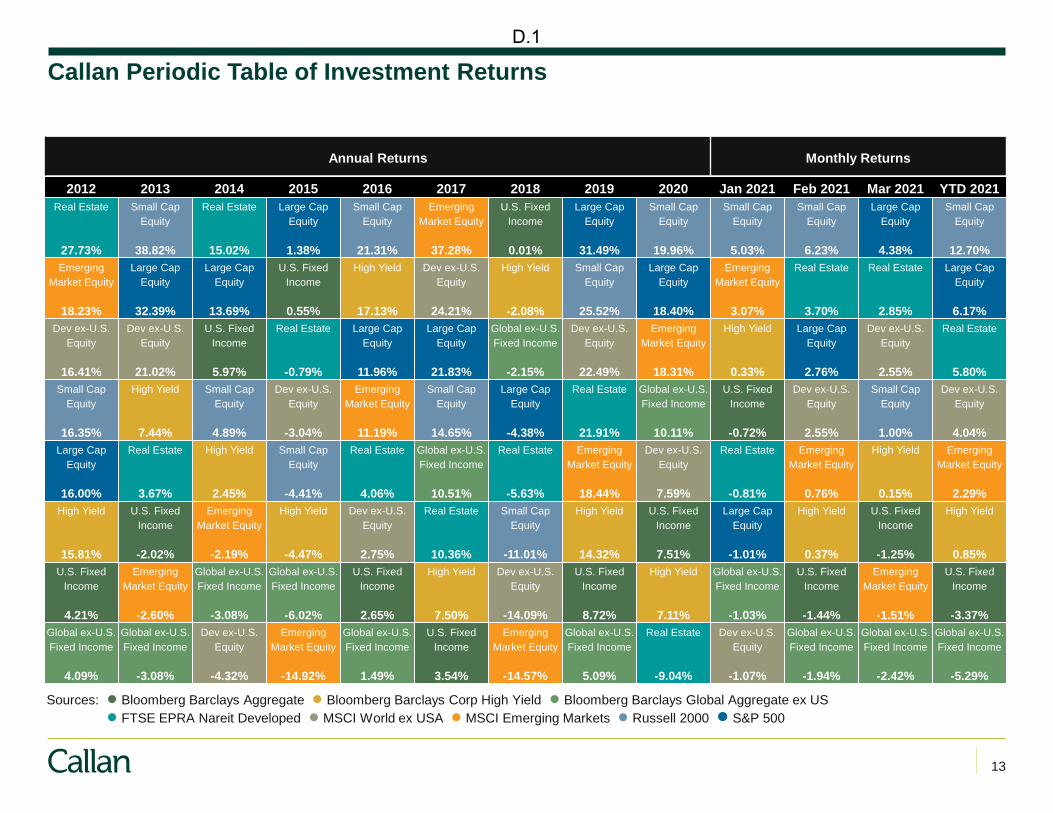
Callan Periodic Table of Investment Returns
Sources: ● Bloomberg Barclays Aggregate ● Bloomberg Barclays Corp High Yield ● Bloomberg Barclays Global Aggregate ex US ● FTSE EPRA Nareit Developed ● MSCI World ex USA ● MSCI Emerging Markets ● Russell 2000 ● S&P 500
EquityLarge Cap
16.00%
EquityLarge Cap
32.39%
EquityLarge Cap
13.69%
EquityLarge Cap
1.38%
EquityLarge Cap
11.96%
EquityLarge Cap
21.83%
EquityLarge Cap
-4.38%
EquityLarge Cap
31.49%
EquityLarge Cap
18.40%
EquityLarge Cap
-1.01%
EquityLarge Cap
2.76%
EquityLarge Cap
4.38%
EquityLarge Cap
6.17%
EquitySmall Cap
16.35%
EquitySmall Cap
38.82%
EquitySmall Cap
4.89%
EquitySmall Cap
-4.41%
EquitySmall Cap
21.31%
EquitySmall Cap
14.65%
EquitySmall Cap
-11.01%
EquitySmall Cap
25.52%
EquitySmall Cap
19.96%
EquitySmall Cap
5.03%
EquitySmall Cap
6.23%
EquitySmall Cap
1.00%
EquitySmall Cap
12.70%
EquityDev ex-U.S.
16.41%
EquityDev ex-U.S.
21.02%
EquityDev ex-U.S.
-4.32%
EquityDev ex-U.S.
-3.04%
EquityDev ex-U.S.
2.75%
EquityDev ex-U.S.
24.21%
EquityDev ex-U.S.
-14.09%
EquityDev ex-U.S.
22.49%
EquityDev ex-U.S.
7.59%
EquityDev ex-U.S.
-1.07%
EquityDev ex-U.S.
2.55%
EquityDev ex-U.S.
2.55%
EquityDev ex-U.S.
4.04%
IncomeU.S. Fixed
4.21%
IncomeU.S. Fixed
-2.02%
IncomeU.S. Fixed
5.97%
IncomeU.S. Fixed
0.55%
IncomeU.S. Fixed
2.65%
IncomeU.S. Fixed
3.54%
IncomeU.S. Fixed
0.01%
IncomeU.S. Fixed
8.72%
IncomeU.S. Fixed
7.51%
IncomeU.S. Fixed
-0.72%
IncomeU.S. Fixed
-1.44%
IncomeU.S. Fixed
-1.25%
IncomeU.S. Fixed
-3.37%
Market EquityEmerging
18.23%
Market EquityEmerging
-2.60%
Market EquityEmerging
-2.19%
Market EquityEmerging
-14.92%
Market EquityEmerging
11.19%
Market EquityEmerging
37.28%
Market EquityEmerging
-14.57%
Market EquityEmerging
18.44%
Market EquityEmerging
18.31%
Market EquityEmerging
3.07%
Market EquityEmerging
0.76%
Market EquityEmerging
-1.51%
Market EquityEmerging
2.29%High Yield
15.81%
High Yield
7.44%High Yield
2.45%High Yield
-4.47%
High Yield
17.13%
High Yield
7.50%
High Yield
-2.08%
High Yield
14.32%High Yield
7.11%
High Yield
0.33%
High Yield
0.37%
High Yield
0.15%High Yield
0.85%
Fixed IncomeGlobal ex-U.S.
4.09%
Fixed IncomeGlobal ex-U.S.
-3.08%
Fixed IncomeGlobal ex-U.S.
-3.08%
Fixed IncomeGlobal ex-U.S.
-6.02%
Fixed IncomeGlobal ex-U.S.
1.49%
Fixed IncomeGlobal ex-U.S.
10.51%
Fixed IncomeGlobal ex-U.S.
-2.15%
Fixed IncomeGlobal ex-U.S.
5.09%
Fixed IncomeGlobal ex-U.S.
10.11%
Fixed IncomeGlobal ex-U.S.
-1.03%
Fixed IncomeGlobal ex-U.S.
-1.94%
Fixed IncomeGlobal ex-U.S.
-2.42%
Fixed IncomeGlobal ex-U.S.
-5.29%
Real Estate
27.73%
Real Estate
3.67%
Real Estate
15.02%
Real Estate
-0.79%
Real Estate
4.06%Real Estate
10.36%
Real Estate
-5.63%
Real Estate
21.91%
Real Estate
-9.04%
Real Estate
-0.81%
Real Estate
3.70%
Real Estate
2.85%Real Estate
5.80%
2012 2013 2014 2015 2016 2017 2018 2019 2020 Jan 2021 Feb 2021 Mar 2021 YTD 2021
Annual Returns Monthly Returns
D.1

MCERA Total Fund Review
D.1

15
Total Fund Asset Allocation
As of March 31, 2021
Actual Asset Allocation
Domestic Equity31%
International Equity21%
Fixed Income22%
Real Assets14%
Private Equity12%
Opportunistic1%
$000s Weight Min Max Percent $000sAsset Class Actual Actual Target Target Target Dif f erence Dif f erenceDomestic Equity 963,519 30.7% 28.0% 32.0% 36.0% (1.3%) (41,080)International Equity 663,122 21.1% 19.0% 22.0% 25.0% (0.9%) (27,540)Fixed Income 685,882 21.8% 20.0% 23.0% 26.0% (1.2%) (36,173)Real Assets 443,745 14.1% 12.0% 15.0% 18.0% (0.9%) (27,161)Priv ate Equity 361,105 11.5% 0.0% 8.0% 12.0% 3.5% 109,956Opportunistic 21,999 0.7% 0.0% 0.0% 5.0% 0.7% 21,999Total 3,139,373 100.0% 100.0%
Target Asset Allocation
Domestic Equity32%
International Equity22%
Fixed Income23%
Real Assets15%
Private Equity8%
D.1

16
Total Fund Asset Distribution
March 31, 2021 December 31, 2020Market Value Weight Net New Inv. Inv. Return Market Value Weight
Domestic Equity $963,519,198 30.69% $(55,615,800) $96,461,319 $922,673,679 30.21%SSGA S&P 500 Index Fund 696,229,012 22.18% (2,486,451) 40,658,398 658,057,065 21.55%DFA Small Cap Core 331,346,204 10.55% (1,158,104) 52,386,873 280,117,435 9.17%Parametric Domestic Equity Futures -64,056,018 (2.04%) (51,971,245) 3,416,048 -15,500,821 (0.51%)
International Equity $663,121,587 21.12% $(8,802,219) $5,789,292 $666,134,514 21.81%Morgan Stanley Value 201,376,467 6.41% 0 2,088,998 199,287,469 6.53%Artisan Partners Growth 203,036,047 6.47% (10,000,000) 1,176,284 211,859,763 6.94%TimesSquare Intl Small Cap 129,425,601 4.12% (271,787) (107,794) 129,805,181 4.25%Parametric Emerging Markets 124,384,731 3.96% 10,000,000 1,904,801 112,479,930 3.68%Parametric International Equity Futures 4,898,741 0.16% (8,530,432) 727,003 12,702,170 0.42%
Fixed Income $685,882,251 21.85% $64,389,000 $(24,609,034) $646,102,285 21.16%Wellington Core Plus 262,587,030 8.36% (1,772,294) (8,267,597) 272,626,921 8.93%Western Intermediate Credit 148,491,950 4.73% (1,084,958) (2,263,332) 151,840,240 4.97%Colchester Global 145,113,927 4.62% (153,672) (9,121,523) 154,389,122 5.06%Parametric Fixed Income Futures 129,689,344 4.13% 67,399,924 (4,956,582) 67,246,002 2.20%
Real Estate $237,342,859 7.56% $(4,202,569) $3,654,657 $237,890,771 7.79%Woodmont 18,199,993 0.58% 0 0 18,199,993 0.60%UBS Trumbull Property Fund 113,019,855 3.60% (3,123,824) 1,417,431 114,726,248 3.76%AEW Core Property Trust 106,123,011 3.38% (1,078,745) 2,248,446 104,953,310 3.44%AEW Partners V, LP ** - - 0 (11,220) 11,220 0.00%
Public Real Assets $206,402,337 6.57% $(90,037) $12,919,525 $193,572,850 6.34%INVESCO Commodities Fund 52,703,405 1.68% (90,037) 3,596,590 49,196,852 1.61%BlackRock TIPS Index Fund 46,171,557 1.47% 4,000,000 (692,524) 42,864,081 1.40%KBI Global Resources Fund 53,145,395 1.69% (14,000,000) 5,305,027 61,840,368 2.03%Blackrock REIT Index Fund 54,381,980 1.73% 10,000,000 4,710,432 39,671,548 1.30%
Priv ate Equity* $361,105,398 11.50% $(14,812,367) $(0) $375,917,765 12.31%Abbott ACE VI* 54,206,980 1.73% (4,000,000) 0 58,206,980 1.91%Abbott ACE VII* 50,062,674 1.59% (2,625,000) 0 52,687,674 1.73%Abbott 2016* 52,155,620 1.66% 0 0 52,155,620 1.71%Abbott 2017* 11,854,978 0.38% 0 0 11,854,978 0.39%Abbott 2021* 870,618 0.03% 870,618 0 - -Pathway PPEF 2008* 70,663,600 2.25% (8,154,133) (0) 78,817,733 2.58%Pathway PE I-7* 44,045,171 1.40% (3,678,824) 0 47,723,995 1.56%Pathway PE I-8* 62,285,941 1.98% (1,362,027) (0) 63,647,968 2.08%Pathway PE I-9* 11,184,532 0.36% 728,751 0 10,455,781 0.34%Pathway PE X* 3,775,283 0.12% 3,408,247 0 367,036 0.01%
Opportunistic** $21,998,886 0.70% $9,992,166 $537,908 $11,468,811 0.38%CarVal Credit Value V** 3,350,000 0.11% 0 0 3,350,000 0.11%Fortress Credit Opps Fund V** 1,622,900 0.05% 0 0 1,622,900 0.05%Varde Dislocation Fund** 17,025,986 0.54% 9,992,166 537,908 6,495,911 0.21%
Total Fund $3,139,372,515 100.0% $(9,141,826) $94,753,666 $3,053,760,675 100.0%
D.1

17
Parametric Overlay Positions – Changes Over Time
$9,723,717
$3,809,787
($12,122,565)
$129,689,344
($64,056,018)
$4,898,741
$(100,000,000)
$(50,000,000)
$-
$50,000,000
$100,000,000
$150,000,000Domestic Equity Futures International Equity Futures Fixed Income Futures
D.1

18
Total Fund Performance - Annualized
Current Quarter Target = 32.0% Russell 3000 Index, 22.0% MSCI ACWI ex US IMI Index, 11.5% Bloomberg Aggregate Index, 5.8% Bloomberg Intermediate Credit Index, 5.8% FTSE World Government Bond Index, 8.0% NCREIF NFI-ODCE Equal Weight Net, 1.8% Bloomberg Commodity Price Index, 1.8% S&P Global Natural Resources Index, 1.8% S&P DJ US Select REIT Index, 1.8% Bloomberg US TIPS Index, 4.8% Russell 3000 Index (Lagged)and 3.2% MSCI ACWI ex US IMI Index (Lagged).
Last Quarter Last Year Last 3 Years Last 5 Years Last 10 Years Last 15 Years Last 20 Years(5)
0
5
10
15
20
25
30
35
40
45
Group: Callan Public Fund Sponsor - Large (>1B)Returns for Periods Ended March 31, 2021
10th Percentile 4.61 40.75 11.39 11.50 9.50 7.66 7.7525th Percentile 3.98 35.82 10.37 10.89 8.84 7.39 7.54
Median 3.38 31.85 9.21 10.15 8.44 6.97 7.2775th Percentile 2.78 29.62 8.34 9.51 7.64 6.54 6.7390th Percentile 2.06 25.06 7.53 8.52 6.83 6.01 6.18
MCERA Total Fund - Gross A 3.14 39.24 11.08 11.46 10.06 7.87 7.87MCERA Total Fund - Net B 3.06 38.70 10.58 10.94 9.52 7.32 7.30
MCERA Total Fund Target C 2.67 37.02 10.02 10.41 8.65 7.03 7.14
A (64)
A (14)
A (12) A (10) A (4)A (7) A (5)
B (66)
B (15)
B (20) B (22) B (10)B (29) B (46)
C (80)
C (18)
C (32) C (34) C (37)C (46) C (56)
D.1

19
Total Fund Performance – Fiscal Year
2021Fiscal Year
2020Fiscal Year
2019Fiscal Year
2018Fiscal Year
2017Fiscal Year
2016Fiscal Year
2015Fiscal Year
(5)
0
5
10
15
20
25
30
Group: Callan Public Fund Sponsor - Large (>1B)Fiscal Year Returns
10th Percentile 24.13 5.08 7.73 10.33 14.95 2.34 4.9325th Percentile 21.53 3.66 6.65 9.57 14.10 1.50 4.08
Median 19.72 2.28 6.07 8.78 12.99 0.50 3.2975th Percentile 18.48 0.88 5.13 8.01 11.58 (0.62) 2.2390th Percentile 16.79 (1.02) 4.47 7.55 8.99 (1.75) 1.39
MCERA Total Fund - Gross A 22.29 3.74 6.39 10.29 12.88 2.68 5.52MCERA Total Fund - Net B 21.94 3.26 5.88 9.74 12.34 2.19 5.02
MCERA Total Fund Target C 20.43 3.29 5.99 8.67 12.20 0.98 2.91
A (19)
A (24)A (36)
A (11)A (52)
A (9)A (4)
B (20)
B (33)B (57)
B (18)B (63)
B (11)B (9)
C (42)
C (33)C (53)
C (53)C (66)
C (38)C (58)
D.1

20
Total Fund Performance – Fiscal Year
2014Fiscal Year
2013Fiscal Year
2012Fiscal Year
2011Fiscal Year
2010Fiscal Year
2009Fiscal Year
2008Fiscal Year
(30)
(20)
(10)
0
10
20
30
40
Group: Callan Public Fund Sponsor - Large (>1B)Fiscal Year Returns
10th Percentile 19.33 15.59 3.87 25.26 16.18 (14.06) (1.25)25th Percentile 18.43 13.72 2.09 23.33 14.82 (16.60) (3.09)
Median 16.73 12.22 0.90 22.07 13.33 (18.82) (4.54)75th Percentile 15.53 10.84 0.11 19.59 11.95 (20.39) (5.83)90th Percentile 13.96 8.71 (0.57) 17.78 10.62 (22.46) (6.90)
MCERA Total Fund - Gross A 19.22 15.60 2.26 24.42 9.11 (19.54) (6.05)MCERA Total Fund - Net B 18.65 15.01 1.67 23.71 8.49 (20.02) (6.60)
MCERA Total Fund Target C 18.09 12.68 2.02 22.58 10.87 (18.58) (5.85)
A (13)A (10)
A (24)
A (16)
A (97)
A (63)
A (79)
B (22)B (12)
B (33)
B (23)
B (98)
B (72)
B (88)
C (29)C (41)
C (26)
C (38)C (89)
C (46)
C (76)
D.1

21
Total Fund Performance – Calendar Years
1 Qtr. 2021 2020 2019 2018 2017 2016 2015 2014(10)
(5)
0
5
10
15
20
25
Group: Callan Public Fund Sponsor - Large (>1B)Returns for Periods Ended March 31, 2021
10th Percentile 4.61 15.62 20.43 (0.71) 17.86 9.47 2.15 8.1125th Percentile 3.98 13.48 18.75 (1.84) 17.27 8.67 1.10 7.34
Median 3.38 11.85 17.30 (3.28) 16.13 8.02 0.20 6.2275th Percentile 2.78 9.81 15.77 (4.93) 14.47 7.31 (0.67) 5.2990th Percentile 2.06 7.87 14.18 (6.02) 12.66 6.08 (1.58) 4.38
Total Fund - Gross A 3.14 15.67 18.73 (2.68) 17.41 8.10 2.73 7.10MCERA Total Fund - Net B 3.06 15.17 18.19 (3.16) 16.81 7.61 2.24 6.59
Total Fund Target C 2.67 13.68 19.97 (5.49) 16.68 8.13 (0.34) 6.28
A (64)
A (10)A (25)
A (37)
A (19)
A (44)
A (2)
A (28)
B (66)
B (13)B (34)
B (47)
B (32)
B (64)
B (9)
B (43)
C (80)
C (25)
C (16)
C (84)
C (34)
C (43)
C (67)
C (49)
D.1

22
Annualized 10 Year Total Fund Net Returns (Quarterly Roll)
2007 2008 2009 2010 2011 2012 2013 2014 2015 2016 2017 2018 2019 2020 20210
1
2
3
4
5
6
7
8
9
10
11
12
Actuarial Expected Return: 6.75% MCERA Total Fund - Net
D.1

23
Total Fund – Cumulative Returns Relative to Target
2011 2012 2013 2014 2015 2016 2017 2018 2019 2020 2021(50%)
0%
50%
100%
150%
200%
10 Years Ended March 31, 2021Total Fund Cumulative Returns vs. Target
Cum
ulat
ive
Ret
urns
MCERA Total Fund - Net
MCERA Total Fund Target
4% 6% 8% 10% 12% 14%4%
6%
8%
10%
12%
As of March 31, 2021Ten Year Annualized Risk vs. Return
Standard Deviation
Ret
urns
MCERA Total Fund Target
MCERA Total Fund - NetMCERA Total Fund - Gross
D.1

24
Watchlist
Investment ManagerOrganization/
Team
3 Year Performance
vs Benchmark
3 Year Performance
vs Peers
5 Year Performance
vs Benchmark
5 Year Performance
vs PeersQualify for Watchlist? Date Added
DFA Small Cap Core EquityRussell 2000 IndexMorgan Stanley International Value EquityMSCI EAFE IndexArtisan International Growth EquityMSCI EAFE IndexTimesSquare International Small Cap EquityMSCI EAFE Small Cap IndexParametric Emerging Markets EquityMSCI Emerging Markets IndexWellington Core Plus Fixed IncomeBloomberg Barclays Aggregate IndexWestern Asset Intermediate Credit Fixed IncomeBloomberg Barclays Intermediate Credit IndexColchester Global Fixed IncomeFTSE World Government Bond IndexInvesco Balanced Risk Commodity FundBloomberg Commodity IndexKBI Global Natural Resources FundS&P Global Natural Resource IndexUBS Trumbull Property Fund*NFI-ODCE Index
Quantitative Criteria
Color Code
N/A N/A N/A N/A
4Q17
4Q17
Yes - Org/Team
Yes
1Q15
N/A N/A
Yes
Yes
No
No
N/A N/A
Investment Manager Monitoring Summary ReportActive Managers as of March 31, 2021
NoN/AN/A
If a manager trails its relevant benchmark by more than 100 basis points (net of fees) and ranks in the bottom quartile of its peer universe (gross of fees ranking) for the trailing three years, or if a manager trails its relevant benchmark (net of fees) or ranks below median of its peer universe (gross of fees ranking) for the trailing five years, then the manager may be placed on the Watchlist.
N/A N/AN/A No
N/A N/A N/A N/A Under Review 4Q19
*UBS Trumbull Property Fund placed on watch for organizational concerns. Quantitative criteria for private market portfolios under review by Governance Committee.
meets watch list criteria, no concerns, no actions recommendedconcerns exist, no actions recommendedviolates watch list criteria, concerns exist, action to be determined
D.1

25
Watchlist
Investment Manager
3 Year Net ReturnTrails Benchmark by more than 100 bps
(relative return shown in bps)
AND 3 Year Gross Return Ranks
75th - 100th%
OR
5 Year Net ReturnTrails
Benchmark(relative return shown in bps)
OR 5 Year Gross Return Ranks
50th - 100th%
Qualify for Watchlist
(Quantitative)
DFA Small Cap Core Equity
Russell 2000 Index
Morgan Stanley International Value Equity
MSCI EAFE Index
Artisan International Growth Equity
MSCI EAFE Index
TimesSquare International Small Cap Equity
MSCI EAFE Small Cap Index
Parametric Emerging Markets Equity
MSCI Emerging Markets Index
Wellington Core Plus Fixed Income
Bloomberg Barclays Aggregate Index
Western Asset Intermediate Credit Fixed Income
Bloomberg Barclays Intermediate Credit Index
Colchester Global Fixed Income
FTSE World Government Bond Index
Invesco Balanced Risk Commodity Fund
Bloomberg Commodity Index
KBI Global Natural Resources Fund
S&P Global Natural Resource Index
UBS Trumbull Property Fund
NCREIF NFI-ODCE Index
N/A N/A N/A N/A No
N/A N/A N/A N/A No
No1139 N/A N/A N/A
No
42 75th 67 56th Yes
282 25th N/A N/A
92nd
No
112 27th 136 41st No
108 1st 106 1st
UnderReview
Quantitative criteria for private markets portfolios under review by Governance Committee. On watch due to organizational changes.
Yes
19 1st -46 20th Yes
190 81st 33 86th
Yes-602 91st -546
D.1

26
UBS Trumbull Property Fund Snapshot
As of 1Q 2021
Gross Asset Value $18.0 B
Net Asset Value $14.4 B
Leverage 18.7%
Number of Investments 178
Number of Investors 446
Redemption Queue $7.9 billion
1Q21 Redemption Queue Payout $250 million
Contribution Queue $0 million
● The Fund has a current redemption pool of $7.9 billion. The Fund made a 1Q 2021 redemption payment of $250 million, following $480 million of redemption payments in 2020. The Fund anticipates a higher level of liquidity for redemption payments in 2021 as sales activity increases, and is targeting total 2021 redemption payments of $1.0 billion. – MCERA submitted a partial redemption request for $20 million in January 2020 and received $301,570.38 on 9/30/20. – Redemption requests must be submitted at least 60 days prior to the end of the quarter and may be withdrawn no later than 14 days prior to the
end of the quarter.
● In September 2019, the fund announced investors would have a choice between two fee incentives: loyalty incentive (discounted fees of 15% over 3 years or 25% over 4 years) and top-up incentive ($0 base fee on additional dollars deposited). – The amount of client assets in the Loyalty Fee Program is $4.7 billion. – MCERA elected for the 4 year/25% discount loyalty incentive on approximately $100 million NAV.
28%
36%
15%
21%
1%
28%
37%
14%
20%
1% 0%
5%
10%
15%
20%
25%
30%
35%
40%
Office Multi-Family Retail Industrial Hotels
TPF 4Q20 Property Weights TPF 1Q21 Property Weights
Property Type Weights (Change from Prior Quarter)
As of March 31, 2021
D.1

27
NFI-ODCE Funds - Net of Fee Returns
Rent Collections AEW 1Q: Multifamily: 97% Industrial: 98% Office: 97% Retail: 96% UBS 1Q: Multifamily: 95% Industrial 95% Office: 97% Retail: 89%
As of March 31, 2021
Fund Last
Quarter Last Year
Last 3 Years
Last 5 Years
AEW 1.93% 3.64% 4.41% 5.49% AFL-CIO 0.98% -0.24% 2.74% 3.87% ARA 1.61% 0.90% 4.33% 5.12% ASB 2.18% 2.19% 3.91% 4.15% Bailard 2.16% 2.38% 7.93% 9.68% Barings 1.67% 0.31% 4.21% 5.43% BGO 1.99% 1.48% 4.32% 5.22% Blackrock 2.81% 3.50% 5.26% 6.86% CBRE 2.43% 4.56% 6.75% 8.08% CIM Group 2.84% -2.64% 5.25% 8.36% Clarion 2.02% 2.28% 5.38% 6.33% DWS 1.94% 2.12% 4.83% 5.89% Everwest 2.20% 1.88% 4.15% 5.61% GSAM 1.88% 1.90% 4.41% 6.10% Heitman 2.49% 3.52% 2.49% 4.48% Intercontinental 2.32% 3.31% 6.04% 7.68% Invesco 1.32% -2.43% 3.58% 5.51% JP Morgan 1.60% 0.70% 3.43% 4.80% LaSalle 2.91% 3.27% 4.69% 5.84% MetLife 2.54% 2.23% 5.35% 6.53% MSIM 1.90% 2.56% 5.05% 6.63% NYLIM 2.42% 4.18% 5.80% 6.64% PGIM 1.92% 2.17% 4.85% 5.86% Principal 2.43% 2.70% 5.09% 6.47% Stockbridge 2.31% 3.63% 5.72% 6.76% TA Realty 2.32% 6.34% 7.69% -- UBS 1.09% -3.95% -0.79% 1.76%
D.1

28
NFI-ODCE Funds - Gross of Fee All Sector Returns As of March 31, 2021
.
Fund Retail 1Q 2021 Apartment 1Q 2021 Industrial 1Q 2021 Office 1Q 2021 AEW -0.39% 1.14% 4.91% 0.73% AFL-CIO -0.25% 0.58% 4.99% 1.00% ARA 0.87% 1.14% 3.45% 1.14% ASB -0.44% 1.48% 6.62% 1.07% Bailard 2.37% 2.14% 3.54% 1.35% Barings 1.58% 2.06% 3.54% 0.36% BGO -0.29% 0.56% 5.41% 0.87% Blackrock 1.06% 0.64% 7.34% 1.37% CBRE 1.42% 1.30% 3.79% 0.89% CIM Group 1.06% -0.67% 4.22% 2.74% Clarion -0.15% 1.61% 3.62% 0.88% DWS -0.10% 1.04% 6.18% -0.34% Everwest 1.09% 1.57% 6.23% 0.80% GSAM 0.79% 1.78% 3.91% 1.30% Heitman 0.78% 2.01% 4.93% 1.23% Intercontinental 0.05% 2.22% 6.01% 1.75% Invesco 0.50% 0.80% 3.26% 0.59% JP Morgan 0.69% 1.18% 4.69% 1.21% LaSalle 0.99% 2.30% 5.35% 1.41% MetLife 0.47% 2.96% 4.76% 0.23% MSIM 0.05% 1.64% 3.41% 0.91% NYLIM 2.00% 1.90% 4.18% 0.50% PGIM 0.83% 0.98% 5.29% 0.58% Principal 0.45% 3.12% 6.03% -0.07% Stockbridge -3.25% 2.08% 3.82% 0.15% TA Realty 2.20% 1.89% 3.73% -0.95% UBS -3.31% 1.81% 5.25% 0.19%
D.1
29
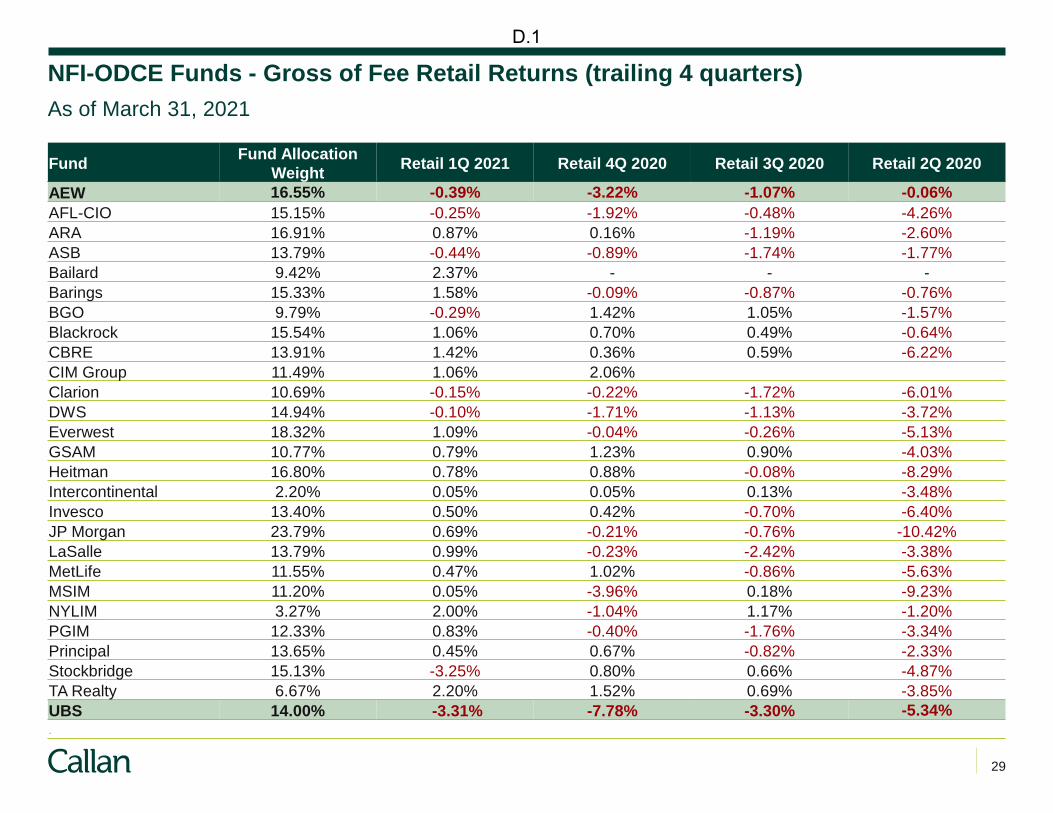
NFI-ODCE Funds - Gross of Fee Retail Returns (trailing 4 quarters) As of March 31, 2021
.
Fund Fund Allocation Weight Retail 1Q 2021 Retail 4Q 2020 Retail 3Q 2020 Retail 2Q 2020
AEW 16.55% -0.39% -3.22% -1.07% -0.06% AFL-CIO 15.15% -0.25% -1.92% -0.48% -4.26% ARA 16.91% 0.87% 0.16% -1.19% -2.60% ASB 13.79% -0.44% -0.89% -1.74% -1.77% Bailard 9.42% 2.37% - - - Barings 15.33% 1.58% -0.09% -0.87% -0.76% BGO 9.79% -0.29% 1.42% 1.05% -1.57% Blackrock 15.54% 1.06% 0.70% 0.49% -0.64% CBRE 13.91% 1.42% 0.36% 0.59% -6.22% CIM Group 11.49% 1.06% 2.06% Clarion 10.69% -0.15% -0.22% -1.72% -6.01% DWS 14.94% -0.10% -1.71% -1.13% -3.72% Everwest 18.32% 1.09% -0.04% -0.26% -5.13% GSAM 10.77% 0.79% 1.23% 0.90% -4.03% Heitman 16.80% 0.78% 0.88% -0.08% -8.29% Intercontinental 2.20% 0.05% 0.05% 0.13% -3.48% Invesco 13.40% 0.50% 0.42% -0.70% -6.40% JP Morgan 23.79% 0.69% -0.21% -0.76% -10.42% LaSalle 13.79% 0.99% -0.23% -2.42% -3.38% MetLife 11.55% 0.47% 1.02% -0.86% -5.63% MSIM 11.20% 0.05% -3.96% 0.18% -9.23% NYLIM 3.27% 2.00% -1.04% 1.17% -1.20% PGIM 12.33% 0.83% -0.40% -1.76% -3.34% Principal 13.65% 0.45% 0.67% -0.82% -2.33% Stockbridge 15.13% -3.25% 0.80% 0.66% -4.87% TA Realty 6.67% 2.20% 1.52% 0.69% -3.85% UBS 14.00% -3.31% -7.78% -3.30% -5.34%
D.1

MCERA Asset Class Review
D.1
31
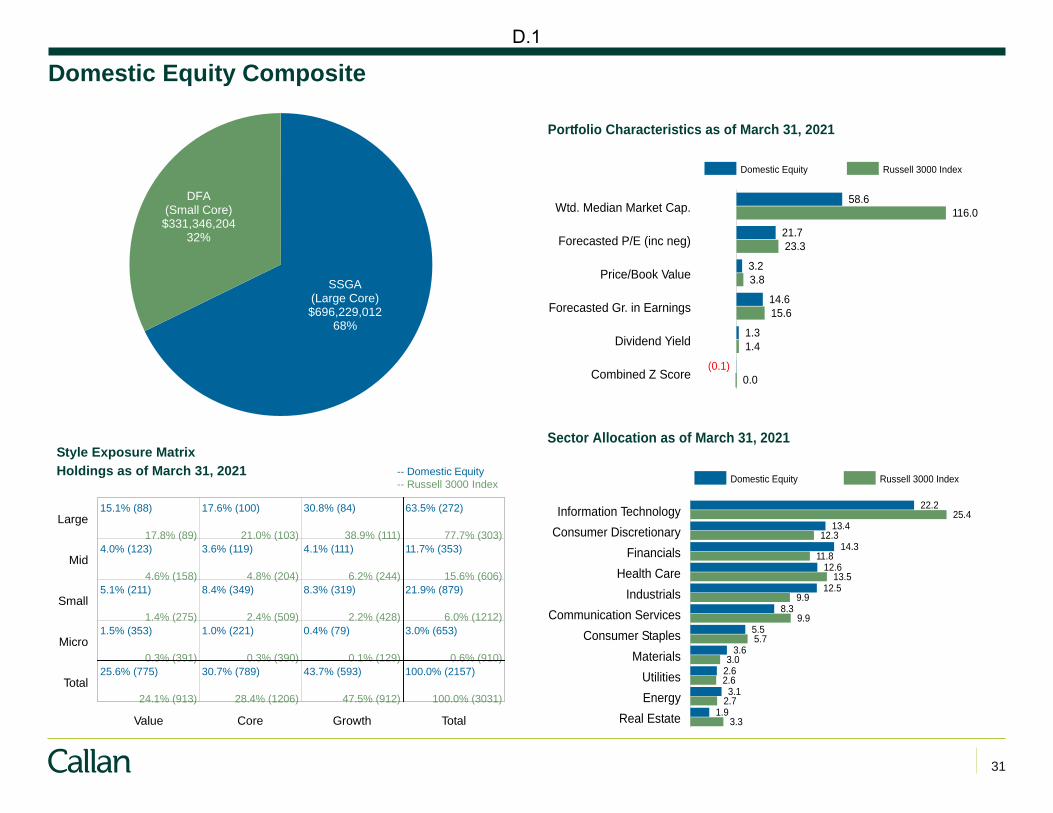
Domestic Equity Composite
Wtd. Median Market Cap.
Forecasted P/E (inc neg)
Price/Book Value
Forecasted Gr. in Earnings
Dividend Yield
Combined Z Score
Portfolio Characteristics as of March 31, 2021
Domestic Equity Russell 3000 Index
58.6
21.7
3.2
14.6
1.3
(0.1)
116.0
23.3
3.8
15.6
1.4
0.0
Information TechnologyConsumer Discretionary
FinancialsHealth Care
IndustrialsCommunication Services
Consumer StaplesMaterials
UtilitiesEnergy
Real Estate
Sector Allocation as of March 31, 2021
Domestic Equity Russell 3000 Index
22.2
13.4
14.3
12.6
12.5
8.3
5.5
3.6
2.6
3.1
1.9
25.4
12.3
11.8
13.5
9.9
9.9
5.7
3.0
2.6
2.7
3.3Value Core Growth Total
Large
Mid
Small
Micro
Total
Holdings as of March 31, 2021Style Exposure Matrix
15.1% (88)
17.8% (89)
17.6% (100)
21.0% (103)
30.8% (84)
38.9% (111)
63.5% (272)
77.7% (303)4.0% (123)
4.6% (158)
3.6% (119)
4.8% (204)
4.1% (111)
6.2% (244)
11.7% (353)
15.6% (606)5.1% (211)
1.4% (275)
8.4% (349)
2.4% (509)
8.3% (319)
2.2% (428)
21.9% (879)
6.0% (1212)1.5% (353)
0.3% (391)
1.0% (221)
0.3% (390)
0.4% (79)
0.1% (129)
3.0% (653)
0.6% (910)25.6% (775)
24.1% (913)
30.7% (789)
28.4% (1206)
43.7% (593)
47.5% (912)
100.0% (2157)
100.0% (3031)
-- Domestic Equity -- Russell 3000 Index
SSGA (Large Core) $696,229,012
68%
DFA (Small Core) $331,346,204
32%
D.1

32
Domestic Equity Composite
● The domestic equity composite outperformed the index in the first quarter. DFA outperformed the Russell 2000 benchmark for the quarter and year. The majority of relative outperformance came from the fund’s holdings in health care as well as the exclusion of stocks with the lowest profitability and highest relative price.
The Domestic Equity Target is comprised of 51.1% S&P/BARRA Value, 22.2% S&P 500, 15.6% Russell 2000 and 11.1% S&P/BARRA Growth through 12/31/1999, 80% S&P 500 and 20% Russell 2000 from 12/31/1999 to 06/30/2010, and 100% Russell 3000 from 06/30/2010 to present.
Returns and Rankings for Periods Ended March 31, 2021
QuarterLast
Last Year YearsLast 3
YearsLast 5
YearsLast 10
Domestic Equity - Net 11.06 70.61 16.75 16.83 13.21Domestic Equity Target 6.35 62.53 17.12 16.64 13.79
Large Cap Equity - Net 6.18 56.83 16.83 16.33 13.62SSGA - Net 6.19 56.35 16.74 16.28 13.90S&P 500 Index 6.17 56.35 16.78 16.29 13.91Ranking vs. Large Cap Equity 52 71 53 53 53
Small Cap Equity - Net 22.75 105.30 14.87 17.02 11.25DFA Small Core - Net 18.64 97.04 -- -- --Russell 2000 Index 12.70 94.85 14.76 16.35 11.68Ranking vs. Small Cap Equity 12 26 -- -- --
Returns and Rankings for Calendar Years
20211 Qtr.
2020 2019 2018 2017 2016Domestic Equity - Net 11.06 17.85 28.76 (5.34) 20.61 13.26Domestic Equity Target 6.35 20.89 31.02 (5.24) 21.13 12.74
Large Cap Equity - Net 6.18 18.65 31.63 (4.59) 21.86 12.01SSGA - Net 6.19 18.33 31.43 (4.39) 21.82 12.00S&P 500 Index 6.17 18.40 31.49 (4.38) 21.83 11.96Ranking vs. Large Cap Equity 52 53 43 46 51 35
Small Cap Equity - Net 22.75 14.26 21.86 (8.79) 17.50 15.99DFA Small Core - Net 18.64 11.74 21.80 -- -- --Russell 2000 Index 12.70 19.96 25.52 (11.01) 14.65 21.31Ranking vs. Small Cap Equity 12 54 69 -- -- --
D.1

33
International Equity Composite
Wtd. Median Market Cap.
Forecasted P/E (inc neg)
Price/Book Value
Forecasted Gr. in Earnings
Dividend Yield
Combined Z Score
Portfolio Characteristics as of March 31, 2021
International Equity
MSCI ACWI ex US IMI Index
25.0
17.7
2.3
13.5
1.9
0.2
31.3
16.6
1.8
13.0
2.2
0.0
FinancialsInformation Technology
Health CareConsumer Staples
IndustrialsMaterials
Consumer DiscretionaryCommunication Services
EnergyUtilities
Real Estate
Sector Allocation as of March 31, 2021
17.8
11.9
11.9
11.5
14.9
9.5
8.9
7.2
2.4
1.9
1.1
17.8
12.6
8.7
8.0
13.0
8.6
13.6
6.7
4.2
3.2
3.7
International Equity
MSCI ACWI ex US IMI Index
Value Core Growth Total
Europe
N. America
Pacific
Emerging
Total
Holdings as of March 31, 2021Region & Style Exposure Matrix
9.6% (22)
11.7%
19.6% (44)
13.1%
24.3% (55)
16.1%
53.5% (121)
40.9%0.8% (3)
1.2%
0.6% (2)
1.3%
3.4% (6)
1.4%
4.8% (11)
3.9%1.1% (6)
8.4%
2.3% (9)
6.6%
11.6% (29)
10.0%
15.1% (44)
25.1%5.8% (649)
7.5%
9.1% (522)
9.3%
11.7% (255)
13.4%
26.6% (1426)
30.1%17.3% (680)
28.8%
31.7% (577)
26.4%
51.0% (345)
40.9%
100.0% (1602)
100.0%
-- International Equity -- MSCI ACWI ex US IMI Index
Morgan Stanley (Developed
Value) $201,376,467
30%
Artisan (Developed
Growth) $203,036,047
31%
TimesSquare (Developed Small Cap)
$129,425,601 20%
Parametric (Emerging)
$124,384,731 19%
D.1

34
International Equity Composite
● The International Equity composite underperformed on a relative basis for the quarter and year. Absolute returns were strong for the year at +45.3%. – Morgan Stanley: stock selection within consumer discretionary and energy was a significant detractor along with the fund’s
overweight to consumer staples. – Artisan: stock selection in financials and health care plus an underweight to energy weighed on relative returns. – TimesSquare: stock selection in IT, communication services and health care were headwinds to performance. – Parametric: an underweight to Taiwan was the main detractor as technology exports picked up for the country.
The International Equity Target is comprised of 100% MSCI EAFE Index through 06/30/2010, and 100% MSCI ACWI ex-US IMI Index thereafter.
Returns and Rankings for Periods Ended March 31, 2021
QuarterLast
YearLast
YearsLast 3
YearsLast 5
YearsLast 10
International Equity - Net 0.83 45.30 5.95 8.85 6.55International Equity Target 3.77 51.94 6.51 9.84 5.11
Morgan Stanley - Net 0.91 41.42 6.21 8.39 6.00MSCI EAFE Index 3.48 44.57 6.02 8.85 5.52Ranking vs. Non-US Developed Value Equity 100 80 1 20 18
Artisan - Net 0.43 38.14 7.92 9.18 7.31MSCI EAFE Index 3.48 44.57 6.02 8.85 5.52Ranking vs. Non-US Developed Growth Equity 73 94 81 86 50
TimesSquare - Net (0.08) 59.02 -- -- --MSCI EAFE Small Cap 4.50 61.98 6.32 10.50 8.01TimesSquare - Gross (unlinked) 86 68 -- -- --
Parametric EM - Net 1.88 51.84 0.46 6.61 1.81MSCI Emerging Markets Index 2.29 58.39 6.48 12.07 3.65Ranking vs. Emerging Markets Equity 65 83 91 92 94
Returns and Rankings for Periods Ended March 31, 2021
20211 Qtr.
2020 2019 2018 2017International Equity - Net 0.83 10.79 23.52 (13.51) 28.92International Equity Target 3.77 11.12 21.63 (14.76) 27.81
Morgan Stanley - Net 0.91 11.99 20.92 (13.46) 25.42MSCI EAFE Index 3.48 7.82 22.01 (13.79) 25.03Ranking vs. Non-US Developed Value Equity 100 1 34 14 41
Artisan - Net 0.43 8.08 29.61 (10.56) 31.24MSCI EAFE Index 3.48 7.82 22.01 (13.79) 25.03Ranking vs. Non-US Developed Growth Equity 73 96 26 13 25
TimesSquare - Net (0.08) 13.87 -- -- --MSCI EAFE Small Cap 4.50 12.34 24.96 (17.89) 33.01TimesSquare - Gross (unlinked) 86 40 -- -- --
Parametric EM - Net 1.88 4.02 12.61 (13.57) 27.62MSCI Emerging Markets Index 2.29 18.31 18.44 (14.57) 37.28Ranking vs. Emerging Markets Equity 65 87 83 25 83
D.1

35
International Equity Composite
0.0 2.5 5.0 7.5 10.0 12.5 15.0 17.5
Mexico
Netherlands
Peru
Philippines
Poland
Russia
Singapore
South Africa
South Korea
Spain
Sweden
Switzerland
Taiwan
Thailand
Turkey
U.A.E.
United Kingdom
United States
1.0
2.6
0.3
0.5
0.5
1.6
0.5
1.1
3.1
1.3
2.3
5.0
3.3
0.6
0.4
0.3
15.0
3.1
0.5
2.7
0.1
0.2
0.2
0.9
0.8
1.1
4.9
1.5
2.6
5.9
4.1
0.6
0.1
0.2
9.7
0.2
0 5 10 15 20
Australia
Brazil
Canada
Chile
China
Denmark
Finland
France
Germany
Greece
Hong Kong
India
Indonesia
Ireland
Israel
Italy
Japan
Malaysia
1.2
1.3
2.7
0.4
5.7
1.3
0.5
7.6
12.3
0.5
2.6
1.6
0.4
0.7
0.9
2.4
8.9
0.5
4.9
1.3
3.8
0.2
10.8
1.5
0.7
6.9
6.1
0.0
2.0
2.9
0.4
0.4
0.5
1.6
16.4
0.4
-- International Equity -- MSCI ACWI ex US IMI Index Country Allocations as of March 31, 2021
D.1

36
Fixed Income Composite
Effective Duration
Wtd. Average Life
Effective Yield
Coupon Rate
Effective Convexity
Portfolio Characteristics as of March 31, 2021
5.8
7.5
2.0
3.2
0.4
6.5
7.9
1.3
2.5
0.6
Fixed Income Fixed Income Target
Corporate
Govt Related
Agency RMBS
CMBS
Asset Backed
US Treasuries
Other
Cash
Sector Allocation as of March 31, 2021
Fixed Income Fixed Income Target
42.7
28.9
19.5
3.8
2.3
0.2
0.0
(0.4)
34.3
32.1
13.7
1.1
0.2
18.6
0.0
0.0
AAAAA+
AAAA-A+
AA-
BBB+BBB
BBB-BB+
BBBB-B+
Total Domestic Fixed Income DatabaseQuality Rating as of March 31, 2021
10th Percentile AAA25th Percentile AA
Median A75th Percentile BBB90th Percentile B+
Fixed Income A A+Fixed Income Target B AA-
A (46)B (38)
Wellington (Core Plus)
$262,587,030 48%
Western Asset (Int.
Credit) $148,491,950
27%
Colchester (Global)
$145,113,927 26%
D.1

37
Fixed Income Composite
● The Fixed Income composite performed in line with its target in the first quarter. – Wellington: allocations to high yield, non-agency RMBS, and an allocation to TIPS were tailwinds to relative performance. – Western Asset: issue selection within energy and an overweight to lower quality issues benefited relative returns. – Colchester: currency exposure was the main detractor for the period, namely overweights in the Swedish Krona and the Japanese
Yen.
Returns and Rankings for Calendar Years
20211 Qtr.
2020 2019 2018 2017 2016Fixed Income - Net (3.61) 11.47 8.65 (0.35) 5.14 4.26Fixed Income Target (3.62) 8.10 8.21 (0.17) 4.55 2.70
Wellington - Net (3.10) 9.91 9.94 (0.37) 4.90 4.72Bloomberg Aggregate Index (3.37) 7.51 8.72 0.01 3.54 2.65Ranking vs. Core Plus Fixed Income 72 26 44 42 41 43
Western Asset - Net (1.57) 9.96 9.78 (0.37) 4.12 4.89Bloomberg Intermediate Credit Index (2.07) 7.08 9.52 0.01 3.67 3.68Ranking vs. Intermediate Fixed Income 20 2 1 99 2 1
Colchester - Net (6.01) 11.12 7.56 (0.90) 8.20 3.87FTSE World Government Bond Index (5.68) 10.11 5.90 (0.84) 7.49 1.60Ranking vs. Global Fixed Income (Uhedged) 92 26 58 18 35 15
Fixed Income Target is comprised of 100% Bloomberg Aggregate Index until 03/31/2014 and 50% Bloomberg Aggregate Index, 25% Bloomberg Intermediate Credit Index, and 25% FTSE World Government Bond Index thereafter.
Returns and Rankings for Periods Ended March 31, 2021
QuarterLast
YearLast
YearsLast 3
YearsLast 5
YearsLast 10
Fixed Income - Net (3.61) 7.87 5.28 4.10 4.14Fixed Income Target (3.62) 2.65 4.17 3.05 3.19
Wellington - Net (3.10) 5.50 5.77 4.46 4.50Bloomberg Aggregate Index (3.37) 0.71 4.65 3.10 3.44Ranking vs. Core Plus Fixed Income 72 65 27 41 33
Western Asset - Net (1.57) 12.61 6.29 4.81 4.55Bloomberg Intermediate Credit Index (2.07) 7.39 5.21 3.75 3.86Ranking vs. Intermediate Fixed Income 20 1 1 1 1
Colchester - Net (6.01) 8.61 2.51 2.82 --FTSE World Government Bond Index (5.68) 1.82 2.09 2.15 1.66Ranking vs. Global Fixed Income (Uhedged) 92 44 75 56 --
D.1

38
Real Estate Composite
Woodmont (Property)
$18,199,993 8%
UBS (Core Open End)
$113,019,855 48%
AEW (Core Open End)
$106,123,011 44%
AEW Partners V (Value-Add)
$0 0%
Diversification by Geographic Region as of March 31, 2021
0%
10%
20%
30%
40%
50%
Northeast
21.6218.96
Mideast
8.12 8.37
Southeast
9.5111.08
Southwest
11.529.96
ENCentral
7.00 7.01
WNCentral
1.06 1.78
Mountain
6.65 7.00
Pacific
34.53 35.83
Perc
ent o
f Por
tfolio
Real Estate Composite NFI-ODCE Equal Weight Net
Diversification by Property Type as of March 31, 2021
0%
5%
10%
15%
20%
25%
30%
35%
40%
Office
27.8930.48
Multi-Family
30.01
26.67
Retail
16.94
12.89
Industrial
23.7425.87
Hotels
0.65 0.17
Land
0.77
Other/Misc
3.90
Perc
ent o
f Por
tfolio
Real Estate Composite NFI-ODCE Equal Weight Net
D.1
39
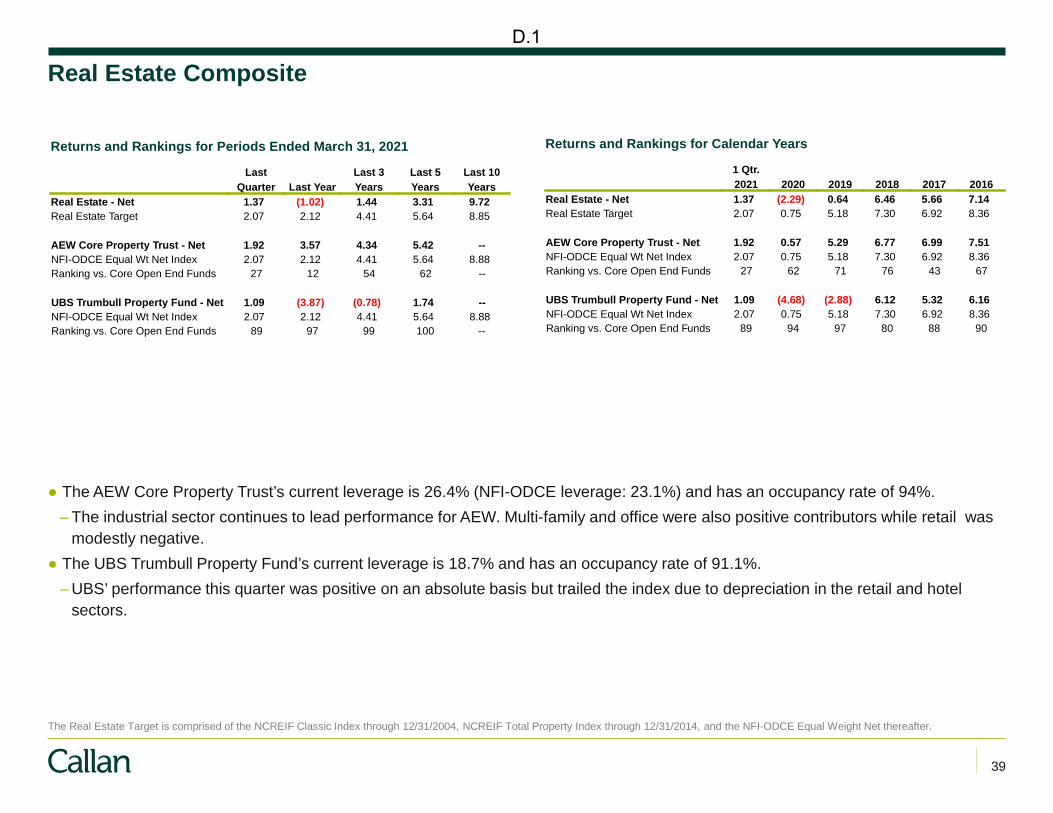
Real Estate Composite
● The AEW Core Property Trust’s current leverage is 26.4% (NFI-ODCE leverage: 23.1%) and has an occupancy rate of 94%. – The industrial sector continues to lead performance for AEW. Multi-family and office were also positive contributors while retail was
modestly negative. ● The UBS Trumbull Property Fund’s current leverage is 18.7% and has an occupancy rate of 91.1%.
– UBS’ performance this quarter was positive on an absolute basis but trailed the index due to depreciation in the retail and hotel sectors.
Returns and Rankings for Periods Ended March 31, 2021
QuarterLast
Last Year YearsLast 3
YearsLast 5
YearsLast 10
Real Estate - Net 1.37 (1.02) 1.44 3.31 9.72Real Estate Target 2.07 2.12 4.41 5.64 8.85
AEW Core Property Trust - Net 1.92 3.57 4.34 5.42 --NFI-ODCE Equal Wt Net Index 2.07 2.12 4.41 5.64 8.88Ranking vs. Core Open End Funds 27 12 54 62 --
UBS Trumbull Property Fund - Net 1.09 (3.87) (0.78) 1.74 --NFI-ODCE Equal Wt Net Index 2.07 2.12 4.41 5.64 8.88Ranking vs. Core Open End Funds 89 97 99 100 --
The Real Estate Target is comprised of the NCREIF Classic Index through 12/31/2004, NCREIF Total Property Index through 12/31/2014, and the NFI-ODCE Equal Weight Net thereafter.
Returns and Rankings for Calendar Years
20211 Qtr.
2020 2019 2018 2017 2016Real Estate - Net 1.37 (2.29) 0.64 6.46 5.66 7.14Real Estate Target 2.07 0.75 5.18 7.30 6.92 8.36
AEW Core Property Trust - Net 1.92 0.57 5.29 6.77 6.99 7.51NFI-ODCE Equal Wt Net Index 2.07 0.75 5.18 7.30 6.92 8.36Ranking vs. Core Open End Funds 27 62 71 76 43 67
UBS Trumbull Property Fund - Net 1.09 (4.68) (2.88) 6.12 5.32 6.16NFI-ODCE Equal Wt Net Index 2.07 0.75 5.18 7.30 6.92 8.36Ranking vs. Core Open End Funds 89 94 97 80 88 90
D.1

40
AEW Income and Appreciation Returns
Income Rankings vs Callan Real Estate ODCEPeriods ended March 31, 2021
0.0%0.5%1.0%1.5%2.0%2.5%3.0%3.5%4.0%4.5%5.0%
Last Quarter Last Year Last 3 Years Last 5 Years Last 7 Years
(34)(25)
(16)(21)(4)
(10)(5)
(15)(6)
(21)
10th Percentile 0.92 3.36 3.38 3.57 3.7925th Percentile 0.85 3.15 3.26 3.40 3.60
Median 0.71 2.91 3.10 3.15 3.3475th Percentile 0.66 2.45 2.53 2.57 2.7190th Percentile 0.62 2.12 1.93 2.00 2.08
AEW CoreProperty Trust 0.80 3.27 3.83 3.95 4.12
NFI-ODCEEqual Weight Net 0.85 3.20 3.41 3.52 3.65
Appreciation Rankings vs Callan Real Estate ODCEPeriods ended March 31, 2021
(8%)(6%)(4%)(2%)
0%2%4%6%
Last Quarter Last Year Last 3 Years Last 5 Years Last 7 Years
(69)(49) (8)(54)
(89)(70) (95)(63) (96)(82)
10th Percentile 1.55 0.04 1.71 2.97 4.5525th Percentile 1.54 (0.24) 1.69 2.71 4.40
Median 1.21 (0.84) 1.49 2.31 4.3275th Percentile 0.91 (3.35) 0.90 1.94 4.0090th Percentile 0.42 (6.24) 0.55 1.79 3.75
AEW CoreProperty Trust 1.11 0.29 0.49 1.42 2.87
NFI-ODCEEqual Weight Net 1.22 (1.06) 1.02 2.09 3.89
D.1

41
UBS Income and Appreciation Returns
Income Rankings vs Callan Real Estate ODCEPeriods ended March 31, 2021
0.0%0.5%1.0%1.5%2.0%2.5%3.0%3.5%4.0%4.5%
Last Quarter Last Year Last 3 Years Last 5 Years Last 7 Years
(24)(25)
(21)(21)(3)
(10)(6)(15) (15)(21)
10th Percentile 0.92 3.36 3.38 3.57 3.7925th Percentile 0.85 3.15 3.26 3.40 3.60
Median 0.71 2.91 3.10 3.15 3.3475th Percentile 0.66 2.45 2.53 2.57 2.7190th Percentile 0.62 2.12 1.93 2.00 2.08
UBS TrumbullProperty Fund 0.85 3.21 3.97 3.84 3.73
NFI-ODCEEqual Weight Net 0.85 3.20 3.41 3.52 3.65
Appreciation Rankings vs Callan Real Estate ODCEPeriods ended March 31, 2021
(10%)(8%)(6%)(4%)(2%)
0%2%4%6%
Last Quarter Last Year Last 3 Years Last 5 Years Last 7 Years
(90)(49)
(90)
(54)
(99)
(70)(99)
(63)(99)
(82)
10th Percentile 1.55 0.04 1.71 2.97 4.5525th Percentile 1.54 (0.24) 1.69 2.71 4.40
Median 1.21 (0.84) 1.49 2.31 4.3275th Percentile 0.91 (3.35) 0.90 1.94 4.0090th Percentile 0.42 (6.24) 0.55 1.79 3.75
UBS TrumbullProperty Fund 0.25 (6.91) (4.61) (2.04) 0.55
NFI-ODCEEqual Weight Net 1.22 (1.06) 1.02 2.09 3.89
D.1

42
Real Assets Composite
● The BlackRock TIPS and REITs Funds are passive. ● The Invesco Balanced Risk Commodities Fund
outperformed primarily due to its overweight to industrial metals.
● All three strategies within the KBI Global Resources Solutions Fund (energy solutions, water, and agribusiness) contributed to the fund’s total return, but the strategy underperformed its index during the first quarter. Within the water segment, utilities and technology were the largest contributors to underperformance.
The Real Assets Target is comprised of 25% Bloomberg US TIPS Index, 25% Bloomberg Commodity Index, 25% S&P Dow Jones US Select REIT Index, and 25% S&P Global Natural Resources Index. The KBI Custom Benchmark consists of 1/3 each: S-Network Global Water Index, Wilderhill New Energy Global Innovation Index, and Dax Global Agribusiness Index.
Returns and Rankings for Periods Ended March 31, 2021
Last Quarter Last Year Last 3 Years Last 4 YearsReal Assets - Net 6.56 46.36 9.11 7.84Real Assets Target 6.76 35.53 5.25 5.05
BlackRock TIPS Index Fund - Net (1.46) 7.81 5.78 4.59Bloomberg US TIPS Index (1.47) 7.54 5.68 4.47Ranking vs. Real Returns Database 56 56 44 44
BlackRock REIT Index Fund - Net 9.97 36.58 7.52 --S&P Dow Jones US Select REIT 10.00 36.66 7.55 4.63MSCI US REIT Index 8.76 37.69 9.51 5.86Ranking vs. Real Estate Mutual Funds 13 36 88 91
Invesco Commodity Fund - Net 7.13 54.79 2.62 3.25Bloomberg Commodity Index 6.92 35.04 (0.20) 0.76Ranking vs. Commodities Funds 82 19 25 25
KBI Global Resources Fund - Net 9.35 89.20 16.12 15.20S&P Global Natural Resources Index 11.59 66.45 4.74 7.58KBI Custom Benchmark 3.91 94.55 20.69 18.41
Returns and Rankings Calendar Years
1 Qtr. 2021 2020 2019 2018Real Assets - Net 6.56 11.08 15.51 (7.97)Real Assets Target 6.76 0.57 14.08 (7.27)
BlackRock TIPS Index Fund - Net (1.46) 11.17 8.49 (1.15)Bloomberg US TIPS Index (1.47) 10.99 8.43 (1.26)Ranking vs. Real Returns Database 56 24 37 43
BlackRock REIT Index Fund - Net 9.97 (11.21) 23.07 (4.22)S&P Dow Jones US Select REIT Index 10.00 (11.20) 23.10 (4.22)MSCI US REIT Index 8.76 (7.57) 25.84 (4.57)Ranking vs. Real Estate Mutual Funds 13 96 89 23
Invesco Commodity Fund - Net 7.13 7.57 5.49 (11.61)Bloomberg Commodity Index 6.92 (3.12) 7.69 (11.25)Ranking vs. Commodities Funds 82 6 81 46
KBI Global Resources Fund - Net 9.35 29.16 24.81 (14.60)S&P Global Natural Resources Index 11.59 (0.05) 16.41 (13.08)KBI Custom Benchmark 3.91 46.83 28.74 (13.77)
Invesco (Commodities) $52,703,405
26%
BlackRock (TIPS) $46,171,557
22%
KBI (Global Resources) $53,145,395
26%
BlackRock (REITs) $54,381,980
26%
D.1
43
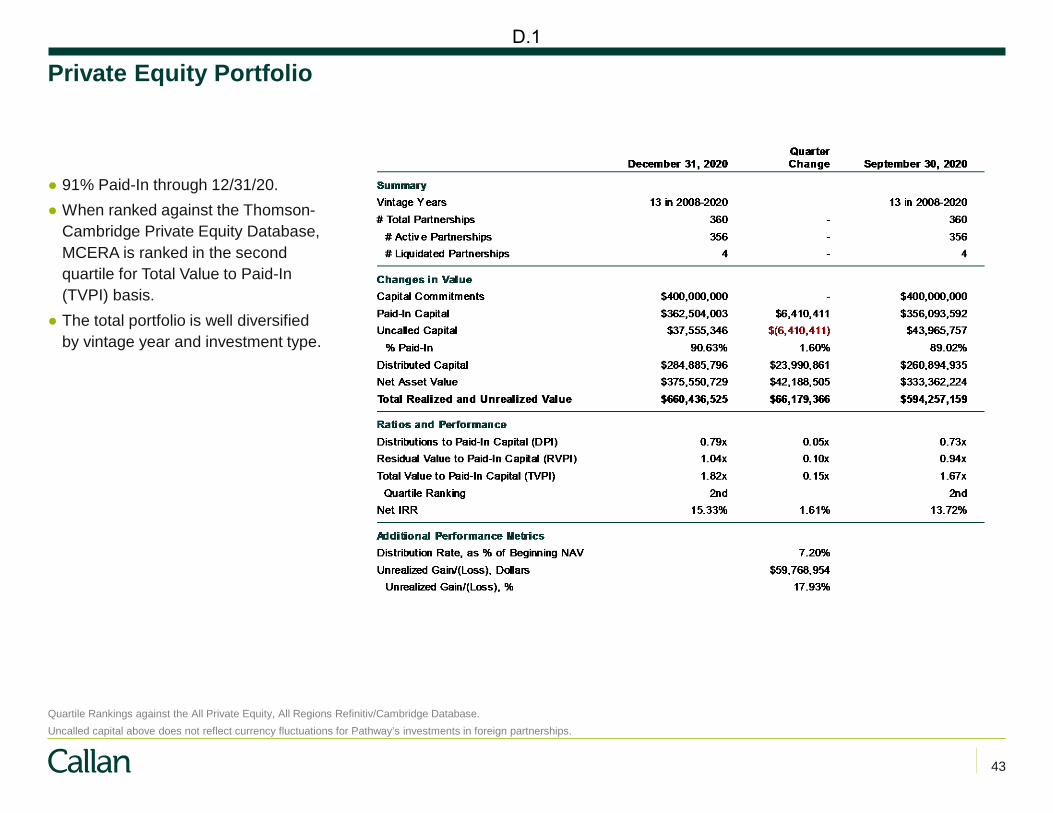
Private Equity Portfolio
● 91% Paid-In through 12/31/20. ● When ranked against the Thomson-
Cambridge Private Equity Database, MCERA is ranked in the second quartile for Total Value to Paid-In (TVPI) basis.
● The total portfolio is well diversified by vintage year and investment type.
Quartile Rankings against the All Private Equity, All Regions Refinitiv/Cambridge Database. Uncalled capital above does not reflect currency fluctuations for Pathway’s investments in foreign partnerships.
D.1
44
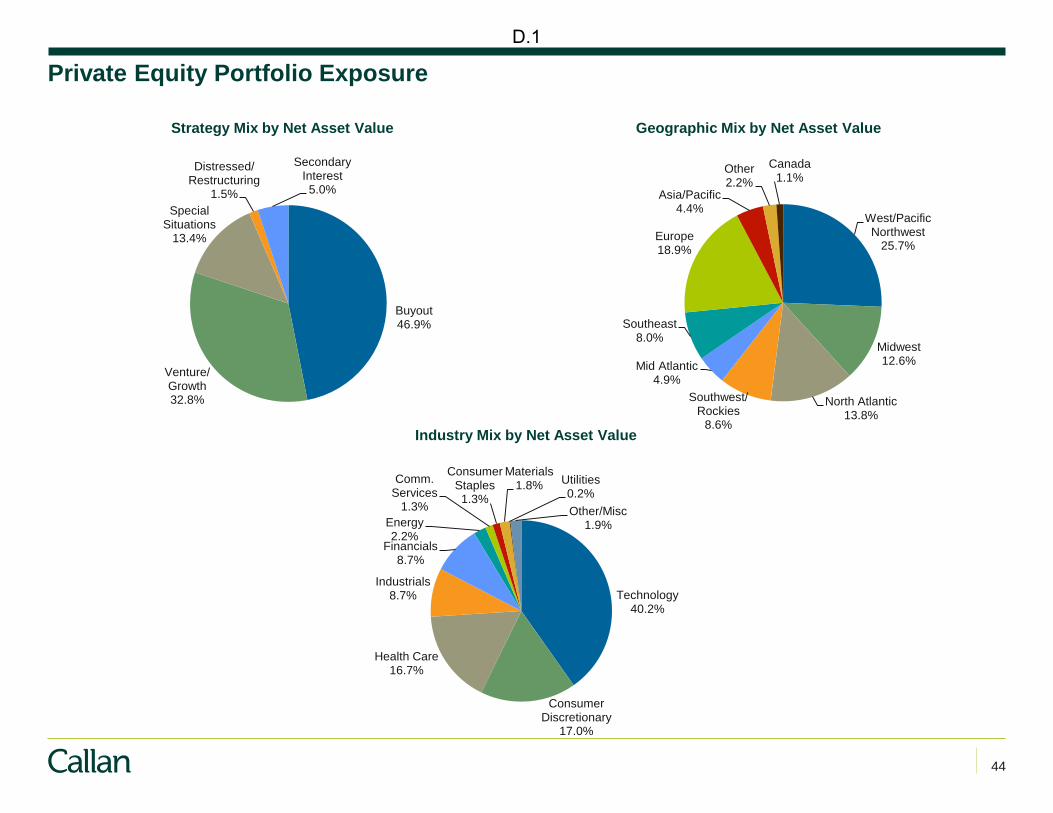
Private Equity Portfolio Exposure
Industry Mix by Net Asset Value
Geographic Mix by Net Asset Value Strategy Mix by Net Asset Value
Buyout 46.9%
Venture/ Growth 32.8%
Special Situations
13.4%
Distressed/ Restructuring
1.5%
Secondary Interest 5.0%
West/Pacific Northwest
25.7%
Midwest 12.6%
North Atlantic 13.8%
Southwest/ Rockies
8.6%
Mid Atlantic 4.9%
Southeast 8.0%
Europe 18.9%
Asia/Pacific 4.4%
Other 2.2%
Canada 1.1%
Technology 40.2%
Consumer Discretionary
17.0%
Health Care 16.7%
Industrials 8.7%
Financials 8.7%
Energy 2.2%
Comm. Services
1.3%
Consumer Staples 1.3%
Materials 1.8% Utilities
0.2% Other/Misc
1.9%
D.1

45
Private Equity Ratios – Changes Over Time
0.01 0.00 0.01 0.02 0.02 0.03 0.04 0.05 0.11
0.16 0.17 0.18 0.21 0.23 0.25 0.28 0.31 0.32 0.31 0.32 0.34 0.37 0.42 0.44 0.44
0.53 0.55 0.58 0.61 0.63 0.65 0.68 0.70
0.71
0.71 0.73
0.79 0.89 0.92 0.93 0.95 0.98
0.91
1.00 1.05 1.03 1.00 1.03 1.00 0.98 0.97 0.97 0.94 0.92 0.91 0.94 0.96 0.95 0.97 0.96 0.95 0.95 0.92 0.92 0.92
0.88 0.89 0.89 0.86 0.87 0.78
0.87 0.94
1.04 0.89 0.92 0.94 0.97 1.00 0.94
1.04 1.10
1.14 1.16 1.21 1.19 1.19 1.20 1.22 1.22 1.23 1.23 1.25 1.28 1.30
1.34 1.38 1.39 1.39
1.44 1.47 1.50 1.49 1.52 1.54 1.54 1.57
1.49
1.58
1.67
1.82
0
0.2
0.4
0.6
0.8
1
1.2
1.4
1.6
1.8
2Distributions/Paid-In (DPI) Residual Value/Paid-In (RVPI) Total Value/Paid-In (TVPI)
D.1

46
Opportunistic Portfolio
● 20.2% Paid-In through 3/31/21. ● The total portfolio is well diversified
by industry type and geographic location.
D.1

47
Opportunistic Portfolio Exposure
Industry Mix by Net Asset Value
Geographic Mix by Net Asset Value Strategy Mix by Net Asset Value
Special Situations100.0%
United States85.1%
Europe31.1%
Asia/Pacific18.5%
Other13.2%
Middle East5.6%
Other/Misc22.6%
Consumer Discretionary56.3%
Financial32.9%
Industrials11.2%
Energy11.1%
Communication Services8.9%
Utilities7.6%
Consumer Staples7.3%
Materials1.8%
D.1

Appendix
D.1

49
Last Quarter Last Year Last 3 Years Last 5 Years Since 12/31/10 Last 10 Years(10)
0
10
20
30
40
50
60
70
80
90
Group: Callan Large CapitalizationReturns for Periods Ended March 31, 2021
10th Percentile 15.34 76.55 23.69 22.28 17.35 17.2125th Percentile 12.08 67.46 21.30 20.10 16.18 15.99
Median 6.81 60.12 17.25 16.74 14.45 14.2075th Percentile 2.10 55.31 11.71 13.08 12.14 11.6890th Percentile 0.43 51.22 9.54 11.59 11.23 10.90
SSGA - Gross A 6.20 56.39 16.78 16.31 14.22 13.94SSGA - Net B 6.19 56.35 16.74 16.28 14.18 13.90
S&P 500 Index C 6.17 56.35 16.78 16.29 14.19 13.91
A (52)
A (71)
A (53)A (53) A (52) A (53)
B (52)
B (71)
B (53) B (53) B (53) B (53)C (52)
C (71)
C (53)C (53) C (53) C (53)
SSGA S&P 500 Index Portfolio
Inception Date: 12/31/2010 Strategy AUM: $653.3B Vehicle AUM: $59.5B Fee Schedule: 0.05% on the first $50 million 0.04% on the next $50 million 0.02% on the balance
D.1

50
Last Quarter Last Year12/31/18
Since Last 3 Years Last 5 Years Last 10 Years(20)
0
20
40
60
80
100
120
Group: Callan Small Cap CoreReturns for Periods Ended March 31, 2021
10th Percentile 19.02 109.42 31.01 18.76 18.72 14.6125th Percentile 16.50 97.87 28.03 15.97 16.60 13.61
Median 14.11 91.22 23.73 13.33 14.84 12.3175th Percentile 11.73 83.83 21.73 11.00 13.24 11.3490th Percentile 9.11 76.81 19.59 9.32 12.00 10.63
DFA Small Core - Gross A 18.74 97.66 24.17 12.96 14.20 11.87DFA Small Core - Net B 18.64 97.04 23.73 12.56 13.80 11.48
S&P 500 Index C 12.70 94.85 26.50 14.76 16.35 11.68
A (12)
A (26)
A (48)A (54) A (64)
A (64)B (13)
B (29)
B (50)B (60) B (69) B (72)
C (70)
C (35)
C (29)C (33) C (26)
C (67)
DFA Small Cap Core Equity
Inception Date: 12/31/2018 Strategy AUM: $26.7B Vehicle AUM: $2.1B Fee Schedule: 0.30% on all assets
D.1

51
Morgan Stanley International Value Equity
Inception Date: 9/30/2001 Strategy AUM: $6.9B Vehicle AUM: $2.2B Fee Schedule: 0.75% on the first $25 million 0.65% on the next $50 million 0.60% on the next $25 million 0.45% on the balance
Last Quarter Last Year Last 3 Years Last 5 Years Last 10 Years Since 9/30/01(10)
0
10
20
30
40
50
60
70
80
Group: Callan Non-US Developed Value EquityReturns for Periods Ended March 31, 2021
10th Percentile 11.53 69.14 6.41 9.41 7.30 10.2225th Percentile 9.16 60.90 6.01 9.04 6.35 8.36
Median 7.75 52.59 4.06 8.56 5.46 7.7375th Percentile 6.62 42.93 3.09 6.83 4.69 6.8790th Percentile 6.04 39.11 1.30 6.43 3.90 6.66
Morgan Stanley - Gross A 1.05 42.23 6.86 9.07 6.68 7.80Morgan Stanley - Net B 0.91 41.42 6.21 8.39 6.00 7.08
MSCI EAFE Index C 3.48 44.57 6.02 8.85 5.52 6.47
A (100)
A (80)
A (1) A (20)A (18) A (47)
B (100)
B (81)
B (15)B (51)
B (36) B (66)C (99)
C (65)
C (20)
C (28)
C (48) C (97)
D.1

52
Artisan International Growth Equity
Inception Date: 12/31/2002 Strategy AUM: $21.2B Vehicle AUM: $1.3B Fee Schedule: 0.80% on all assets
Last Quarter Last Year Last 3 Years Last 5 Years Last 10 Years12/31/02
Since(10)
0
10
20
30
40
50
60
70
80
Group: Callan Non-US Broad Growth EquityReturns for Periods Ended March 31, 2021
10th Percentile 4.17 66.55 14.65 16.18 10.60 11.1425th Percentile 3.21 59.16 13.07 13.99 9.29 10.52
Median 1.65 53.96 10.89 12.52 8.34 9.7075th Percentile 0.40 48.12 9.19 10.81 7.19 9.2790th Percentile (0.94) 41.92 7.69 9.99 6.72 8.84
Artisan - Gross A 0.63 39.24 8.79 10.13 8.31 9.57Artisan - Net B 0.43 38.14 7.92 9.18 7.31 8.53
MSCI EAFE Index C 3.48 44.57 6.02 8.85 5.52 7.56
A (73)
A (94)
A (81) A (86) A (50) A (52)
B (75)
B (95)
B (88) B (93) B (70) B (99)C (21)
C (84)
C (93) C (94) C (100) C (100)
D.1

53
TimesSquare International Small Cap Equity
Inception Date: 3/31/2019 Strategy AUM: $3.4B Vehicle AUM: $218.5M Fee Schedule: 0.85% on all assets
Last Quarter Last Year Last 3 Years Last 5 Years Last 9 Years(10)
0
10
20
30
40
50
60
70
80
90
Group: Callan International Small CapReturns for Periods Ended March 31, 2021
10th Percentile 9.99 77.83 10.07 14.62 13.0525th Percentile 7.70 68.85 8.53 12.35 11.86
Median 5.01 63.77 5.70 10.52 10.7275th Percentile 3.29 59.37 4.12 9.67 9.2790th Percentile (0.25) 57.11 2.86 7.45 8.61
TimesSquare - Gross A 0.13 60.36 3.69 10.18 11.65TimesSquare - Net B 0.13 59.36 2.88 9.30 10.75
EAFE Small Cap Index C 4.50 61.98 6.32 10.50 9.72
A (86)
A (68)
A (79)A (66)
A (29)
B (86)
B (75)
B (90)B (79)
B (48)C (56)
C (59)
C (41)C (51)
C (71)
D.1

54
Parametric Emerging Markets Equity
Inception Date: 9/30/2010 Strategy AUM: $3.0B Vehicle AUM: $873.0M Fee Schedule: 0.78% on all assets
Last Quarter Last Year Last 3 Years Last 5 Years Since 9/30/10(10)
0
10
20
30
40
50
60
70
80
90
Group: Emerging Markets Equity DBReturns for Periods Ended March 31, 2021
10th Percentile 7.58 80.01 14.93 18.64 13.6025th Percentile 5.58 72.62 11.05 15.81 10.35
Median 2.97 63.31 7.31 12.97 8.3875th Percentile 1.21 56.36 5.08 10.49 7.0890th Percentile (1.35) 47.44 1.42 7.76 5.69
Parametric - Gross A 2.08 53.02 1.25 7.44 5.20Parametric - Net B 1.88 51.84 0.46 6.61 4.30
MSCI Emerging Markets Index C 2.29 58.39 6.48 12.07 6.50
A (65)
A (83)
A (91)A (92) A (94)
B (68)
B (84)
B (93)B (95) B (97)
C (62)
C (68)
C (58)C (58) C (80)
D.1
55
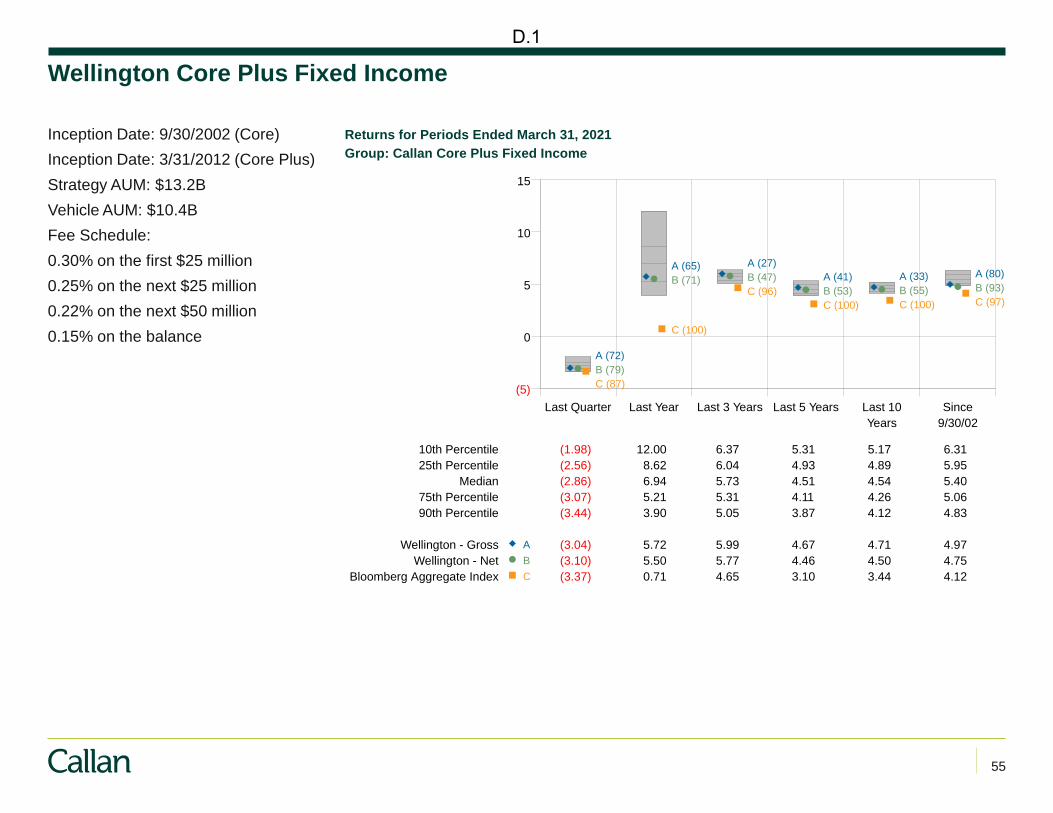
Wellington Core Plus Fixed Income
Inception Date: 9/30/2002 (Core) Inception Date: 3/31/2012 (Core Plus) Strategy AUM: $13.2B Vehicle AUM: $10.4B Fee Schedule: 0.30% on the first $25 million 0.25% on the next $25 million 0.22% on the next $50 million 0.15% on the balance
Last Quarter Last Year Last 3 Years Last 5 YearsYears
Last 109/30/02Since
(5)
0
5
10
15
Group: Callan Core Plus Fixed IncomeReturns for Periods Ended March 31, 2021
10th Percentile (1.98) 12.00 6.37 5.31 5.17 6.3125th Percentile (2.56) 8.62 6.04 4.93 4.89 5.95
Median (2.86) 6.94 5.73 4.51 4.54 5.4075th Percentile (3.07) 5.21 5.31 4.11 4.26 5.0690th Percentile (3.44) 3.90 5.05 3.87 4.12 4.83
Wellington - Gross A (3.04) 5.72 5.99 4.67 4.71 4.97Wellington - Net B (3.10) 5.50 5.77 4.46 4.50 4.75
Bloomberg Aggregate Index C (3.37) 0.71 4.65 3.10 3.44 4.12
A (72)
A (65) A (27)A (41) A (33) A (80)
B (79)
B (71) B (47)B (53) B (55) B (93)
C (87)
C (100)
C (96)C (100) C (100) C (97)
D.1

56
Western Asset Intermediate Credit Fixed Income
Inception Date: 9/30/2001 (Core Plus) Inception Date: 3/31/2014 (Int. Credit) Strategy AUM: $22.9B Vehicle AUM: $20.1B Fee Schedule: 0.30% on the first $100 million 0.15% on the balance
QuarterLast Last Year
YearsLast 3
YearsLast 5
YearsLast 10
9/30/01Since
(5)
0
5
10
15
Group: Callan Intermediate Fixed IncomeReturns for Periods Ended March 31, 2021
10th Percentile (1.34) 6.01 5.21 3.71 3.73 4.7025th Percentile (1.55) 5.05 5.04 3.41 3.41 4.50
Median (1.76) 3.57 4.70 3.19 3.24 4.2975th Percentile (1.87) 2.81 4.39 2.85 3.05 4.1390th Percentile (2.03) 0.72 4.01 2.49 2.67 3.96
Western Asset - Gross A (1.50) 12.93 6.61 5.12 4.84 5.61Western Asset - Net B (1.57) 12.61 6.29 4.81 4.55 5.33
Bloomberg Intermediate Credit Index C (2.07) 7.39 5.21 3.75 3.86 4.74
A (20)
A (1)
A (1)A (1) A (1)
A (1)
B (28)
B (1)
B (1)B (1) B (1)
B (1)
C (94)
C (1)
C (11)C (9) C (4)
C (8)
D.1

57
Colchester Global Fixed Income
Inception Date: 3/31/2014 Strategy AUM: $25.4B Vehicle AUM: $5.1B Fee Schedule: 0.60% on the first $25 million 0.50% on the next $25 million 0.35% on the next $100 million 0.30% on the balance
Last Quarter Last Year Last 3 Years Last 5 Years3/31/14Since
YearsLast 10
(10)
(5)
0
5
10
15
20
25
Group: Callan Global Fixed Income (Unhedged)Returns for Periods Ended March 31, 2021
10th Percentile (1.95) 18.29 5.39 5.75 5.30 5.0325th Percentile (3.68) 11.72 4.22 4.24 3.17 3.40
Median (4.36) 8.70 3.49 3.50 2.56 2.8075th Percentile (5.16) 5.06 2.93 2.81 2.21 2.4190th Percentile (5.74) 2.32 1.99 2.31 1.75 2.14
Colchester - Gross A (5.91) 9.07 2.94 3.27 2.44 3.33Colchester - Net B (6.01) 8.61 2.51 2.82 1.99 2.93
Citi World Govt Bond Index C (5.68) 1.82 2.09 2.15 1.55 1.66
A (92)
A (44)
A (75) A (56) A (59) A (27)
B (92)
B (51)
B (84) B (75) B (82) B (49)
C (89)
C (92)C (89) C (93) C (94) C (97)
D.1

58
UBS Trumbull Property Fund
Inception Date: 3/31/2013 Fund NAV: $14.4B Fee Schedule: 0.955% on the first $10 million 0.825% on the next $15 million 0.805% on the next $25 million 0.79% on the next $50 million 0.67% on the next $150 million 0.60% on the next $150 million 0.56% on the next $200 million 0.52% on the balance 25% Loyalty Incentive Fee for 4 years Effective 1/1/20
QuarterLast Last Year
YearsLast 3
YearsLast 5
3/31/13Since
YearsLast 10
(7.5)
(5.0)
(2.5)
0.0
2.5
5.0
7.5
10.0
12.5
Group: Callan Open End Core Cmmingled Real EstReturns for Periods Ended March 31, 2021
10th Percentile 2.47 7.70 7.23 7.58 9.03 11.0125th Percentile 2.04 3.77 5.80 6.44 8.78 9.34
Median 1.61 2.15 4.82 5.69 8.19 8.6775th Percentile 1.37 0.82 3.88 4.74 7.50 8.0690th Percentile 1.06 (1.53) 2.79 4.21 6.96 7.56
UBS Trumbull Property Fund - Net A 1.09 (3.86) (0.78) 1.74 5.04 5.94NFI-ODCE Equal Weight Index B 2.07 2.12 4.41 5.64 8.20 8.88
A (89)
A (96)
A (100)
A (100)
A (99)A (99)
B (24) B (51)
B (56)B (51)
B (50)B (41)
D.1

59
AEW Core Property Trust
Inception Date: 3/31/2013 Fund NAV: $7.1B Fee Schedule: 1.10% on the first $10 million 1.00% on the next $15 million 0.85% on the next $25 million 0.80% on the next $50 million 0.75% on the balance
Last Quarter Last Year Last 3 Years Last 5 Years3/31/13Since
YearsLast 10
(5.0)
(2.5)
0.0
2.5
5.0
7.5
10.0
12.5
Group: Callan Open End Core Cmmingled Real EstReturns for Periods Ended March 31, 2021
10th Percentile 2.47 7.70 7.23 7.58 9.03 11.0125th Percentile 2.04 3.77 5.80 6.44 8.78 9.34
Median 1.61 2.15 4.82 5.69 8.19 8.6775th Percentile 1.37 0.82 3.88 4.74 7.50 8.0690th Percentile 1.06 (1.53) 2.79 4.21 6.96 7.56
AEW Core Property Trust - Net A 1.92 3.56 4.34 5.42 7.64 8.38NFI-ODCE Equal Weight Index B 2.07 2.12 4.41 5.64 8.20 8.88
A (35)
A (29)A (59)
A (55)
A (63)A (64)
B (24)B (51)
B (56)B (51)
B (50)B (41)
D.1

60
BlackRock TIPS Index Fund
Inception Date: 6/30/2015 Strategy AUM: $50.7B Vehicle AUM: $13.6B Fee Schedule: 0.03% on all assets
Last Quarter Last Year Last 3 Years6/30/15Since Last 5 Years Last 10 Years
(5)
0
5
10
15
20
Group: Real Returns DatabaseReturns for Periods Ended March 31, 2021
10th Percentile 0.32 16.42 7.64 5.22 5.40 4.4525th Percentile (1.16) 9.21 6.27 4.29 4.38 3.78
Median (1.31) 7.98 5.71 3.90 3.93 3.5175th Percentile (1.56) 7.45 5.65 3.82 3.88 3.4590th Percentile (1.76) 7.27 5.35 3.64 3.81 3.12
BlackRock TIPS - Gross A (1.46) 7.85 5.82 3.95 4.03 3.56BlackRock TIPS - Net B (1.46) 7.81 5.78 3.92 4.00 --
Bloomberg US TIPS Index C (1.47) 7.54 5.68 3.81 3.86 3.44
A (57)
A (56)A (44)
A (39) A (44) A (45)
B (57)
B (57)B (46)
B (42) B (46)
C (58)
C (66)C (69)
C (81) C (88)C (77)
D.1

61
BlackRock REITs Index Fund
Inception Date: 9/30/2017 Strategy AUM: $1.5M Vehicle AUM: $1.5M Fee Schedule: 0.06% on all assets
QuarterLast Last Year
9/30/17Since
YearsLast 3
YearsLast 5
YearsLast 10
(10)
0
10
20
30
40
50
60
Group: Callan Real Estate Mutual FundsReturns for Periods Ended March 31, 2021
10th Percentile 10.25 47.33 9.80 13.06 8.64 10.0325th Percentile 9.07 39.70 8.26 11.30 7.04 9.18
Median 7.89 35.38 6.77 9.72 5.82 8.2975th Percentile 6.68 31.32 5.56 8.32 4.86 7.7290th Percentile 5.50 28.79 4.85 7.42 3.93 6.86
BlackRock REITs - Gross A 9.99 36.65 4.75 7.59 3.97 7.85BlackRock REITs - Net B 9.97 36.58 4.68 7.52 -- --
S&P Dow Jones US Select REIT Index C 10.00 36.66 4.71 7.55 3.94 7.89
A (13)
A (36)
A (91)A (88)
A (88) A (68)B (13)
B (36)
B (91)B (89)
C (13)
C (36)
C (91)C (89)
C (88)
C (65)
D.1

62
Invesco Balanced Risk Commodities Fund
Inception Date: 6/30/2016 Strategy AUM: $1.8B Vehicle AUM: $0.6B Fee Schedule: 0.70% on all assets
Last Quarter Last Year Last 3 Years6/30/16Since Last 5 Years
YearsLast 10
(20)
0
20
40
60
80
100
Group: Callan CommoditiesReturns for Periods Ended March 31, 2021
10th Percentile 13.73 77.57 8.87 11.72 13.07 1.0225th Percentile 9.89 54.09 3.28 3.05 5.45 (2.75)
Median 7.79 41.12 0.90 1.37 3.86 (4.91)75th Percentile 7.41 37.15 0.60 0.73 3.15 (5.66)90th Percentile 5.35 34.51 (3.84) (0.37) 2.09 (8.13)
Invesco - Gross A 7.31 55.86 3.34 2.78 5.46 (2.07)Invesco - Net B 7.13 54.79 2.62 2.05 -- --
Bloomberg Commodity Index C 6.91 34.90 (1.56) (1.31) 1.14 (6.84)
A (82)
A (19)
A (25) A (26) A (25)
A (17)B (83)
B (23)
B (29) B (34)C (84)
C (89)
C (85) C (95)C (96)
C (85)
D.1

63
KBI Global Resources Fund
Inception Date: 9/30/2016 Strategy AUM: $405.7M Vehicle AUM: $99.9M Fee Schedule: 0.85% on all assets
0
20
40
60
80
100
120
Returns for Periods Ended March 31, 2021
Ret
urns
Last Quarter Last Year Since 9/30/16 Last 3 Years Last 5 Years Last 10 Years
KBI - Gross KBI - Net
S&P Global Natural Resources Index KBI Custom Benchmark
9.6
90.8
15.6 17.1 15.3
7.09.4
89.2
14.6 16.111.6
66.4
8.94.7
10.6
0.53.9
94.5
17.320.7
17.1
8.3
D.1