Embed Size (px)
Citation preview
Contents copyright ©2007 by SAGE publications All right reserved
Apart from fair dealing for the purposes of research or private study, or criticism or review, and only as permitted under the Copyright Designs and Patents Act, 1988, this publication may only be reproduced, stored or transmitted in any form or by means, with the prior permission in writing of the publishers, or in the case of reprographic reproduction, in accordance with the terms of licenses issued by the Copyright Licensing Agency. Inquiries concerning reproduction outside those terms should be sent to the publishers.
SAGE Publications is a member of CrossRef
The final, definitive version of this paper has been published in Textile Research Journal, 77/10, October/2007 by <<SAGE Publications Ltd.>>/<<SAGE Publications, Inc.>>, All rights reserved. © Copyright 2007.
This article is also available online at: http://trj.sagepub.com/cgi/reprint/77/10/770

Textile Research Journal Article
Using Fiber Elongation to Improve Genetic Screening in Cotton Breeding Programs
Abstract In this study, the bundle elongation and tenacity of cotton fibers were measured using a modified ten,ile testing instrument to which Pressley clamps (1 /8" gage length) were adapted. 32 cotton genotypes with a range of bundle tenacity and elongation wcre carefully selected based on their diMinct physiCltl properties. The work of rupture was calculated from the load vs. elongation curves for each type of cottOIl. Results demonstrated the importance of fiber bundle elongation in the work of rupture of fiber bundles. which is critically important to processing performance. ntis study lay a foundation for future efforts to calibrate the high volume instrument elongation measurement:; and to breed new cultivars with improved work of rupture. This should result in lower fiber breakage when the cotton fibers are submitted to different mechanical stresses (ginning. carding. pinning, and weaving).
Key words tenacity, elongation, cotton, work of rupture
Cotton hreeding programs must strive to deliver fibers that perform butter in textile manufacturing [1 - 3}. This is criticnl for effective competition with the various man-made fibers and \\ ith internal ional growths of coUon. Yet . several fiher properties not measured in the cotton breeding program~ hnve a large impact on processing performance. Among th c..o,;c arc the elungation characteristics associated wi th fiber tenacity. Backe 141 showed the importance of cotton fiber hundle elongation on yam quality and weaving pcrfonnancco,;. The author concluded that cotton fiber bundle elongation should be measured and seriously considered when l1e\'cloping cotton lay-downs. He reported that the higher the cotton fihcr bundle elongation. aU other fiher properties remaining cum,rant. the better the yam'!' qlIH lity and resistance to th r..: stressc-o;; and :-. trains of weaving. Inheritance o f co tton fiber tenacity ha~ been studied l'xt t.! n~ ivdy . ~ I ay and Jividen [I I reported that " heritability (If fiher tenacity i'i gcnaally high for se kct ion units ranging
Textile Research Journal \0 ""'71'Cl 71~778 001 101177dXll.0517507030t3Q F'9urc JPpeJrs 1'1 color on:lnc hllp Ilr .sClgepub (om
H. Benzina International Texltle Center and Department of Plant & Soil Science. Texas Tech University. Lubbock. TX 79403-5019. U.SA . ENSITMlLPMT. I I. rue Alfred Werner. 68093 Mulhause. France
E. Hequet and N. Abidi 1
International Texllle Center and Department of Plant & Sol! Science. Texas Tech University. Lubbock. TX 79403-5019. U.S.A.
J. Gannaway Texas A&M University Experiment Station. Lubbock. TX 79403. U.S.A.
J.-Y. Drean and O. Harzallah ENSfTMILPMT. I I. rue Alfred Werner. 68093 Muthause. France
from single plants to popu lation bulks." They reported that, among 18 studies undertaken beh.veen 1954 and 1994, the narrow sense heritability for fiber tenacity ranged from 0.10 to 0.86. The same authors reported that for fiber elongation the narrow sense heritability ranged from 0.36 to 0.90. May and Taylor [5J also reported negative correlations hetween fiber elongation and fiber tenacity.
In general, most of the breeders simply ignore fiber elongation because the lack of calibration procedures for high volume instrument (HVI ) elongation makes it impossible to rely on such data. In addition. the literature produced b) cotton breeders shows that even when elongation meClsurements are available (Stelomctcr tes ts) Lhere is a lack of understanding of their meaning. Indeed, because of I
I Corresponding autbor. Tel. : SOt'l 747 3790: fax: 806 747 3796; n .abidj~ ttu.cJu
ww\v tr ,SCl gepub (OfTI' 2ot7 SAGE Pubi tailOrs

Using Fiber Elongation to Improve Genetic Screening in Cotton Breeding Programs H. Benzina et al. 771 IiiD
the negative correlation between elongation and tenacity. they often conclude that there is no need to work on elongation because it could result in lower tenacity. However, an exclusive focus on breaking strength (tenacity) is erronCOllS. The work of rupture is also important and the best way to improve it is to work simultaneously on tenacity and elongation.
The elongation characteristics associated with fiber tenacity are of critical importance at three junctures:
I. Ginning - the cleaning and removal of fibers from the seeds create stresses that break fibers which lack sufficient tenacity and elongation, resulting in elevated short fiber content (SFC).
2. Opening and Carding - these indispensable steps prior to spinning achieve the final cleaning of the fibers and arrange them into a continuous bundle of parallel fibers (called a sliver). Again, the SFC generated by these mechanical processes is negatively correlated with fiber tenacity and elongation.
3. Weaving - forming the spun yarns into a fabric on a weaving machine provides the ultimate test of yarn performance. Low levels of yarn breakage are required to achieve both the requisite weaving efficiency and fabric quality. Weaving has always been an abrasive and stressful process, but the speeds of modern weaving machines have magnified these problems.
The warp yarns are exposed to two major categories of stress: tension and dynamic fatigue. Thnsions are of three types: the initial tension, the shed opening tension, and the beating-up tension. The "initial tension" refers to the equilibrium tension kept on the warp yarns being rolled off the yarn beam and fed through the weaving machine. The "shed" refers to the path traveled by the filling yarns through the warp yams, formed by raising selected warp yarns. Actions at the shed are a major source of both tension and dynamic fatigue, caused by the very rapid opening-and-closing movements required to create the desired weaving patterns. (With a modern air-jet loom, the opening-and-closing time takes only about 20 ms, during which the yams have to elongate more than 4% without breaking.) In addition, the warp yams are simultaneously stressed by the acceleration of the fimng yarn through the shed. The (' beating-up" refers to the last operation of the loom in weaving, in which the last pick (filling yarn) inserted in the fabric is "beaten" into position against the preceding picks. All these actions generate abrasive tensions and dynamic fatigue . Given the demands made on yarns in weaving, it is clearly inadequate to rely on the traditional tenacity measurement to achieve desired performance levels. The measurement that is more appropriate for weaving performance is the work of rupture, because it captures the total energy required to break a bundle of fibers, which is a function of the combination of tenacity and elongation.
Meredith [6] reported on the amount of work required to rupture different textile fibers. The author reported that "the work of rupture is represented by the area enclosed by the stress-strain CUIVe and the strain axis and would be half the product of breaking load and breaking extension if Hooke's law were obeyed." Meredith introduced a "work factor," which was defined as the ratio of the actual work of rupture to the product of load and extension at break [6]. For a material obeying Hooke's law, the "work factor" should be equal to 0.5. Meredith studied IS international cottons. He reported that the ''work factor" ranged from 0.45 to 0.49 (data obtained on individual cotton fibers). Therefore, we can consider that the work of rupture of individual cotton fibers complies with Hooke's law. The major difference between our work and Meredith's work is that we have determined the tensile properties on fiber bundles rather on single fibers. Thus, we are dealing with more complex systems where multiple fibers interact within the bundle.
Calibration of the HVI measurement for elongation is not available; therefore, measurements among HVl machines are not comparable. This project will validate the HVl measurement for elongation against the specially equipped tensile testing instrument, and evaluate ways to calibrate the HVI measurement.
Materials and Methods
Materials
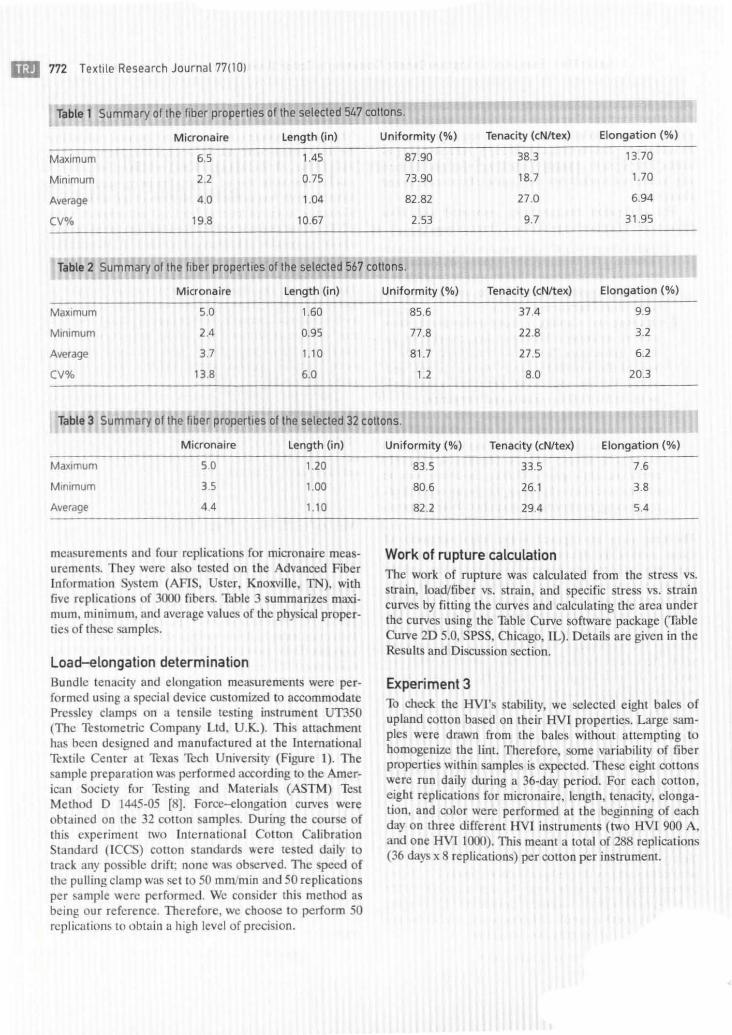
Experiment 1 Th demonstrate the association between tenacity and elongation, 547 samples from wild-type cotton genotypes and 567 cotton samples from various strain and cultivar per· formance trails grown in 2004 on the Texas High Plains were selected for comparison. The samples were tested on HVls (HVI 900A, Uster, Knoxville, TN), with 10 replications for length, uniformity, elongation, and tenacity and four replications for micronairc. Tables 1 and 2 show a summary of the fiber properties from the two sample groups.
Experiment 2 10 determine the relationship between tensile tests, 32 bales of cotton were selected based on their distinct physical properties. A representative sample of approximately 30 kg (70 Ib) was taken from each bale. Each sample was homogenized according to the protocol used by the International Cotton Calibration Standard Committee (ICCSC) [7] to produce reference cottons. From the card web produced, 10 samples were taken. The cotton samples were tested on HVls (HVI 9OOA, Ustcr, Knoxville, TN), with 10 replications for length, uniformity, tenacity, and elongation
lID 772 Te xli le Research Journal 77(10)
Table I Summary of the fiber properlies of the selecled 547 collons.
Micronaire Length (in) Uniformity (%) Tenacity (cNltex) Elongation (%)
Maximum 6.5 1.45 87.90 38.3 13.70
Minimum 2.2 0.75 73.90 18.7 1.70
Average 4.0 1.04 82.82 27.0 6.94
CV% 19.8 10.67 2.53 9.7 31.95
Table 2 Summary of the fiber properties of Ihe selecled 567 colions.
Micronaire Length (in) Uniformity (%) Tenacity (cNltex) Elongation (%)
Maximum 5.0 1.60 85.6 37.4 9.9
Minimum 2.4 0.95 77.8 22 .8 3.2
Average 3.7 1.10 81.7 27.5 6.2
CV% 13.8 6.0 1.2 8.0 20.3
Table 3 Summary of Ihe fiber properlles of Ihe selecled 32 COlions.
Micronaire Length (in)
Maximum 5.0 1.20
Minimum 3.5 1.00
Average 4.4 1.10
measurements and four replications for micronaire meas~
uremenls. They were also tested on the Advanced Fiber In formation System (AFIS, Uster, Knoxvi lle, TN), with five replications of 3000 fibers. Table 3 summarizes maximum, minimum, and average va lues of the physical properties of these samples.
Load-elongation determination Bundle tenacity and elongation measurements were performed using a special device customized to accommodate Pressley clamps on a tensile testing instrument UT350 (The Testometric Company Ltd, U.K.). This attachment has been designed and manufactured at the LnternatlOnaJ Textile Center at Thxas Tech University (Figure I). The sample preparation was performed according to the American Society for Testing and Materials (ASTM) Test Method D 1445·05 [8]. Force-elongation curves were obtained on the 32 cotton samples. During the course of this experiment two I nternational Cotton Calibration Standard (ICCS) cotton standards were tested daily to track any possible drift; none was observed. The speed of the pulling clamp was set to 50 mm/min and 50 repl ications per sample were performed. We consider this method ~s being our reference. Therefore, we choose to perform )0 replications to obtain a high level of precision.
Uniformity (%) Tenacity (cNltex) Elongation (%)
83.5 33.5 7.6
80.6 26.1 3.8
82 .2 29.4 5.4
Work of rupture calculation The work of rupture was calculated from the stress vs. strain, load/fiber vs. strain, and specific stress VS. strain curves by fitting the curves and calculating the area under the curves using the Table Curve software package (Table Curve 2D 5.0, SPSS, Chicago, IL). Details are given in the Results and Discussion section.
Experiment 3 To check the HVI's stability, we selected eight bales of upland cotton based on their HVI properties. Large samples were drawn from the bales without attempting to homogenize the lint. Therefore, some variability of fiber properties within samples is expected. These eight cottons were run daily during a 36-day period. For each couon, eight replications for micronaire, length, tenacity, elongation, and color were performed at the beginning of each day on th ree different HVI inst ruments (two HVI 900 A, and one HVI 1(00). This meant a total of 288 replications (36 days x 8 replications) per cotton per instrument.

Using Fiber Elongation to Improve Genetic Screening in Cotton Breeding Programs H. Benzina et al. 773 1m
(a)
Results and Discussion
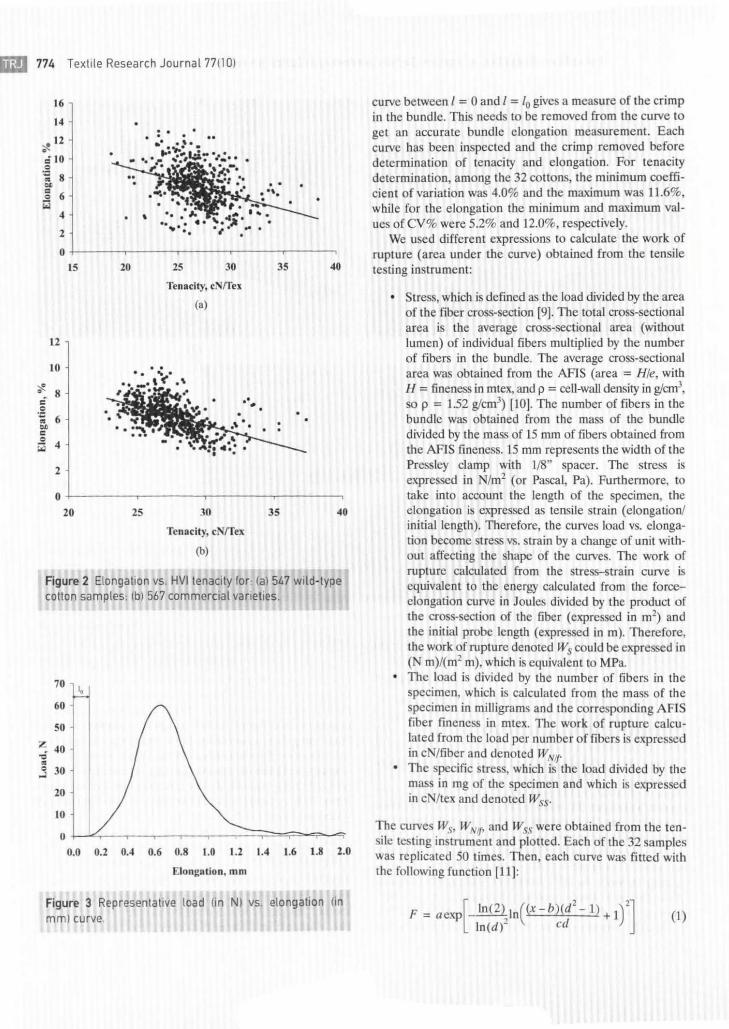
Relationship between HVI Elongation and HVI Tenacity Figure 2(a) shows the relationship between the HVI elongation and the HVI tenacity for the 547 wild-type cotton samples (elongation % = -0.302 x tenacity + 15.27, adjusted R2 = 0.131, F(l, 545) = 83.45, P < 0.00001, standard error of estimate = 2.07). Figure 2(b) shows the rclationship between the HVI elongation and the HVI tenacity of the 567 set of diverse genotypes (elongation % = -{).2822 x tenacity + 14.139, adjusted R2 = 0.251, F(], 565) = 190.85, P < 0.00001, standard error of estimate = 1.09). These fig-
(c)
(b)
~: , .
(b) ov~rviewdfthe T~stometric instrument with
ures show that there is a weak negative correlation between fiber elongation and tenacity. However, this level of correlation does not preclude simultaneous improvement of fiber tenacity and fiber elongation. Indeed, these charts demonstrate that it is possible to have strong cotton (with a tenacity of 30.0 cN/tex) and simultaneously a good elongation (between 6 and 10%).
Work of rupture Figure 3 shows a representative curve of load vs. elongation recorded with the tensile testing instrument (Testometric) for the 32 selected cotton samples as described in the Materials and Methods section. The first part of the
IiI!I 774 Textite Research Journal 77 (1 01
16
14
.12 ~ =10 = ." • 8 .. :; 6
<:;; 4
2
0
12
10
~ • 8 C .~ ;; 6 .. c = 4 <:;;
2
0
15
20
20 25 30
Tenacity, cNffes
(a)
25 30
Tenacity, cNffex
(b)
35 40
35 40
Figure 2 Elongation vs. HVl tenacity for , (a) 547 wild-lype cotton samples; (b ) 567 commercial varieties.
70 ~
60
50
z: 40 '" • = 30 ..J
20
10
0 0.0 0.2 0.4 0.6 0.8 1.0 1.2 1.4 1.6 1.8 2.0
Elongalion, mm
Figure 3 Representative load (in N) vs. elongalion (in mm) curve.
curve between I = 0 and I :::: 10 gives a measure of the crimp in the bundle. This needs to be removed from the curve to get an accurate bundle elongation measurement. Each curve has been inspected and the crimp removed before determination of tenacity and elongation. For tenacity determination, among the 32 cottons, the minimum coefficient of variation was 4.0% and the maximum was 11.6%, while for the elongation the minimum and maximum values ofCV% were 5.2% and 12.0%, respectively.
We used different expressions to calculate the work of rupture (area under the curve) obtained from the tensile testing instrument:
Stress, which is defined as the load divided by the area of the fiber cross-section [9). The total cross-sectional area is the average cross-sectional area (without lumen) of individual fibers multiplied by the number of fibers in the bundle. The average cross-sectional area was obtained from the AFlS (area = HIe, with H = fineness in mtex, and p = cell-wall density in glcm' , so p = 1.52 glcm' ) [10). The number of fibers in the bundle was obtained from the mass of the bundle divided by the mass of 15 mm of fibers obtained from the AFIS fi neness. 15 mm represents the width of the Pressley clamp with LIS" spacer. The stress is expressed in N/m' (or Pascal, Pal. Furthermore, to take into account the length of the specimen, the elongation is expressed as tensile strain (elongation! in itial length). Therefore, the curves load vs. elongation become stress vs. strain by a change of unit without affecting the shape of the curves. The work of rupture calculated from the stress-strain curve is equivalent to the energy calculated from the forceelongation curve in loules divided by the product of tbe cross-section of the fiber (expressed in m') and the initial probe length (expressed in m). Therefore, the work of rupture denoted Ws could be expressed in (N m)/(m' m), which is equivalent to MPa. The load is divided by the number of fibers in Ihe specimen, which is calculated from the mass of the specimen in milligrams and the corresponding AFIS fiber fineness in mtex. The work of rupture calculated from the load per number of fibers is expressed in eN/fiber and denoted W Nif'
The specific stress, which is the load divided by the mass in mg of the specimen and which is expressed in eN/tex and denoted Wss.
The curves Ws, WNif, and Wss were obtained from the tensile testing instrument and plotted. Each of the 32 samples was replicated 50 times. Then, each curve was fitted with the following function [J 1):
F = aexp[_ln(2), ln( X-b)(d' -I ) +1)'] In (d)- ell
(I)
Using Fiber Elongalion 10 Improve Genetic Screening in Cation Breeding Programs H. Benzina et al. 775 Iii!I
where F represents the stress, load/fiber, or specific stress, x represents the strain, a represents the amplirude of the curve, b represents the va lue al maximum stra in, c is the full width half mean, and d is the asymmelry al half-maximum. The work of rupture is calculated as the area under Ihe curve between 0 (after crimp removal) and Ihe elo ngation corresponding to the peak load.
The examination of the behavior from the tensile curves load-elongation revealed that we could approximate their shapes by a righl Ir iangle, wilh the base being Ihe elongation and the height being the peak load. Therefore, as the HVI does no t provide the load-elongation curves, the product tenacity x elongation shou ld be proportional to the work of rupture. The "work factor" was calculated for the 32 cottons. An average va lue of 0.4 was obtained. This value is lower thai the value reported by Meredith [6J (average 0.47). This difference could be attributed 10 Ihe fact that in our experiments the load and elongation were determined o n bundles of fibers while in Meredith 's experiments the load and e longation were dete rmined on single fiber.
Relationship between work of rupture and the product tenacily x elongation HVI
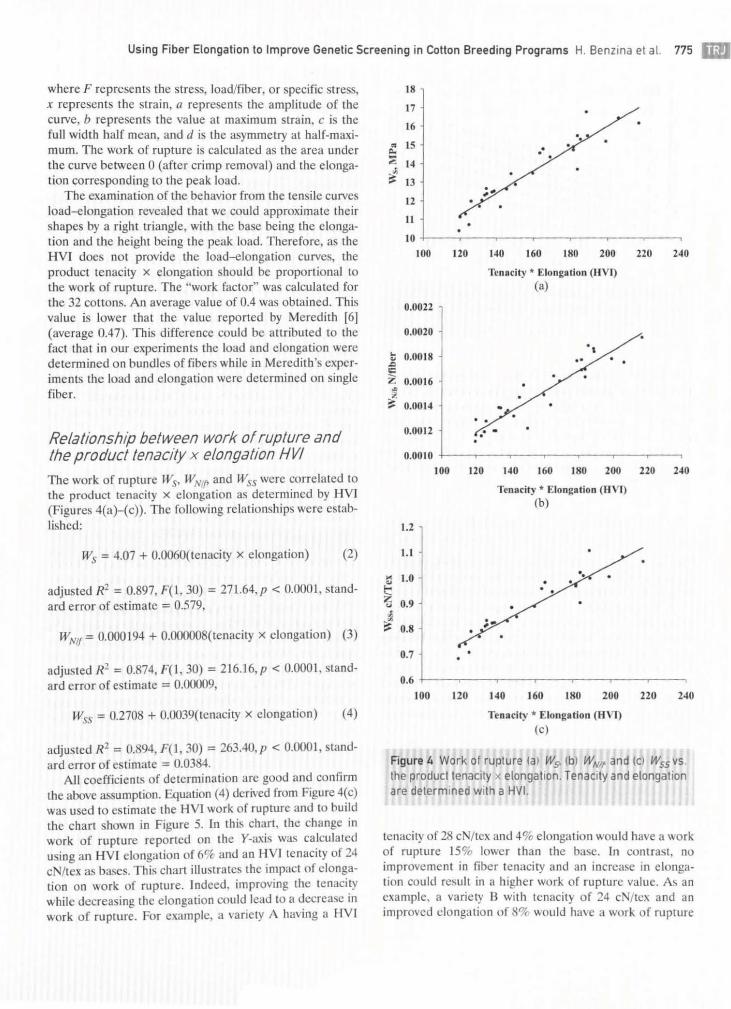
The work of rupture WS, WN,/, and Wss were correlated to the product tenacity X elongation as de termined by HVl (Figures 4(a)-(c)). The following relalionships were eSlablished:
Ws = 4.07 + O.OO6O(lenacity x e longation) (2)
adjusted R' = 0.897, F(I , 30) = 27l.64,p < 0.0001, slandard error of estimate;::: 0.579,
WNlf
= 0.000 194 + 0.OOOOO8(tenacily x elongation) (3)
adjusled R' = 0.874, F(l , 30) = 2 16.l6,p < 0.0001, slandard e rror of estimate := 0.00009,
Wss = 0.2708 + 0.OO39(lenacity x elongation) (4)
adj usled R' = 0.894, F(I, 30) = 263.40, p < O.oooJ, slandard error of estimale = 0.0384.
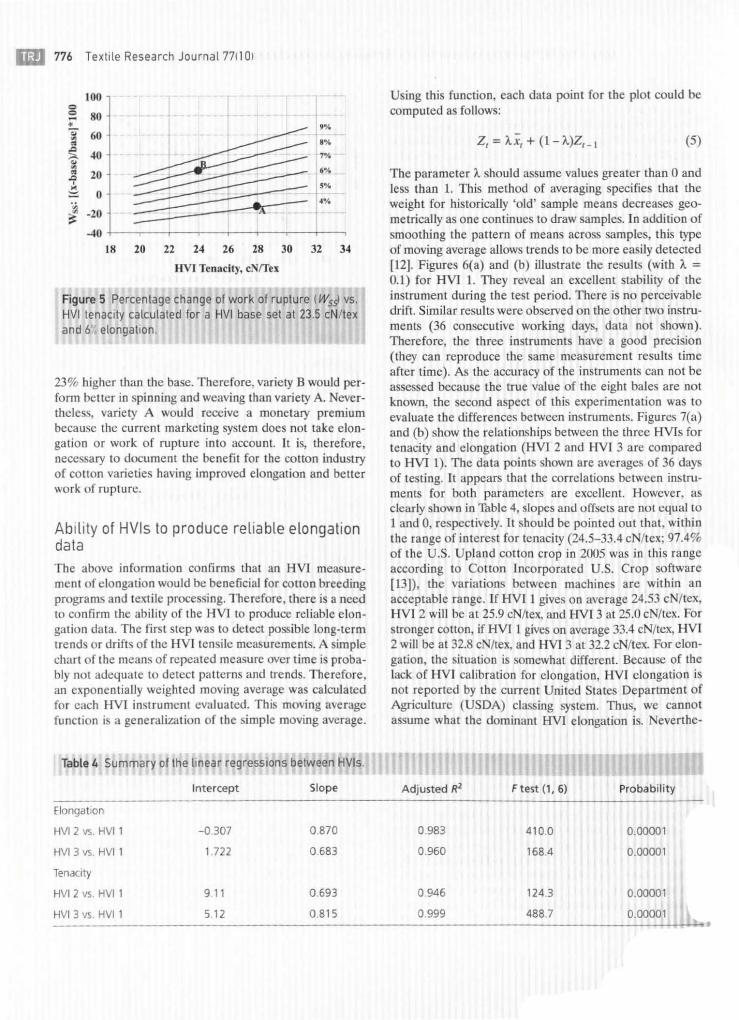
All coefficients of determination are good and confirm the above assumplion. Equation (4) derived from Figure 4( c) was used to estimate the HVI work of rupture and to build the chart shown in Figure 5. In th is chart, the change in work of rupture reported on the Y-axis was calculated using an HV I elongation of 6% and an HVl lenacily of 24 cN/lex as bases. This chart illustrates the impact of e longation on work of rupture. Indeed, improving the tenacity while decreasing the elongation could lead to a decrease in work of rupture. For example, a variety A having a HVI
18
17
16
• tS .. :; 14 • i!: 13
12
II
10
100 120
0.0022
0.0020
" 0.0018 • &>
'" Z 0.0016 ~ z
i!: 0.0014
0.0012
0.0010
100
1.2
1.1
~ 1.0 • t: '5 0.9 • • i!: 0.8
0.7
0.6
100 120
..
;.
140 160 180 200
Tenacity * Elongation (HVI) (a)
., ..
.. ...
220 240
120 140 160 180 200 220 240
Tenacity * Elongation (HVr)
;-
140
(h)
. .
160
..
180 200
Tenacity * Elongation (HVI)
(c)
220 240
Figure 4 Work of rupture lal Ws. Ib) WNlf and Ie) Wss vs. the producllenaclly x elongatIOn. Tenacity and elongation are determined with a HVI.
tenacity of 28 cN/tex and 4% elongation would have a work of rupture 15% lower than the basco In contrast, no improvement in fiber tenacity and an increase in elongation could result in a h igher work of rupture value. As an example, a variety B wi th tenacity of 24 eN/tex and an improved elo ngation of 8% would have a work of rupture
IiiI 776 Textite Research Journal 771101
100
'" '" 80 • .% ~ 60
.% • ~ 40 7% Q ~ 6% • 20 '" ~ ,%
0 .~
.%
:: -20 + -40
18 20 22 24 26 28 30 32 34
HVI Tenac ity, cNrrtx
Figure 5 Percentage change of work of rupture (Wssl vs. HVI tenacity calculated for a HVI base set at 23.5 cNl tex and 6 ~ elongation.
23% higher than the base. Therefore, variely B would perform better in spinning and weaving than variety A. Nevertheless, variety A would receive a monetary premium because the current marketing system does not take elongation or work of rupture into account. It is, therefore, necessary to document the benefit for the cotton industry of cotton varieties having improved elongation and bettcr work of rupture.
Ability of HVls to produce reliable elongation data
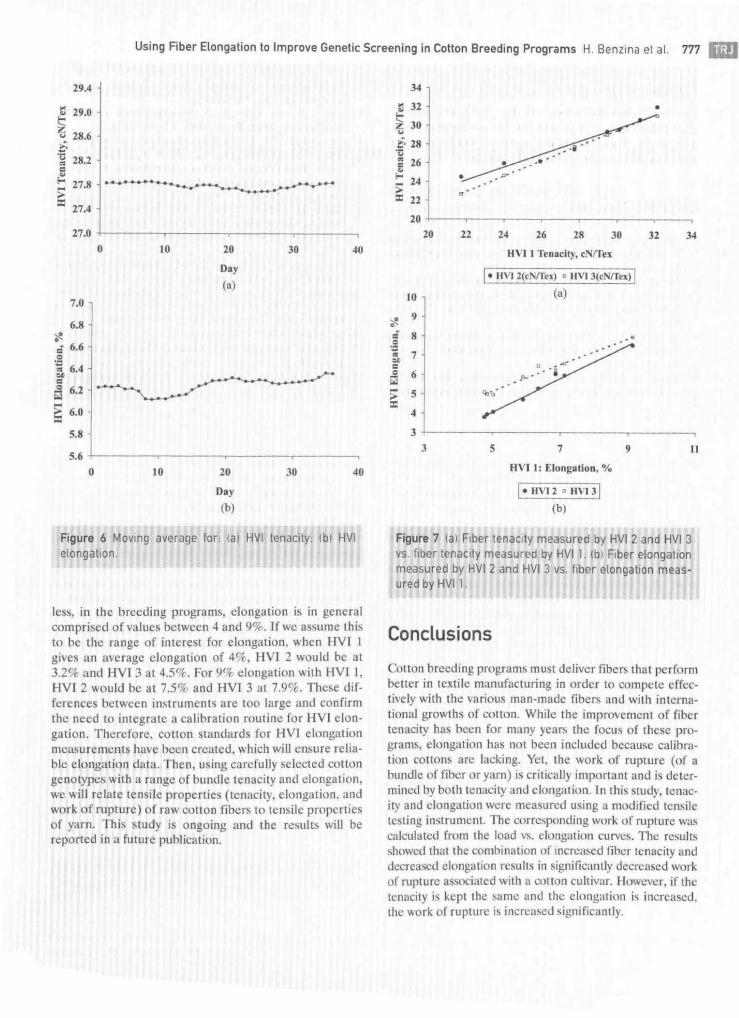
The above information confirms that an HVI measurement of elongation would be beneficial for cotton breeding programs and textile processing. Therefore, there is a need to confirm the ability of the HVI to produce reliable elongation data. The first step was to detect possible long· term trends or drifts of the HVl tensile measurements. A simple chart of the means of repeated measure over time is proba· bly not adequate to detect patterns and trends. Therefore, an exponentially weighted moving average was calculated for each HV( instrument evaluated. This moving average function is a generalization of the simple moving average.
Table 4 Summary of the linear regressions between HVls.
Using this function, each data point for the plOI could be computed as follows:
2, = AX, + (I-A)2,_1 (5)
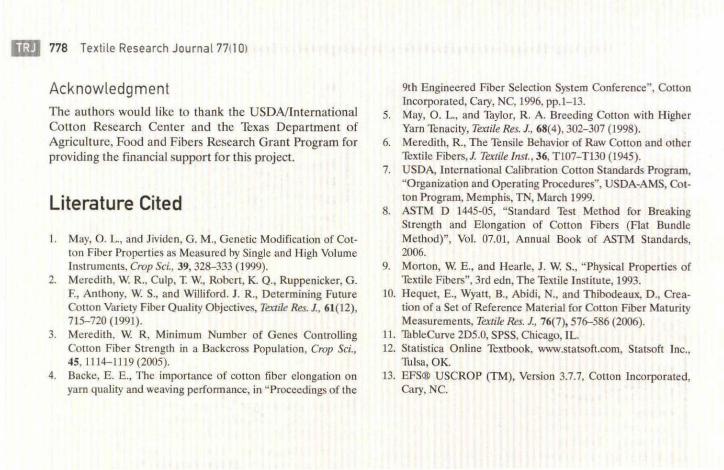
The parameter A should assume values greater than 0 and less than I. This method of averaging specifies thai the weighl for historically 'old' sample means decreases geometrically as one continues to draw samples. In additjon of smoothing the pattern of means across samples, this type of moving average allows trends to be more easily detected (12). Figures 6(a) and (b) illustrale the results (with A = 0.1) for HVI I. They reveal an excellent stability of the instrument during the test period. There is no perceivable drift. Similar results were observed on the other two instru· ments (36 consecutive working days, data not shown). Therefore, the three instruments have a good precision (they can reproduce the same measurement results time after time). As the accuracy of the instruments can not be assessed because the true value of the eight bales are not known, the second aspect of this experimentation was to evaluate the differences between instruments. Figures 7(a) and (b) show the relationships between the three HVls for lenacity and elongation (HVI 2 and HVI 3 are compared to HVI I). The dala points shown are averages of 36 days of testing. It appears that the correlations between instruments for both parameters are excellent. However, as clearly shown in Table 4, slopes and uffsets are nut equal 10 I and 0, respectively. It should be poinled out Ihat, within the range of interest for lenacity (24.5-33.4 cN/tex; 97.4% of Ihe U.S. Upland cotton crop in 2005 was in this range according 10 Cotton Incorporated U.S. Crop software [13]), the variations between machines are within an acceptable range. If HVI I gives on average 24.53 cN/tex, HVI 2 will be al 25.9 eN/lex, and HVI 3 at 25.0 cN/lex. For stronger cotton, if HVI I gives on avemge 33.4 cN/tex, HVI 2 will be at 32.8 c /Iex, and HVI 3 at 32.2 cN/lex. For elongation, the situation is somewhat different. Because of the lack of HVI calibration for elongation, HVI elongation is not reported by Ihe current Uniled States Departmenl of Agriculture (USDA) classing system. Thus, we cannot assume what the dominant HVI elongation is. evert he-
Using Fiber ELongation to Lmprove Genetic Screening in Cotton Breeding Programs H. Benzlna el al. 777 Iii!I
29.4
M 29.0 ~
t '5 28.6 i-'0 28.2 • c ~ .... 27.8 ;: .,
27.4
27.0
0 10 20 30 40
Day
<a)
7.0
6.8 ~ • r: 6.6 0 ." :. 6.4 c 0 6.2 ;;; ;: 6.0 .,
5.8
5.6
0 \0 20 30 40
Day
(b)
Figure 6 MOVing average lor, (al HVL Lenacily, Ibl HVI elongallon.
less, in the breeding programs, elongation is in general comprised of values between 4 and 9%. If we assume this to be the range of interest for elongation, when HVI J gives an average elongation of 4%, HVI 2 would be at 3.2% and HVI 3 al 4.5%. For 9% elongalion wilh HVI I, HVI 2 would be al 7.5% and HVI 3 at 7.9%. These differences between instruments are too large and confirm the need to integrate a calibration rout ine for HVI elongation. Therefore, cotton standards for HVI elongation measurements have been created, which will ensure relia· ble elongation data. Then, using carefully selected cotton genotypes with a range of bundle tenacity and elongation, we will relate tensile properties (tenacity, elongation, and work of rupture) of raw cotton fibers to tensile properties of yarn. This study is ongoing and the results will be reported in a future publication.
34
~ 32 • ~ 30 " i- 28 '0 ~ 26 • ....
24 • :> '" 22
20
20 22 24 26 28 30 32 34
HVI I T£nacity. cNnh
I_ IIVI 2(cNrru) 0 IIVI 3(cNrru) I 10 <a)
~ 9 • .;:
.~ 8 .' .. 7
" c -~ .S1 6 po.' ~. 'S .., :> 5 ~'D'
'" 4
3
3 5 7 9 II
AV1 I: Elongation, %
I. HVI 2 0 HVI3 1
(b)
Figure 7 lal Fiber tenacity measured by HVI 2 and HVI 3 vs. liber tenacity measured by HVI 1. Ib) Fiber eLongation measured by HVI 2 and HVI 3 vs. fiber eLongation measured by HVI 1.
Conclusions
Cotton breeding programs must deliver fib.n; that perfonn better in textile manufacturing in order to compete effectively with the various man·made fibers and with international growths of cotton. While the improvement of fiber tenacity has been for many years the focus of these programs, elongation has not been included because calibration cottons arc lacking. Yct , the work of rupture (of a bundle of fiber or yarn) is critically important and is determined by both tenacity and elongation. In this study, tenac· ity and elongation wcre measured using a modified tensile testing instrument. The corresponding work of rupture was calculated from the load ¥s. elongation curves. TI1C resu lt~
showed that the combination of increC:Lo;;ed fiber tenacity and decreased elongation results in significalll ly decreased work of rupture associated with a cotton cultivar. However, if lhe tenacity is kept the same and the elongation is increased. the work of rupture is increased significantly.
liD 778 Textile Research Journal 771101
Acknowledgment
The aulhors would like 10 Ihank Ihe USDNlnlernalional Cotton Research Center and the Thxas Department of Agriculture, Food and Fibers Research Granl Program for providing the financial support for this project.
Literature Cited
I. May, O. L , and Jividen, G. M., Genetic Modification of Cotton Fiber Properties as Measured by Single and High Volume Instruments, Crop Sci., 39,328-333 (1999).
2. Meredith, W. R., Culp, 1: w., Robert, K. Q" Ruppenicker, G. F., Anthony, W S., and Williford. J. R.o Determining Future Cotton Variety Fiber Quality Objectives, Textile Res. J. , 61(12), 715-720 (1991).
3. Meredith, W. R, Minimum Number of Genes Controlling Cotton Fiber Strength in a Backcross Population, Crop Sci., 45, 1114-1119(2005).
4. Backe, E. E., The importance of cotton fiber elongation on yam quality and weaving performance, in "Proceedings of the
9th Engineered Fiber Selection System Conference", Cotton Incorporated, Cary, NC, 1996, pp.I-13.
5. May, O. L. , and Taylor, R. A. Breeding Cotton with Higher Yarn Thnacity, Texlile Res. J., 68(4), 302-307 (1998).
6. Meredith, R., The Tensile Behavior of Raw Cotton and other Thxtile Fiben;, J. Textile Insl., 36, Tl07-Tl30 (1945).
7. USDA, International Calibration Cotton Standards Program, "Organization and Operating Procedures", USDA·AMS, Cot· ton Program, Memphis, TN, March 1999.
8. ASTM D 1445-05, "Standard Test Method for Breaking Strength and Elongation of Cotton Fibers (Flat Bundle Method)", Vol. 07.01, Annual Book of ASTM Standards, 2006.
9. Morton, W E., and Hearle, J. W. S., "Physical Properties of Thxtile Fibers", 3rd cdn, The 'Textile Institute, 1993.
10. Hequet , E., Wyatt, B., Abidi, N. , and Thibodeaux, D., Oeation of a Set of Reference Material for Cotton Fiber Maturity Measurements, Texlile Res. J., 76(7),576-586 (2006).
II. ThbleCurve 2D5.0, SPSS, Chicago, IL. 12. Statistica Online Textbook, www.stalSOfl.com. Statsoft Inc.,
lU isa, OK. 13. EFS® USCROP (TM), Version 3.7.7, Colton Incorporated,
Cary, NC.