Embed Size (px)
Citation preview
This document is not to be shared, distributed or reproduced in
any way without prior permission of BARC
The Planning Survey 19 – Sample, Products, Methodology and KPIs 2
Table of Contents Introduction .................................................................................................................................... 3
The sample .................................................................................................................................... 4
Sample size and make-up .................................................................................................. 4
Organization sizes by headcount ........................................................................................ 5
Vertical markets .................................................................................................................. 7
Featured products ......................................................................................................................... 8
Peer groups ................................................................................................................................. 10
Overview of the key calculations in The Planning Survey 19 ..................................................... 12
Measuring business benefits ............................................................................................ 12
Project success ................................................................................................................. 14
Means and medians .......................................................................................................... 14
Understanding multiple response questions ..................................................................... 14
Survey data collection ................................................................................................................. 15
Understanding the KPIs .............................................................................................................. 16
Reading the KPI charts ............................................................................................................... 18
The KPIs (overview) .................................................................................................................... 20
Product picklist used in The Planning Survey 19 ........................................................................ 30
About BARC ................................................................................................................................ 31
The Planning Survey 19 – Sample, Products, Methodology and KPIs 3
Introduction
The Planning Survey 19 is the largest and most thorough fact-based analysis of the planning and
budgeting market currently available. It is not based on anecdotal accounts or personal opinions, unlike
much analyst research, neither is it intended to be a measure of market shares. Instead, it sets out to
analyze market trends and produce meaningful comparisons of competing products across a wide range
of critical software and vendor-related criteria. The Planning Survey also provides a detailed quantitative
analysis of why customers buy planning tools, what they are used for, what problems they experience
with the tools and how successful they are.
This is the fifth edition of The Planning Survey. It employs the same proven methodology as The BI
Survey (formerly The OLAP Survey), which has been conducted annually since 2000. Based on the
real-world experiences of 1,367 respondents, much of its value lies in the effective analysis of such an
impressive, well-distributed sample.
The Planning Survey 19 features 22 planning products from 19 different vendors. It includes not just
products from well-known global giants such as IBM, Oracle and SAP, but also tools from much smaller
vendors that ordinarily don’t get much press but which, in many cases, offer outstanding value to
customers.
After data cleansing and removing responses from participants unable to answer specific questions
about their use of planning products, we were left with a sample of 962 end users, 233 consultants and
125 vendor and reseller employees. Participants from all over the world took part in The Planning Survey
19. 60 percent of respondents stated they have a finance and controlling job function, 22 percent have
an IT job function and the rest perform various line-of-business roles.
The findings from The Planning Survey 19 are presented in several documents, each focusing on a
specific set of the survey results.
Document Description
The Planning Survey 19 – The Results
An overview and analysis of the most important
findings and topical results from The Planning
Survey 19. Includes advice to buyers of planning
software as well as users of existing planning
solutions based on the results of our analysis.
The Planning Survey 19 – Sample, Products,
Methodology and KPIs
Provides details of the sample, the products
included and an overview of our methodology.
Descriptions of the KPIs used in The Planning
Survey 19 are also provided, including details of
our calculation methods.
The Planning Survey 19 – Vendor Performance
Summaries
A series of executive reports on each product
featured in The Planning Survey 19. Each report
contains a short vendor and product overview by
BARC’s analyst team plus a summary of the
relevant product-related results from The
Planning Survey 19.
The Planning Survey 19 – Sample, Products, Methodology and KPIs 4
The sample
Most surveys are conducted or sponsored by an organization based in, and focused on, one country.
However, planning is a worldwide market and we wanted to capture a larger international sample.
The net result was an extraordinarily international panel. Respondents were located in 55 countries. The
countries with the most respondents are Germany, the United States of America and Austria. The
regions with the most respondents are Europe, North America and Asia Pacific.
The online questionnaire was published in three languages: English, German and French.
Sample size and make-up
Many thousands of people around the world were invited to participate in The Planning Survey 19, using
BARC’s online research panel and the support of vendors and various websites. As in previous years,
the questionnaire offered different sets of questions for vendors and users (or consultants answering on
behalf of users).
The results of the online data collected are shown in the following chart, with the numbers of responses
removed also displayed.
Table 1: Responses to the survey
Responses
Total responses 1,439 100%
Filtered during data cleansing -72 -4%
Remaining after data cleansing (total answering questions) 1,367 96%
Non-user (did not answer questions about products) -47 -3%
Vendor (did not answer questions about using products) -125 -9%
Total answering product and Excel-related questions 1,195 84%
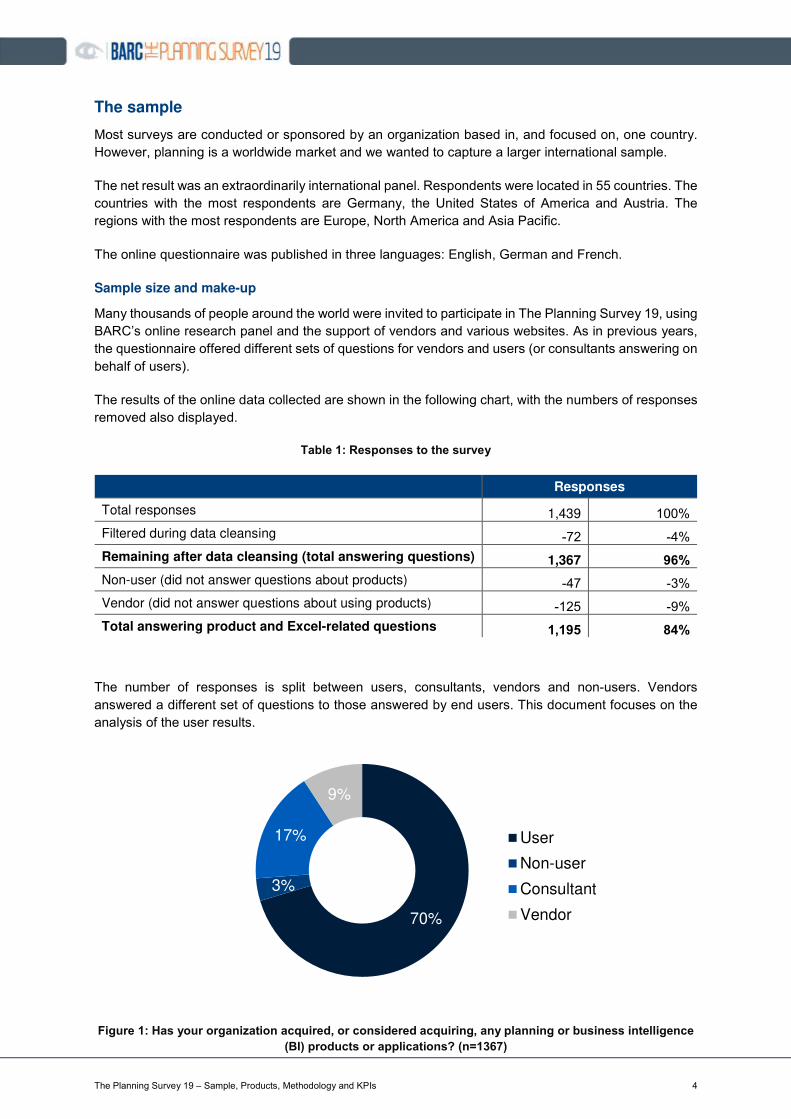
The number of responses is split between users, consultants, vendors and non-users. Vendors
answered a different set of questions to those answered by end users. This document focuses on the
analysis of the user results.
Figure 1: Has your organization acquired, or considered acquiring, any planning or business intelligence
(BI) products or applications? (n=1367)
70%
3%
17%
9%
User
Non-user
Consultant
Vendor
The Planning Survey 19 – Sample, Products, Methodology and KPIs 5
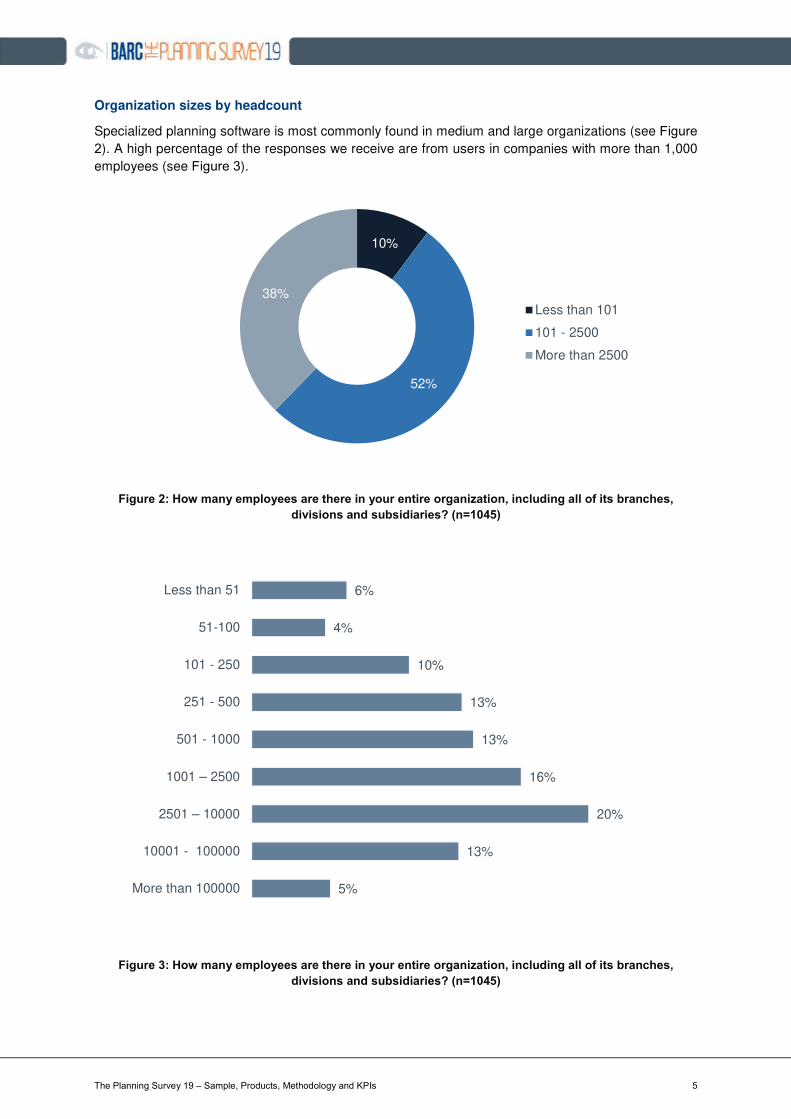
Organization sizes by headcount
Specialized planning software is most commonly found in medium and large organizations (see Figure
2). A high percentage of the responses we receive are from users in companies with more than 1,000
employees (see Figure 3).
Figure 2: How many employees are there in your entire organization, including all of its branches,
divisions and subsidiaries? (n=1045)
Figure 3: How many employees are there in your entire organization, including all of its branches,
divisions and subsidiaries? (n=1045)
10%
52%
38%
Less than 101
101 - 2500
More than 2500
6%
4%
10%
13%
13%
16%
20%
13%
5%
Less than 51
51-100
101 - 250
251 - 500
501 - 1000
1001 – 2500
2501 – 10000
10001 - 100000
More than 100000
The Planning Survey 19 – Sample, Products, Methodology and KPIs 6
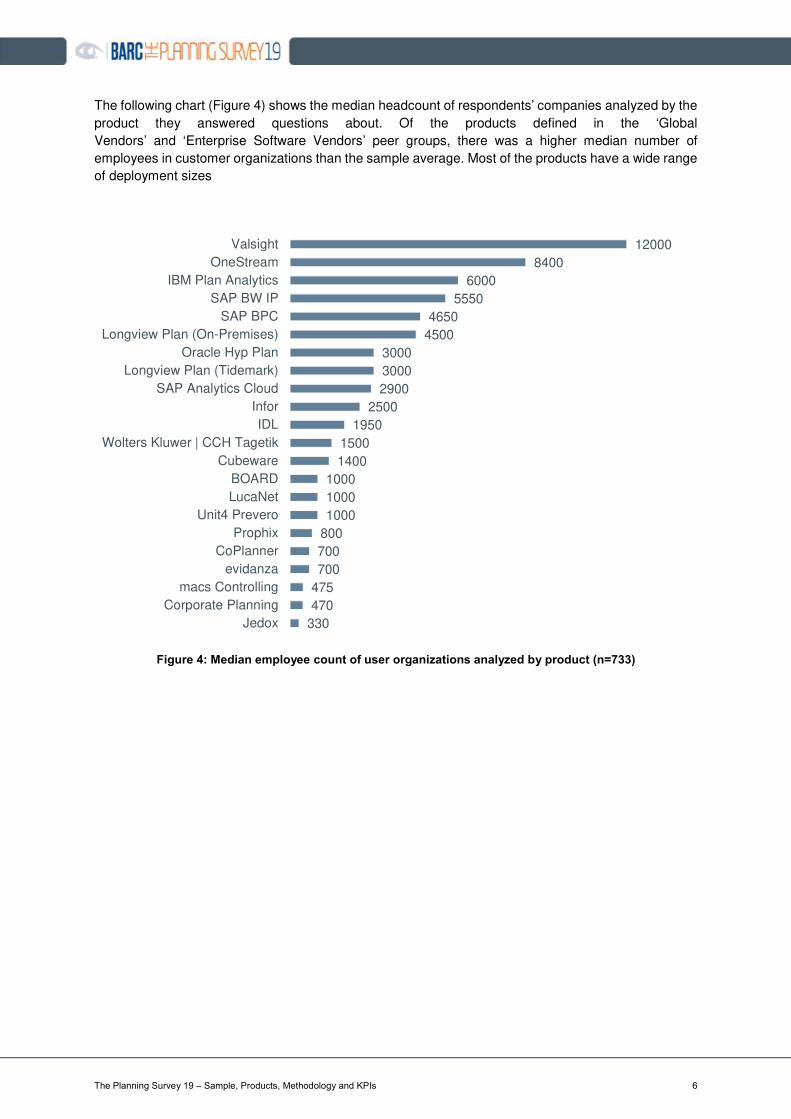
The following chart (Figure 4) shows the median headcount of respondents’ companies analyzed by the
product they answered questions about. Of the products defined in the ‘Global
Vendors’ and ‘Enterprise Software Vendors’ peer groups, there was a higher median number of
employees in customer organizations than the sample average. Most of the products have a wide range
of deployment sizes
Figure 4: Median employee count of user organizations analyzed by product (n=733)
12000
8400
6000
5550
4650
4500
3000
3000
2900
2500
1950
1500
1400
1000
1000
1000
800
700
700
475
470
330
Valsight
OneStream
IBM Plan Analytics
SAP BW IP
SAP BPC
Longview Plan (On-Premises)
Oracle Hyp Plan
Longview Plan (Tidemark)
SAP Analytics Cloud
Infor
IDL
Wolters Kluwer | CCH Tagetik
Cubeware
BOARD
LucaNet
Unit4 Prevero
Prophix
CoPlanner
evidanza
macs Controlling
Corporate Planning
Jedox
The Planning Survey 19 – Sample, Products, Methodology and KPIs 7
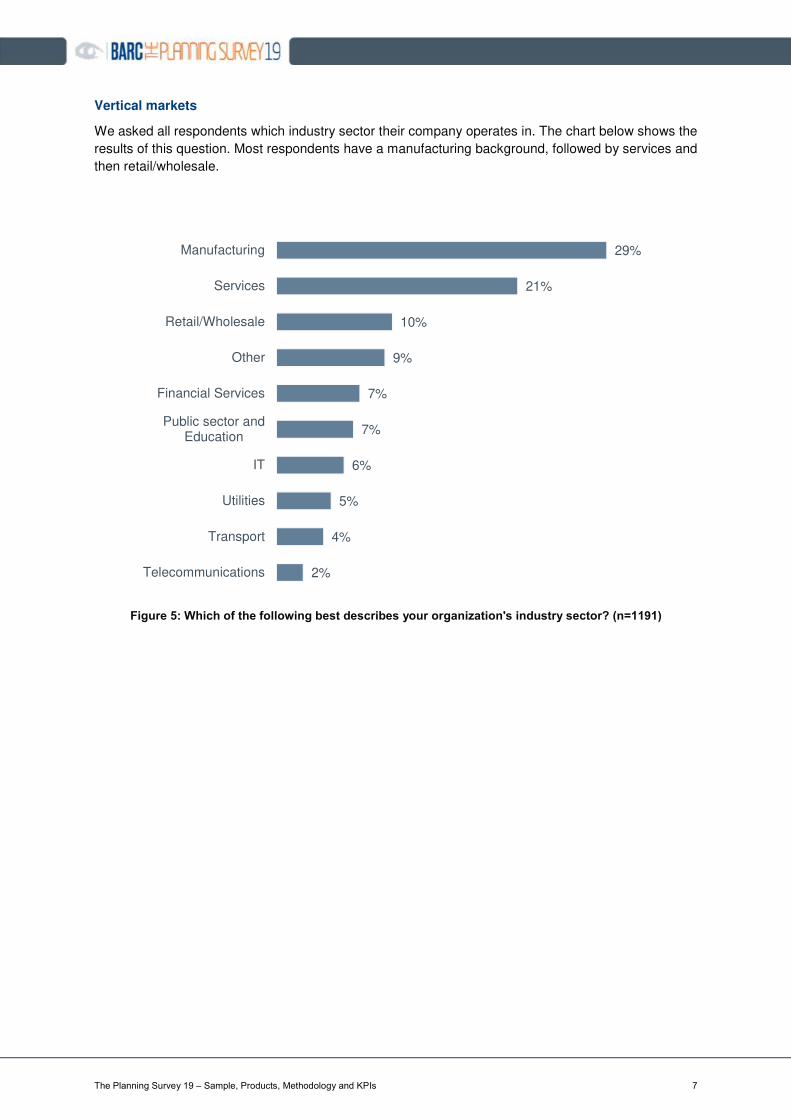
Vertical markets
We asked all respondents which industry sector their company operates in. The chart below shows the
results of this question. Most respondents have a manufacturing background, followed by services and
then retail/wholesale.
Figure 5: Which of the following best describes your organization's industry sector? (n=1191)
29%
21%
10%
9%
7%
7%
6%
5%
4%
2%
Manufacturing
Services
Retail/Wholesale
Other
Financial Services
Public sector andEducation
IT
Utilities
Transport
Telecommunications
The Planning Survey 19 – Sample, Products, Methodology and KPIs 8
Featured products
When grouping and describing the products featured in The Planning Survey, we do not strictly follow
the naming conventions the vendors use. Note that the names we use in this document are our own
and are not always the official product names used by the vendors.
One of the key reasons for this is that the products we analyze are not necessarily the latest version of
the tool. Vendors often change the product name between versions, making it difficult to have a single
official name for several versions of the same product. The point is not to challenge the naming
conventions of the vendor, but simply to reduce the complexity of the survey findings for the convenience
of the reader. In some cases, we also shorten the names of the products to improve the formatting of
the charts.
We asked respondents explicitly about their experiences with products from a predefined list, with the
option to nominate other products. This list is updated each year and is based on the sample size of the
products in the previous year, as well as additional new products on the market. Our predefined list can
be found at the end of this document. In cases where respondents said they were using an ‘other’
product, but from the context it was clear that they were actually using one of the listed products, we
reclassified their data accordingly.
We solicited responses on all surviving products with more than a minimal response in last year’s survey,
plus a few others whose numbers have potentially grown to the point where there is enough data to be
analyzed.
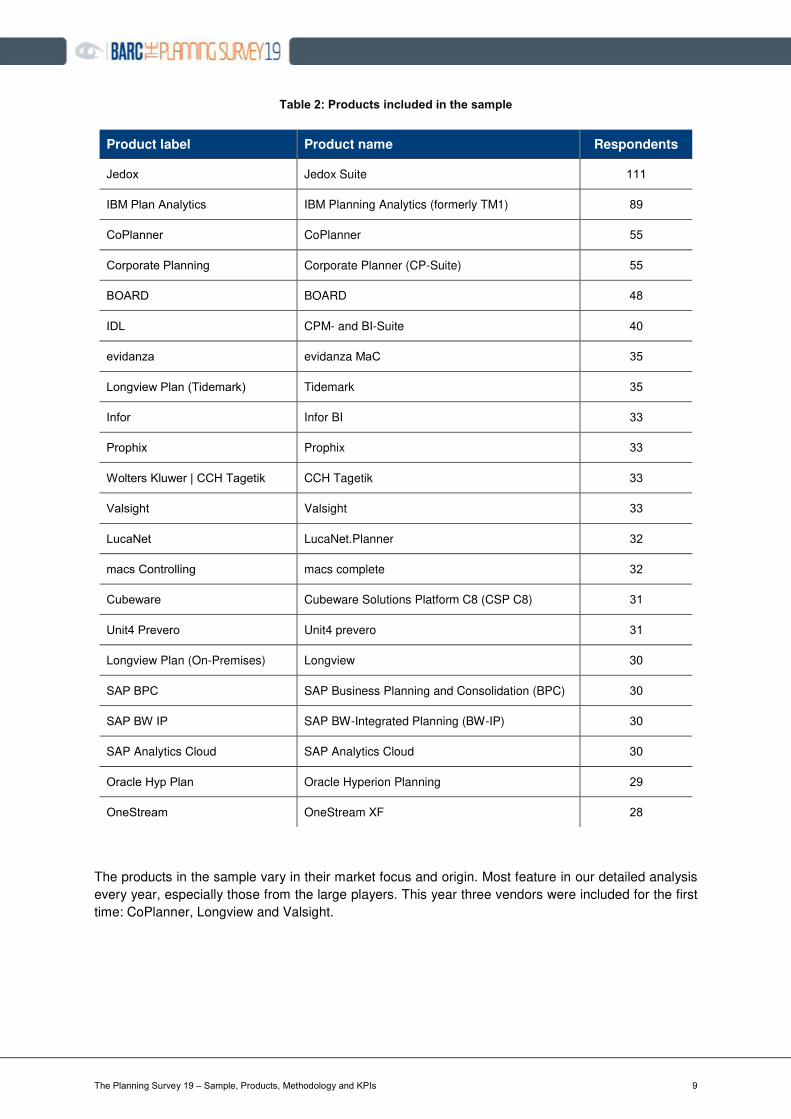
The following table shows the products included in the detailed analysis. A minimum of around 30
responses is required for a product to be included in the detailed analysis. The number of responses
about ‘other’ products is not included in the following table.
The Planning Survey 19 – Sample, Products, Methodology and KPIs 9
Table 2: Products included in the sample
Product label Product name Respondents
Jedox Jedox Suite 111
IBM Plan Analytics IBM Planning Analytics (formerly TM1) 89
CoPlanner CoPlanner 55
Corporate Planning Corporate Planner (CP-Suite) 55
BOARD BOARD 48
IDL CPM- and BI-Suite 40
evidanza evidanza MaC 35
Longview Plan (Tidemark) Tidemark 35
Infor Infor BI 33
Prophix Prophix 33
Wolters Kluwer | CCH Tagetik CCH Tagetik 33
Valsight Valsight 33
LucaNet LucaNet.Planner 32
macs Controlling macs complete 32
Cubeware Cubeware Solutions Platform C8 (CSP C8) 31
Unit4 Prevero Unit4 prevero 31
Longview Plan (On-Premises) Longview 30
SAP BPC SAP Business Planning and Consolidation (BPC) 30
SAP BW IP SAP BW-Integrated Planning (BW-IP) 30
SAP Analytics Cloud SAP Analytics Cloud 30
Oracle Hyp Plan Oracle Hyperion Planning 29
OneStream OneStream XF 28
The products in the sample vary in their market focus and origin. Most feature in our detailed analysis
every year, especially those from the large players. This year three vendors were included for the first
time: CoPlanner, Longview and Valsight.
The Planning Survey 19 – Sample, Products, Methodology and KPIs 10
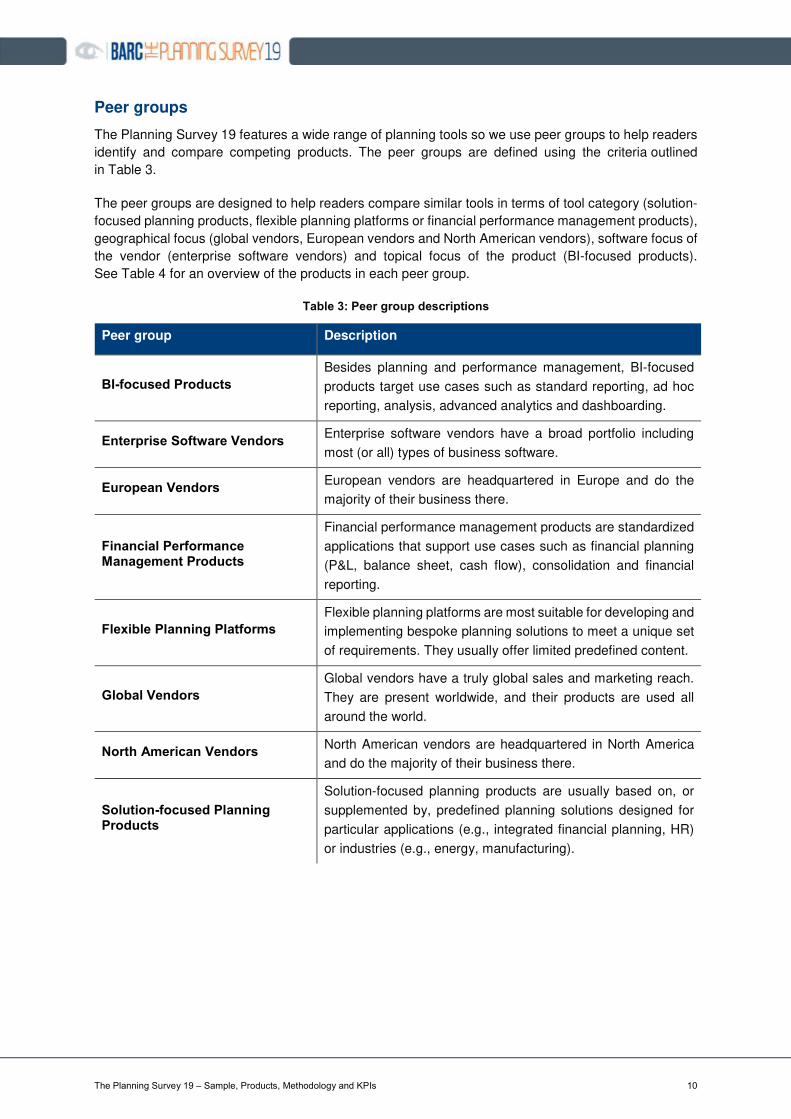
Peer groups
The Planning Survey 19 features a wide range of planning tools so we use peer groups to help readers
identify and compare competing products. The peer groups are defined using the criteria outlined
in Table 3.
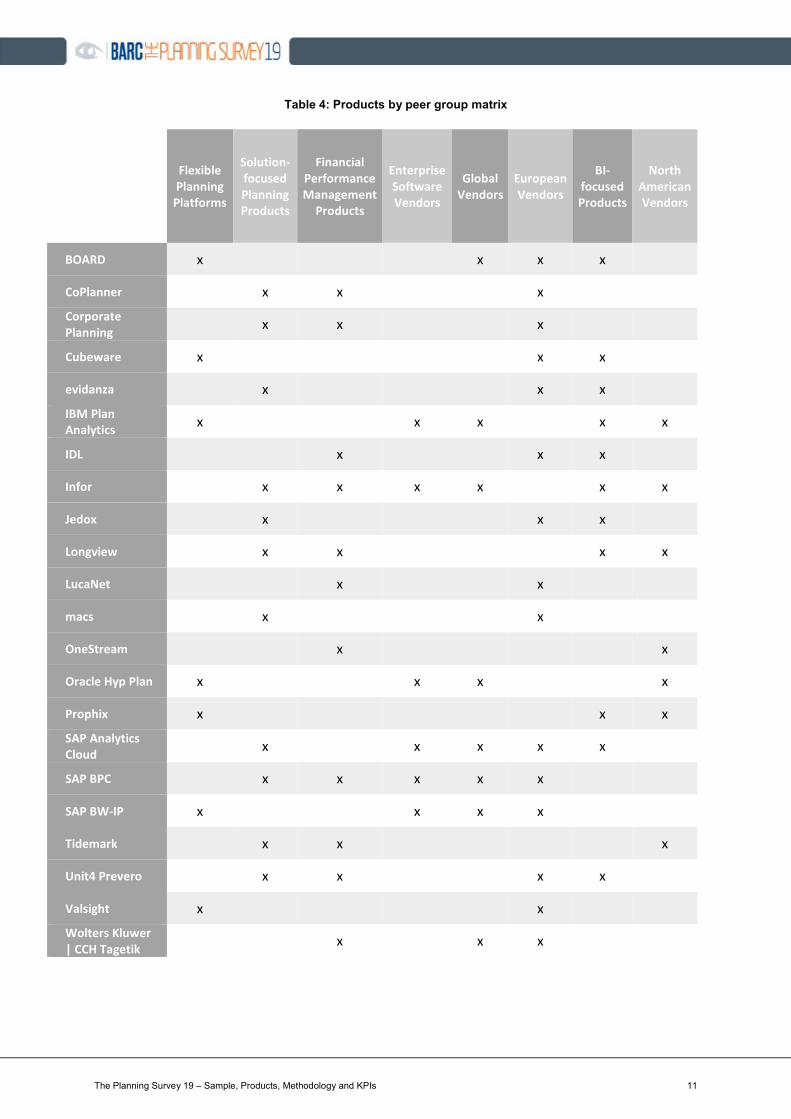
The peer groups are designed to help readers compare similar tools in terms of tool category (solution-
focused planning products, flexible planning platforms or financial performance management products),
geographical focus (global vendors, European vendors and North American vendors), software focus of
the vendor (enterprise software vendors) and topical focus of the product (BI-focused products).
See Table 4 for an overview of the products in each peer group.
Table 3: Peer group descriptions
Peer group Description
BI-focused Products
Besides planning and performance management, BI-focused
products target use cases such as standard reporting, ad hoc
reporting, analysis, advanced analytics and dashboarding.
Enterprise Software Vendors Enterprise software vendors have a broad portfolio including
most (or all) types of business software.
European Vendors European vendors are headquartered in Europe and do the
majority of their business there.
Financial Performance Management Products
Financial performance management products are standardized
applications that support use cases such as financial planning
(P&L, balance sheet, cash flow), consolidation and financial
reporting.
Flexible Planning Platforms
Flexible planning platforms are most suitable for developing and
implementing bespoke planning solutions to meet a unique set
of requirements. They usually offer limited predefined content.
Global Vendors
Global vendors have a truly global sales and marketing reach.
They are present worldwide, and their products are used all
around the world.
North American Vendors North American vendors are headquartered in North America
and do the majority of their business there.
Solution-focused Planning Products
Solution-focused planning products are usually based on, or
supplemented by, predefined planning solutions designed for
particular applications (e.g., integrated financial planning, HR)
or industries (e.g., energy, manufacturing).
The Planning Survey 19 – Sample, Products, Methodology and KPIs 11
Table 4: Products by peer group matrix
Flexible
Planning
Platforms
Solution-
focused
Planning
Products
Financial
Performance
Management
Products
Enterprise
Software
Vendors
Global
Vendors
European
Vendors
BI-
focused
Products
North
American
Vendors
BOARD x
x x x
CoPlanner x x
x
Corporate
Planning
x x
x
Cubeware x
x x
evidanza x
x x
IBM Plan
Analytics x
x x
x x
IDL x
x x
Infor x x x x
x x
Jedox x
x x
Longview x x
x x
LucaNet x
x
macs x
x
OneStream x
x
Oracle Hyp Plan x
x x
x
Prophix x
x x
SAP Analytics
Cloud
x
x x x x
SAP BPC x x x x x
SAP BW-IP x
x x x
Tidemark x x
x
Unit4 Prevero x x
x x
Valsight x
x
Wolters Kluwer
| CCH Tagetik
x
x x
The Planning Survey 19 – Sample, Products, Methodology and KPIs 12
Overview of the key calculations in The Planning Survey 19
Measuring business benefits
Business benefits are the real reason for carrying out any planning or BI project. The BI Survey and The
Planning Survey have been studying them directly for years. We ask respondents the extent to which
they realize a list of benefits.
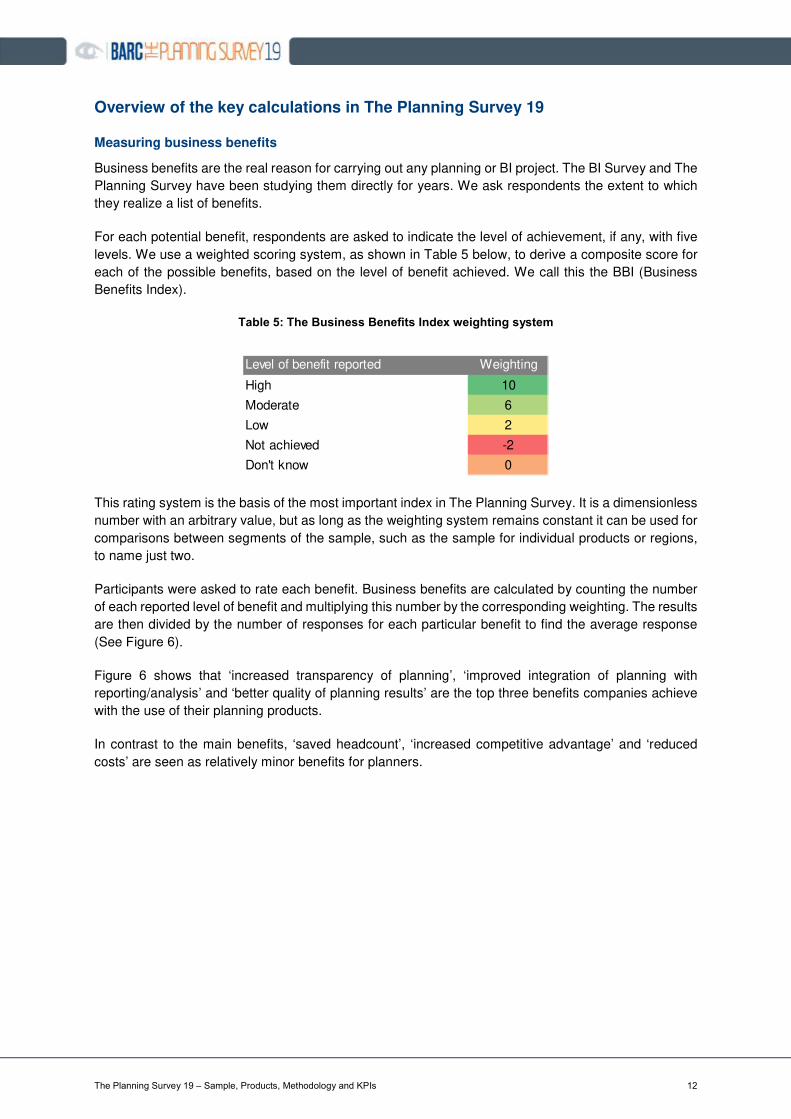
For each potential benefit, respondents are asked to indicate the level of achievement, if any, with five
levels. We use a weighted scoring system, as shown in Table 5 below, to derive a composite score for
each of the possible benefits, based on the level of benefit achieved. We call this the BBI (Business
Benefits Index).
Table 5: The Business Benefits Index weighting system
This rating system is the basis of the most important index in The Planning Survey. It is a dimensionless
number with an arbitrary value, but as long as the weighting system remains constant it can be used for
comparisons between segments of the sample, such as the sample for individual products or regions,
to name just two.
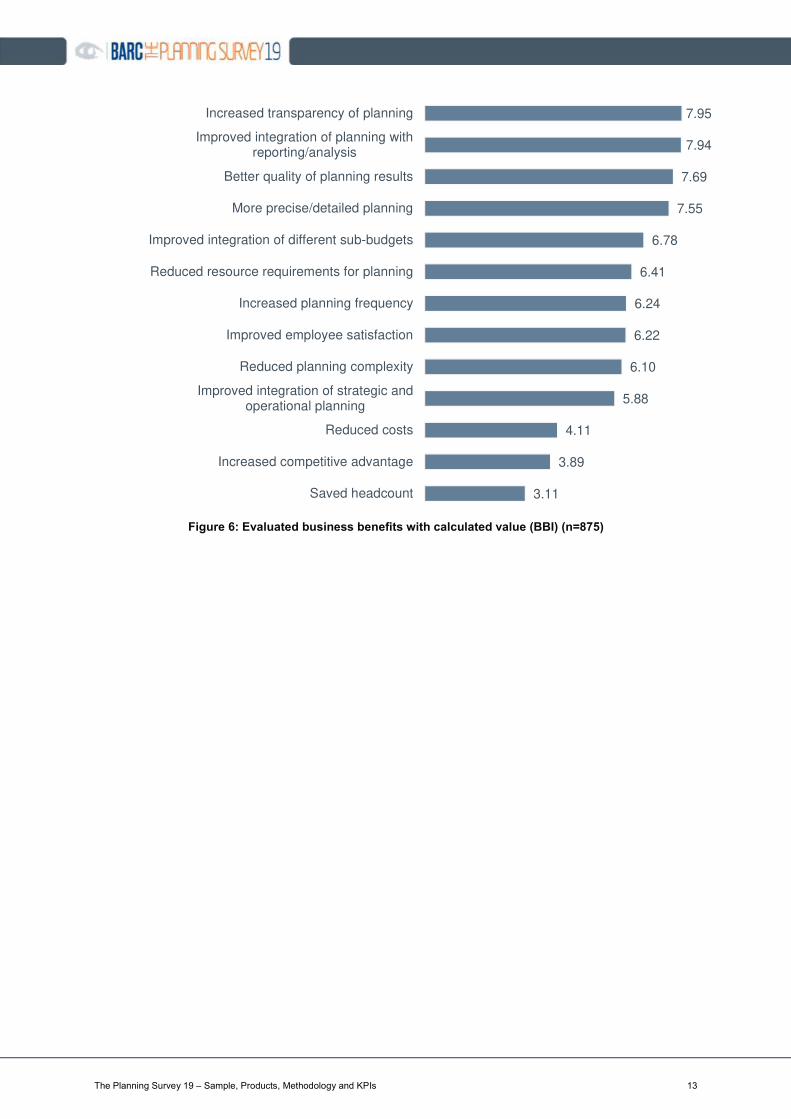
Participants were asked to rate each benefit. Business benefits are calculated by counting the number
of each reported level of benefit and multiplying this number by the corresponding weighting. The results
are then divided by the number of responses for each particular benefit to find the average response
(See Figure 6).
Figure 6 shows that ‘increased transparency of planning’, ‘improved integration of planning with
reporting/analysis’ and ‘better quality of planning results’ are the top three benefits companies achieve
with the use of their planning products.
In contrast to the main benefits, ‘saved headcount’, ‘increased competitive advantage’ and ‘reduced
costs’ are seen as relatively minor benefits for planners.
Level of benefit reported Weighting
High 10
Moderate 6
Low 2
Not achieved -2
Don't know 0
The Planning Survey 19 – Sample, Products, Methodology and KPIs 13
Figure 6: Evaluated business benefits with calculated value (BBI) (n=875)
7.95
7.94
7.69
7.55
6.78
6.41
6.24
6.22
6.10
5.88
4.11
3.89
3.11
Increased transparency of planning
Improved integration of planning withreporting/analysis
Better quality of planning results
More precise/detailed planning
Improved integration of different sub-budgets
Reduced resource requirements for planning
Increased planning frequency
Improved employee satisfaction
Reduced planning complexity
Improved integration of strategic andoperational planning
Reduced costs
Increased competitive advantage
Saved headcount
The Planning Survey 19 – Sample, Products, Methodology and KPIs 14
Project success
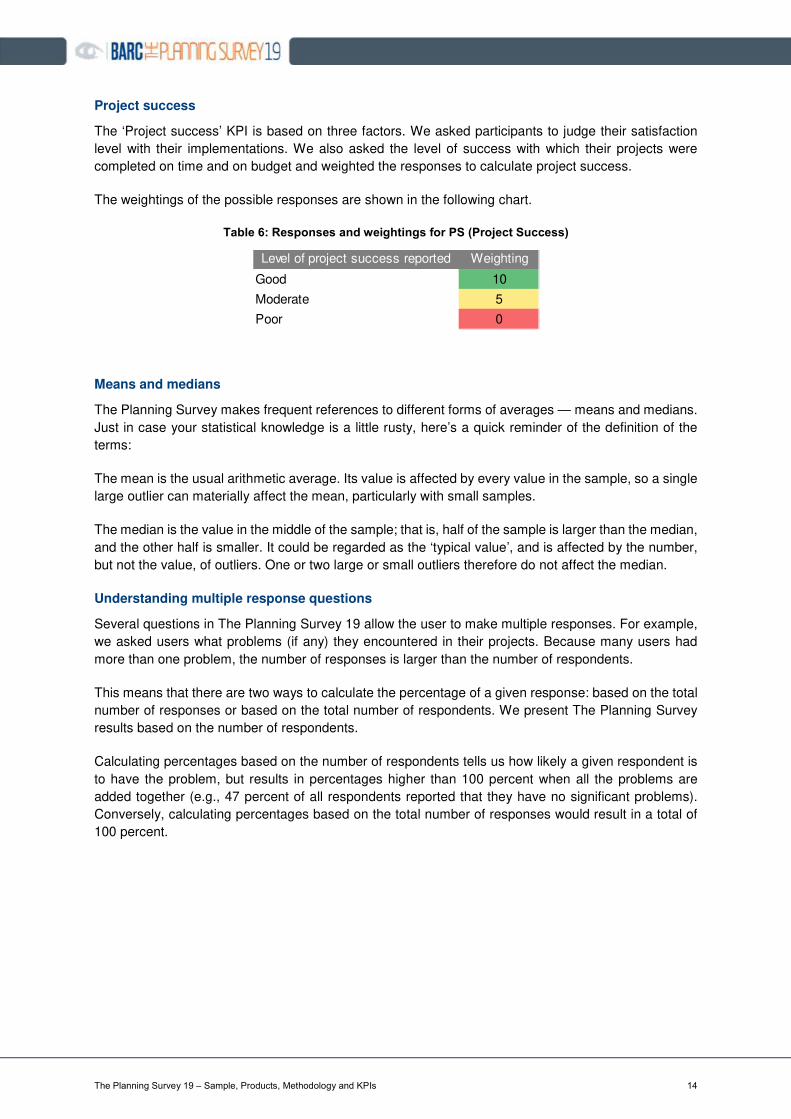
The ‘Project success’ KPI is based on three factors. We asked participants to judge their satisfaction
level with their implementations. We also asked the level of success with which their projects were
completed on time and on budget and weighted the responses to calculate project success.
The weightings of the possible responses are shown in the following chart.
Table 6: Responses and weightings for PS (Project Success)
Means and medians
The Planning Survey makes frequent references to different forms of averages — means and medians.
Just in case your statistical knowledge is a little rusty, here’s a quick reminder of the definition of the
terms:
The mean is the usual arithmetic average. Its value is affected by every value in the sample, so a single
large outlier can materially affect the mean, particularly with small samples.
The median is the value in the middle of the sample; that is, half of the sample is larger than the median,
and the other half is smaller. It could be regarded as the ‘typical value’, and is affected by the number,
but not the value, of outliers. One or two large or small outliers therefore do not affect the median.
Understanding multiple response questions
Several questions in The Planning Survey 19 allow the user to make multiple responses. For example,
we asked users what problems (if any) they encountered in their projects. Because many users had
more than one problem, the number of responses is larger than the number of respondents.
This means that there are two ways to calculate the percentage of a given response: based on the total
number of responses or based on the total number of respondents. We present The Planning Survey
results based on the number of respondents.
Calculating percentages based on the number of respondents tells us how likely a given respondent is
to have the problem, but results in percentages higher than 100 percent when all the problems are
added together (e.g., 47 percent of all respondents reported that they have no significant problems).
Conversely, calculating percentages based on the total number of responses would result in a total of
100 percent.
Level of project success reported Weighting
Good 10
Moderate 5
Poor 0
The Planning Survey 19 – Sample, Products, Methodology and KPIs 15
Survey data collection
The Survey was conducted by BARC, with data captured from November 2018 to February 2019. All
data was captured online from a total of 1,367 respondents.
Respondents were solicited individually via BARC’s own research panel and from dozens of vendor and
independent lists, as well as websites from many different countries, with emailed invitations being sent
to the lists in a staggered fashion.
At our request, most of the vendors notified their customers about The Planning Survey using either
their regular newsletters or websites. We also asked some bloggers to mention it. Each list and website
had a different survey URL, though in all cases, the same questionnaire (in English, German or French)
was used.
The Planning Survey 19 – Sample, Products, Methodology and KPIs 16
Understanding the KPIs
The goal of this section is to help the reader spot winners and losers in The Planning Survey 19 using
well-designed dashboards packed with concise information. The Survey includes a set of 28 normalized
KPIs for each of the 22 products. These include 5 aggregated KPIs, which aggregate the results of
various combinations of ‘root’ KPIs.
This year we have calculated a set of KPIs for each of the eight peer groups. The values are normalized
on the whole sample. Peer groups are used to enable fair and useful comparisons of products that are
likely to compete.
The KPIs all follow these simple rules:
• Only measures that have a clear good/bad trend are used as the basis for KPIs.
• KPIs may be based on one or more measures from The Planning Survey.
• Only products with samples of at least 20 - 30 (depending on the KPI) for each of the questions that
feed into the KPI are included.
• For quantitative data, KPIs are converted to a scale of 1 to 10 (worst to best). A linear min-max
transformation is applied, which preserves the order of, and the relative distance between, products’
scores.
KPIs are only calculated if the samples have at least 15 - 30 data points (this varies from KPI to KPI)
and if the KPI in question is applicable to a product. Therefore, some products do not have a full set of
root KPIs. It is important to exclude KPIs based on small (and therefore not representative) samples to
ensure that the graph scales are not distorted by outlier KPIs. In such cases, the product is still shown
in the tables, but with a blank KPI value and no bar in the bullet graph or bar chart.
The Planning Survey 19 – Sample, Products, Methodology and KPIs 17
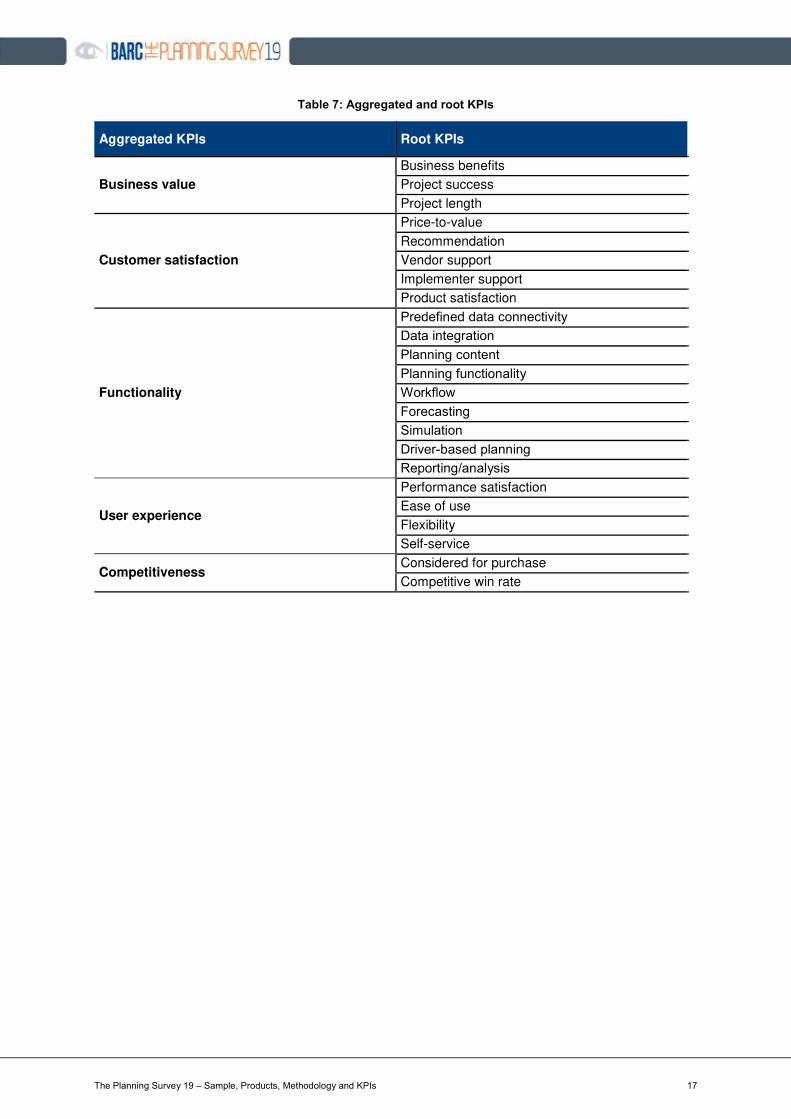
Table 7: Aggregated and root KPIs
Aggregated KPIs Root KPIs
Business value
Business benefits
Project success
Project length
Customer satisfaction
Price-to-value
Recommendation
Vendor support
Implementer support
Product satisfaction
Functionality
Predefined data connectivity
Data integration
Planning content
Planning functionality
Workflow
Forecasting
Simulation
Driver-based planning
Reporting/analysis
User experience
Performance satisfaction
Ease of use
Flexibility
Self-service
Competitiveness Considered for purchase
Competitive win rate
The Planning Survey 19 – Sample, Products, Methodology and KPIs 18
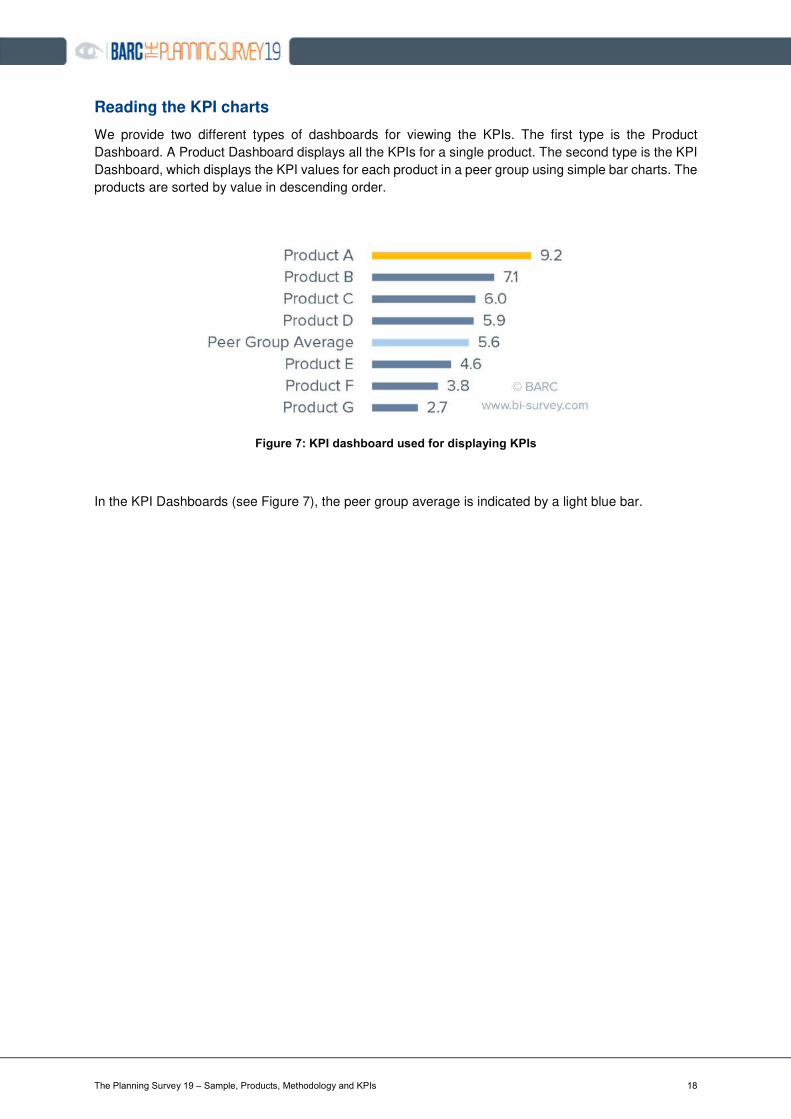
Reading the KPI charts
We provide two different types of dashboards for viewing the KPIs. The first type is the Product
Dashboard. A Product Dashboard displays all the KPIs for a single product. The second type is the KPI
Dashboard, which displays the KPI values for each product in a peer group using simple bar charts. The
products are sorted by value in descending order.
Figure 7: KPI dashboard used for displaying KPIs
In the KPI Dashboards (see Figure 7), the peer group average is indicated by a light blue bar.
The Planning Survey 19 – Sample, Products, Methodology and KPIs 19
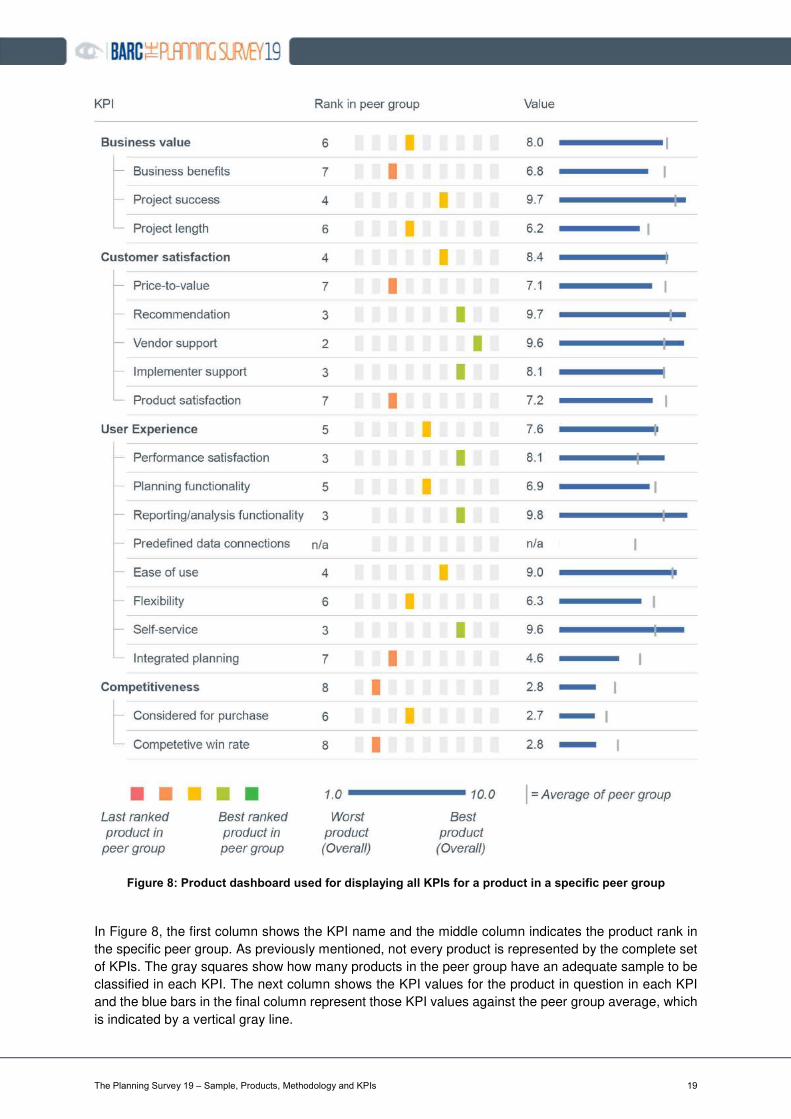
Figure 8: Product dashboard used for displaying all KPIs for a product in a specific peer group
In Figure 8, the first column shows the KPI name and the middle column indicates the product rank in
the specific peer group. As previously mentioned, not every product is represented by the complete set
of KPIs. The gray squares show how many products in the peer group have an adequate sample to be
classified in each KPI. The next column shows the KPI values for the product in question in each KPI
and the blue bars in the final column represent those KPI values against the peer group average, which
is indicated by a vertical gray line.
The Planning Survey 19 – Sample, Products, Methodology and KPIs 20
The KPIs (overview)
The following section provides the entire list of KPIs calculated for The Planning Survey 19, as well as
a description of the calculations.
KPIs are only calculated if the samples have at least 15 or 30 data points (depending on the KPI), so
some of the products do not have a full set of KPIs. It is important to exclude KPIs based on small (and
therefore unreliable) samples to ensure that the graph scales are not distorted by outlier KPIs based on
small data samples. In such cases, the product is still shown in the tables, but with a blank KPI value in
the bar chart.
Different readers will have their own views on which of these KPIs are important to them. For example,
some people will regard predefined data connections as vital, while others may consider
recommendation or self-service to be more important.
The KPIs below provide a good selection from which readers can choose the ones that best fit their own
organization’s requirements.
Business benefits
What we measure
We measure the real benefit of projects after implementation whereas other surveys limit their questions
to technical or organizational issues.
Why it is important
‘Business benefits’ is possibly the most important KPI, focusing on bottom-line benefits of software
projects, rather than individual technical aspects.
A software project that does not deliver business benefits is superfluous. Unlike core transaction
systems, business intelligence software projects are optional, not mandatory, so they must pay their
way in terms of delivering business benefits.
How we measure
We ask users to judge each project benefit based on a scale of achievement ranging from “high” to “not
achieved”. Using this information, we weight their responses and calculate the Business Benefits Index
(BBI). The KPI is a normalized version of this index.
See Figure 6 for a list of the benefits evaluated by survey participants.
Project success
What we measure
This KPI is based on a combination of three measures: the level of general user and administrator
satisfaction with implementations, as well as the frequency with which projects are completed on time
and on budget.
Why it is important
The initial success of a BI or planning project can have a great bearing on the business benefits achieved
over time. Our surveys in previous years have consistently found that long-running projects are likely to
become more costly than first anticipated, deliver less business benefits and often lead to other
The Planning Survey 19 – Sample, Products, Methodology and KPIs 21
significant problems. Therefore, the speed with which a product is implemented can be crucial. User
and administrator satisfaction is also an important indicator that the tool has been adopted as envisaged
at the outset of the project.
How we measure
Similar to our business benefit calculations, we ask participants to judge their satisfaction level with their
implementations. We also ask the level of success with which projects were completed on time and on
budget and weight the responses to calculate project success. The KPI is a normalized version of this
index.
Project length
What we measure
We measure how long it takes to implement projects.
Why it is important
Rapid implementation is a key measure of project success. Our research over the years has shown that
projects with about a three-month implementation time deliver the most business benefits.
How we measure
We divide the number of projects implemented in under three months by the total number of projects. A
weighting is then applied whereby products are classified (based on the median number of users) as
either small, medium or large in order to produce fair comparative ratings in this KPI.
Business value
Business value is a combination of the ‘Business benefits’, ‘Project success’ and ‘Project length’ KPIs
Price-to-value
What we measure
We ask participants to judge the price-performance ratio of their chosen product.
Why it is important
Price-to-value is an important metric in today’s cost-conscious age. As many an enterprise BI/planning
tool user has found, the costs of buying and supporting BI/planning software quickly add up, especially
when attempting to cost-justify adding new users. As more BI/planning capabilities are pushed out to
the business, this perception of value becomes even more critical.
How we measure
We ask participants to rate the price-performance ratio of their chosen product. To obtain the final KPI,
we calculate an average weighted score per product.
The Planning Survey 19 – Sample, Products, Methodology and KPIs 22
Recommendation
What we measure
We measure whether customers already using a product would recommend that product to others.
Why it is important
No one knows more about how a product performs in the real world than the customers already using
it. All too often, they find that products don’t live up to expectations, or that the vendor does not support
the product properly. Therefore, if existing users say they would recommend the product, we regard this
as a positive indicator of its value.
How we measure
Users are asked whether they would recommend the product they are most familiar with. This measure
is based on the degree and proportion of positive responses.
Vendor support
What we measure
We measure user satisfaction with the level of support provided for the product by the vendor.
Why it is important
Product support from the vendor is a key determinant for project success. This is an area where there
are major differences between vendor ratings.
How we measure
We ask participants to rate the quality of the vendor’s support. To arrive at the final KPI, we calculate
an average weighted score per product.
Implementer support
What we measure
We measure user satisfaction with the level of support provided for the product by the implementer.
Why it is important
Product support is a key determinant for project success. As with vendor support, this is an area where
we see major differences between products. The implementer’s role can be just as important as the
vendor’s.
How we measure
We ask participants to rate the support by the implementer. To obtain the final KPI we calculate an
average weighted score per product.
Product satisfaction
What we measure
We measure the level of satisfaction with the product.

The Planning Survey 19 – Sample, Products, Methodology and KPIs 23
Why it is important
If a product proves unreliable at a critical time, the results can be debilitating, and can even render an
application unusable.
However, not all customers have the same dependency on reliability, as some applications are not
mission critical or time critical.
How we measure
We ask participants to rate their satisfaction with the product. We calculate an average weighted score
per product to arrive at the final KPI.
Customer satisfaction
We combine the ‘Price-to-value’, ‘Recommendation’, ‘Vendor support’, ‘Implementer support’ and
‘Product satisfaction’ KPIs to calculate this aggregated KPI.
Predefined data connectivity
What we measure
Predefined data connectivity as a reason to buy, as well as the level of complaints about predefined
data connections.
Why it is important
Predefined data connections to operational source systems (e.g., SAP ERP) save time and development
effort in projects.
How we measure
This KPI is based on two factors: (1) the frequency with which ‘predefined data connections’ was cited
as a reason for purchasing a planning product; and (2) the frequency of complaints about data
connections post-implementation. Each of the above is given equal weighting in calculating a normalized
KPI value.
Data integration
What we measure
This KPI measures user ratings of the product’s data integration functionality.
Why it is important
This is about the various aspects of integrated business planning: deriving operational planning from
strategic planning, forecasting, linking up the various sub-plans in financial planning, and linking
planning with other areas of BI, such as reporting, analysis and financial consolidation. Integrated
business planning is a planning approach which, if properly implemented and organized, promises a
significant improvement in planning quality.
How we measure
We ask participants to rate the data integration from and interfaces to source systems of the tool they
are most familiar with. To obtain the final KPI we calculate an average weighted score per product.
The Planning Survey 19 – Sample, Products, Methodology and KPIs 24
Planning content
What we measure
This KPI measures user ratings of the predefined planning content available with the product.
Why it is important
Particularly in the early stages of projects, customers can benefit from predefined planning content,
which can be helpful for speeding up implementation. Predefined planning content can be available from
the vendor itself or from partners and is typically industry-specific and/or focused on particular planning
topics such as different sub-plans (e.g., sales planning, financial planning, etc.). Often the predefined
planning content can be used as a starting point in implementation projects and can be adapted to a
customer’s needs.
How we measure
We ask participants to rate the predefined planning content of the tool they are most familiar with. To
obtain the final KPI we calculate an average weighted score per product.
Planning functionality
What we measure
This KPI measures user ratings of the product’s coverage of planning specific requirements.
Why it is important
Planning tools provide specialized functions (e.g., planning or simulation scenarios) based on a
consistent database. Depending on the planning scenario (top-down, bottom-up, centralized,
decentralized, etc.) some functions may be more or less important. Buyers should evaluate a product’s
functionality and decide whether it matches their present requirements as well as those in the
foreseeable future.
How we measure
We ask participants to rate the coverage of planning-specific requirements by the tool they are most
familiar with. To obtain the final KPI we calculate an average weighted score per product.
Workflow
What we measure
This KPI measures user ratings of the product‘s workflow functionality.
Why it is important
To manage decentralized bottom-up planning processes with lots of planners involved, workflow
functionality can be helpful when coordinating the consecutive planning steps. Workflow management
environments in planning products often include task assignment to planners, deadlines / time limits for
task completion, email notifications, approval processes / release of plan data and locking/unlocking
plan data that has been entered by planners.
The Planning Survey 19 – Sample, Products, Methodology and KPIs 25
How we measure
We ask participants to rate the workflow functionality of the tool they are most familiar with. To obtain
the final KPI we calculate an average weighted score per product.
Forecasting
What we measure
This KPI measures user ratings of the product’s forecasting functionality.
Why it is important
Based on plan values already entered for certain planning periods and their comparison with realized
actuals from operational source systems, planning tools support the creation of forecasts of future
corporate development. Forecasts are often used to update the plan or budget data and are done on a
monthly or quarterly basis. Forecasts are either focused on certain periods (e.g., end of the fiscal year)
or done on a rolling basis (e.g., for the next 12 months).
How we measure
We ask participants to rate the functionality for doing forecasts in the tool they are most familiar with. To
obtain the final KPI we calculate an average weighted score per product.
Simulation
What we measure
This KPI measures user ratings of the product’s simulation functionality.
Why it is important
Today, companies spend a lot of time creating their plans. Often, there is very limited time available for
dealing with the produced plan data (e.g., using simulations and scenario analysis). Simulations can
help companies to play through different possible scenarios (e.g., best case, worst case) to derive
actions for each scenario and to prepare for the future. There are two main types of simulation: those in
which structures used in planning are changed (e.g., organizational structures) and parameter
simulations. The depiction of different scenarios can help to make planning results plausible and
comprehensible if parameters change. Driver-based planning models are particularly suitable for
simulation approaches with parameters and scenario considerations.
How we measure
We ask participants to rate the functionality for doing simulations in the tool they are most familiar with.
To obtain the final KPI we calculate an average weighted score per product.
The Planning Survey 19 – Sample, Products, Methodology and KPIs 26
Driver-based planning
What we measure
This KPI is based on the proportion of respondents’ organizations currently performing driver-based
planning with their product.
Why it is important
Today, operational plans are often very detailed but extra detail does not always bring significant
improvements in results. Planning based on real value drivers with consideration of cause-and-effect
relationships is an interesting approach, which focuses a company’s planning activities on the main
business influencing aspects without wasting resources. Therefore, many companies are currently
evaluating whether driver-based planning can improve their overall planning activities.
How we measure
We ask participants whether the tool they are most familiar with is being used for driver-based planning
by their company. The KPI is based on the proportion of sites using driver-based planning.
Reporting/analysis
What we measure
This KPI measures user ratings of the product’s coverage of reporting/analysis requirements.
Why it is important
Without appropriate options for reporting and analysis, planning is not possible. Functions for reporting
results, intermediate results or the analysis of deviations between actual and budget figures are
essential in planning processes. In addition, functions for displaying aggregate performance indicators
are often required in management cockpits and dashboards. For many customers, the integration of
reporting and analysis in their planning solution is very important, making this a key criterion.
How we measure
We ask participants to rate the coverage of additional reporting/analysis requirements by the tool they
are most familiar with. To obtain the final KPI we calculate an average weighted score per product.
Functionality
We combine ‘Predefined data connectivity, ‘Data integration’, ‘Planning content’, ‘Planning functionality’,
‘Workflow’, ‘Forecasting’, ‘Simulation’, ‘Driver-based planning’ and ‘Reporting/analysis’ KPIs to calculate
this aggregated KPI.
Performance satisfaction
What we measure
This KPI is based on user feedback about the reasons why the product was chosen and complaints
about the system’s performance.
Why it is important
Performance satisfaction is crucial in planning projects, and often affects project outcomes.
The Planning Survey 19 – Sample, Products, Methodology and KPIs 27
In some ways, complaints about performance are more important than performance measured in
seconds, because acceptable delays can vary depending upon how the system is used.
How we measure
This KPI is based on two factors: (1) the frequency with which ‘convincing performance of software’ was
cited as a reason for purchasing a planning product; and (2) the frequency of complaints about slow
performance. Each of the above is given equal weighting in calculating a normalized KPI value.
Ease of use
What we measure
We measure the degree to which respondents consider their planning software to be easy to use.
Why it is important
Ease of use is often considered the holy grail of software. It is an important consideration for any vendor
seeking to expand its footprint within enterprise sites. Business decision-makers don’t want to have to
spend a lot of time in training or attempting to learn new interfaces.
How we measure
We ask participants to rate ease of use for developers of planning applications as well as the ease of
use for planners of the tool they are most familiar with. To obtain the final KPI we calculate an average
weighted score per product.
Flexibility
What we measure
We measure the degree to which respondents consider their planning software to be flexible.
Why it is important
With the current vogue for agility and self-service capabilities and the increasing need for users to be
able to access a variety of planning use cases (top-down, bottom-up, centralized, decentralized,
strategic, operational, etc.), flexibility is an important consideration for many organizations.
How we measure
This KPI is based on two factors: (1) the frequency with which ‘flexibility of the software’ was cited as a
reason for purchasing a planning product; and (2) the frequency of complaints about flexibility post-
implementation. Each of the above is given equal weighting in calculating a normalized KPI value.
Self-service
What we measure
We measure how many sites are using self-service with their planning product. Reported ease of use is
also taken into account.
The Planning Survey 19 – Sample, Products, Methodology and KPIs 28
Why it is important
Self-service speeds up processes and eliminates the middle man. Independence from IT processes is
a commonly cited requirement in software projects.
How we measure
We ask participants whether the tool they are most familiar with is being used for self-service by their
company. 50 percent of the KPI is based on the probability that self-service is being used while the other
half is based on the ‘Ease of use’ KPI.
User experience
User experience is a combination of the ‘Performance satisfaction‘, ‘Ease of use’, ‘Flexibility’ and ‘Self-
service’ KPIs.
Considered for purchase
What we measure
We measure how often products are considered for purchase, regardless of whether they are eventually
purchased or not.
Why it is important
There are myriad reasons why a product might be considered for purchase by an organization. Factors
such as vendor marketing, a pre-existing relationship with the vendor and word-of-mouth can all have
an influence. Taking all these factors into account, this KPI provides an interesting indicator as to the
strength of a product's market presence.
How we measure
The KPI scores in this category are based on the relative frequency with which products are considered
for purchase.
Competitive win rate
What we measure
We measure how well products perform against other products in head-on competitions to win
customers.
Why it is important
Recognizing which products to evaluate entails understanding which of them have fared well in other
organizations’ product selections. Eliminating ‘losers’ at an early stage is important.
The BI Survey and Planning Survey have consistently found that products from some large vendors are
often bought with little or no evaluation and therefore appear to have an artificially high win rate
compared to products from smaller, independent vendors, who have to fight for every sale.
The Planning Survey 19 – Sample, Products, Methodology and KPIs 29
How we measure
We calculate the win rate for products chosen by organizations that have evaluated at least one other
product. We divide the frequency with which the product was chosen by the frequency with which the
product was evaluated.
Competitiveness
Competitiveness is a combination of ‘Considered for purchase’ and ‘Competitive win rate’ KPIs.
The Planning Survey 19 – Sample, Products, Methodology and KPIs 30
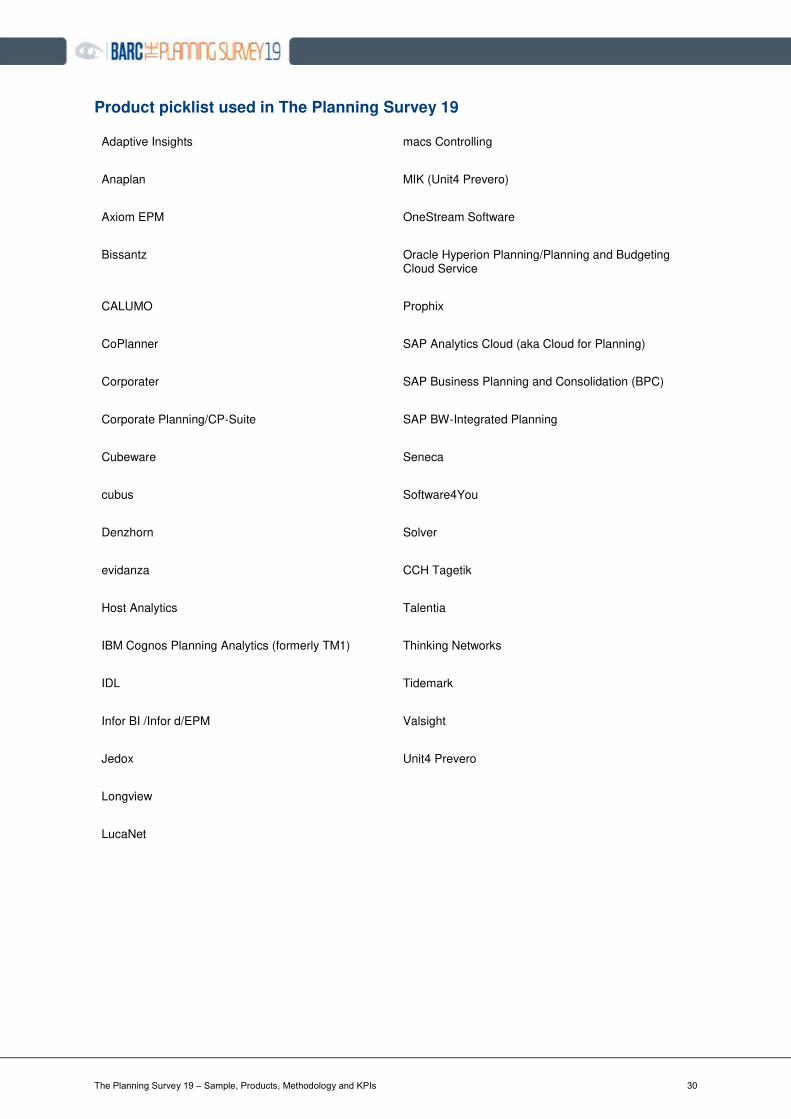
Product picklist used in The Planning Survey 19
Adaptive Insights macs Controlling
Anaplan MIK (Unit4 Prevero)
Axiom EPM OneStream Software
Bissantz Oracle Hyperion Planning/Planning and Budgeting Cloud Service
CALUMO Prophix
CoPlanner SAP Analytics Cloud (aka Cloud for Planning)
Corporater SAP Business Planning and Consolidation (BPC)
Corporate Planning/CP-Suite SAP BW-Integrated Planning
Cubeware Seneca
cubus Software4You
Denzhorn Solver
evidanza CCH Tagetik
Host Analytics Talentia
IBM Cognos Planning Analytics (formerly TM1) Thinking Networks
IDL Tidemark
Infor BI /Infor d/EPM Valsight
Jedox Unit4 Prevero
Longview
LucaNet
The Planning Survey 19 – Sample, Products, Methodology and KPIs 31
About BARC
BARC — Business Application Research Center
BARC is a leading enterprise software industry analyst and consulting firm delivering information to more
than 1,000 customers each year. Major companies, government agencies and financial institutions rely
on BARC’s expertise in software selection, consulting and IT strategy projects.
For over twenty years, BARC has specialized in core research areas including Data Management (DM),
Business Intelligence (BI), Customer Relationship Management (CRM) and Enterprise Content
Management (ECM). BARC’s expertise is underpinned by a continuous program of market research,
analysis and a series of product comparison studies to maintain a detailed and up-to-date understanding
of the most important software vendors and products, as well as the latest market trends and
developments.
BARC research focuses on helping companies find the right software solutions to align with their
business goals. It includes evaluations of the leading vendors and products using methodologies that
enable our clients to easily draw comparisons and reach a software selection decision with confidence.
BARC also publishes insights into market trends and developments, and dispenses proven best practice
advice. BARC consulting can help you find the most reliable and cost effective products to meet your
specific requirements, guaranteeing a fast return on your investment. Neutrality and competency are
the two cornerstones of BARC’s approach to consulting. BARC also offers technical architecture reviews
and coaching and advice on developing a software strategy for your organization, as well as helping
software vendors with their product and market strategy.
BARC organizes regular conferences and seminars on Business Intelligence, Enterprise Content
Management and Customer Relationship Management software. Vendors and IT decision-makers meet
to discuss the latest product updates and market trends, and take advantage of valuable networking
opportunities.
BARC research reports bring transparency to the market
BARC’s BI Trend Monitor
2019 reflects on the trends
currently driving the BI and
data management market
from a user perspective. We
asked close to 2,800 users,
consultants and vendors for
their views on the most
important BI trends.
BARC Score: Enterprise BI
and Analytics Platforms is
BARC’s concise overview of
the global BI and analytics
tools market. It features
profiles of the twenty leading
vendors and BARC’s rating
of each provider based on a
wide range of criteria related
to their portfolio capabilities
and market execution.
The BI Survey 18 is the
world’s largest annual survey
of BI users. Based on a
sample of over 3,000 survey
responses, The BI Survey 17
offers an unsurpassed level
of user feedback on 42
leading BI solutions. Find out
more at http://bi-survey.com.

Copyright © BARC GmbH 2019. All rights reserved.
Business Application Research Center – BARC GmbH
Germany
BARC GmbH
Berliner Platz 7
D-97080 Würzburg
+49 931 880651-0
www.barc.de
Austria
BARC GmbH
Goldschlagstraße 172 / Stiege 4 / 2.OG
A-1140 Wien
+43 1 8901203-451
Switzerland
BARC Schweiz GmbH
Täfernstraße 22a
CH-5405 Baden-Dättwil
+41 76 3403516
Rest of the World
+44 1536 772 451