Embed Size (px)
Citation preview

1
Flinders Centre for Clinical Change and Health Care Research
This manuscript is under copyright restrictions.
It must not be copied or reproduced without the express
written consent of the authors.
Working Paper No. 01/16
Assessing quality of life in a post-acute population of frail older people living in residential aged care:
an empirical comparison of the EQ-5D, DEMQOL-U and DEMQOL-Proxy-U.
Flint T1, Ratcliffe J1, Easton T2, Killington M2, Cameron ID3, Davies O2,
Whitehead C2, Kurrle S3, Miller M4, Liu E2, Crotty M2
1 Flinders Health Economics Group, School of Medicine, Flinders University
2 Department of Rehabilitation and Aged Care, School of Health Sciences, Flinders University
3 John Walsh Centre for Rehabilitation Research, Kolling Institute, University of Sydney
4 Department of Nutrition and Dietetics, School of Health Sciences, Flinders University
2
1. Introduction
In contrast to the proliferation of studies reporting upon an assessment of the quality of life of older people in
community based settings there is a paucity of evidence relating to the health related quality of life of older
people living in residential care. Those studies which have been conducted in this setting have found that the
quality of life of older people living in residential care is typically very poor (Kane et al 2003; Giles et al
2009). It has been estimated that 20-30% of all hip fractures occur in residential aged care facilities. Hip
fractures represent a sentinel event for aged care residents. Estimates indicate that 25-35% of older people will
die within a year of incurring a fractured hip (Braithwaite et al, 2003) whilst only 40% will rediscover the
level of mobility they enjoyed prior to the fracture (Koval and Zuckerman, 1994). In addition, hip fracture
patients returning from hospital often have delirium and consequently are at greater risk of accelerations in
cognitive decline and dementia.
The high prevalence of hip fractures occurring in residential aged care facilities highlight the importance of
providing cost-effective post-acute treatment and care pathways (Crotty and Ratcliffe, 2011). An important
component to facilitate the assessment of the cost effectiveness of post-acute treatment and care pathways is
the ability to capture the benefits of interventions in terms of their impact upon health status and quality of
life. Within economic evaluation, benefits are most often captured by quality adjusted life years (QALYs)
through the measurement and valuation of health related quality of life (Brazier et al, 2007). However,
measuring health related quality of life (HRQoL) among populations of frail older people can be problematic
due to significant cognitive impairment commensurate with an increased incidence of dementia and there is
a lack of consensus regarding which outcome measure is most appropriate for use in this setting (Moniz-
Cook et al, 2008).
The DEMQOL and DEMQOL-Proxy were developed as condition specific instruments to capture the
measurement of HRQoL of individuals with mild to moderate dementia where the DEMQOL was designed
to be self-completed by the individual and the DEMQOL-Proxy was designed to be completed by a suitable
proxy e.g. close family member or a carer (Smith et al 2005, Smith et al 2007). In their original form both

3
the DEMQOL and the DEMQOL-Proxy are not suitable for use in economic evaluation as they provide
summary scores that are not preference based. However, the recent development of the DEMQOL-U and
DEMQOL-Proxy-U using general population preference values provides a mechanism for generating a
preference based index for these measures allowing them to be used more meaningfully in economic
evaluations (Mulhern et al, 2013).
The EQ-5D represents the world’s most widely used preference based measure of HRQoL and the
instrument is well known for its reliability, responsiveness and validity (Hounsome et al, 2011). The
acceptability and feasibility of the EQ-5D has been demonstrated in a number of published studies
internationally incorporating self-reported responses from cognitively impaired individuals living in
residential aged care (Ankri et al 2003, Devine et al 2014, Gordon et al 2014; Aguirre et al, 2015). For
individuals who are unable to self-complete the EQ-5D due to more severe levels of cognitive impairment a
proxy version is available. A recent study analysed the psychometric properties of the EQ-5D rated by proxy
and demonstrated its validity and reliability in individuals living in residential care with different stages of
dementia (Diaz-Redonodo et al 2014). The study authors concluded that proxy assessment may improve the
feasibility of the EQ-5D for individuals at advanced stages of dementia who are unable to self-complete the
instrument.
The main aim of this study was to empirically compare the measurement properties of the newly developed
DEMQOL-U and DEMQOL Proxy-U instruments to the EQ-5D-5L and its proxy version in a population of
frail older people residing in aged care in the post-acute period of recovery from a hip fracture.
2. Methods
Data source and Measures
The data utilised for this study emanates from a randomised controlled trial to investigate the clinical and
cost effectiveness of a multidisciplinary rehabilitation service to hip fracture patients living in residential
aged care (Crotty and Ratcliffe, 2011). A battery of instruments to measure quality of life, cognition, and
4
clinical indicators of depression, pain and function were administered at baseline and repeated at 4 weeks
follow up. Quality of life was assessed using the DEMQOL-U and DEMQOL-Proxy-U plus the EQ-5D-5L.
As previously highlighted, the 28 item DEMQOL and the 31 item DEMQOL-Proxy were used as a
foundation for developing the DEMQOL-U and DEMQOL-Proxy-U which measure health utility
specifically in dementia populations. The scoring algorithms pertaining to each classification system were
derived using the time trade off elicitation technique in a UK general population sample. The resulting
utility scores lie on the zero to one quality adjusted life years (QALY) scale where zero represents the state
dead and one represents the state of full health. The utility scores for the DEMQOL-U range from 0.243 to
0.986 and the DEMQOL-Proxy-U from 0.363 to 0.937 (Mulhern et al 2013, Rowen et al 2012).
The EQ-5D is a commonly used preference based measure of health status designed for completion by
patients and/or members of the general population, however it can also be completed by a proxy (CEQ-5D).
The EQ-5D-5L was recently developed in order to improve sensitivity and reduce ceiling effects relative to
the original 3 level version (Herdman et al, 2011). A scoring algorithm for the EQ-5D-5L is now available
based upon the time trade off elicitation technique with a UK general population sample. The resulting
utility scores range from -0.208 to 1 (where states with a score less than zero are considered worse than
being dead) (Devlin et al 2016).
Cognitive functioning was assessed by the Mini-Mental State Examination (MMSE), a routinely administered
brief instrument for the measurement of global cognitive function (Folstein et al, 1975). Scores below 10
indicate severe cognitive impairment, scores between 10 and 20 indicate moderate impairment and finally
scores greater than 20 indicate mild to non-existent cognitive impairment. The Cornell Scale for Depression
in Dementia (CSDD) is a 19-item instrument completed by clinical assessment that screens for signs of
depression specifically among dementia patients (Alexopoulos et al 1988, Kurlowicz et al 2002). Scores >11
indicate probable depression while scores >18 indicate definite depression.
5
Individual’s functional ability or independence was measured by the Modified Barthel Index (MBI) (Shah et
al, 1989). The MBI is a 10-item instrument that produces a score between 1 and 100 with a score of 0-20
indicating total dependence; 21-60 indicating severe dependence; 61-90 indicating moderate dependence;
91-99 indicating slight dependence; and finally a score of 100 indicates that the individual is fully
independent in basic daily activities such as showering, dressing and mobility. Pain levels were assessed
using the Pain Assessment in Advanced Dementia Scale (PainAd) (Warden et al, 2003), an observational
instrument designed for administration by a clinician to measure levels of pain in patients with advanced
dementia. The instrument produces scores between 0 and 10 with 0 being no pain and 10 indicating severe
pain.
Data Analysis
Descriptive Analysis
Descriptive summary statistics were produced initially to provide an overview of the study population in
terms of their socio-demographic characteristics and clinical indicators of depression, pain and functioning
at baseline. Summary statistics of the quality of life measures of interest, the DEMQOL-U and DEMQOL-
Proxy-U and the EQ-5D-5L and CEQ-5D-5L, were generated to show how individuals had responded to
these instruments at each time point.
Agreement
In order to assess the levels of agreement between the different measures of quality of life, Bland-Altman
plots were created. Bland-Altman plots were generated to explore agreement between DEMQOL-U and EQ-
5D-5L and also DEMQOL-Proxy-U and CEQ-5D-5L both at baseline and at the week 4 follow up period to
assess the extent to which similar responses were given to each instrument. As the health states were
reported either by the individual’s themselves or their carer the patient’s ‘real’ health state is an unknown.
Therefore, the x axis of the Bland-Altman plots uses the average of the utilities values derived from the two
instruments in question. The y axis consists of the difference between the two utility scores. For example for
6
the Bland-Altman plot assessing agreement between DEMQOL-U and EQ-5D-5L, x = (DEMQOL-U score
+ EQ-5D-5L score)/2 and y= DEMQOL-U – EQ-5D-5L.
Individual and Proxy agreement
In addition to exploring the agreement between the different quality of life measures, agreement between
self-report and proxy report for the same measure was analysed. Intra class correlation coefficients (ICC)
were estimated. ICCs were estimated at an individual level using a two way mixed effect model with
absolute agreement and average measures were reported. An ICC above 0.75 indicates good agreement
while an ICC below 0.75 suggests poor to moderate agreement (Dancey and Reidy, 2004). To show the level
of agreement graphically Bland-Altman plots were constructed in a similar way to those for agreement
between the different instruments. As we do not know the ‘true’ health state of the individual the x axis is
the average of the self-reported and proxy reported utility values while the y axis is the difference between
the two utility values. This analysis was completed for the proportion of the total sample (32% at baseline
and 49% at week 4) where both the DEMQOL-U and DEMQOL-Proxy-U were available for individuals.
This analysis was not conducted for the EQ-5D as the EQ-5D-5L and the CEQ-5D-5L were completed by
either the individual or a proxy family member respectively and not simultaneously.
Convergent Validity
The association between DEMQOL-U, EQ-5D-5L and their respective proxy versions, cognition, and
clinical indicators of depression, pain and function was explored to assess the degree of convergent validity.
This involved determining whether there was a strong correlation between the utility scores derived from the
DEMQOL-U and EQ-5D-5L (and proxy versions) and scores relating to cognition, clinical indicators of
depression, pain and function (MMSE, CSDD, MBI and PainAd) using Spearman correlation coefficients.
Correlations greater than 0.7 were considered strong and correlations between 0.4 and 0.6 were considered
moderate (Dancey and Reidy, 2004).

7
Known-group validity
Recommended threshold levels for severity in instruments such as the MMSE and the MBI, were utilised to
facilitate an assessment of known group validity. For example, it was expected that those with severe
cognitive impairment (MMSE score <10) would have a lower quality of life and therefore lower utility
values for the DEMQOL-U and EQ-5D-5L. Similarly, it was expected that those with mild or non-existent
cognitive impairment (MMSE score >20) would have higher utility values. Therefore, using these pre-
defined threshold values from other instruments designed to measure specific aspects of health status, the
utility values derived from DEMQOL-U and EQ-5D-5L were compared between severity groups to examine
whether they behaved as would be expected.
3. Results
Sample Characteristics and Descriptive statistics
A total of 354 individuals were approached to be included in the study of whom n=240 (68%) were eligible
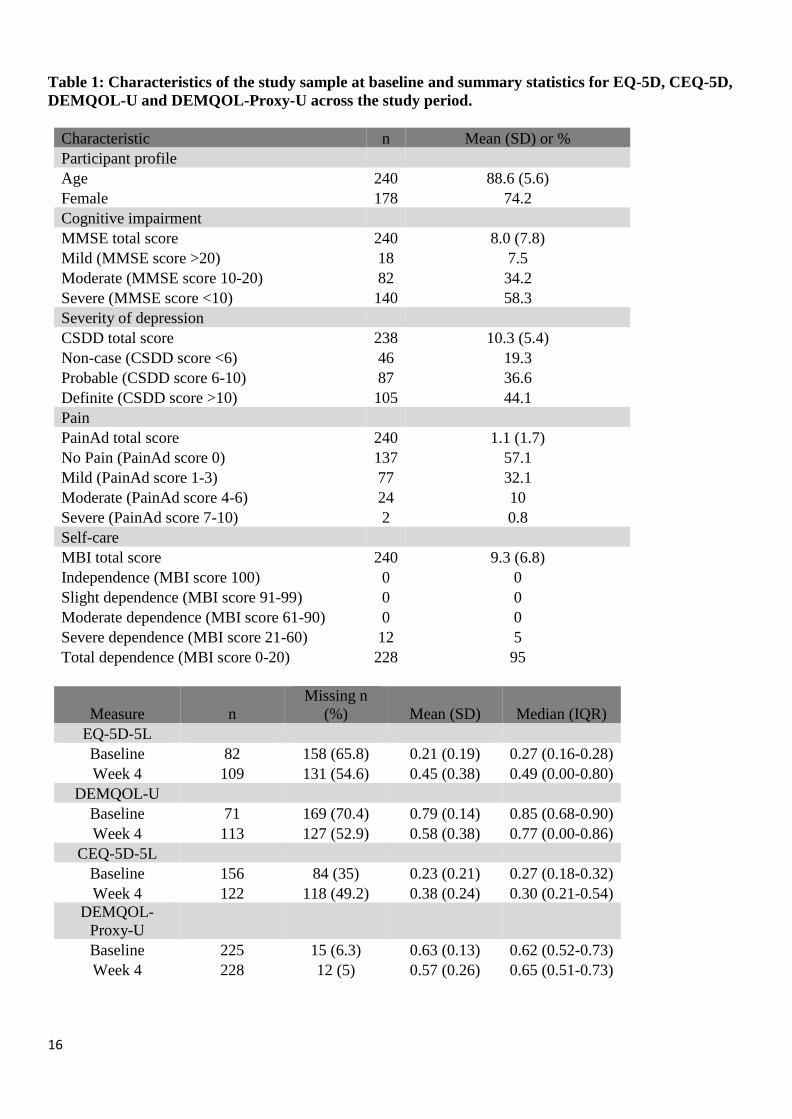
and consented to participate. The socio-demographic characteristics of the study sample and summary
statistics for the EQ-5D, CEQ-5D, DEMQOL-U and DEMQOL-Proxy-U across the study period are
presented in Table 1. All individuals in the study sample were classified as either severely or totally
dependent according to their respective MBI scores while over 90% of the individuals were classified as
having moderate or severe cognitive impairment based on their MMSE score. The mean utility scores at
baseline for the EQ-5D-5L and DEMQOL-U were 0.21 and 0.79 respectively. In general, the scores for the
EQ-5D-5L improved at week 4 follow up with a mean score of 0.45. However, the mean score for the
DEMQOL-U at week 4 follow up had fallen to 0.58. Regarding the proxy versions of the instruments, the
CEQ-5D-5L and the DEMQOL-Proxy-U, had mean scores of 0.23 and 0.63 respectively at baseline. The
proxy instruments followed the same pattern as their respective patient completed versions in that the mean
score for the CEQ-5D-5L increased at week 4 follow up to 0.38 while the DEMQOL-Proxy-U mean score
fell to 0.57.

8
Agreement
Figure 1 presents Bland-Altman plots showing the level of agreement between the individual self-reported
utility measures (EQ-5D-5L and DEMQOL-U) and their respective proxy versions (CEQ-5D-5L and
DEMQOL-Proxy-U) at baseline. There is little agreement between the two measures at baseline, with the
majority of the responses clustering around the mean difference of 0.55. This finding indicates that
individuals tended to exhibit systematically higher utility scores on the DEMQOL-U. This pattern does
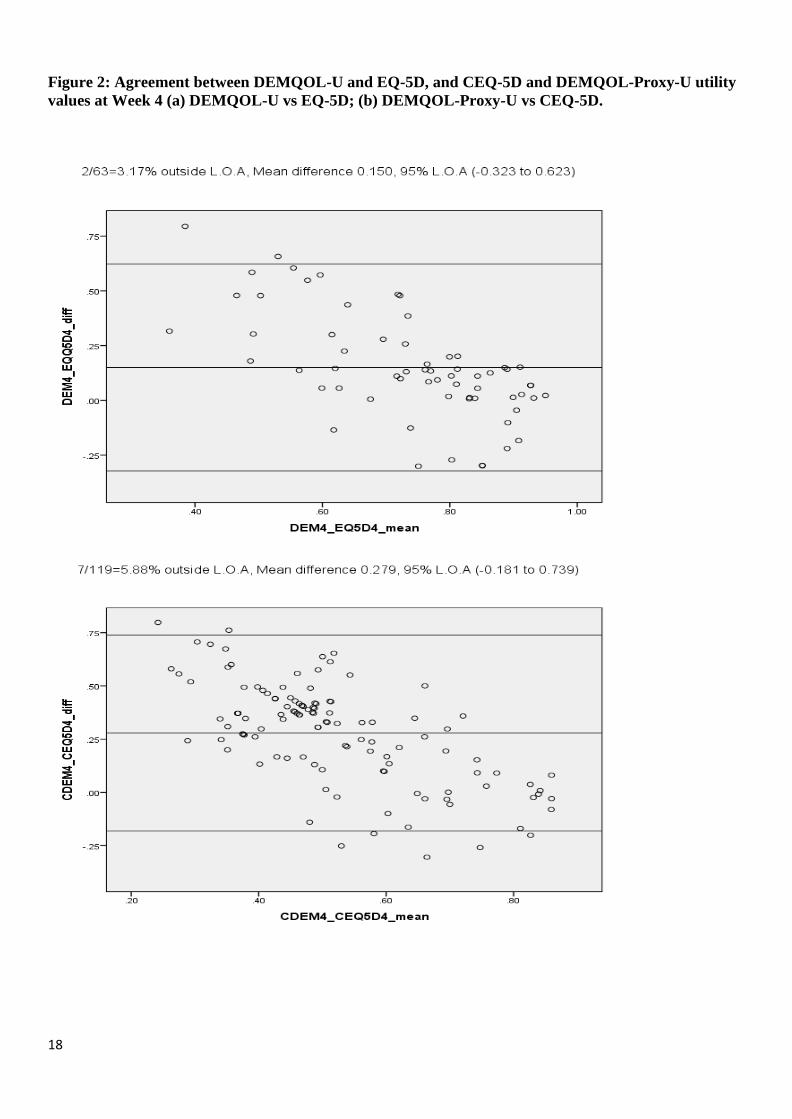
change at week 4 follow up (presented in Figure 2) as responses cluster around the y=0 line at higher levels
of utility suggesting there is better agreement at the upper end of the utility scale. However, it is evident that
there is still disagreement at lower utility levels with the DEMQOL-U indicating higher scores on average.
Patient and Proxy agreement
The proxy reported measures indicate disagreement at baseline between the two measures at lower utility
levels. As utility levels increase the responses move closer to y=0 however, they mainly cluster around the
mean difference of 0.403 indicating that responses to DEMQOL-Proxy-U are higher than that of the CEQ-
5D-5L. At week 4, similar to the patient reported measures, there is more agreement with a high proportion
of responses around the y=0 line particularly at higher utility levels. At lower utility levels there is still
disagreement and the cluster around the mean difference remains although the mean difference decreased
slightly to 0.279.
Convergent Validity
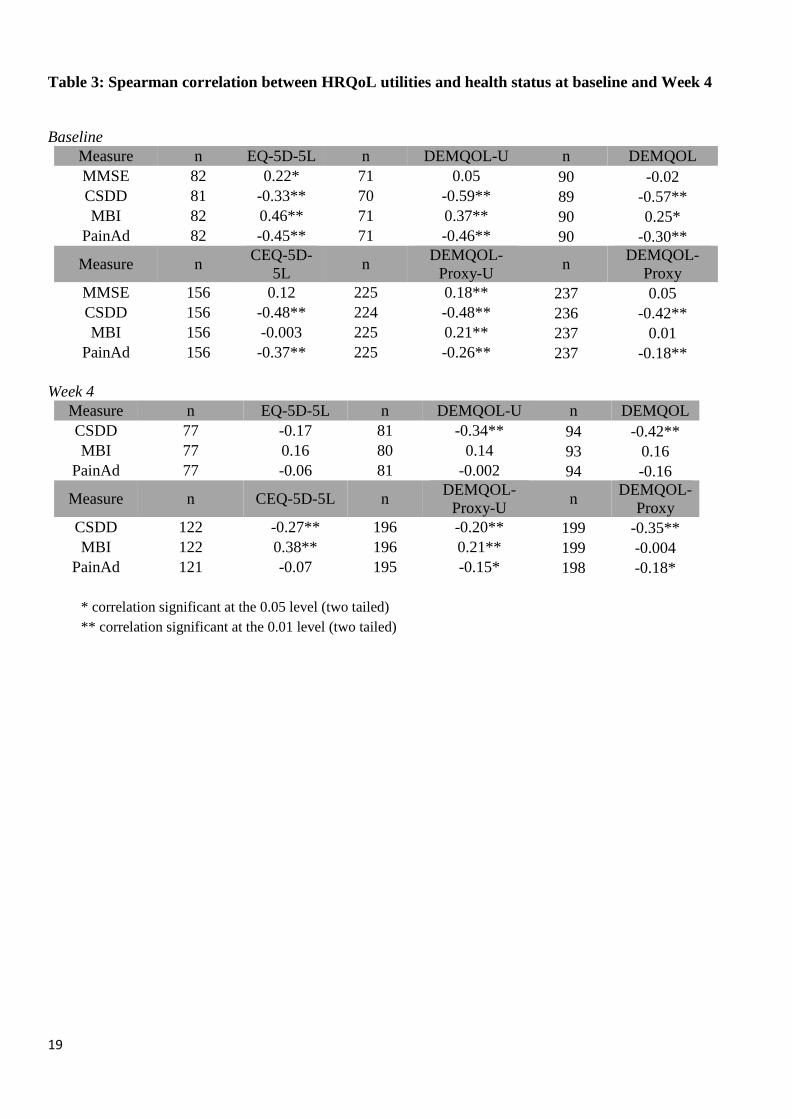
Spearman correlations between the utility based health measures (plus the non-utility based versions of
DEMQOL) and the non-utility based health measures are presented in Table 3. At baseline, of the individual
self-reported measures, only the EQ-5D-5L is significantly associated with MMSE score. Although this is in
the expected direction (EQ-5D-5L increases as MMSE increases) the correlation is below 0.4 and therefore
cannot be classified as moderate or strong. The EQ-5D-5L, DEMQOL-U and DEMQOL are all significantly
associated with CSDD, MBI and PainAd in the expected direction (utility increases as CSDD or PainAd
decreases and utility increases as MBI increases). The majority of the correlations were moderate with the
9
exception of the relationships between the EQ-5D-5L and CSDD, DEMQOL-U and MBI; and DEMQOL
and PainAd which indicated low correlations. In relation to the proxy reported instruments, the DEMQOL-
Proxy-U was significantly associated with all of the non-utility measures and in the expected direction. The
CEQ-5D-5L and DEMQOL-Proxy were both found to be significantly associated with the CSDD and the
PainAd but only their correlations with CSDD could be classified within the moderate range. At week 4,
although the correlations remained in the expected directions, fewer of the relationships were identified as
statistically significant. In general the proxy reported instruments performed better than their self-complete
counter parts in terms of their associations with the non-utility based health measures. However, none of the
correlations were above 0.4 indicating relatively poor associations in general.
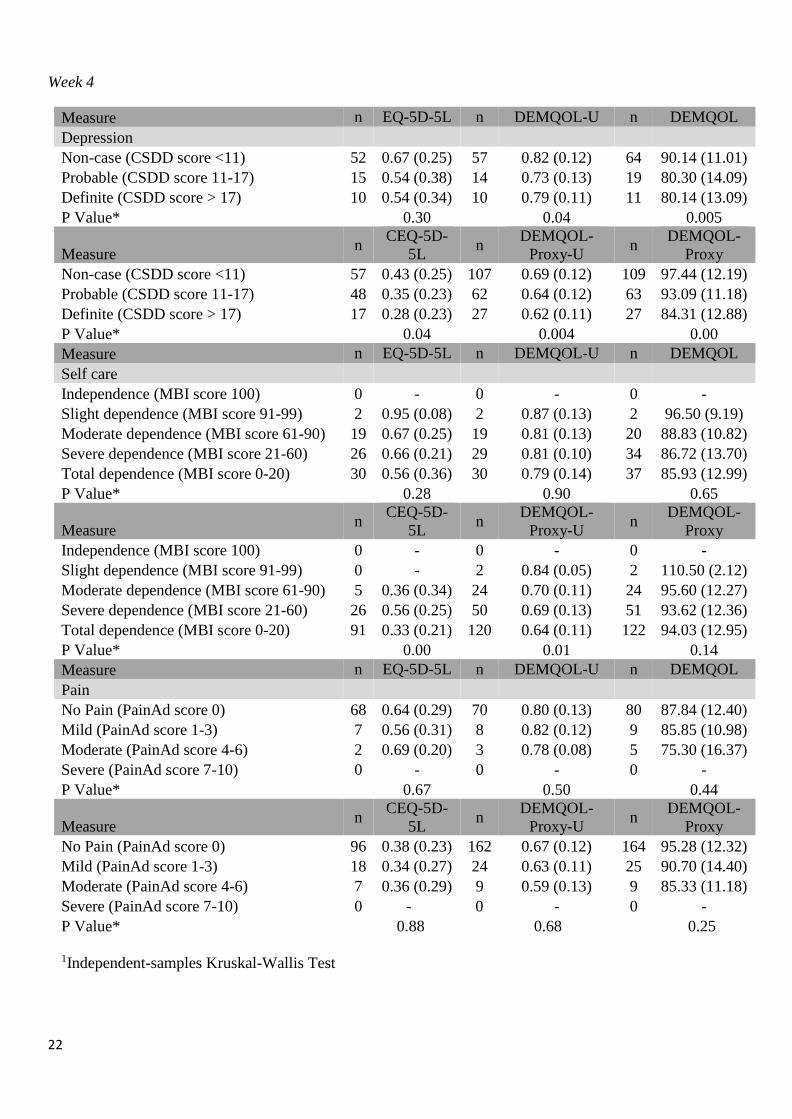
Known group Validity
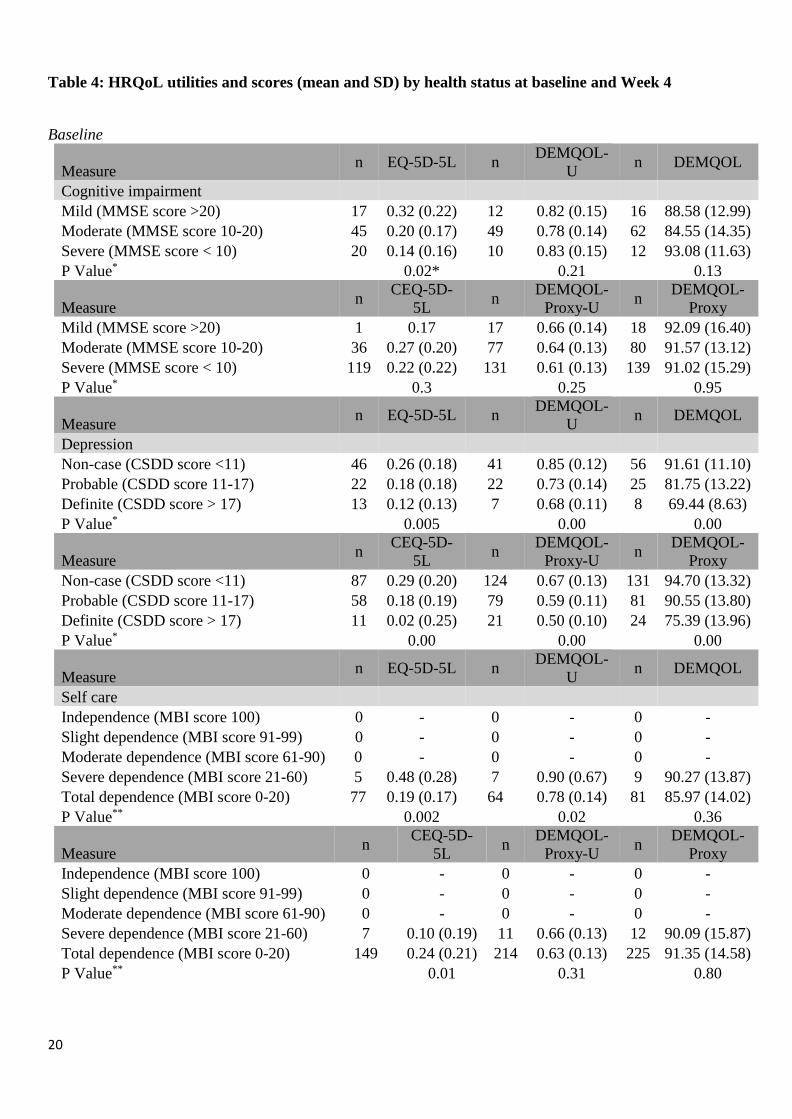
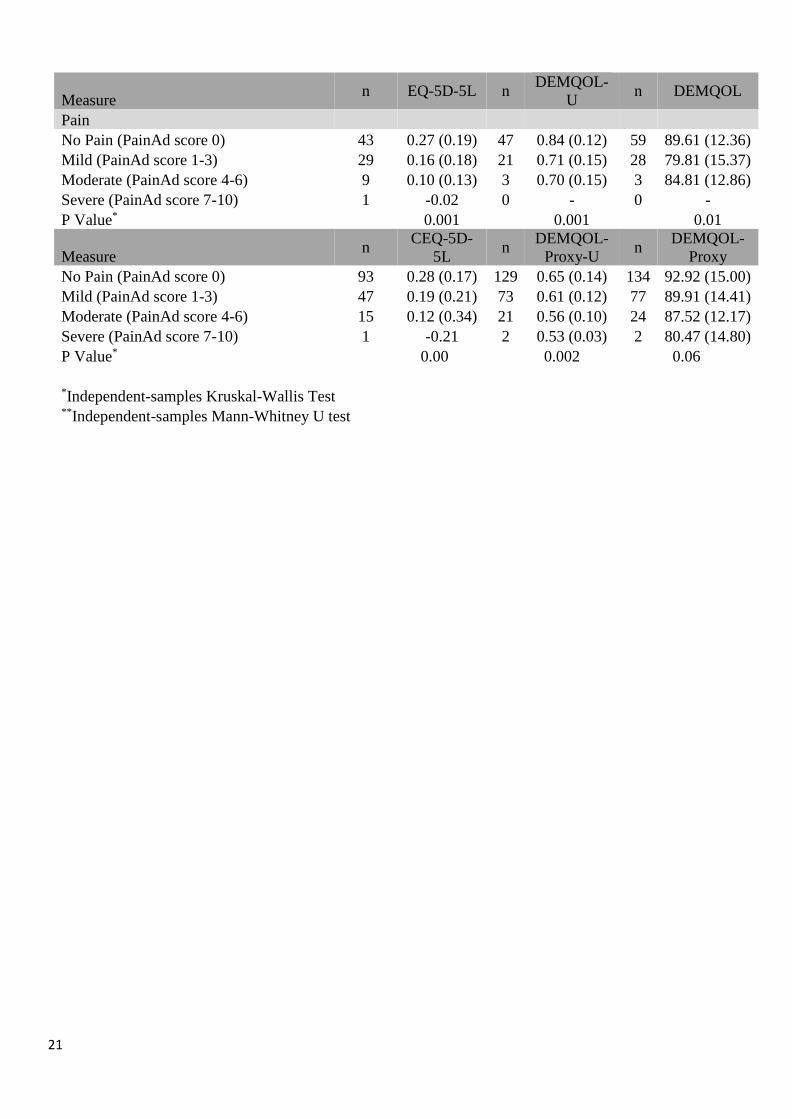
Table 4 presents the mean patient and carer utility scores (plus the non-utility versions of DEMQOL)
categorised into severity groups of the non-utility based measures of health. For cognitive impairment, as
measured by the MMSE, the EQ-5D-5L, DEMQOL-Proxy-U and DEMQOL-Proxy all behave as would be
expected with lower utilities associated with more severe levels of cognitive impairment. The DEMQOL-U
and the DEMQOL follow a similar pattern in that utility decreases as cognitive impairment increases from
mild to moderate however utility increases again at levels of severe cognitive impairment. This finding was
unexpected but may at least partly be explained by the relatively small proportion of individuals classified
with severe cognitive impairment who self-completed the DEMQOL and the DEMQOL-U measures. For
depression, measured by the CSDD, all of the instruments behave as one would expect at both time-points
with utilities decreasing as the severity of depression increases. For self-care, as measured by the MBI, all
individuals were classified into the two most severe groups (severe dependence or total dependence). The
three self-reported measures (EQ-5D, DEMQOL and DEMQOL-U) and the DEMQOL-Proxy-U behaved as
expected with utilities decreasing as severity increases. For the CEQ-5D-5L and the DEMQOL-Proxy
however, utility increases slightly with severity. Finally, all the utility measures behaved as expected in
relation to the PainAd instrument at both time-points with utilities falling as reported pain levels increased.

10
4. Discussion
This study represents the first study internationally to empirically compare the measurement properties of
the DEMQOL-U and DEMQOL-Proxy-U to the EQ-5D-5L and CEQ-5D-5L in a post-acute population of
older people living in residential care. Evidence is presented regarding the acceptability, validity and
responsiveness of the DEMQOL-U and DEMQOL-Proxy-U dementia specific preference based HRQoL
measurement system and the EQ-5D generic preference based measure in comparison with external
indicators of dementia related health status and the original DEMQOL and DEMQOL-Proxy. Patient/proxy
agreement was also assessed between the DEMQOL-U and DEMQOL-Proxy-U. To our knowledge only
one other study has empirically compared the DEMQOL-U and DEMQOL-Proxy-U to the EQ-5D-5L and
CEQ-5D-5L (Mulhern et al, 2013). In comparison with our study population, the study by Mulhern and
colleagues was undertaken in a sample with a higher prevalence of individuals (88%) with mild to moderate
cognitive impairment classified according to the MMSE, with only 12% of individuals exhibiting severe
cognitive impairment (MMSE score<10). In contrast, the majority of individuals in our study (58%) were
classified with severe cognitive impairment according to this definition. In addition to high levels of
cognitive impairment, the individuals in our study sample were also physically frail and due to the nature of
their condition (in the early post recovery stage following a hip fracture) almost all were classified as totally
dependent at baseline. The differences in study populations are reflected in baseline EQ-5D scores with a
mean EQ-5D score of 0.24 in this study relative to a mean EQ-5D score of 0.68 in the UK study population.
As expected, given the differential nature of the respective study populations in terms of the levels of
cognitive impairment, the DEMQOL-U and DEMQOL-Proxy-U scores in this study were also lower than
those reported by Mulhern and colleagues, although the magnitude of the differences was not as marked as
those found for the EQ-5D.
Overall, we found little evidence of agreement between the DEMQOL-U and EQ-5D, and CEQ-5D and
DEMQOL-Proxy-U at baseline. This finding is unsurprising given the dementia condition specific focus of
the DEMQOL instruments in contrast to the EQ-5D which is a generic health status instrument with a
particular focus upon physical functioning dimensions (such as mobility, self-care and the ability to perform

11
usual activities) which are severely impacted in the immediate period following a hip fracture. At four weeks
follow up, improvements in physical functioning were evident in general for our study sample.
Consequently, a good level of agreement was found between the DEMQOL-U and EQ-5D, and CEQ-5D
and DEMQOL-Proxy-U at week 4. However it is notable that there was a higher level of agreement at the
upper end of the utility scale with the majority of the disagreement occurring at the more severe end of the
utility scale. Similar findings were also noted from the agreement assessment conducted by Mulhern and
colleagues.
The evidence in relation to the convergent validity of the instruments with other measures of cognition,
depression, functioning and pain is mixed with moderate correlations being observed in general at baseline
but poorer correlations at week 4. In relation to known group validity overall all of the instruments
demonstrated a reasonable level of performance in relation to the severity classifications of the non-utility
based health measures, with utilities falling in general as severity classifications increased. Some exceptions
to this general response pattern were noted but these were likely largely explained by the relative small
proportion of individuals in some categories.
Examination of the distribution of utility values indicated that the DEMQOL-U and its proxy version
systematically produced higher utility values relative to the EQ-5D-5L and CEQ-5D-5L. This finding may
be due to differences in the classification systems, which are sensitive to different dimensions of HRQoL
and also due to large differences in the possible utility scale range. The EQ-5D-5L utility scores range from -
0.281 to 1 while the DEMQOL-U utility scores range from 0.243 to 0.986 and the DEMQOL-Proxy-U
utility scores range from 0.363 to 0.937. At the dimension level, for this study population we found that the
EQ-5D-5L and CEQ-5D-5L instruments demonstrated a higher tendency to exhibit floor effects whereas the
DEMQOL-U and the DEMQOL-Proxy-U exhibited a higher tendency to exhibit ceiling effects. The higher
tendency towards ceiling effects for the DEMQOL-U and the DEMQOL-Proxy-U indicates that these
instruments may not be as sensitive to improvements over time in HRQoL in this post-acute population of
frail older people recovering from a hip fracture. It is evident that both the EQ-5D-5L and CEQ-5D-5L
12
utility scores demonstrated significant improvements between baseline and Week 4 whereas the DEMQOL-
U and the DEMQOL-Proxy-U deteriorated during this time period. This finding raises important questions
relating to the choice of the most appropriate instrument for the measurement and valuation of HRQoL in
post-acute populations of frail older people living in residential care with high degrees of cognitive
impairment and dementia. This study indicates that the EQ-5D was more responsive to the physical recovery
trajectory experienced by the frail older people participating in the randomised controlled trial from which
this study emanates, where as it is likely that the DEMQOL-U and DEMQOL-Proxy-U instruments were
more responsive to the accelerations in cognitive decline and dementia often experienced by frail older
people in the period following a hip fracture.
The study also raises important questions about an individual’s ability to provide a reliable self-assessment
of their HRQoL relative to a proxy assessor. A limitation of this study in this regard is that dyad assessments
of HRQoL were only available for a proportion of the total sample (N=67 representing 28% and N=79
representing 33% at baseline and week 4 respectively) and only for the DEMQOL-U and the DEMQOL-
Proxy-U instruments. Investigation of the agreement in utility values between self and proxy rated HRQoL
indicated only a poor to moderate level of agreement overall with proxy assessors tending to report lower
HRQoL than individuals themselves. Similar tendencies have been observed in other studies (Coucill et al
2001, Arons et al 2013) and these findings have potentially important implications for the results of
economic evaluation studies.
5. Conclusions
This study presents important insights into the HRQoL of a post-acute population of frail older people in
residential care, previously evocatively described as members of the ‘lost tribe’ (Stott et al, 2008). The
findings from this study provide support for the validity and agreement DEMQOL utility measures in
comparison with the widely used generic preference-based measure EQ-5D in populations of older people
with moderate to severe levels of cognitive impairment. This study highlights important questions relating to
the choice of the most appropriate preference based instrument for the measurement and valuation of

13
HRQoL in post-acute populations of frail older people living in residential care. Further research should be
conducted to explore the implications of proxy versus self-assessment of health related quality of life for
economic evaluation.

14
References
Alexopoulos GS, Abrams RC, Young RC, & Shamoian CA. (1988). Cornell Scale for Depression in
Dementia. Biological Psychiatry. 23, 271-84.
Ankri J, Beaufils B, Novella JL, Morrone I, Guillemin F, Jolly D, Ploton L, & Blanchard F. (2003). Use of
the EQ-5D among patients suffering from dementia. Journal of Clinical Epidemiology. 56, 1055-1063.
Arons A, Van Der Wilt G, Krabbe P, Scholzel-Dorenbos CJ, & Rikkert M. (2013). Quality of life in
dementia: A study on proxy bias. BMC Medical Research Methodology. 13.
Braithwaite RS, Col NF, & Wong JB. (2003). Estimating Hip Fracture Morbidity, Mortality and
Costs. Journal of the American Geriatrics Society. 51, 364-370.
Brazier J, & Ratcliffe J. (2007). Measuring and valuing health benefits for economic evaluation. Nueva
York, Oxford University Press.
Choong PF, Langford AK, Dowsey MM, & Santamaria NM. (2000). Clinical pathway for fractured neck of
femur: a prospective, controlled study. The Medical Journal of Australia. 172, 423-6.
Coucill W, Bryan S, Bentham P, Buckley A, & Laight A. (2001). EQ-5D in patients with dementia: an
investigation of inter-rater agreement. Medical Care. 39, 760-71.
Crotty M, & Ratcliffe J. (2011). If Mohammed won't come to the mountain, the mountain must go to
Mohammed. Age and Ageing. 40, 290-2.
Dancey CP, & Reidy J. (2004). Statistics without maths for psychology: using SPSS for Windows. Harlow,
Prentice Hall.
Devine A, Diaz-Ordaz K, Taylor SJC, Eldridge S, Spencer A, & Underwood M. (2014). The agreement
between proxy and self-completed EQ-5D for care home residents was better for index scores than
individual domains. Journal of Clinical Epidemiology. 67, 1035-1043.
Devlin N, SDhah K, Feng Y, Mulhern B, Van Hout B (2016). Valuing health related quality of life: An EQ-
5D-5L value set for England. HEDS Discussion Paper No 16.02, University of Sheffield.
Diaz-Redondo A, Rodriquez-Blazquez C, Ayala A, Martinez-Martin P, & Forjaz MJ. (2014). EQ-5D rated
by proxy in institutionalized older adults with dementia: psychometric pros and cons. Geriatrics &
Gerontology International. 14, 346-53.
Folstein MF, Folstein SE, & McHugh PR. (1975). "Mini-mental state". A practical method for grading the
cognitive state of patients for the clinician. Journal of Psychiatric Research. 12, 189-98.
Giles LC, Hawthorne G, & Crotty M. (2009). Health-related Quality of Life among hospitalized older
people awaiting residential aged care. Health and Quality of Life Outcomes. 7, 1-7.
Gordon AL, Franklin M, Bradshaw L, Logan P, Elliot R, & Gladman JR. (2014). Health status of UK care
home residents: a cohort study. Age and Ageing. 43, 97-103.
Herdman M, Gudex C, Lloyd A, Janssen M, Kind P, Parkin D, Bonsel G, & Badia X. (2011). Development
and preliminary testing of the new five-level version of EQ-5D (EQ-5D-5L). Quality of Life Research. 20,
1727-1736.
15
Hounsome N, Orrell M, & Edwards RT. (2011). EQ-5D as a quality of life measure in people with dementia
and their carers: evidence and key issues. Value in Health: the Journal of the International Society for
Pharmacoeconomics and Outcomes Research. 14.
Kane R, Kling K, Bershadsky B, Kane L, Giles K, Degenholtz H,et al. (2003): Quality of life measures for
nursing home residents. Journal of Gerontology: Medical Science . 58A:240-8.
Koval KJ, & Zuckerman JD. (1994). Functional recovery after fracture of the hip. The Journal of Bone and
Joint Surgery. American Volume. 76, 751-8.
Kurlowicz LH, Evans LK, Strumpf NE, & Maislin G. (2002). A psychometric evaluation of the Cornell
Scale for Depression in Dementia in a frail, nursing home population. The American Journal of Geriatric
Psychiatry: Official Journal of the American Association for Geriatric Psychiatry. 10.
Moniz-Cook E, et al. (2008). A European consensus on outcome measures for psychosocial intervention
research in dementia care. Aging & Mental Health. 12, 14-29.
Mulhern B, et al. (2013). Development of DEMQOL-U and DEMQOL-PROXY-U: generation of
preference-based indices from DEMQOL and DEMQOL-PROXY for use in economic evaluation. Health
Technology Assessment (Winchester, England). 17.
Ratcliffe J, Laver K, Couzner L, Cameron I, Gray L, Crotty M. (2010). Not just about costs: the role of
health economics in facilitating decision-making in aged care. Age and Ageing. 39, 426-429.
Rowen D, Mulhern B, Banerjee S, Van Hout B, Young TA, Knapp M, Smith SC, Lamping DL, & Brazier
JE. (2012). Estimating Preference-Based Single Index Measures for Dementia Using DEMQOL and
DEMQOL-Proxy. Value in Health. 15, 346-356.
Shah S, Vanclay F, Cooper B. (1989) Improving the sensitivity of the Barthel Index for stroke rehabilitation.
Journal Clinical Epidemiology. 42, 703-9.
Smith SC, et al. (2005). Measurement of health-related quality of life for people with dementia:
development of a new instrument (DEMQOL) and an evaluation of current methodology. Health
Technology Assessment (Winchester, England). 9, 1-93.
Smith SC, et al. (2007). Development of a new measure of health-related quality of life for people with
dementia: DEMQOL. Psychological Medicine. 37, 737-46.
Stott D, Langhorne P, Knight PV. (2008). Multidisciplinary care for elderly people in the community.
Lancet.. 371, 699–700.
Tombaugh TN, & McIntyre NJ. (1992). The mini-mental state examination: A comprehensive
review. Journal of the American Geriatrics Society. 40, 922-935.Warden V, Hurley A, & Volicer L. (2003).
Warden V, Hurley A, Volicer L. Development and Psychometric Evaluation of the Pain Assessment in
Advanced Dementia (PAINAD) Scale. J Am Med Dir Assoc 2003; 4:9-15.
16
Table 1: Characteristics of the study sample at baseline and summary statistics for EQ-5D, CEQ-5D,
DEMQOL-U and DEMQOL-Proxy-U across the study period.
Characteristic n Mean (SD) or %
Participant profile
Age 240 88.6 (5.6)
Female 178 74.2
Cognitive impairment
MMSE total score 240 8.0 (7.8)
Mild (MMSE score >20) 18 7.5
Moderate (MMSE score 10-20) 82 34.2
Severe (MMSE score <10) 140 58.3
Severity of depression
CSDD total score 238 10.3 (5.4)
Non-case (CSDD score <6) 46 19.3
Probable (CSDD score 6-10) 87 36.6
Definite (CSDD score >10) 105 44.1
Pain
PainAd total score 240 1.1 (1.7)
No Pain (PainAd score 0) 137 57.1
Mild (PainAd score 1-3) 77 32.1
Moderate (PainAd score 4-6) 24 10
Severe (PainAd score 7-10) 2 0.8
Self-care
MBI total score 240 9.3 (6.8)
Independence (MBI score 100) 0 0
Slight dependence (MBI score 91-99) 0 0
Moderate dependence (MBI score 61-90) 0 0
Severe dependence (MBI score 21-60) 12 5
Total dependence (MBI score 0-20) 228 95
Measure n
Missing n
(%) Mean (SD) Median (IQR)
EQ-5D-5L
Baseline 82 158 (65.8) 0.21 (0.19) 0.27 (0.16-0.28)
Week 4 109 131 (54.6) 0.45 (0.38) 0.49 (0.00-0.80)
DEMQOL-U
Baseline 71 169 (70.4) 0.79 (0.14) 0.85 (0.68-0.90)
Week 4 113 127 (52.9) 0.58 (0.38) 0.77 (0.00-0.86)
CEQ-5D-5L
Baseline 156 84 (35) 0.23 (0.21) 0.27 (0.18-0.32)
Week 4 122 118 (49.2) 0.38 (0.24) 0.30 (0.21-0.54)
DEMQOL-
Proxy-U
Baseline 225 15 (6.3) 0.63 (0.13) 0.62 (0.52-0.73)
Week 4 228 12 (5) 0.57 (0.26) 0.65 (0.51-0.73)

17
Figure 1: Agreement between DEMQOL-U and EQ-5D, and CEQ-5D and DEMQOL-Proxy-U utility
values at baseline (a) DEMQOL-U vs EQ-5D; (b) DEMQOL-Proxy-U vs CEQ-5D.
18
Figure 2: Agreement between DEMQOL-U and EQ-5D, and CEQ-5D and DEMQOL-Proxy-U utility
values at Week 4 (a) DEMQOL-U vs EQ-5D; (b) DEMQOL-Proxy-U vs CEQ-5D.
19
Table 3: Spearman correlation between HRQoL utilities and health status at baseline and Week 4
Baseline
Measure n EQ-5D-5L n DEMQOL-U n DEMQOL
MMSE 82 0.22* 71 0.05 90 -0.02
CSDD 81 -0.33** 70 -0.59** 89 -0.57**
MBI 82 0.46** 71 0.37** 90 0.25*
PainAd 82 -0.45** 71 -0.46** 90 -0.30**
Measure n CEQ-5D-
5L n
DEMQOL-
Proxy-U n
DEMQOL-
Proxy
MMSE 156 0.12 225 0.18** 237 0.05
CSDD 156 -0.48** 224 -0.48** 236 -0.42**
MBI 156 -0.003 225 0.21** 237 0.01
PainAd 156 -0.37** 225 -0.26** 237 -0.18**
Week 4
Measure n EQ-5D-5L n DEMQOL-U n DEMQOL
CSDD 77 -0.17 81 -0.34** 94 -0.42**
MBI 77 0.16 80 0.14 93 0.16
PainAd 77 -0.06 81 -0.002 94 -0.16
Measure n CEQ-5D-5L n DEMQOL-
Proxy-U n
DEMQOL-
Proxy
CSDD 122 -0.27** 196 -0.20** 199 -0.35**
MBI 122 0.38** 196 0.21** 199 -0.004
PainAd 121 -0.07 195 -0.15* 198 -0.18*
* correlation significant at the 0.05 level (two tailed)
** correlation significant at the 0.01 level (two tailed)
20
Table 4: HRQoL utilities and scores (mean and SD) by health status at baseline and Week 4
Baseline
Measure n EQ-5D-5L n
DEMQOL-
U n DEMQOL
Cognitive impairment
Mild (MMSE score >20) 17 0.32 (0.22) 12 0.82 (0.15) 16 88.58 (12.99)
Moderate (MMSE score 10-20) 45 0.20 (0.17) 49 0.78 (0.14) 62 84.55 (14.35)
Severe (MMSE score < 10) 20 0.14 (0.16) 10 0.83 (0.15) 12 93.08 (11.63)
P Value* 0.02* 0.21 0.13
Measure n
CEQ-5D-
5L n
DEMQOL-
Proxy-U n
DEMQOL-
Proxy
Mild (MMSE score >20) 1 0.17 17 0.66 (0.14) 18 92.09 (16.40)
Moderate (MMSE score 10-20) 36 0.27 (0.20) 77 0.64 (0.13) 80 91.57 (13.12)
Severe (MMSE score < 10) 119 0.22 (0.22) 131 0.61 (0.13) 139 91.02 (15.29)
P Value* 0.3 0.25 0.95
Measure n EQ-5D-5L n
DEMQOL-
U n DEMQOL
Depression
Non-case (CSDD score <11) 46 0.26 (0.18) 41 0.85 (0.12) 56 91.61 (11.10)
Probable (CSDD score 11-17) 22 0.18 (0.18) 22 0.73 (0.14) 25 81.75 (13.22)
Definite (CSDD score > 17) 13 0.12 (0.13) 7 0.68 (0.11) 8 69.44 (8.63)
P Value* 0.005 0.00 0.00
Measure n
CEQ-5D-
5L n
DEMQOL-
Proxy-U n
DEMQOL-
Proxy
Non-case (CSDD score <11) 87 0.29 (0.20) 124 0.67 (0.13) 131 94.70 (13.32)
Probable (CSDD score 11-17) 58 0.18 (0.19) 79 0.59 (0.11) 81 90.55 (13.80)
Definite (CSDD score > 17) 11 0.02 (0.25) 21 0.50 (0.10) 24 75.39 (13.96)
P Value* 0.00 0.00 0.00
Measure n EQ-5D-5L n
DEMQOL-
U n DEMQOL
Self care
Independence (MBI score 100) 0 - 0 - 0 -
Slight dependence (MBI score 91-99) 0 - 0 - 0 -
Moderate dependence (MBI score 61-90) 0 - 0 - 0 -
Severe dependence (MBI score 21-60) 5 0.48 (0.28) 7 0.90 (0.67) 9 90.27 (13.87)
Total dependence (MBI score 0-20) 77 0.19 (0.17) 64 0.78 (0.14) 81 85.97 (14.02)
P Value** 0.002 0.02 0.36
Measure n
CEQ-5D-
5L n
DEMQOL-
Proxy-U n
DEMQOL-
Proxy
Independence (MBI score 100) 0 - 0 - 0 -
Slight dependence (MBI score 91-99) 0 - 0 - 0 -
Moderate dependence (MBI score 61-90) 0 - 0 - 0 -
Severe dependence (MBI score 21-60) 7 0.10 (0.19) 11 0.66 (0.13) 12 90.09 (15.87)
Total dependence (MBI score 0-20) 149 0.24 (0.21) 214 0.63 (0.13) 225 91.35 (14.58)
P Value** 0.01 0.31 0.80
21
Measure n EQ-5D-5L n
DEMQOL-
U n DEMQOL
Pain
No Pain (PainAd score 0) 43 0.27 (0.19) 47 0.84 (0.12) 59 89.61 (12.36)
Mild (PainAd score 1-3) 29 0.16 (0.18) 21 0.71 (0.15) 28 79.81 (15.37)
Moderate (PainAd score 4-6) 9 0.10 (0.13) 3 0.70 (0.15) 3 84.81 (12.86)
Severe (PainAd score 7-10) 1 -0.02 0 - 0 -
P Value* 0.001 0.001 0.01
Measure n
CEQ-5D-
5L n
DEMQOL-
Proxy-U n
DEMQOL-
Proxy
No Pain (PainAd score 0) 93 0.28 (0.17) 129 0.65 (0.14) 134 92.92 (15.00)
Mild (PainAd score 1-3) 47 0.19 (0.21) 73 0.61 (0.12) 77 89.91 (14.41)
Moderate (PainAd score 4-6) 15 0.12 (0.34) 21 0.56 (0.10) 24 87.52 (12.17)
Severe (PainAd score 7-10) 1 -0.21 2 0.53 (0.03) 2 80.47 (14.80)
P Value* 0.00 0.002 0.06
*Independent-samples Kruskal-Wallis Test **Independent-samples Mann-Whitney U test
22
Week 4
Measure n EQ-5D-5L n DEMQOL-U n DEMQOL
Depression
Non-case (CSDD score <11) 52 0.67 (0.25) 57 0.82 (0.12) 64 90.14 (11.01)
Probable (CSDD score 11-17) 15 0.54 (0.38) 14 0.73 (0.13) 19 80.30 (14.09)
Definite (CSDD score > 17) 10 0.54 (0.34) 10 0.79 (0.11) 11 80.14 (13.09)
P Value* 0.30 0.04 0.005
Measure n
CEQ-5D-
5L n
DEMQOL-
Proxy-U n
DEMQOL-
Proxy
Non-case (CSDD score <11) 57 0.43 (0.25) 107 0.69 (0.12) 109 97.44 (12.19)
Probable (CSDD score 11-17) 48 0.35 (0.23) 62 0.64 (0.12) 63 93.09 (11.18)
Definite (CSDD score > 17) 17 0.28 (0.23) 27 0.62 (0.11) 27 84.31 (12.88)
P Value* 0.04 0.004 0.00
Measure n EQ-5D-5L n DEMQOL-U n DEMQOL
Self care
Independence (MBI score 100) 0 - 0 - 0 -
Slight dependence (MBI score 91-99) 2 0.95 (0.08) 2 0.87 (0.13) 2 96.50 (9.19)
Moderate dependence (MBI score 61-90) 19 0.67 (0.25) 19 0.81 (0.13) 20 88.83 (10.82)
Severe dependence (MBI score 21-60) 26 0.66 (0.21) 29 0.81 (0.10) 34 86.72 (13.70)
Total dependence (MBI score 0-20) 30 0.56 (0.36) 30 0.79 (0.14) 37 85.93 (12.99)
P Value* 0.28 0.90 0.65
Measure n
CEQ-5D-
5L n
DEMQOL-
Proxy-U n
DEMQOL-
Proxy
Independence (MBI score 100) 0 - 0 - 0 -
Slight dependence (MBI score 91-99) 0 - 2 0.84 (0.05) 2 110.50 (2.12)
Moderate dependence (MBI score 61-90) 5 0.36 (0.34) 24 0.70 (0.11) 24 95.60 (12.27)
Severe dependence (MBI score 21-60) 26 0.56 (0.25) 50 0.69 (0.13) 51 93.62 (12.36)
Total dependence (MBI score 0-20) 91 0.33 (0.21) 120 0.64 (0.11) 122 94.03 (12.95)
P Value* 0.00 0.01 0.14
Measure n EQ-5D-5L n DEMQOL-U n DEMQOL
Pain
No Pain (PainAd score 0) 68 0.64 (0.29) 70 0.80 (0.13) 80 87.84 (12.40)
Mild (PainAd score 1-3) 7 0.56 (0.31) 8 0.82 (0.12) 9 85.85 (10.98)
Moderate (PainAd score 4-6) 2 0.69 (0.20) 3 0.78 (0.08) 5 75.30 (16.37)
Severe (PainAd score 7-10) 0 - 0 - 0 -
P Value* 0.67 0.50 0.44
Measure n
CEQ-5D-
5L n
DEMQOL-
Proxy-U n
DEMQOL-
Proxy
No Pain (PainAd score 0) 96 0.38 (0.23) 162 0.67 (0.12) 164 95.28 (12.32)
Mild (PainAd score 1-3) 18 0.34 (0.27) 24 0.63 (0.11) 25 90.70 (14.40)
Moderate (PainAd score 4-6) 7 0.36 (0.29) 9 0.59 (0.13) 9 85.33 (11.18)
Severe (PainAd score 7-10) 0 - 0 - 0 -
P Value* 0.88 0.68 0.25
1Independent-samples Kruskal-Wallis Test