Embed Size (px)
Citation preview

1

2
This figure shows the difference in real‐time resolution of azimuthal resistivity data with Sperry’s AFR tool. The log on the right shows the IXO transmitted data in real‐time and the log on the left shows the same data using mud pulse telemetry. The IXO offers real‐time bed boundary definition with much more clarity than was achievable before with conventional telemetry techniques.
Normally you would only get this kind of result with a recorded log or wireline.

3

Stress the achievements, the uniqueness of the technology
4

5

6
In general, The IntelliServ Network system is composed of four main components(we will see them in more detail later).
The Interface sub connects to the MWD/LWD and RSS tools to allow bi‐directionalcommunication of logs and commands.
The IntelliLinks boost the signal to ensure a proper signal to noise ratio and avoiddata loss. They also allow for measurements to be taken at their position on thewellbore. The measurement included with the first generation IntelliPipe istemperature (in the Link).
The IntelliPipe is the heart of the system, it allows high reliability data transmissionthrough the drill pipe.
The top drive swivel allows for data to be extracted to the surface system while thedrill pipe rotates.

7
The IntelliServ network is an open Network where anyone can connect to takeadvantage of its capabilities…
Each service company manufactures an Interface sub jointly with IntelliServ. TheInterface sub, which is owned by the service company, allows bi‐directionalcommunication from the network to the downhole tools.
Data from the downhole tools is then delivered on surface to the service companyvia the IntelliServerTM. This way making IntelliServ transparent for the datarecipient.

8

9
The heart of The IntelliServ® Network is the high speed telemetry drill pipe.
Each joint of drill pipe is modified for high speed communications by use of inductivecoils installed on pin and box secondary shoulders.
The coils connect to a high‐speed, high‐strength data cable that is anchored at thepipe joint, The cable exits to the internal diameter of the tubular at the upset andruns under tension along the inside of the pipe without affecting drill pipeproperties.
Once made up, the coils come near each other and induce the signals down the pipewithout direct contact.
The heart of the system is the IntelliPipe. It transmits data from one end to the otherof the pipe by way of a set of patented inductive coils that are connected to a high‐strength, high‐speed steel cable. The cable is connected to the coils through a smallconduit inside the pipe connection. (next slide)

10
Please observe how the IntelliServ technician will extract the information from theNetwork as the pipe is being tripped in without adding any extra time to theprocess…. With battery powered LWD tools now available, we are able to obtain allthe LWD measurements through this means also…

Jet sub
NOV Jar
RSS and LWD
11

12
A key component of The IntelliServ Network is the Top Drive Interface Swivel which
provides the interface between rotating and stationary environments. It is installed
at the lower end of the top drive assembly (often replacing an existing saver sub), and
consists of a telemetry‐enabled sub inductively coupled to a non‐rotating member.
Network traffic moves through the sub and into the swivel, which in turn is connected
to IntelliServ’s data acquisition system via surface cabling.

13

15

16

17

18

19
20

21
22

23
Courtesy of Baker Hughes Inteq. This is an image of what a formation image log willlook like when transmitted over the IntelliServ Network… rather than a few curves,full, uncompressed images will be available in real time.

24

25

26

27
From the Drilling Optimization and risk reduction perspective here is an example where Formation Evaluation measurements are used for drilling.
An advantage of the use of drill string telemetry is that images are not compressed when they are transmitted up the hole. If you look at the two images on the left you notice that the Wired pipe image shows some black vertical stripes on the image that the mud pulse image does not show. The dark stripes are a depiction of hole break out or damage that is critical to understand when assessing hole degradation. The compression algorithms on the mud pulse on the left actually hide some of this and are not optimum for interpretation.
The image on the very right shows how the hole looks fully degraded after a number of days of drilling.
Evaluating this allowed BP to save a casing string which can potentially have a positive impact in the safety and risk evaluation on how wells are drilled.

28

The graphic that you see on the screen is a comparison of an actual well’s petrophysical logs acquired while drilling in Real time with both mud pulse technology on the left and with IntelliServ® technology on the right.
The images and analysis are provided courtesy of Halliburton and we really appreciate them letting us use this example. The image on the right is actually the very first petrophysical log transmitted in real time over the IntelliServ® Network. These logs were recently acquired in Oklahoma during the drilling of a test well prior to expected commercial applications.
I would like to bring your attention to a few interesting facts around this image:
•The first one is the one you can’t see. All of the commands sent down to downhole tools during the drilling of this formation were executed “instantaneously”. This was simultaneous to the acquisition of the data.
•Please note that by use of the Networks bandwidth, the driller would not have to drill slower in formations that are usually fast to drill. These images were obtained while drilling at around 100 ft/hr.
•All data comes up hole in Real Time and uncompressed. All the curves are present and this allows for true Real‐Time interpretation of features as small as the ones you see here… in most cases improving the visibility of vertical and wellbore lateral characteristics…
•The white image bar represents the pipe in sliding mode (no rotation) where no images needed to be acquired.
29

30

Commercial work (Pemex)
Underbalanced, hard formations
MWD‐PWD‐Vib‐DGR‐EWR4‐GeoPilot
Slow drilling with lots of vibration
2 vibration related failures (one with Sperry, one with Intellipipe®)
When Intellipipe® failed mud pulse took over without problems
Logistical issues with having Intelliserv® computers away from M/LWD computers (cables and interference)
Some problems related due to inexperience of Intelliserv® personnel (no rig experience)
Some small problems related to learning on all sides
31

32
A real stress test to the IntelliServ technology. A horizontal well which Geosteeringwas planned around the presence of the IntelliServ Network. This reservoirpresents total fluid losses while drilling through it and The IntelliServ Networkprovided data from the MWD, LWD and Rotary Steerable tools at all times. Thereservoir section alone took 45 days to drill in extreme (but within specification)conditions for the Network. The Network worked for about 45 days in thisenvironment with no issues to transmit data.

33
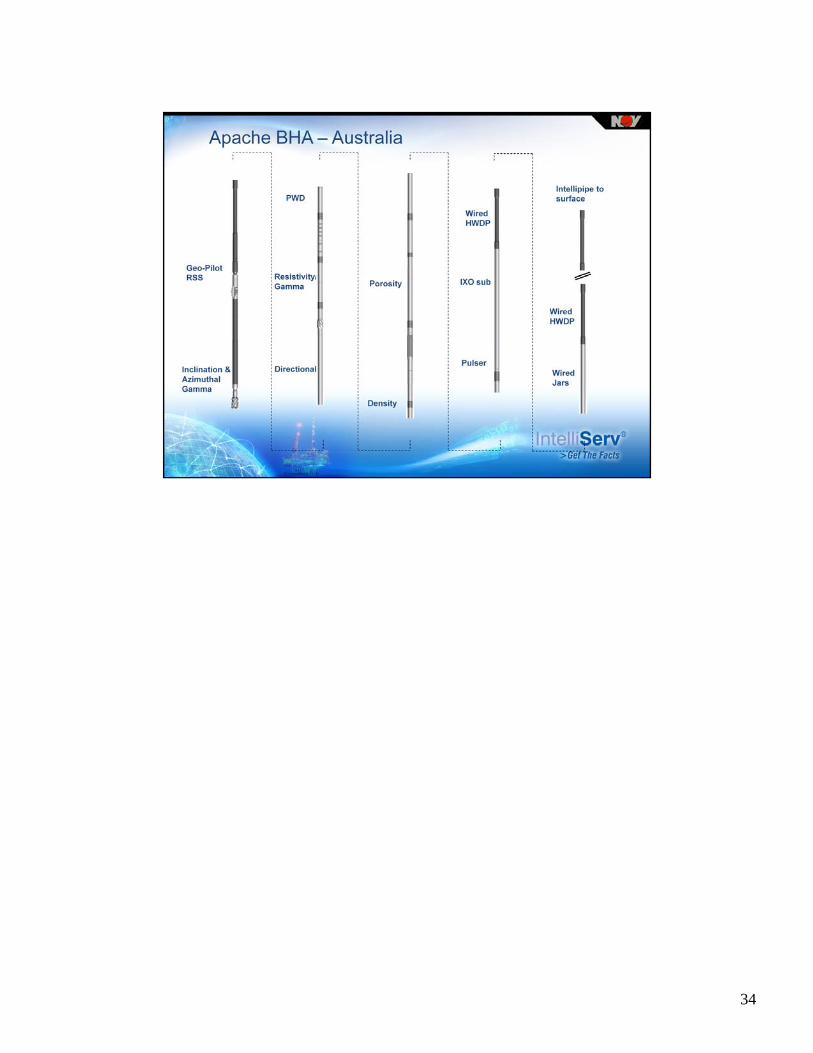
34

35
Statoil saved two days rig time by saving trips. The first trip was saved by confirmingthrough the Network that all systems operated properly as the drill string was notbuilding enough angle. Rather than tripping, the drilling team confirmed that therewas no risk in “falling behind the curve” and continued to drill. A second trip wassaved after irregular torque on the drillstring appeared as a reamer not opening thehole to the desired diameter. By pulling up to the suspicious zone and logging acaliper log in real time, the hole gauge was confirmed to be as planned. The onlyother method to confirm that a reamer works is to pull out and physically check thetool.

36
Baker INTEQ’s, At Balance and IntelliServ technologies were combined to engineer a constant bottom hole pressure system with Real Time feedback. In this case the systems were modified to acquire the annular pressure while drilling measurement with the MWD, transmit it to surface via IntelliServ, feed the measurements to the Dynamic annular pressure control system which commands a back pressure setting in less than 10 seconds lag time.
The Principal purpose for the use of these integrated technologies is to eliminate the risk of gas accumulating in the annulus.
The Shoe strength is the weakest point in the designed open hole.
Given this, in case of an influx, there was no tolerance to shut in the well which would break the shoe and cause a complex well control problem.
The drilling margin in this case was only of about 200 psi. IT WAS CRITICAL NOT TO EXCEED THAT DRILLING MARGIN.

37
Once the system operates, please note at the blue line which is the measured bottom hole pressure which stays within 5‐10 psi of it’s average even during connections. The blue line is also usually a collection of dots since the annular pressure is usually sent up hole only every few minutes. In this case it is a continuous line of measurements every 2 seconds. The measurements can also be taken when no circulation present thanks to a Baker INTEQ downhole battery pack which powers the pressure sensor system even when no flow is present.
This is an example of drilling with 3 connections included where the system compensated for the reduction of ECD by applying the backpressure where needed. Note that although the backpressure was set to remain constant during drilling, the BHP does not exceed the 150 psi limit set by the drilling team.
This is a good opportunity to remind all of us that there were only 6 minutes to react to any influx and that the modified complete system as implemented had a total turn around time of about 10 seconds.
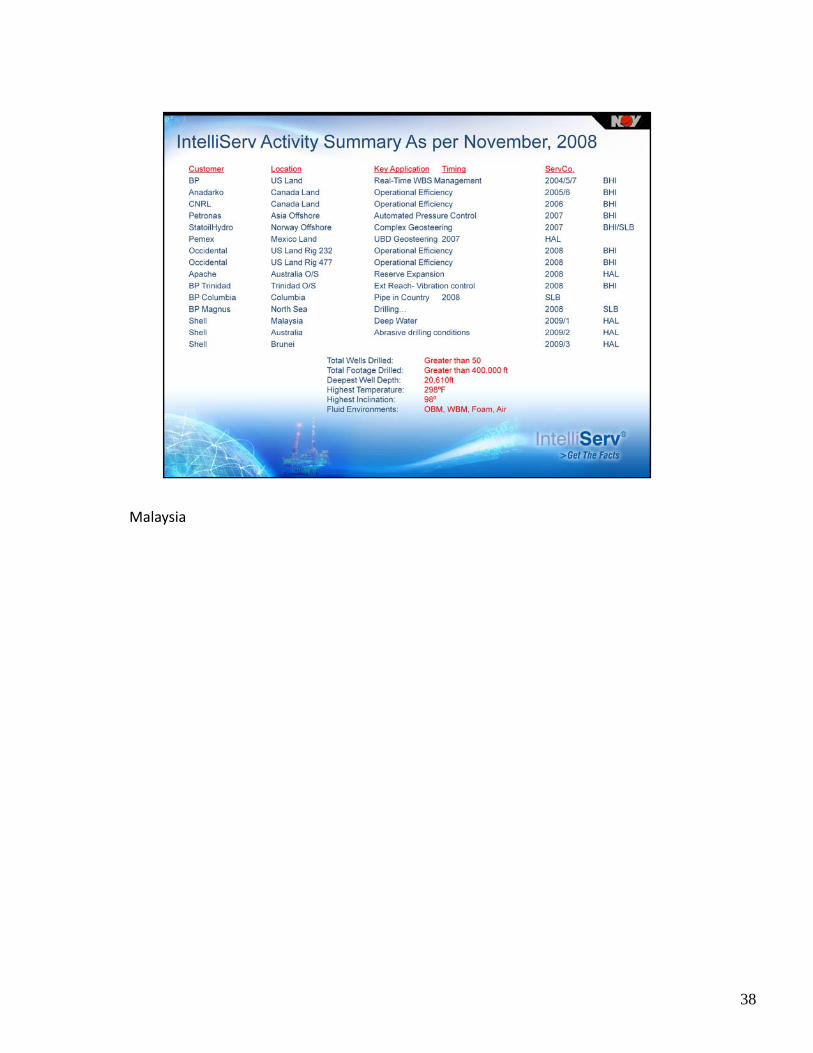
Malaysia
38

39

40

41