Embed Size (px)
Citation preview
Full year results 2012 – February 13th, 2013 2
This presentation does not constitute an offer to sell, or a solicitation of an offer to buy, PEUGEOT
SA (“Company”) shares.
This presentation may contain forward-looking statements. Such forward-looking statements do not
constitute forecasts regarding the Company’s results or any other performance indicator, but rather
trends or targets, as the case may be. These statements are by their nature subject to risks and
uncertainties as described in the registration document filed with the French Autorité des Marchés
Financiers (AMF). These statements do not reflect future performance of the Company, which may
materially differ.
The Company does not undertake to provide updates of these statements.
More comprehensive information about PSA PEUGEOT CITROËN may be obtained on group
website (www.psa-peugeot-citroen.com), under Regulated Information.
Full year results 2012 – February 13th, 2013 3
Agenda
▐ 2012 Highlights Philippe Varin
▐ Financial results Jean-Baptiste de Chatillon
▐ Strategic update Philippe Varin

2012 HIGHLIGHTS Philippe Varin
Chairman of the Managing Board
Full year results 2012 – February 13th, 2013 5
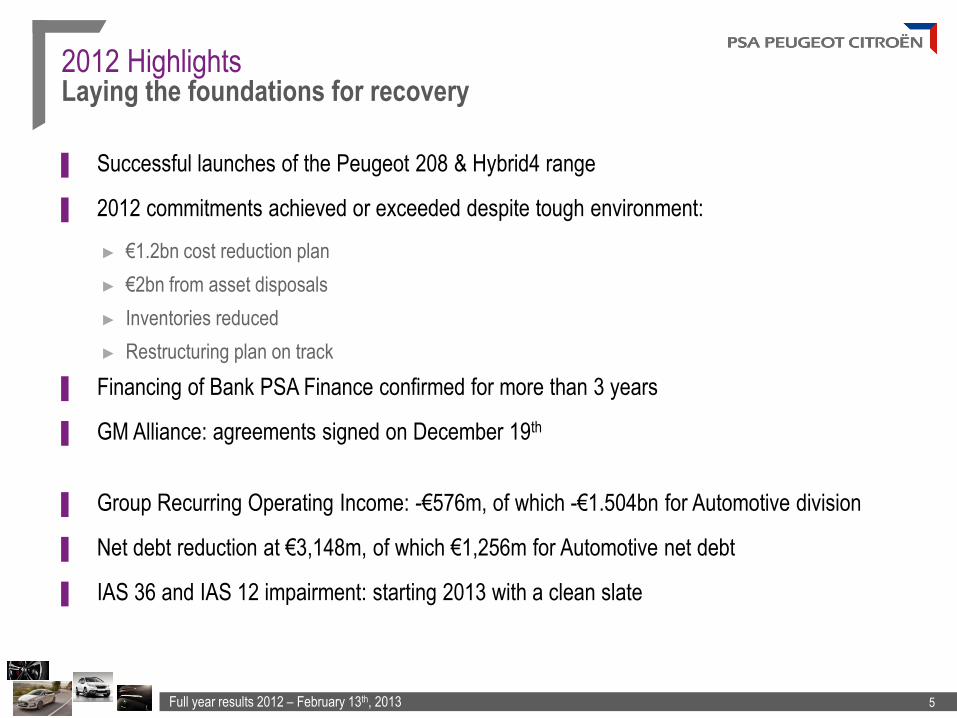
2012 Highlights Laying the foundations for recovery
▐ Successful launches of the Peugeot 208 & Hybrid4 range
▐ 2012 commitments achieved or exceeded despite tough environment:
► €1.2bn cost reduction plan
► €2bn from asset disposals
► Inventories reduced
► Restructuring plan on track
▐ Financing of Bank PSA Finance confirmed for more than 3 years
▐ GM Alliance: agreements signed on December 19th
▐ Group Recurring Operating Income: -€576m, of which -€1.504bn for Automotive division
▐ Net debt reduction at €3,148m, of which €1,256m for Automotive net debt
▐ IAS 36 and IAS 12 impairment: starting 2013 with a clean slate
FINANCIAL RESULTS Jean-Baptiste de Chatillon
CFO
Full year results 2012 – February 13th, 2013 7
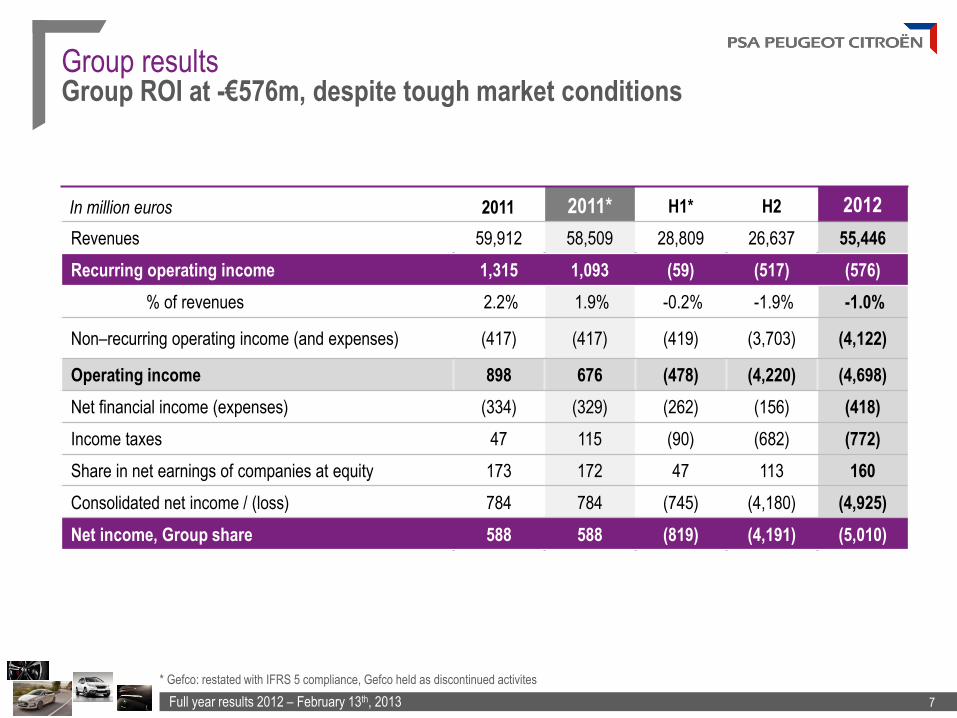
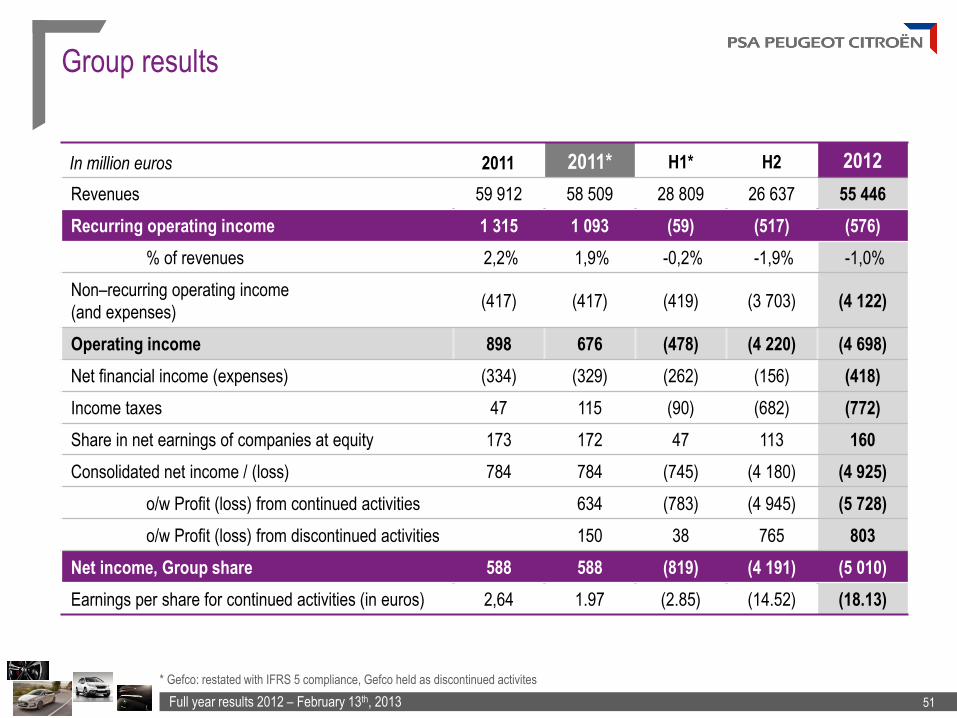
Group results Group ROI at -€576m, despite tough market conditions
In million euros 2011 2011* H1* H2 2012
Revenues 59,912 58,509 28,809 26,637 55,446
Recurring operating income 1,315 1,093 (59) (517) (576)
% of revenues 2.2% 1.9% -0.2% -1.9% -1.0%
Non–recurring operating income (and expenses) (417) (417) (419) (3,703) (4,122)
Operating income 898 676 (478) (4,220) (4,698)
Net financial income (expenses) (334) (329) (262) (156) (418)
Income taxes 47 115 (90) (682) (772)
Share in net earnings of companies at equity 173 172 47 113 160
Consolidated net income / (loss) 784 784 (745) (4,180) (4,925)
Net income, Group share 588 588 (819) (4,191) (5,010)
* Gefco: restated with IFRS 5 compliance, Gefco held as discontinued activites
Full year results 2012 – February 13th, 2013 8
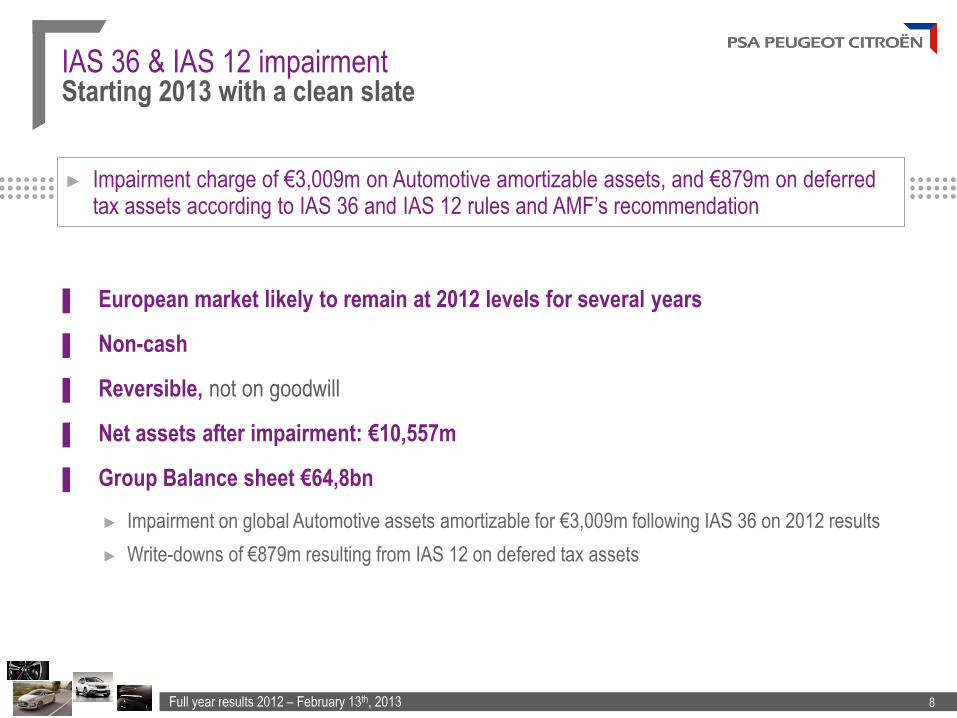
IAS 36 & IAS 12 impairment Starting 2013 with a clean slate
▐ European market likely to remain at 2012 levels for several years
▐ Non-cash
▐ Reversible, not on goodwill
▐ Net assets after impairment: €10,557m
▐ Group Balance sheet €64,8bn
► Impairment on global Automotive assets amortizable for €3,009m following IAS 36 on 2012 results
► Write-downs of €879m resulting from IAS 12 on defered tax assets
► Impairment charge of €3,009m on Automotive amortizable assets, and €879m on deferred tax assets according to IAS 36 and IAS 12 rules and AMF’s recommendation
Full year results 2012 – February 13th, 2013 9
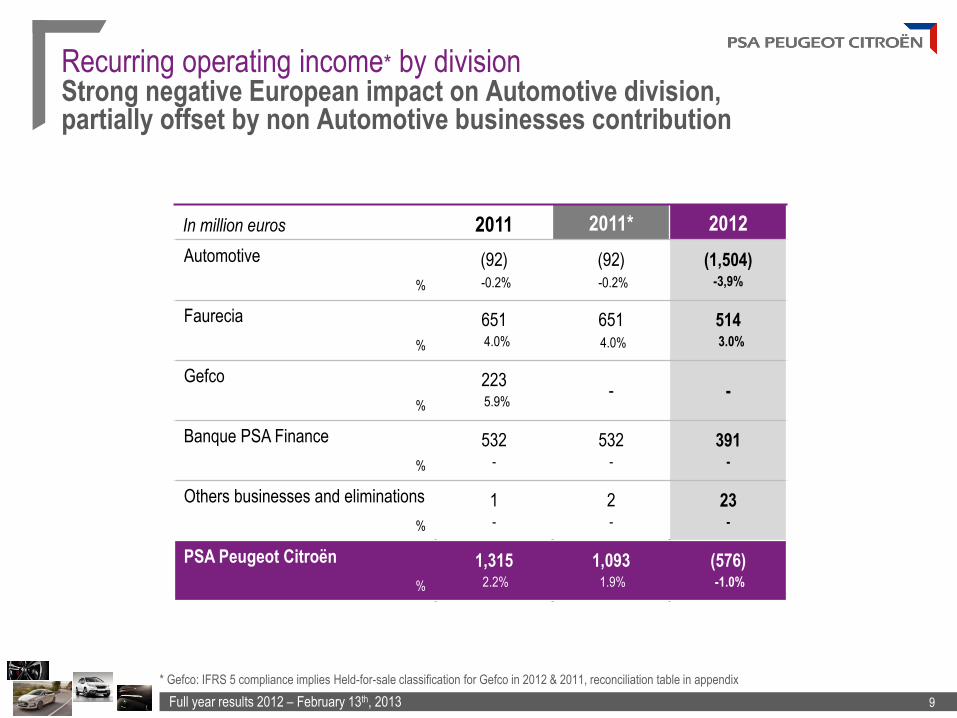
Recurring operating income* by division Strong negative European impact on Automotive division, partially offset by non Automotive businesses contribution
In million euros 2011 2011* 2012
Automotive
%
(92) -0.2%
(92) -0.2%
(1,504) -3,9%
Faurecia
%
651 4.0%
651 4.0%
514 3.0%
Gefco
%
223 5.9%
- -
Banque PSA Finance
%
532 -
532 -
391 -
Others businesses and eliminations
%
1 -
2 -
23 -
PSA Peugeot Citroën
%
1,315 2.2%
1,093 1.9%
(576) -1.0%
* Gefco: IFRS 5 compliance implies Held-for-sale classification for Gefco in 2012 & 2011, reconciliation table in appendix
Full year results 2012 – February 13th, 2013 10
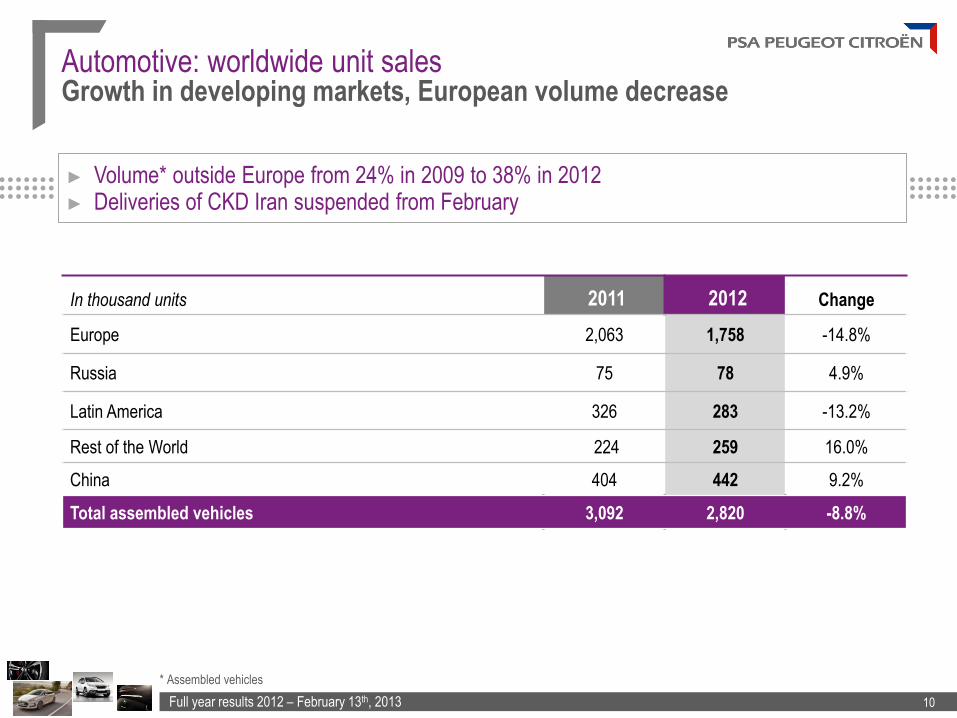
Automotive: worldwide unit sales Growth in developing markets, European volume decrease
In thousand units 2011 2012 Change
Europe 2,063 1,758 -14.8%
Russia 75 78 4.9%
Latin America 326 283 -13.2%
Rest of the World 224 259 16.0%
China 404 442 9.2%
Total assembled vehicles 3,092 2,820 -8.8%
► Volume* outside Europe from 24% in 2009 to 38% in 2012 ► Deliveries of CKD Iran suspended from February
* Assembled vehicles
Full year results 2012 – February 13th, 2013 11
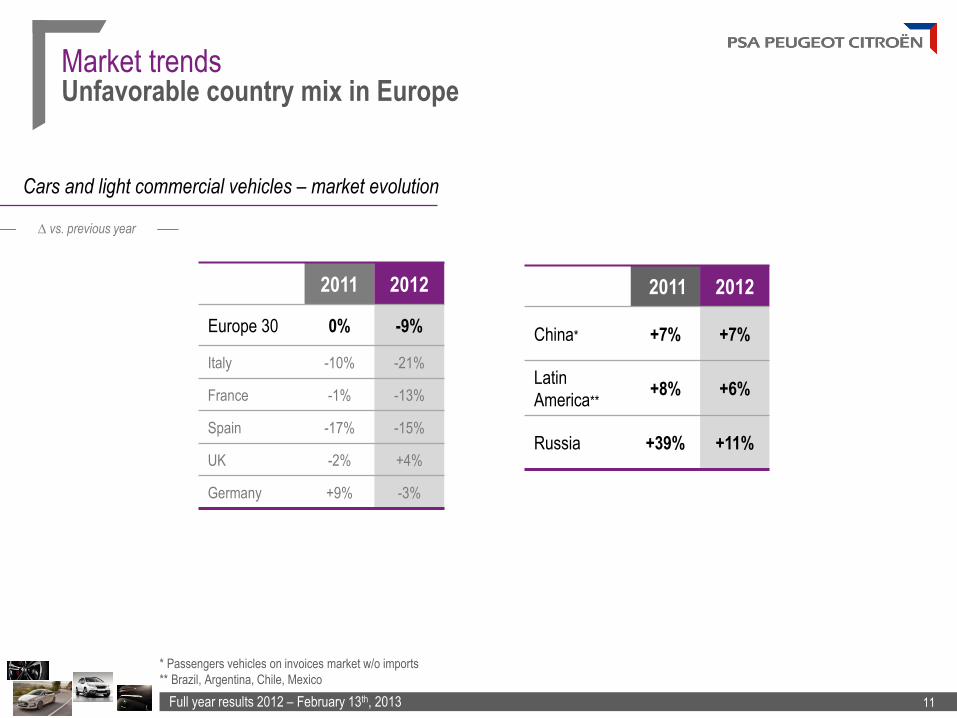
Market trends Unfavorable country mix in Europe
* Passengers vehicles on invoices market w/o imports
** Brazil, Argentina, Chile, Mexico
2011 2012
Europe 30 0% -9%
Italy -10% -21%
France -1% -13%
Spain -17% -15%
UK -2% +4%
Germany +9% -3%
2011 2012
China* +7% +7%
Latin
America** +8% +6%
Russia +39% +11%
Cars and light commercial vehicles – market evolution
∆ vs. previous year
Full year results 2012 – February 13th, 2013 12
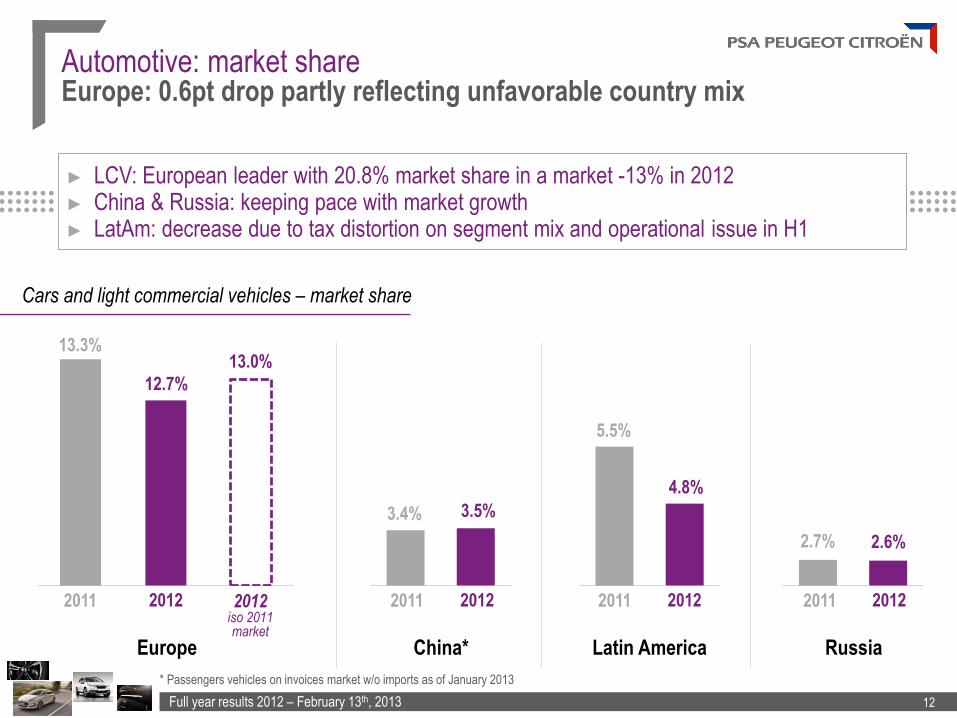
Automotive: market share Europe: 0.6pt drop partly reflecting unfavorable country mix
China* Latin America Russia
2011 2012
3.5% 3.4%
2011 2012 2011 2012
2.6% 2.7%
Europe
2011 2012
12.7%
13.3%
4.8%
5.5%
13.0%
2012 iso 2011 market
* Passengers vehicles on invoices market w/o imports as of January 2013
► LCV: European leader with 20.8% market share in a market -13% in 2012 ► China & Russia: keeping pace with market growth ► LatAm: decrease due to tax distortion on segment mix and operational issue in H1
Cars and light commercial vehicles – market share
Full year results 2012 – February 13th, 2013 13
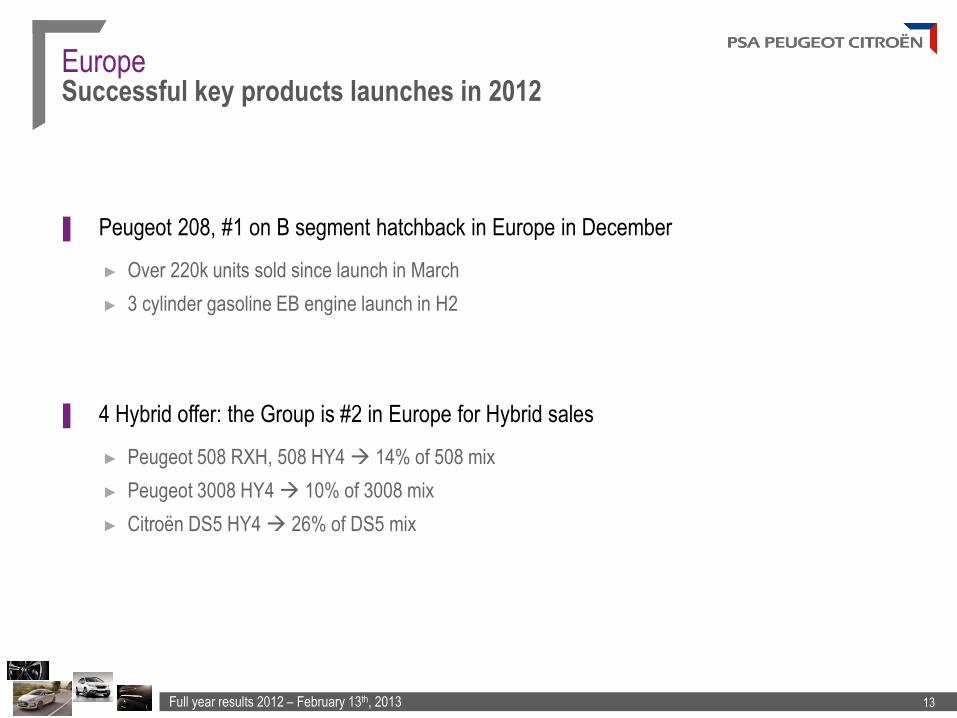
▐ Peugeot 208, #1 on B segment hatchback in Europe in December
► Over 220k units sold since launch in March
► 3 cylinder gasoline EB engine launch in H2
▐ 4 Hybrid offer: the Group is #2 in Europe for Hybrid sales
► Peugeot 508 RXH, 508 HY4 14% of 508 mix
► Peugeot 3008 HY4 10% of 3008 mix
► Citroën DS5 HY4 26% of DS5 mix
Peugeot 508 RXH
Peugeot 208
Europe Successful key products launches in 2012
Peugeot 208
Full year results 2012 – February 13th, 2013 14
▐ DPCA
► Success of the Peugeot 308 sedan: Peugeot’s bestseller in China
► C4 sedan in Top 5 of its segment
► Dealership network: DPCA 728 dealerships (+13%)
▐ CAPSA
► DS Line launched on June 28th: imported DS5, DS4, DS3
► CAPSA 25 dealerships already open
China Dividend income: RMB 776m in 2012, up by 32%
Full year results 2012 – February 13th, 2013 15
Russia Start of full scale production
▐ 1st Russian CKD model - Peugeot 408:
commercial launch in September
▐ +18% for LCV end of December,
market share of 7.4% (+0.9pt)
▐ Dealer network:
148 dealerships (18 new openings)
▐ Successful launch of Peugeot 308
in March and new Citroën C3 in August
in Brazil
▐ Market share in Argentina: +0.8pt at 13.8%
▐ DS models launched in 2012
▐ Dealer network: 629 dealerships (+7%)
Latin America ROI breakeven in H2 2012
Full year results 2012 – February 13th, 2013 16
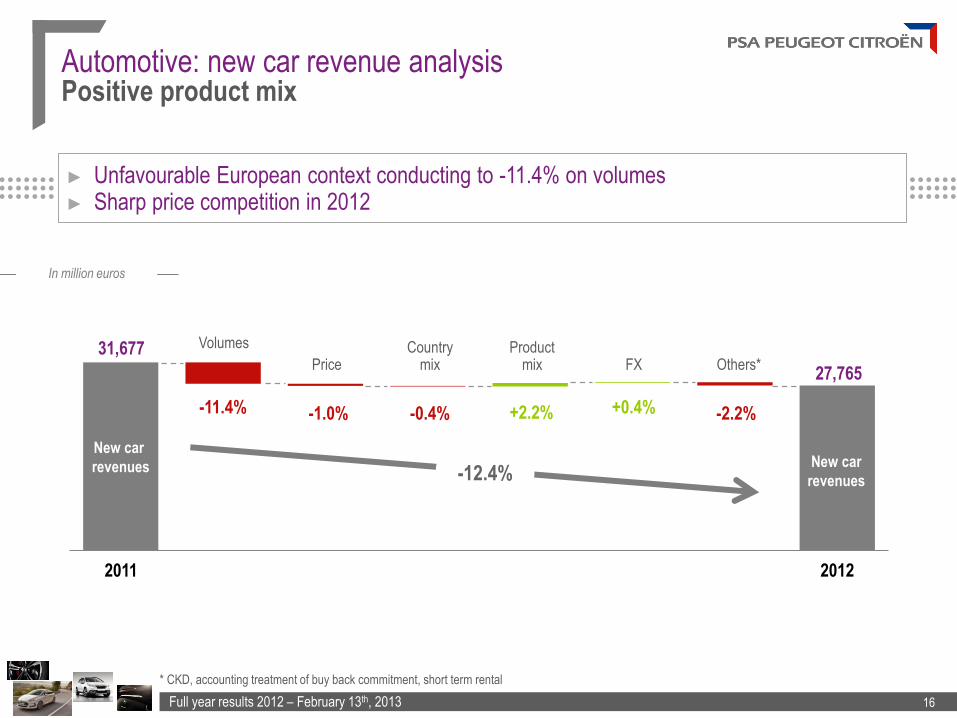
-12.4%
New car
revenues New car
revenues
31,677
-1.0%
27,765
-0.4% +2.2% -2.2% -11.4%
2011 2012
+0.4%
Country mix
Volumes
Price Product
mix FX Others*
Automotive: new car revenue analysis Positive product mix
* CKD, accounting treatment of buy back commitment, short term rental
► Unfavourable European context conducting to -11.4% on volumes ► Sharp price competition in 2012
In million euros
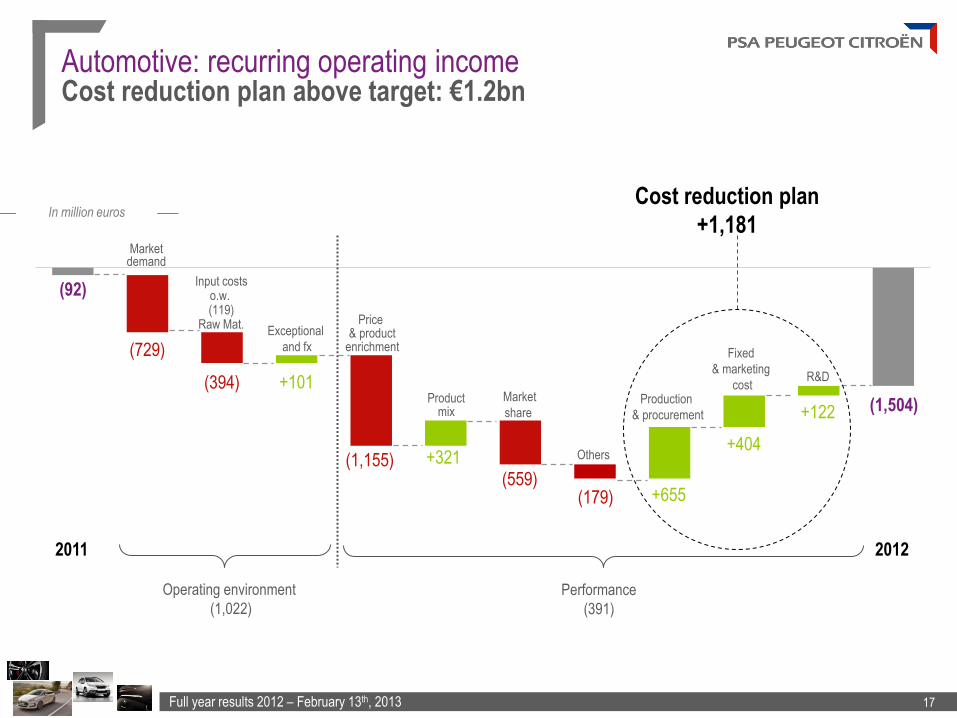
Full year results 2012 – February 13th, 2013 17
(729)
(394) +101
(559) (179)
+404
(1,504)
Market demand
Exceptional
and fx
Market
share
Others +321
Operating environment
(1,022)
Performance
(391)
2012 2011
Input costs o.w. (119)
Raw Mat.
Production
& procurement +122
(1,155)
Product mix
Price & product
enrichment
+655
Automotive: recurring operating income Cost reduction plan above target: €1.2bn
(92)
Cost reduction plan
+1,181
R&D
Fixed
& marketing
cost
In million euros
Full year results 2012 – February 13th, 2013 18
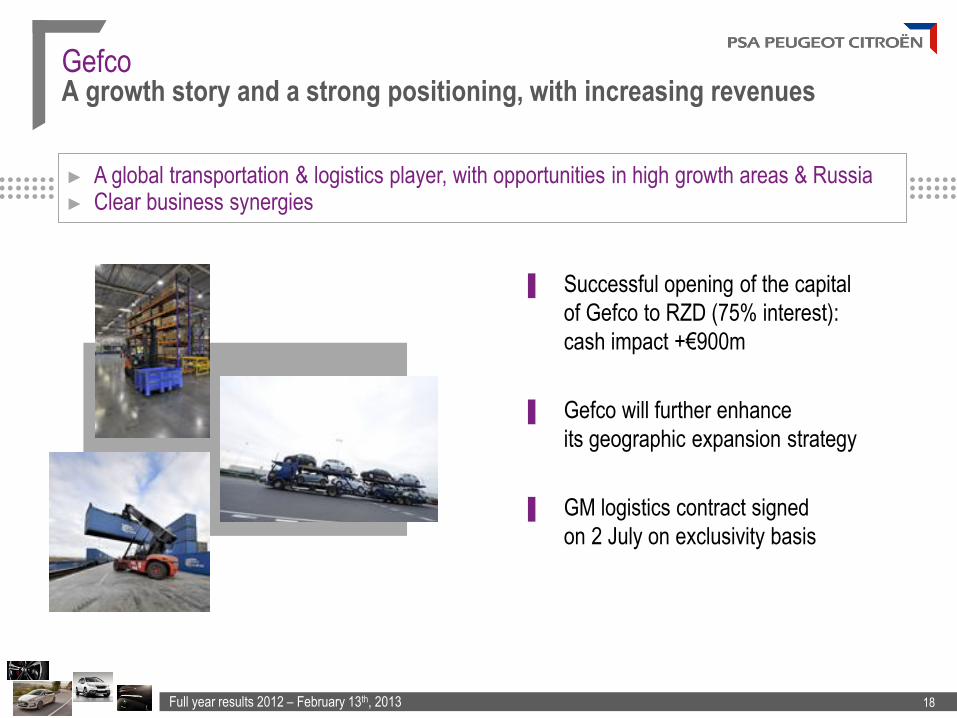
Gefco A growth story and a strong positioning, with increasing revenues
▐ Successful opening of the capital
of Gefco to RZD (75% interest):
cash impact +€900m
▐ Gefco will further enhance
its geographic expansion strategy
▐ GM logistics contract signed
on 2 July on exclusivity basis
A changer
► A global transportation & logistics player, with opportunities in high growth areas & Russia ► Clear business synergies
Full year results 2012 – February 13th, 2013 19
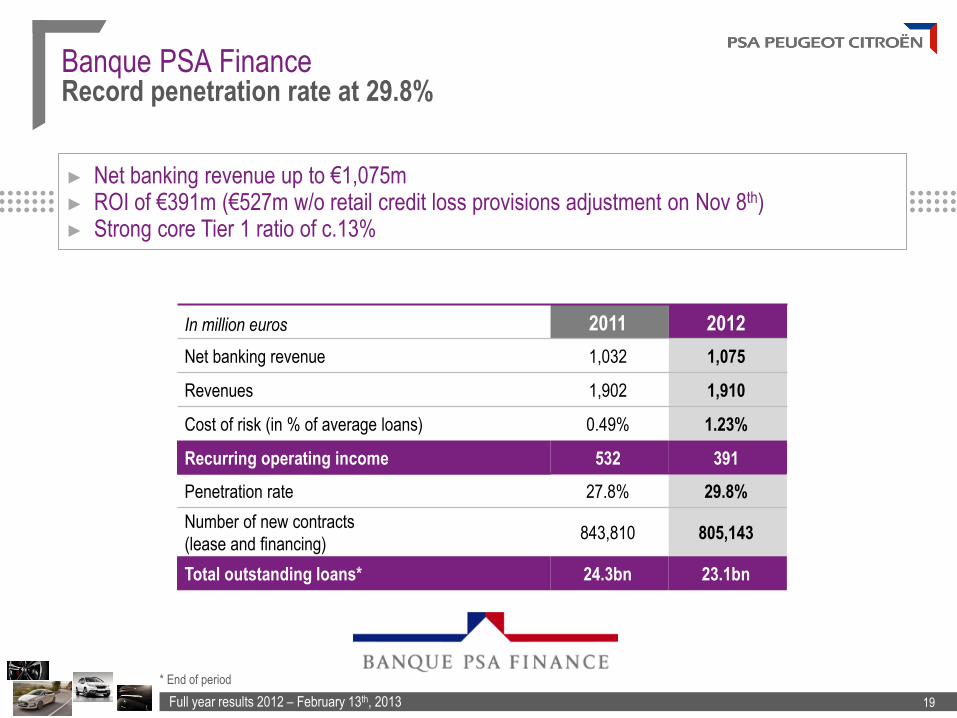
Banque PSA Finance Record penetration rate at 29.8%
In million euros 2011 2012
Net banking revenue 1,032 1,075
Revenues 1,902 1,910
Cost of risk (in % of average loans) 0.49% 1.23%
Recurring operating income 532 391
Penetration rate 27.8% 29.8%
Number of new contracts
(lease and financing) 843,810 805,143
Total outstanding loans* 24.3bn 23.1bn
* End of period
► Net banking revenue up to €1,075m ► ROI of €391m (€527m w/o retail credit loss provisions adjustment on Nov 8th) ► Strong core Tier 1 ratio of c.13%
Full year results 2012 – February 13th, 2013 20
▐ €11,5bn facilities successfully renegotiated with the pool of banks
▐ €7bn refinancing guarantee for new bond issues provided by the French state,
on December 29th, and temporary agreement by European Union on February 11th with:
► A Guarantee Monitoring Committee
► New Supervisory board members with a Lead Independent Member
and an employee representative
▐ Securitization & collateralization up from 18% in 2011 to 27%
► From €4.7bn in 2011 to €7.4bn in 2012
► Including ECB repo eligible assets for €2.9bn
▐ Retail Savings account to be launched in H1 2013
Banque PSA Finance Financing confirmed for more than 3 years
Full year results 2012 – February 13th, 2013 21
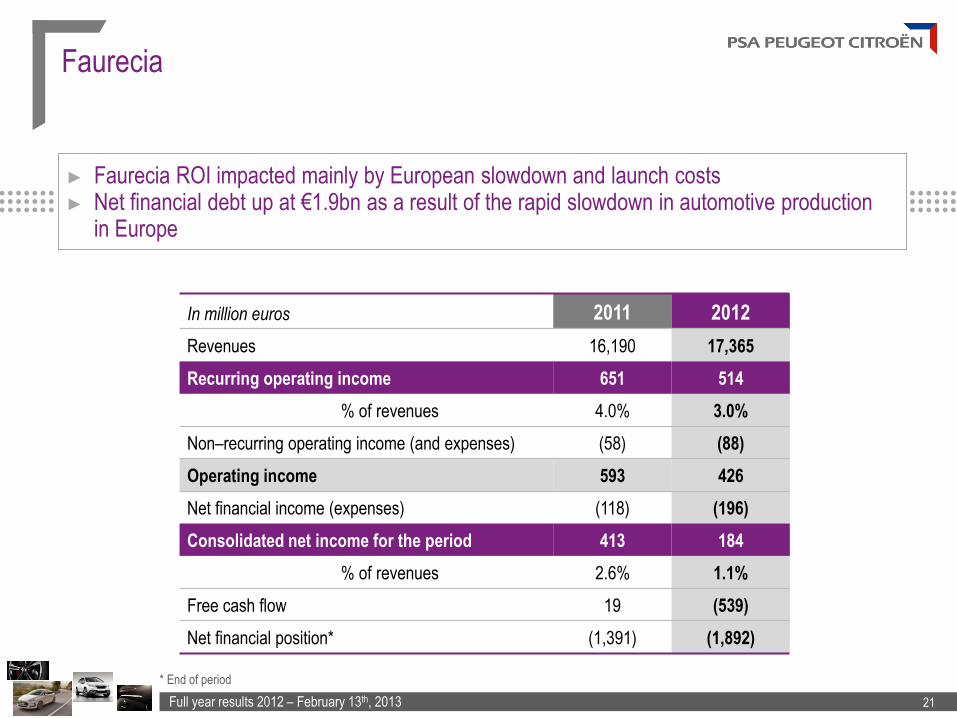
Faurecia
In million euros 2011 2012
Revenues 16,190 17,365
Recurring operating income 651 514
% of revenues 4.0% 3.0%
Non–recurring operating income (and expenses) (58) (88)
Operating income 593 426
Net financial income (expenses) (118) (196)
Consolidated net income for the period 413 184
% of revenues 2.6% 1.1%
Free cash flow 19 (539)
Net financial position* (1,391) (1,892)
* End of period
► Faurecia ROI impacted mainly by European slowdown and launch costs ► Net financial debt up at €1.9bn as a result of the rapid slowdown in automotive production
in Europe
Full year results 2012 – February 13th, 2013 22
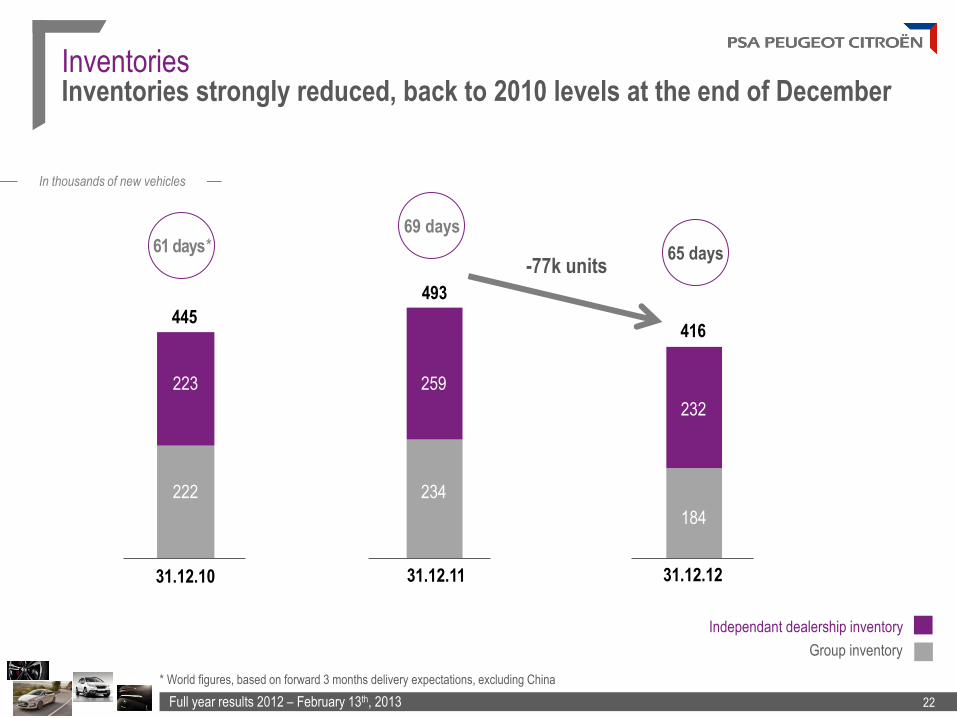
In thousands of new vehicles
445
223
222
31.03 31.12.11
493
259 259
212 234
31.03 31.12.12
327
221
Independant dealership inventory
Group inventory
416
232
184
31.12.10
* World figures, based on forward 3 months delivery expectations, excluding China
61 days* 69 days
65 days
Inventories Inventories strongly reduced, back to 2010 levels at the end of December
-77k units
Full year results 2012 – February 13th, 2013 23
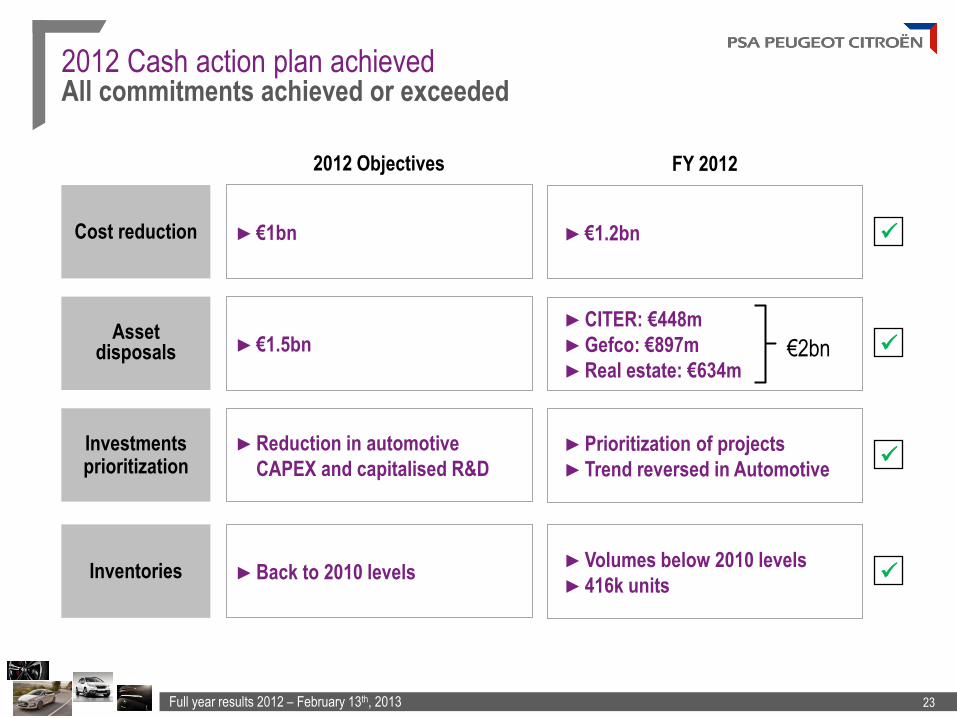
2012 Cash action plan achieved All commitments achieved or exceeded
€2bn
FY 2012 2012 Objectives
Cost reduction ►€1.2bn ►€1bn
Asset disposals
►CITER: €448m
►Gefco: €897m
►Real estate: €634m
►€1.5bn
Investments prioritization
►Prioritization of projects
►Trend reversed in Automotive
►Reduction in automotive
CAPEX and capitalised R&D
Inventories ►Volumes below 2010 levels
►416k units ►Back to 2010 levels
Full year results 2012 – February 13th, 2013 24
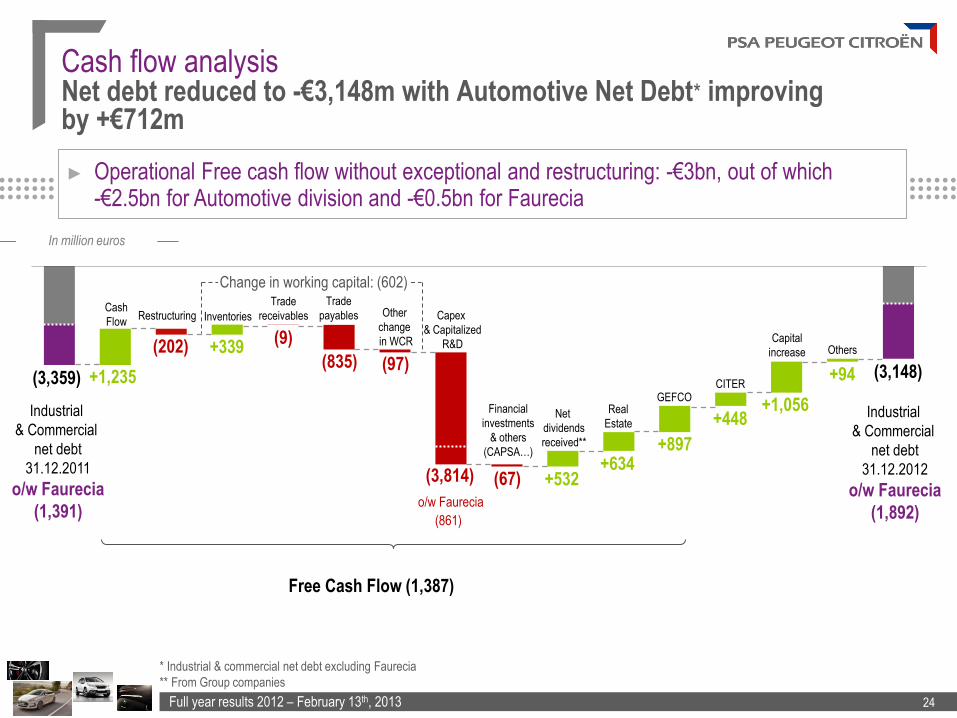
Cash flow analysis Net debt reduced to -€3,148m with Automotive Net Debt* improving by +€712m
(3,359) +1,235
(202) (9)
(835) (97)
(3,814)
o/w Faurecia
(861)
+532 +634
+897
+1,056
(3,148)
Cash
Flow Inventories
Trade
receivables
Trade
payables Other
change
in WCR
Capex
& Capitalized
R&D
Net
dividends
received**
Real
Estate
CITER
Capital
increase
+94
Others
Industrial
& Commercial
net debt
31.12.2011
o/w Faurecia
(1,391)
Industrial
& Commercial
net debt
31.12.2012
o/w Faurecia
(1,892)
Change in working capital: (602)
(67)
Financial
investments
& others
(CAPSA…)
Free Cash Flow (1,387)
* Industrial & commercial net debt excluding Faurecia
** From Group companies
► Operational Free cash flow without exceptional and restructuring: -€3bn, out of which -€2.5bn for Automotive division and -€0.5bn for Faurecia
In million euros
+448
GEFCO
Restructuring
+339
Full year results 2012 – February 13th, 2013 25
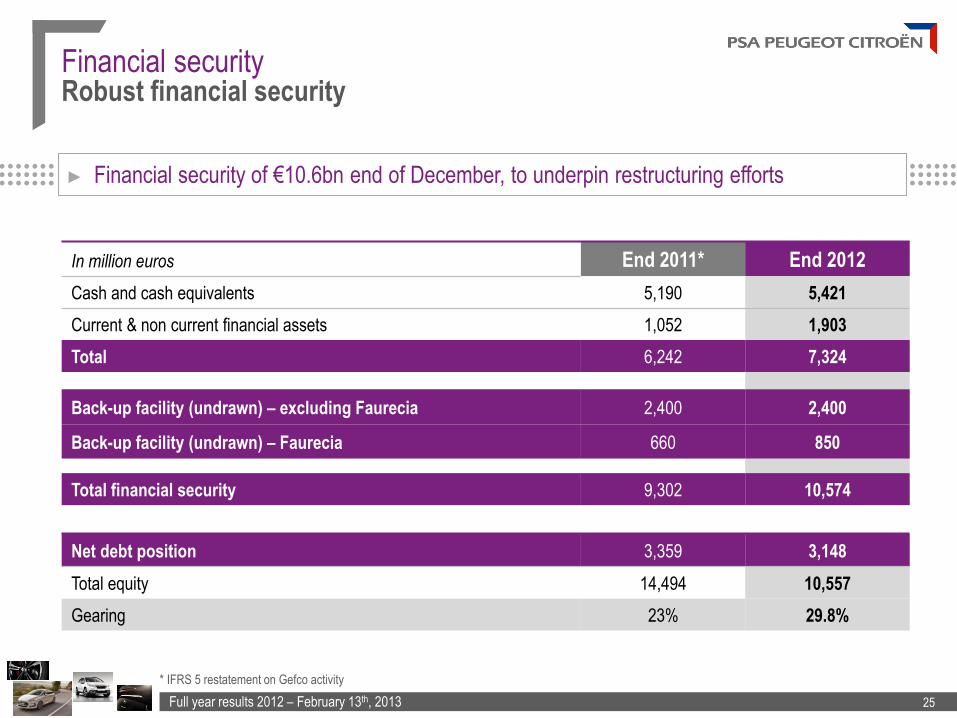
In million euros End 2011* End 2012
Cash and cash equivalents 5,190 5,421
Current & non current financial assets 1,052 1,903
Total 6,242 7,324
Back-up facility (undrawn) – excluding Faurecia 2,400 2,400
Back-up facility (undrawn) – Faurecia 660 850
Total financial security 9,302 10,574
Net debt position 3,359 3,148
Total equity 14,494 10,557
Gearing 23% 29.8%
Financial security Robust financial security
► Financial security of €10.6bn end of December, to underpin restructuring efforts
* IFRS 5 restatement on Gefco activity

Full year results 2012 – February 13th, 2013 26
2013 2014 2015 2016 2017 2018 2019-26 2033
Financial structure & financing targets Average maturity of 4.1 years end of December
In million euros
549
253
513
101
Faurecia Others
55
14
270
Gross debt* in nominal value at end 31.12.2012
791 600
1,192 1,514
1,951
841
95 295
* Excluding BPF, undrawn credit-line, short term liabilities & other adjustments
STRATEGIC UPDATE Philippe Varin
Chairman of the Managing Board
Full year results 2012 – February 13th, 2013 28
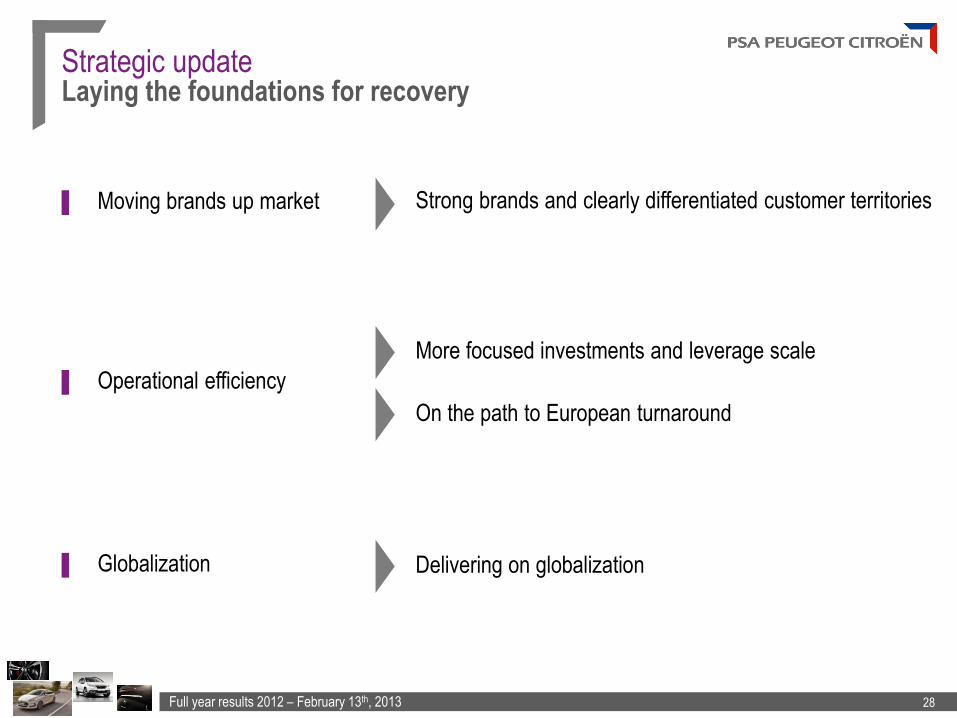
Strategic update Laying the foundations for recovery
▐ Globalization
▐ Moving brands up market Strong brands and clearly differentiated customer territories
Delivering on globalization
▐ Operational efficiency
More focused investments and leverage scale
On the path to European turnaround
Full year results 2012 – February 13th, 2013 29
ASPIRING
TO MODERNITY
VALUING
TRADITION
CA
R F
OR
IMA
GE
CA
R F
OR
EX
PE
RIE
NC
E
CA
R F
OR
US
AG
E
6%
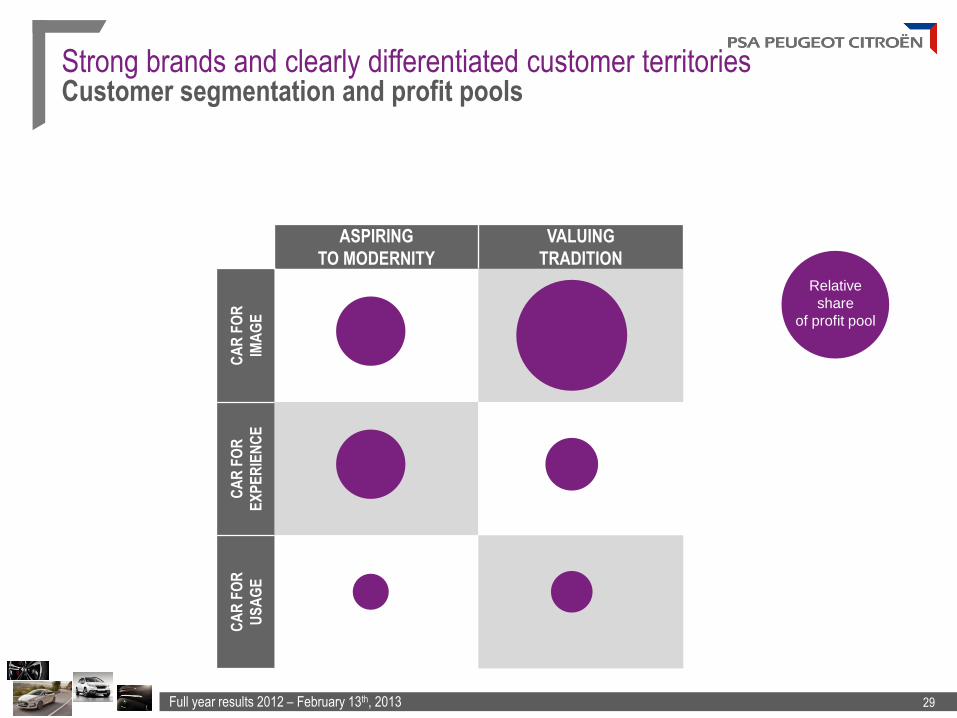
Strong brands and clearly differentiated customer territories Customer segmentation and profit pools
Relative
share
of profit pool
Full year results 2012 – February 13th, 2013 30
ASPIRING
TO MODERNITY
VALUING
TRADITION
CA
R F
OR
IMA
GE
USAGE
CA
R F
OR
EX
PE
RIE
NC
E
CA
R F
OR
US
AG
E
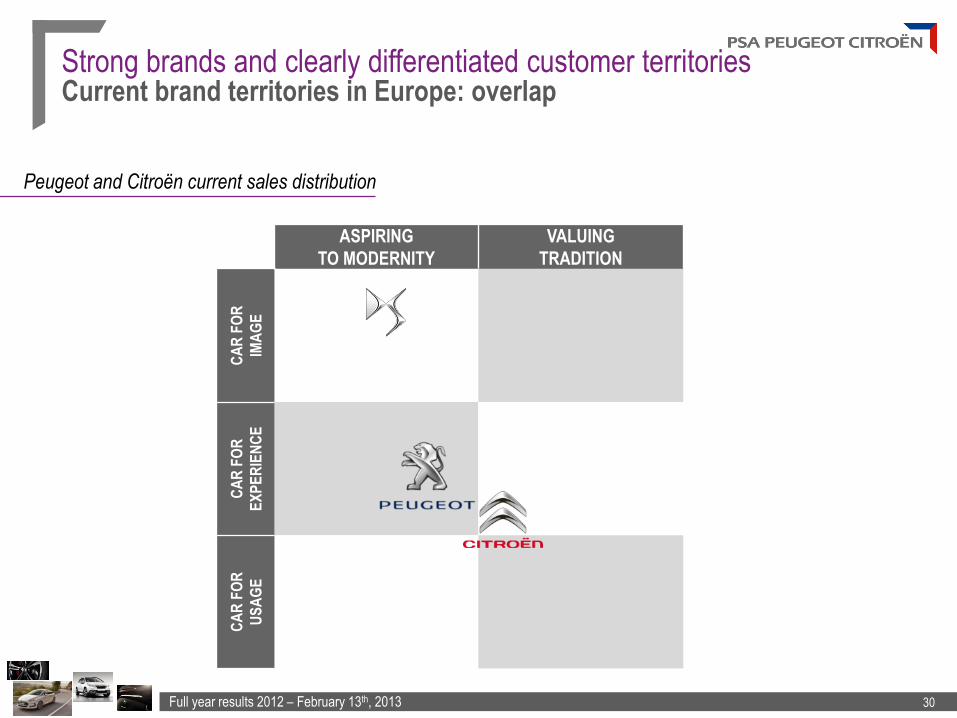
Strong brands and clearly differentiated customer territories Current brand territories in Europe: overlap
Peugeot and Citroën current sales distribution
Full year results 2012 – February 13th, 2013 31
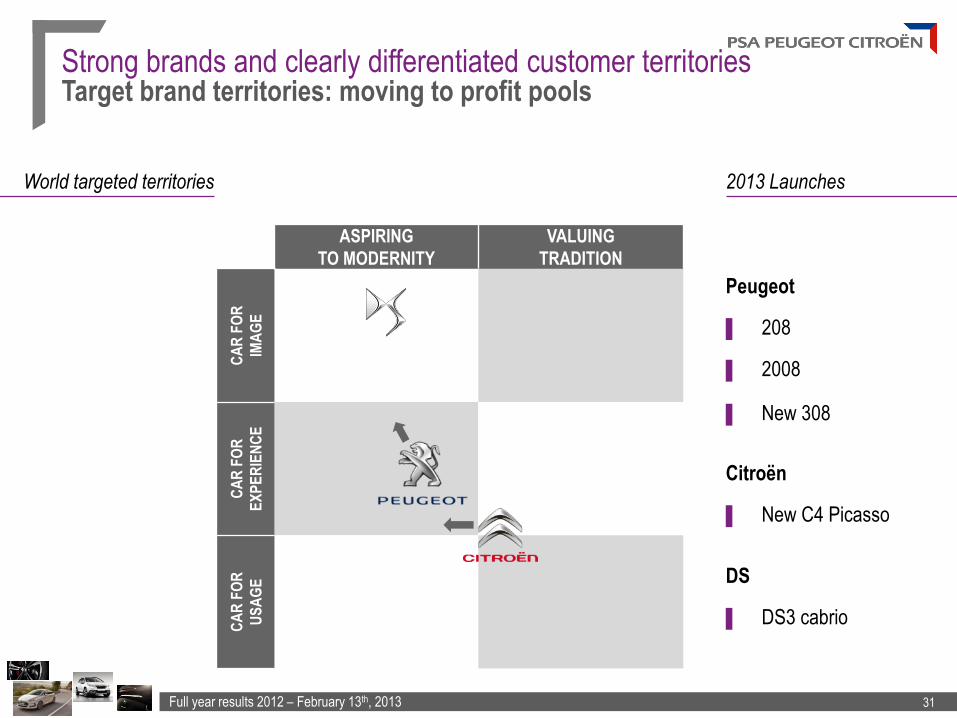
Strong brands and clearly differentiated customer territories Target brand territories: moving to profit pools
World targeted territories 2013 Launches
ASPIRING
TO MODERNITY
VALUING
TRADITION
CA
R F
OR
IMA
GE
CA
R F
OR
EX
PE
RIE
NC
E
CA
R F
OR
US
AG
E
Peugeot
Citroën
▐ 208
▐ New C4 Picasso
▐ 2008
▐ New 308
DS
▐ DS3 cabrio
Full year results 2012 – February 13th, 2013 32
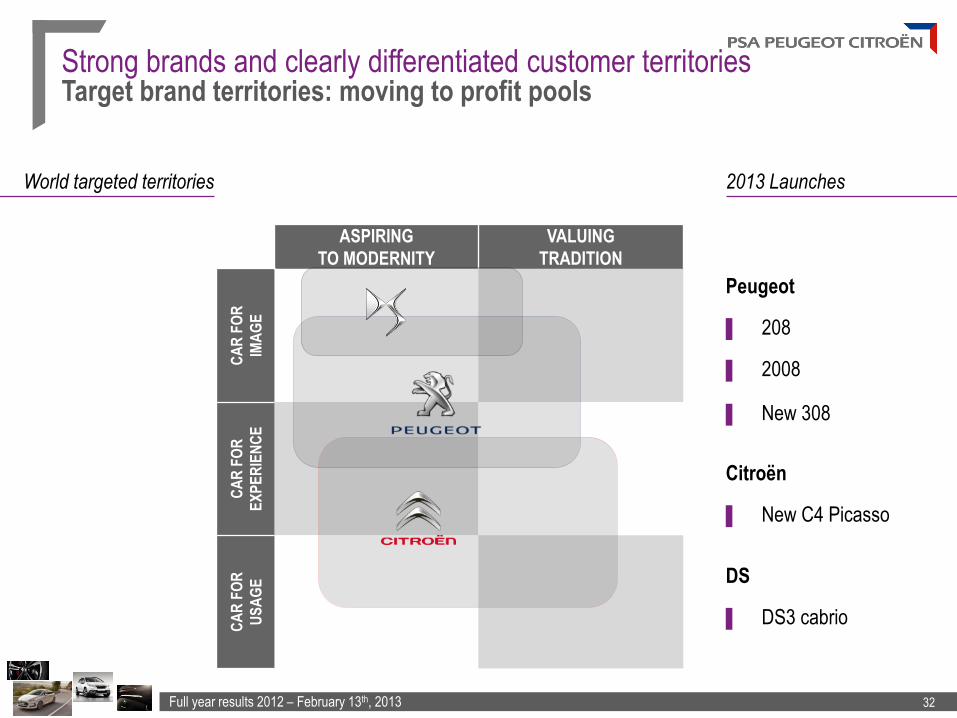
Strong brands and clearly differentiated customer territories Target brand territories: moving to profit pools
World targeted territories 2013 Launches
ASPIRING
TO MODERNITY
VALUING
TRADITION
CA
R F
OR
IMA
GE
CA
R F
OR
EX
PE
RIE
NC
E
CA
R F
OR
US
AG
E
Peugeot
Citroën
▐ 208
▐ New C4 Picasso
▐ 2008
▐ New 308
DS
▐ DS3 cabrio
Full year results 2012 – February 13th, 2013 33
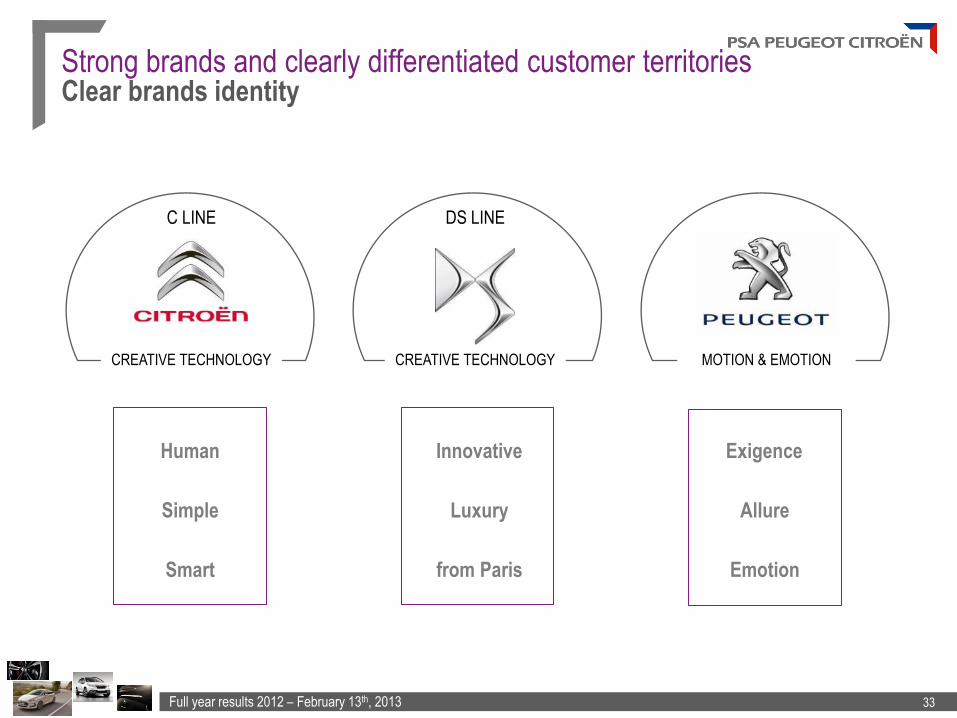
Strong brands and clearly differentiated customer territories Clear brands identity
Allure
Emotion
Exigence
MOTION & EMOTION
C LINE
Smart
Simple
Human
CREATIVE TECHNOLOGY
DS LINE
Innovative
Luxury
from Paris
CREATIVE TECHNOLOGY
Full year results 2012 – February 13th, 2013 34
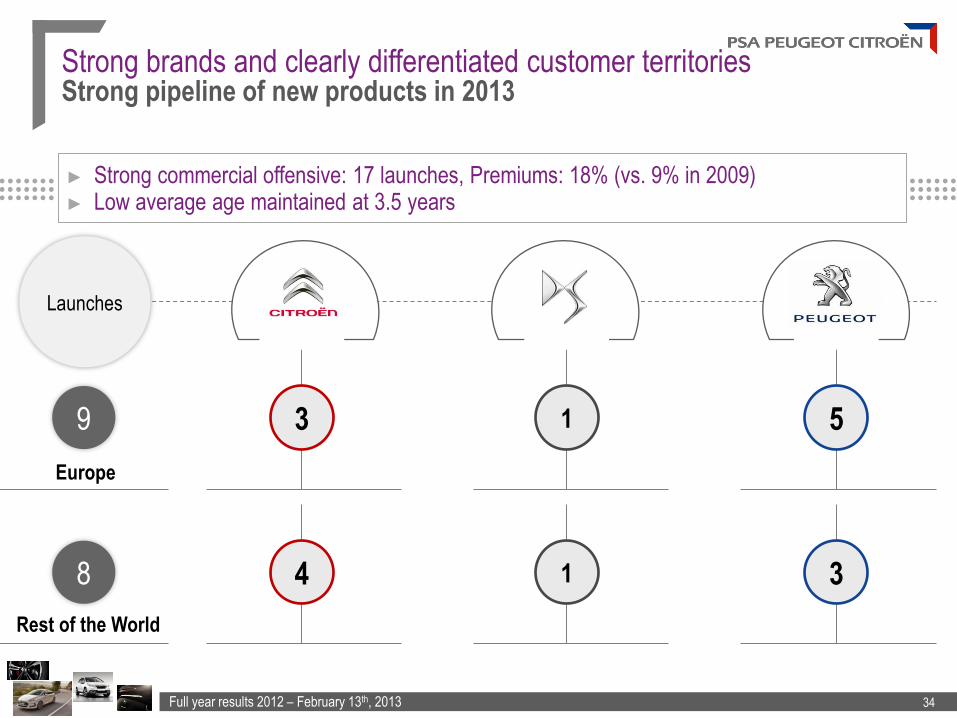
► Strong commercial offensive: 17 launches, Premiums: 18% (vs. 9% in 2009) ► Low average age maintained at 3.5 years
Launches
Europe
Strong brands and clearly differentiated customer territories Strong pipeline of new products in 2013
3 9
Rest of the World
4 8
5
3
1
1
Full year results 2012 – February 13th, 2013 35
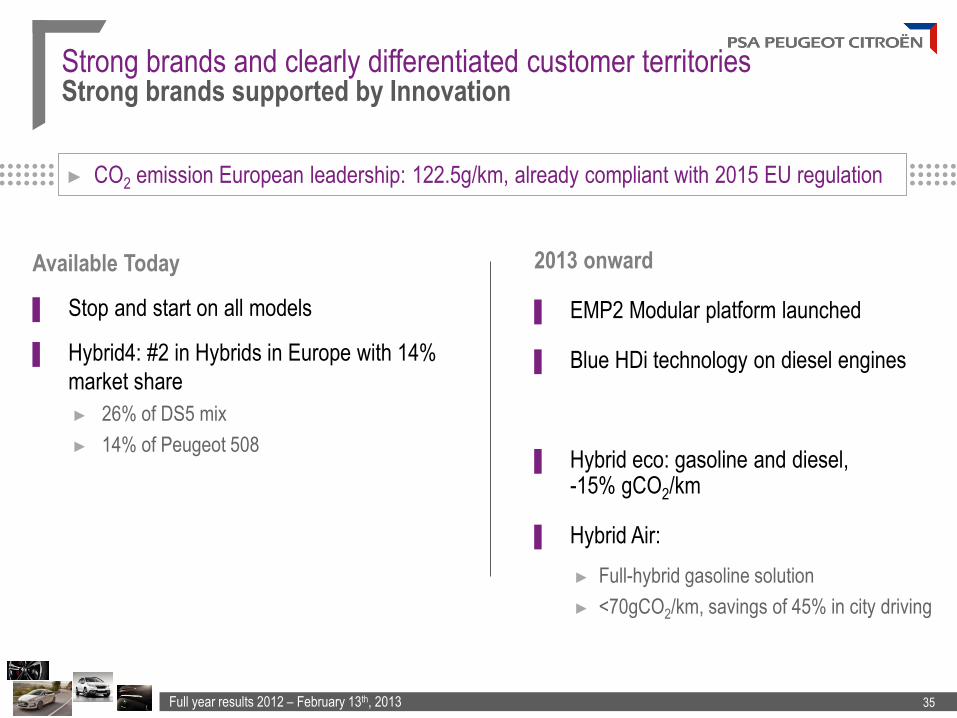
Strong brands and clearly differentiated customer territories Strong brands supported by Innovation
Available Today
▐ Stop and start on all models
▐ Hybrid4: #2 in Hybrids in Europe with 14%
market share
► 26% of DS5 mix
► 14% of Peugeot 508
► CO2 emission European leadership: 122.5g/km, already compliant with 2015 EU regulation
2013 onward
▐ EMP2 Modular platform launched
▐ Blue HDi technology on diesel engines
▐ Hybrid eco: gasoline and diesel, -15% gCO2/km
▐ Hybrid Air:
► Full-hybrid gasoline solution
► <70gCO2/km, savings of 45% in city driving
Full year results 2012 – February 13th, 2013 36
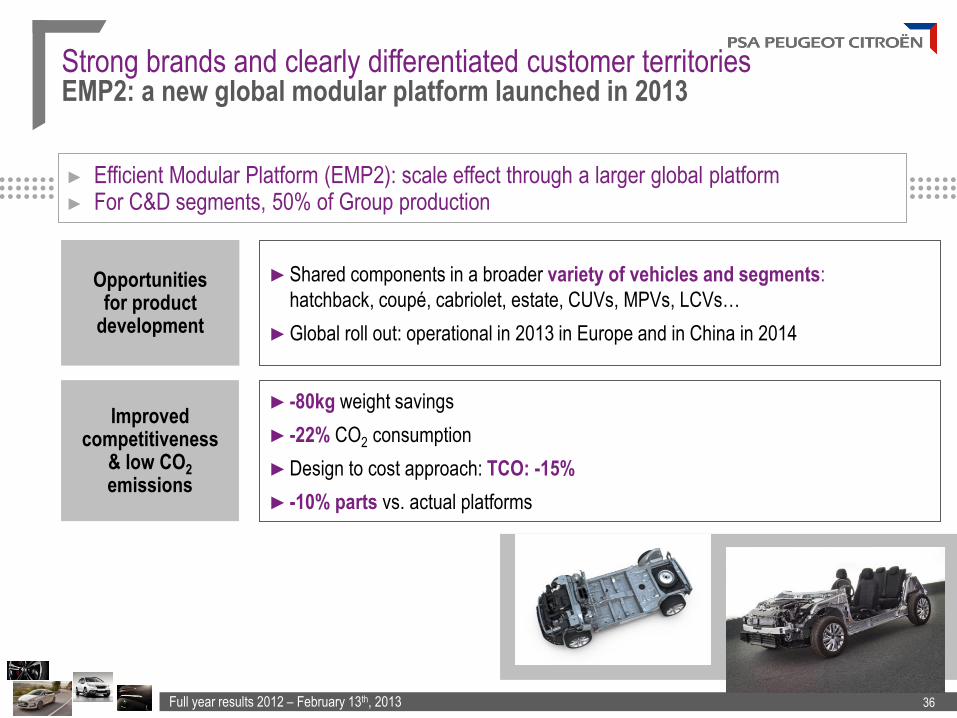
Opportunities for product
development
Improved competitiveness
& low CO2 emissions
►Shared components in a broader variety of vehicles and segments:
hatchback, coupé, cabriolet, estate, CUVs, MPVs, LCVs…
►Global roll out: operational in 2013 in Europe and in China in 2014
►-80kg weight savings
►-22% CO2 consumption
►Design to cost approach: TCO: -15%
►-10% parts vs. actual platforms
► Efficient Modular Platform (EMP2): scale effect through a larger global platform ► For C&D segments, 50% of Group production
Strong brands and clearly differentiated customer territories EMP2: a new global modular platform launched in 2013
Full year results 2012 – February 13th, 2013 37
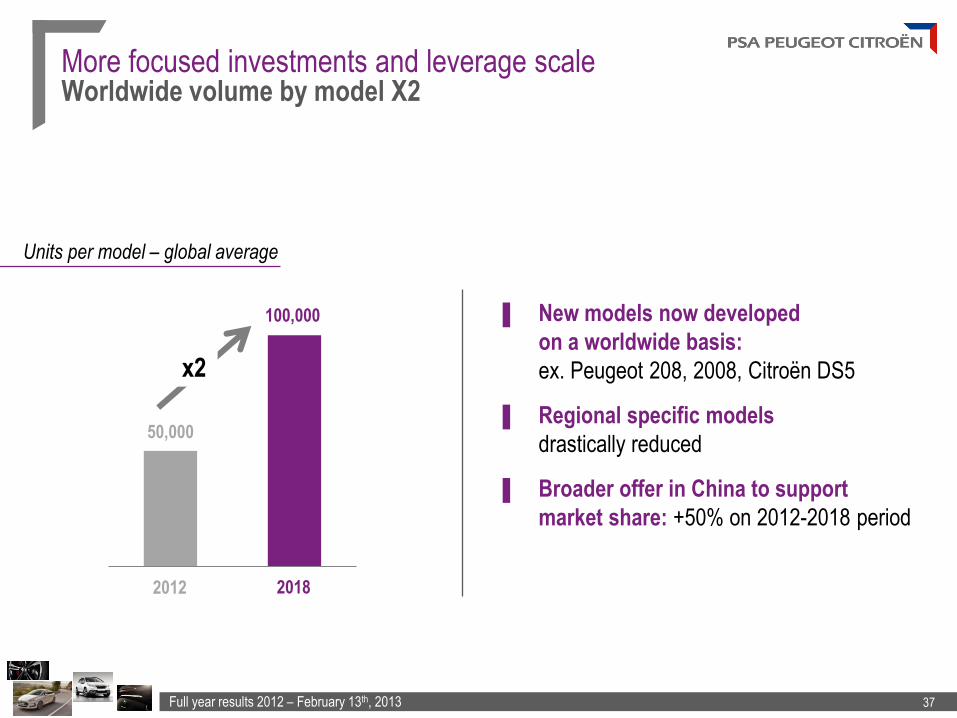
50,000
100,000
2018 2012
More focused investments and leverage scale Worldwide volume by model X2
▐ New models now developed
on a worldwide basis:
ex. Peugeot 208, 2008, Citroën DS5
▐ Regional specific models
drastically reduced
▐ Broader offer in China to support
market share: +50% on 2012-2018 period
x2
Units per model – global average
Full year results 2012 – February 13th, 2013 38
In million units
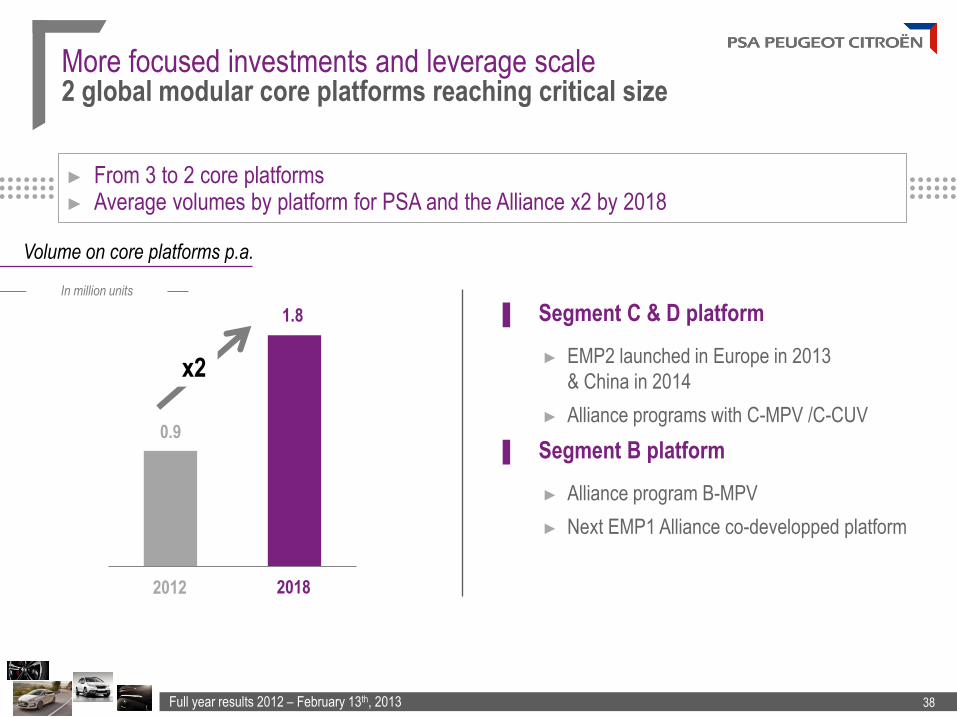
More focused investments and leverage scale 2 global modular core platforms reaching critical size
► From 3 to 2 core platforms ► Average volumes by platform for PSA and the Alliance x2 by 2018
▐ Segment C & D platform
► EMP2 launched in Europe in 2013
& China in 2014
► Alliance programs with C-MPV /C-CUV
▐ Segment B platform
► Alliance program B-MPV
► Next EMP1 Alliance co-developped platform
0.9
1.8
x2
2018 2012
Volume on core platforms p.a.
Full year results 2012 – February 13th, 2013 39
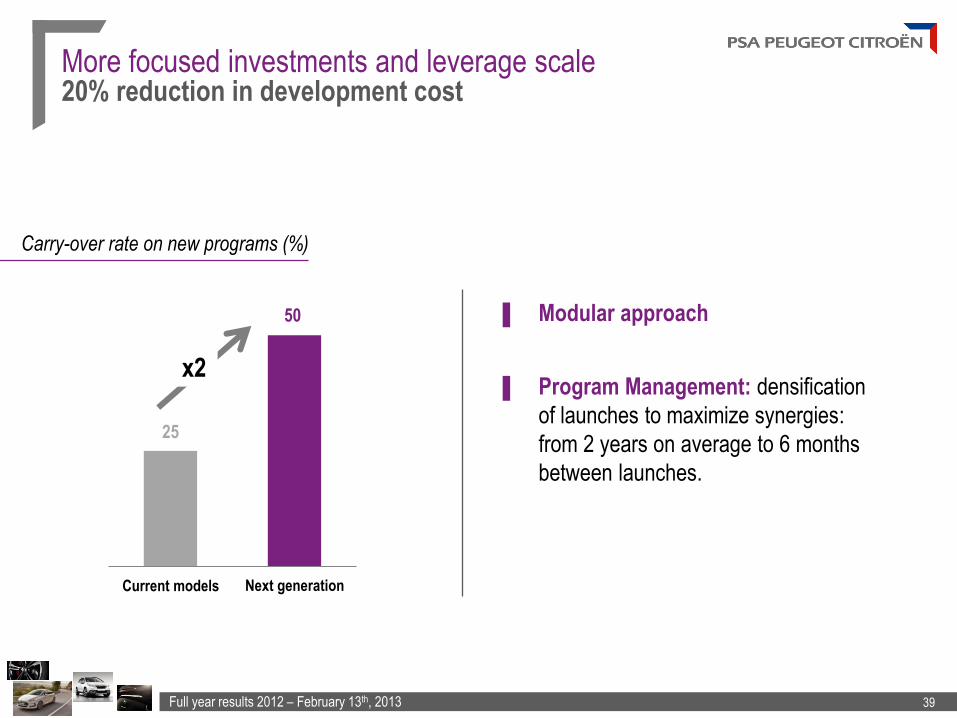
More focused investments and leverage scale 20% reduction in development cost
Carry-over rate on new programs (%)
25
50
Next generation Current models
x2
▐ Modular approach
▐ Program Management: densification
of launches to maximize synergies:
from 2 years on average to 6 months
between launches.
Full year results 2012 – February 13th, 2013 40
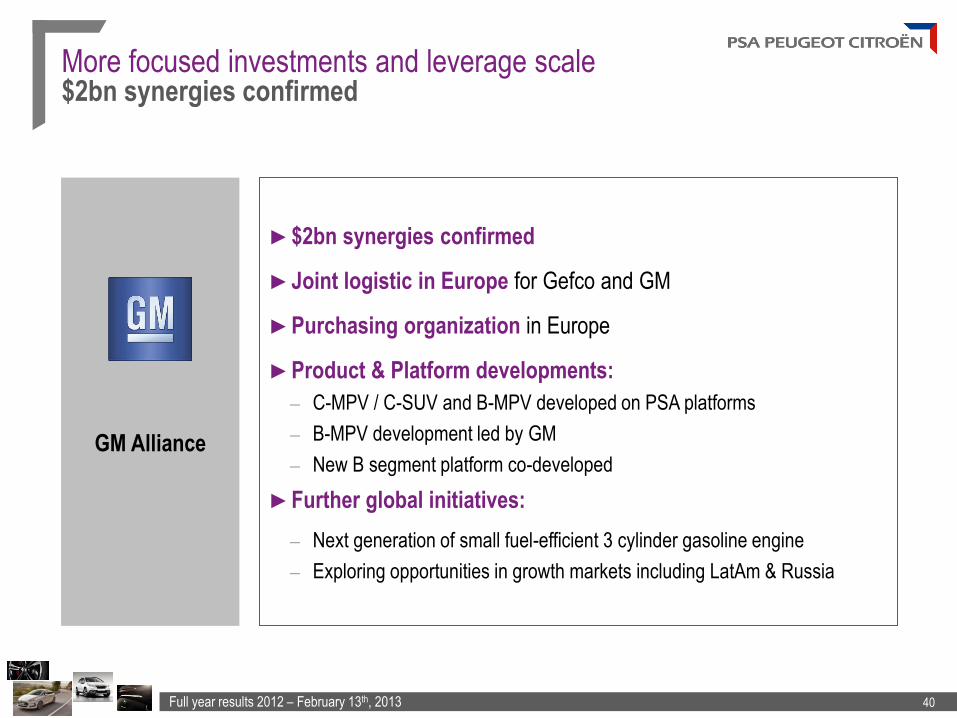
GM Alliance
►$2bn synergies confirmed
►Joint logistic in Europe for Gefco and GM
►Purchasing organization in Europe
►Product & Platform developments:
– C-MPV / C-SUV and B-MPV developed on PSA platforms
– B-MPV development led by GM
– New B segment platform co-developed
►Further global initiatives:
– Next generation of small fuel-efficient 3 cylinder gasoline engine
– Exploring opportunities in growth markets including LatAm & Russia
More focused investments and leverage scale $2bn synergies confirmed
Full year results 2012 – February 13th, 2013 41
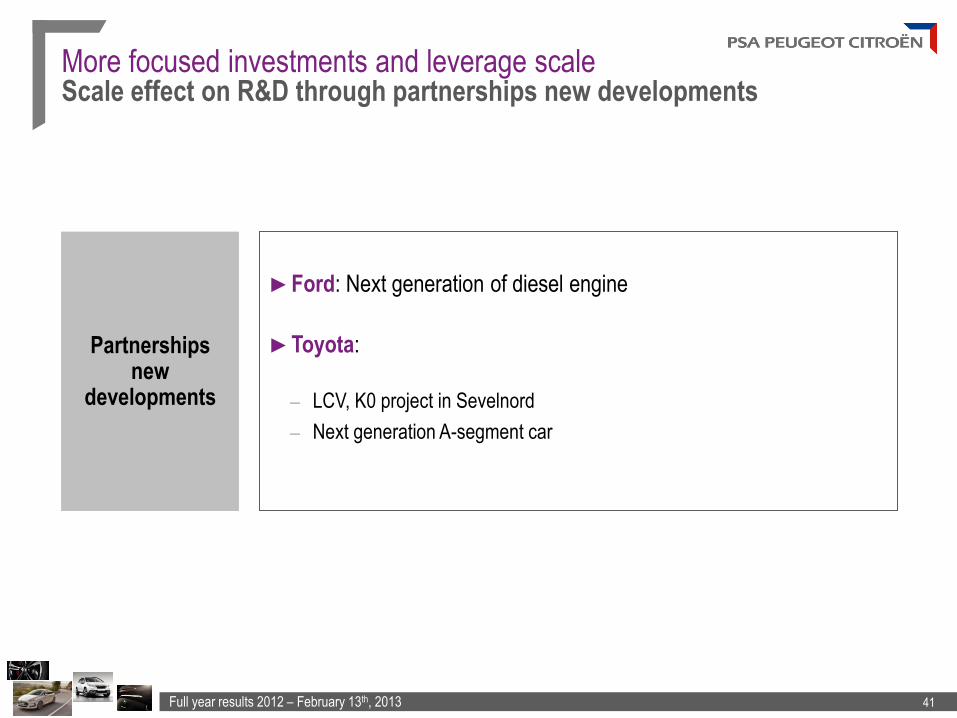
Partnerships new
developments
►Ford: Next generation of diesel engine
►Toyota:
– LCV, K0 project in Sevelnord
– Next generation A-segment car
More focused investments and leverage scale Scale effect on R&D through partnerships new developments
Full year results 2012 – February 13th, 2013 42
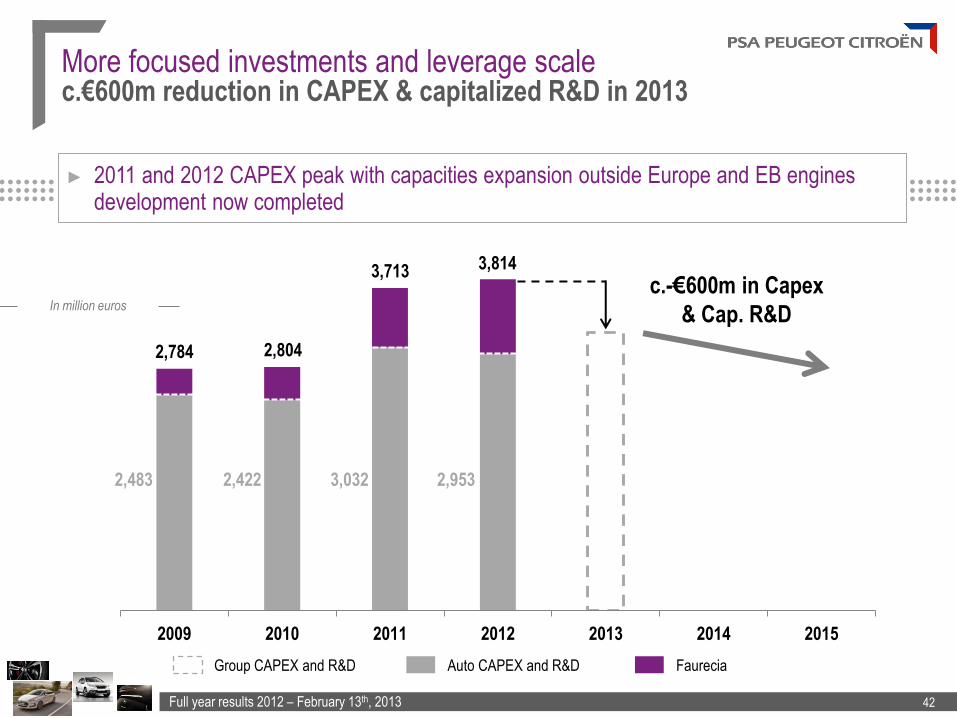
2009 2010 2011 2012 2013 2014 2015
2,483 2,422 3,032 2,953
3,713
2,804 2,784
3,814 c.-€600m in Capex
& Cap. R&D
Auto CAPEX and R&D Faurecia Group CAPEX and R&D
In million euros
More focused investments and leverage scale c.€600m reduction in CAPEX & capitalized R&D in 2013
► 2011 and 2012 CAPEX peak with capacities expansion outside Europe and EB engines development now completed
Full year results 2012 – February 13th, 2013 43
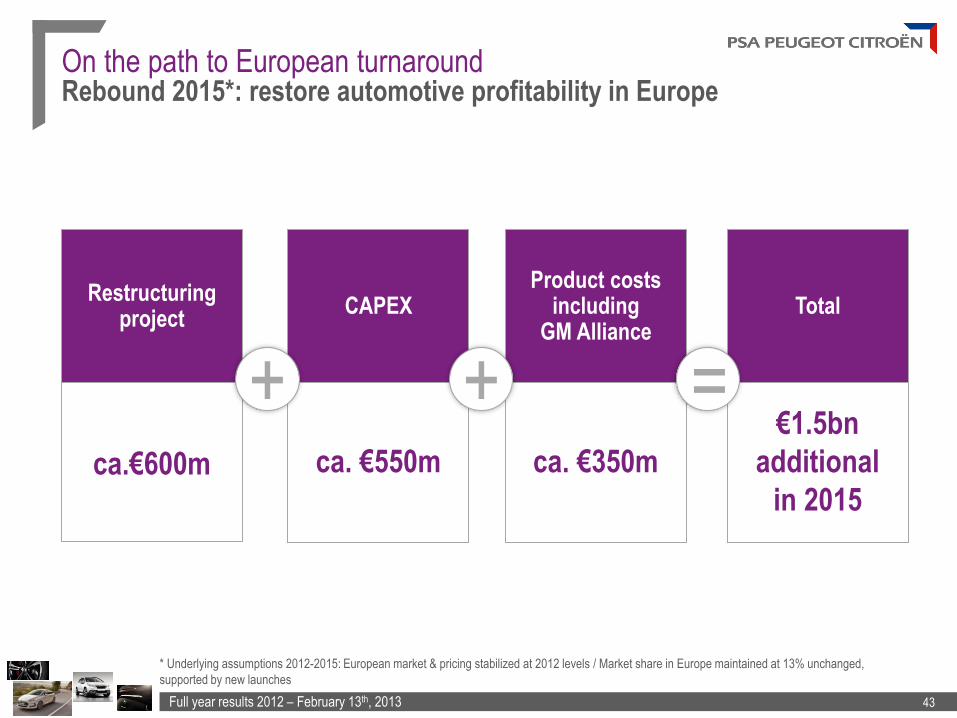
ca. €550m
CAPEX Restructuring
project
ca.€600m ca. €350m
Product costs including
GM Alliance
€1.5bn
additional
in 2015
Total
On the path to European turnaround Rebound 2015*: restore automotive profitability in Europe
* Underlying assumptions 2012-2015: European market & pricing stabilized at 2012 levels / Market share in Europe maintained at 13% unchanged,
supported by new launches
+ + =
Full year results 2012 – February 13th, 2013 44
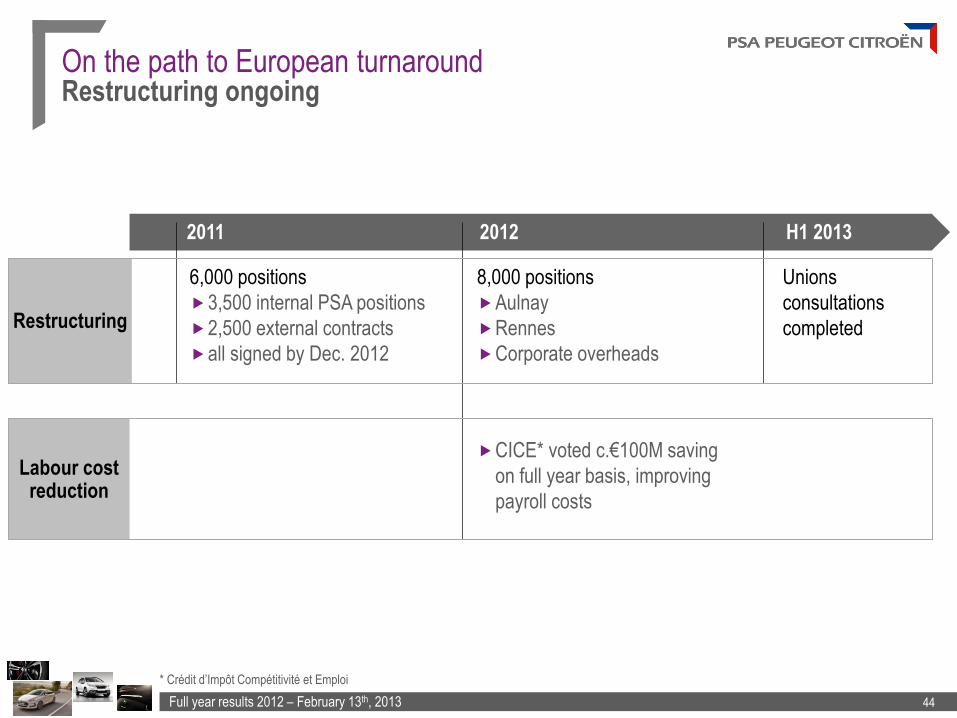
6,000 positions
3,500 internal PSA positions
2,500 external contracts
all signed by Dec. 2012
2011 H1 2013
8,000 positions
Aulnay
Rennes
Corporate overheads
Unions
consultations
completed
CICE* voted c.€100M saving
on full year basis, improving
payroll costs
2012
On the path to European turnaround Restructuring ongoing
Restructuring
Labour cost reduction
* Crédit d’Impôt Compétitivité et Emploi
Full year results 2012 – February 13th, 2013 45
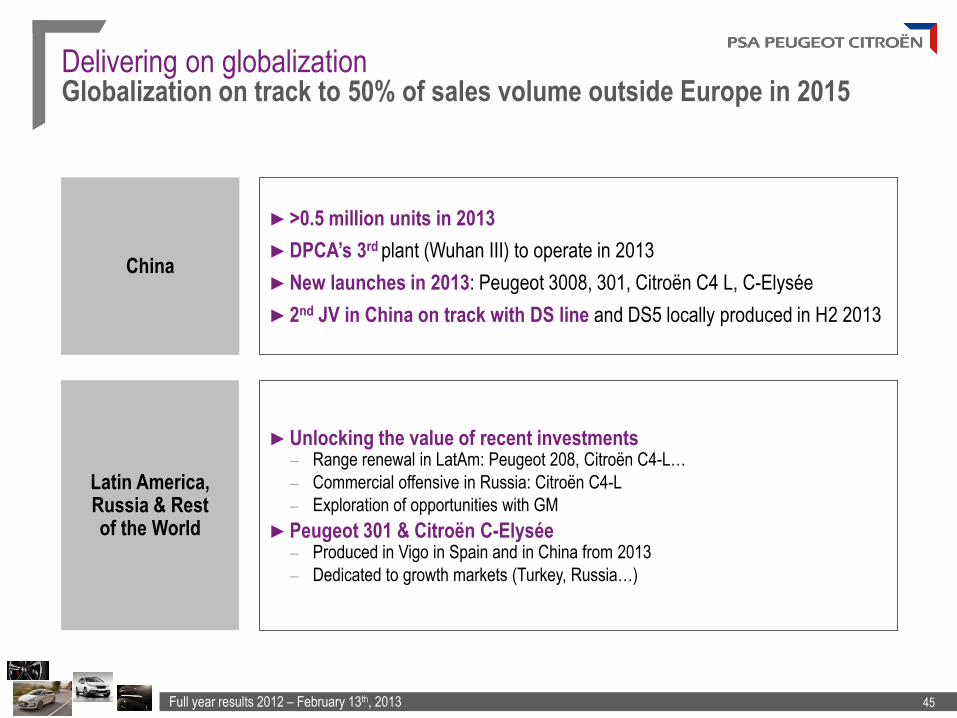
Delivering on globalization Globalization on track to 50% of sales volume outside Europe in 2015
China
Latin America, Russia & Rest of the World
►>0.5 million units in 2013
►DPCA’s 3rd plant (Wuhan III) to operate in 2013
►New launches in 2013: Peugeot 3008, 301, Citroën C4 L, C-Elysée
►2nd JV in China on track with DS line and DS5 locally produced in H2 2013
►Unlocking the value of recent investments – Range renewal in LatAm: Peugeot 208, Citroën C4-L…
– Commercial offensive in Russia: Citroën C4-L
– Exploration of opportunities with GM
►Peugeot 301 & Citroën C-Elysée – Produced in Vigo in Spain and in China from 2013
– Dedicated to growth markets (Turkey, Russia…)
OUTLOOK Philippe Varin
Chairman of the Managing Board
Full year results 2012 – February 13th, 2013 47
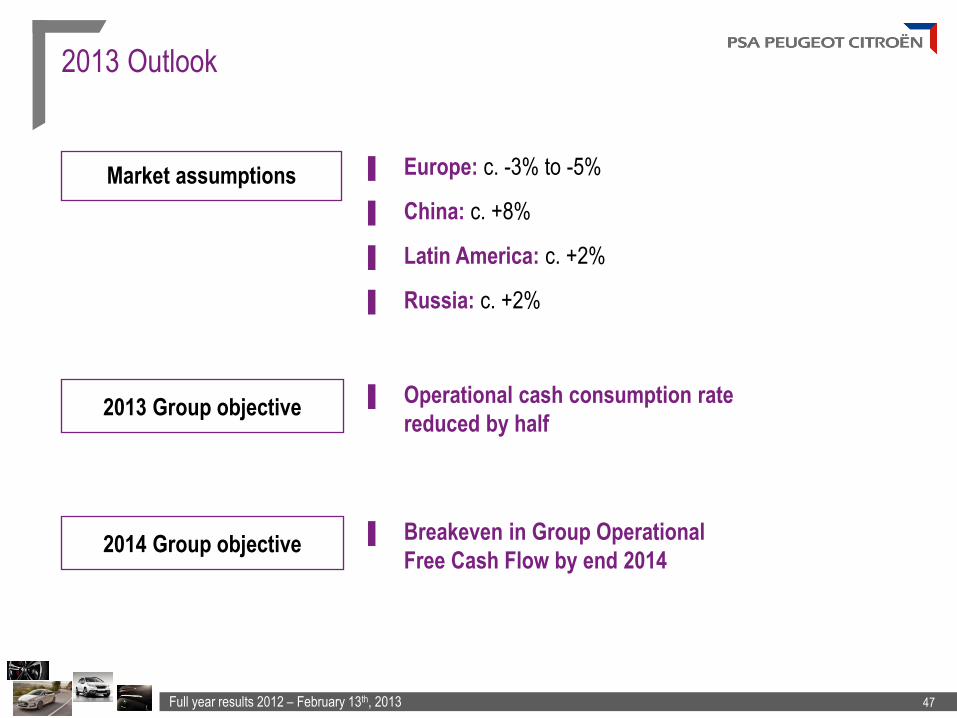
2013 Outlook
▐ Europe: c. -3% to -5%
▐ China: c. +8%
▐ Latin America: c. +2%
▐ Russia: c. +2%
Market assumptions
▐ Operational cash consumption rate
reduced by half 2013 Group objective
2014 Group objective ▐ Breakeven in Group Operational
Free Cash Flow by end 2014
Full year results 2012 – February 13th, 2013 48
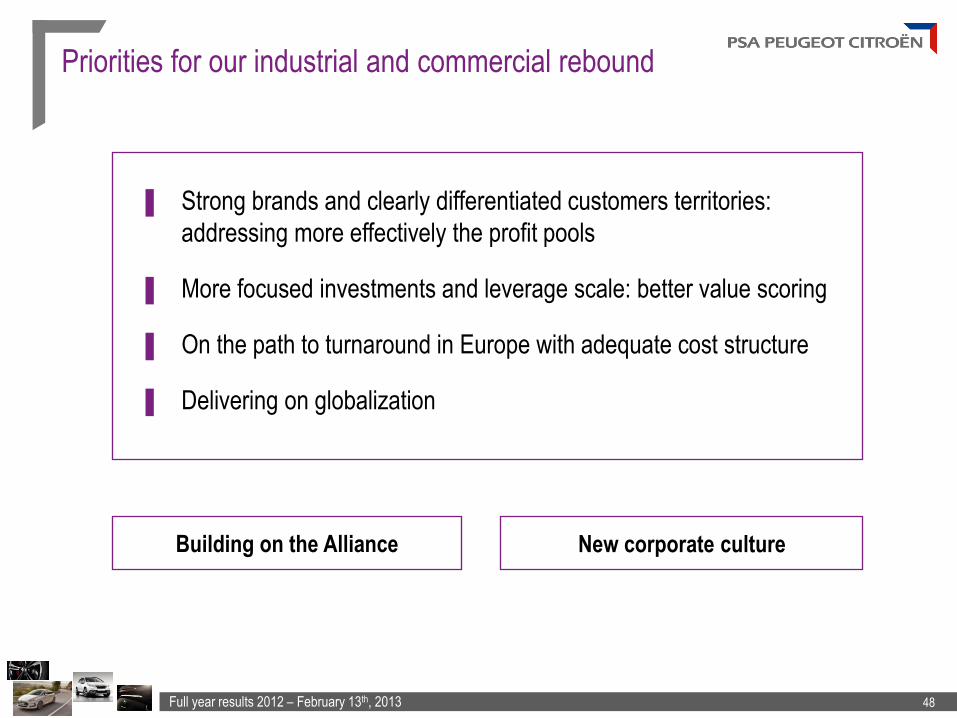
Priorities for our industrial and commercial rebound
▐ Strong brands and clearly differentiated customers territories:
addressing more effectively the profit pools
▐ More focused investments and leverage scale: better value scoring
▐ On the path to turnaround in Europe with adequate cost structure
▐ Delivering on globalization
Building on the Alliance New corporate culture
APPENDIX

Full year results 2012 – February 13th, 2013 50
Worldwide unit sales
* Assembled vehicles, CKD units ** Europe = EU + EFTA + Albania + Bosnia + Croatia + Kosovo + Macedonia + Montenegro + Serbia
in thousand of units*
Europe** AP AC Total PSA
Russia AP AC Total PSA
Lat Am AP AC Total PSA
China AP AC Total PSA
Rest of the world AP AC Total PSA
Total Assembled vehicles AP AC Total PSA
CKD AP AC Total PSA
Total Assembled vehicles
+ CKD units
AP AC Total PSA
2011 2012 Change
1,101,278 962,100
2,063,378
947,583 810,590
1,758,173
-14.0% -15.7% -14.8%
45,361 29,456 74,817
44,868 33,604 78,472
-1.1% +14.1% +4.9%
190,088 135,685 325,773
172,855 110,003 282,858
-9.1% -18.9% -13.2%
173,803 230,634 404,437
215,886 225,626 441,512
+24.2% -2.2% +9.2%
145,320 77,813
223,133
173,795 85,072
258,867
+19.7% +9.3%
+16.0%
1,655,850 1,435,688 3,091,538
1,554,987 1,264,895 2,819,882
-6.1% -11.9% -8.8%
457,878 0
457,878
145,028 0
145,028
-68.3% -
-68.3%
2,113,728 1,435,688 3,549,416
1,700,015 1,264,895 2,964,910
-19.6% -11.9% -16.5%
Full year results 2012 – February 13th, 2013 51
Group results
* Gefco: restated with IFRS 5 compliance, Gefco held as discontinued activites
In million euros 2011 2011* H1* H2 2012
Revenues 59 912 58 509 28 809 26 637 55 446
Recurring operating income 1 315 1 093 (59) (517) (576)
% of revenues 2,2% 1,9% -0,2% -1,9% -1,0%
Non–recurring operating income
(and expenses) (417) (417) (419) (3 703) (4 122)
Operating income 898 676 (478) (4 220) (4 698)
Net financial income (expenses) (334) (329) (262) (156) (418)
Income taxes 47 115 (90) (682) (772)
Share in net earnings of companies at equity 173 172 47 113 160
Consolidated net income / (loss) 784 784 (745) (4 180) (4 925)
o/w Profit (loss) from continued activities 634 (783) (4 945) (5 728)
o/w Profit (loss) from discontinued activities 150 38 765 803
Net income, Group share 588 588 (819) (4 191) (5 010)
Earnings per share for continued activities (in euros) 2,64 1.97 (2.85) (14.52) (18.13)
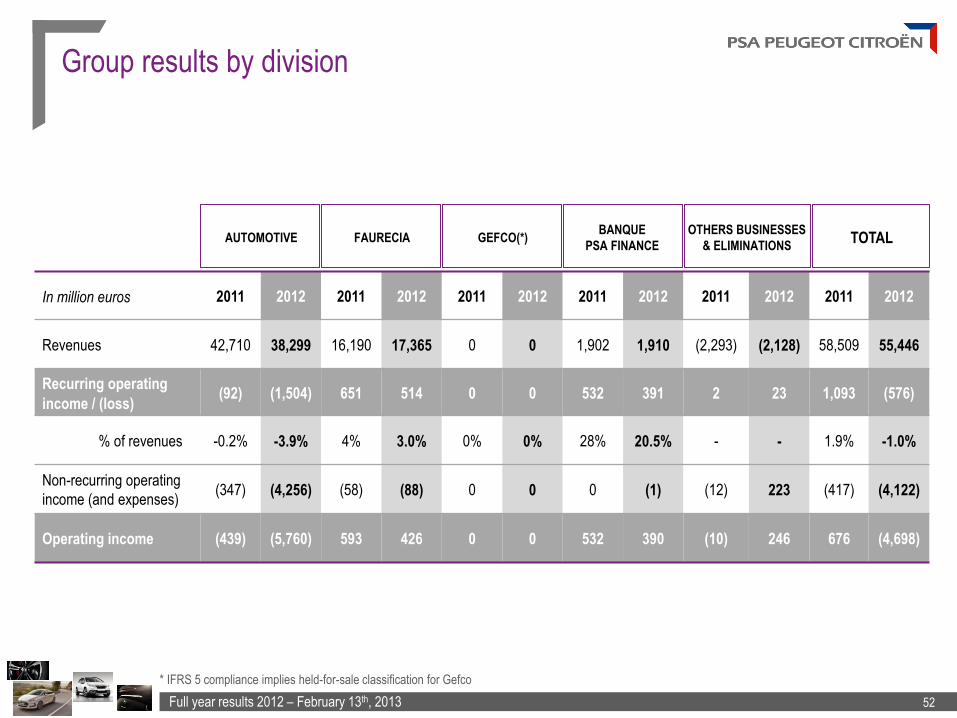
Full year results 2012 – February 13th, 2013 52
Group results by division
* IFRS 5 compliance implies held-for-sale classification for Gefco
PE
UG
EO
T 5
08
In million euros 2011 2012 2011 2012 2011 2012 2011 2012 2011 2012 2011 2012
Revenues 42,710 38,299 16,190 17,365 0 0 1,902 1,910 (2,293) (2,128) 58,509 55,446
Recurring operating
income / (loss) (92) (1,504) 651 514 0 0 532 391 2 23 1,093 (576)
% of revenues -0.2% -3.9% 4% 3.0% 0% 0% 28% 20.5% - - 1.9% -1.0%
Non-recurring operating
income (and expenses) (347) (4,256) (58) (88) 0 0 0 (1) (12) 223 (417) (4,122)
Operating income (439) (5,760) 593 426 0 0 532 390 (10) 246 676 (4,698)
AUTOMOTIVE FAURECIA GEFCO(*) BANQUE
PSA FINANCE
OTHERS BUSINESSES
& ELIMINATIONS TOTAL
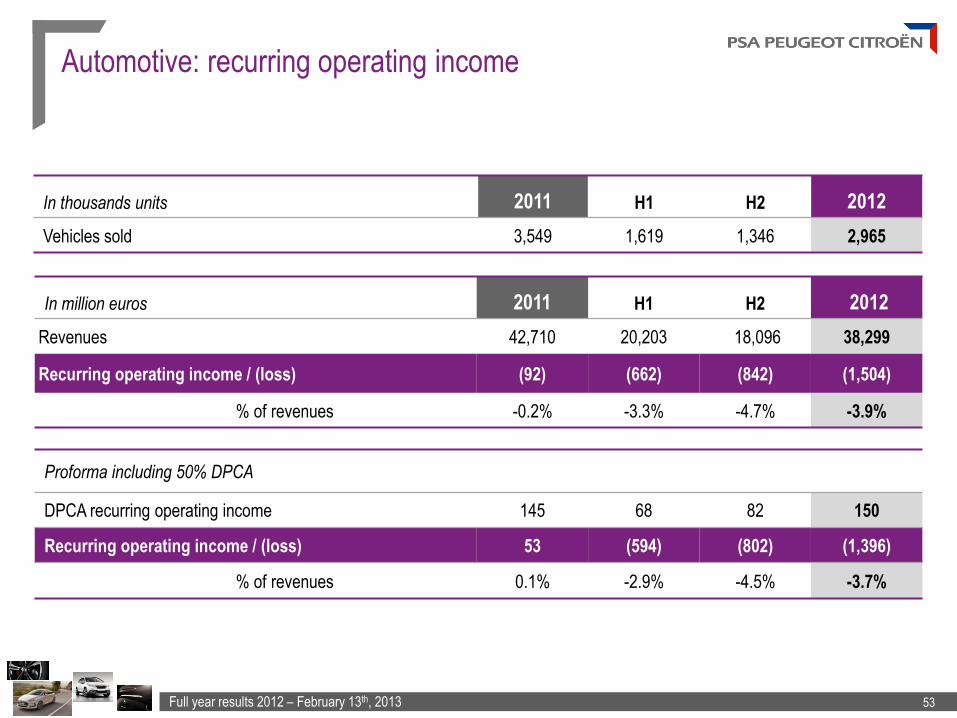
Full year results 2012 – February 13th, 2013 53
Automotive: recurring operating income
In thousands units 2011 H1 H2 2012
Vehicles sold 3,549 1,619 1,346 2,965
In million euros 2011 H1 H2 2012
Revenues 42,710 20,203 18,096 38,299
Recurring operating income / (loss) (92) (662) (842) (1,504)
% of revenues -0.2% -3.3% -4.7% -3.9%
Proforma including 50% DPCA
DPCA recurring operating income 145 68 82 150
Recurring operating income / (loss) 53 (594) (802) (1,396)
% of revenues 0.1% -2.9% -4.5% -3.7%
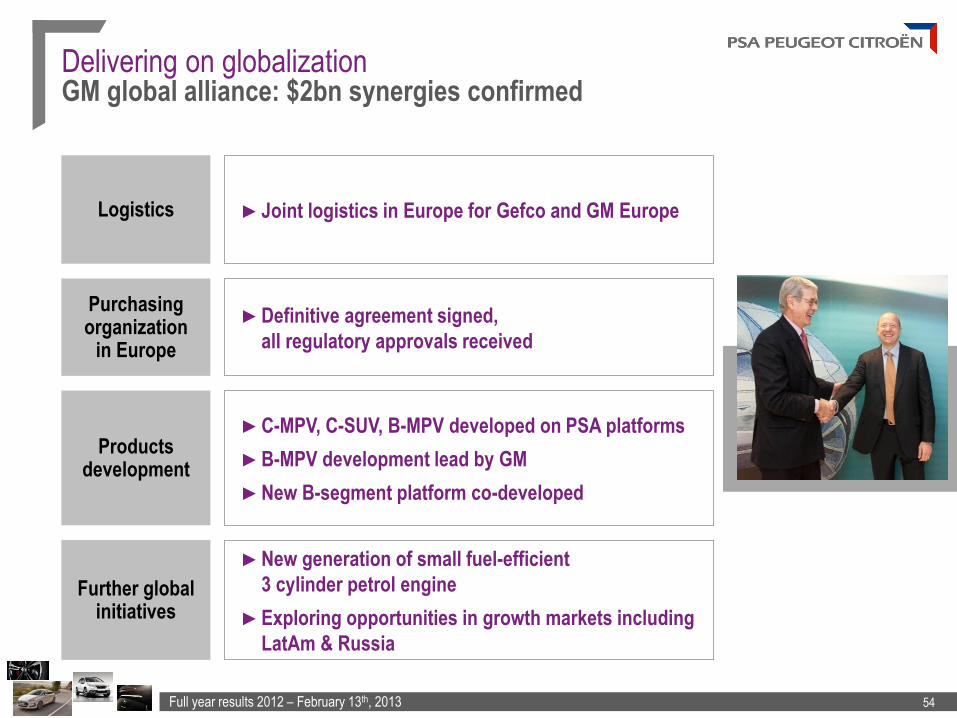
Full year results 2012 – February 13th, 2013 54
Delivering on globalization GM global alliance: $2bn synergies confirmed
Logistics ►Joint logistics in Europe for Gefco and GM Europe
Purchasing organization
in Europe
►Definitive agreement signed,
all regulatory approvals received
Products development
►C-MPV, C-SUV, B-MPV developed on PSA platforms
►B-MPV development lead by GM
►New B-segment platform co-developed
Further global initiatives
►New generation of small fuel-efficient
3 cylinder petrol engine
►Exploring opportunities in growth markets including
LatAm & Russia
Full year results 2012 – February 13th, 2013 55
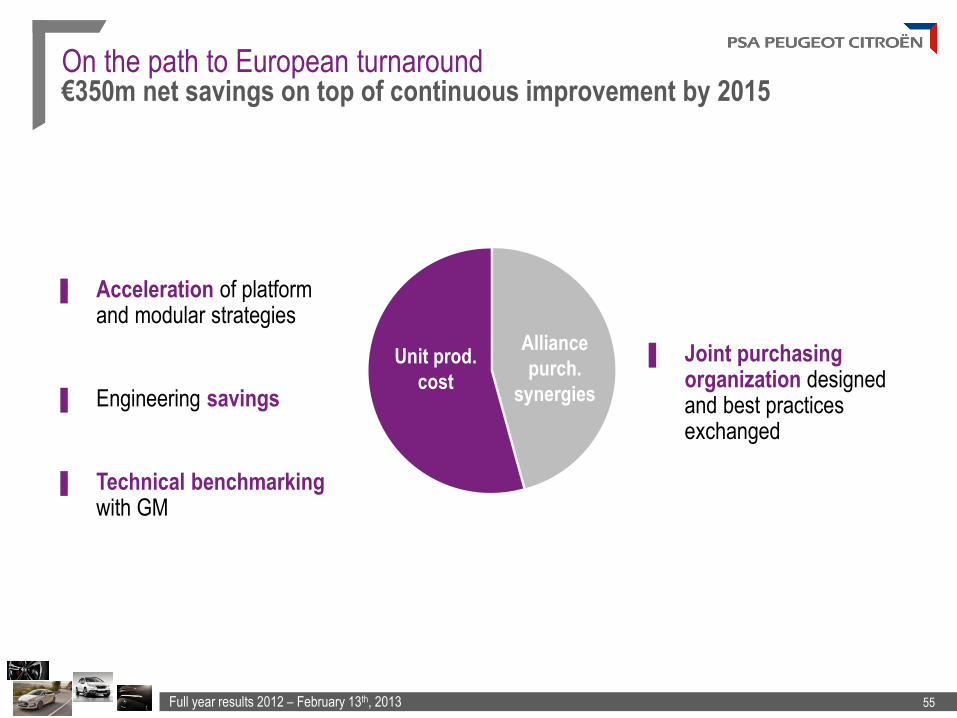
On the path to European turnaround €350m net savings on top of continuous improvement by 2015
▐ Joint purchasing organization designed and best practices exchanged
▐ Acceleration of platform and modular strategies
▐ Engineering savings
▐ Technical benchmarking with GM
Alliance
purch.
synergies
Unit prod.
cost
Full year results 2012 – February 13th, 2013 56
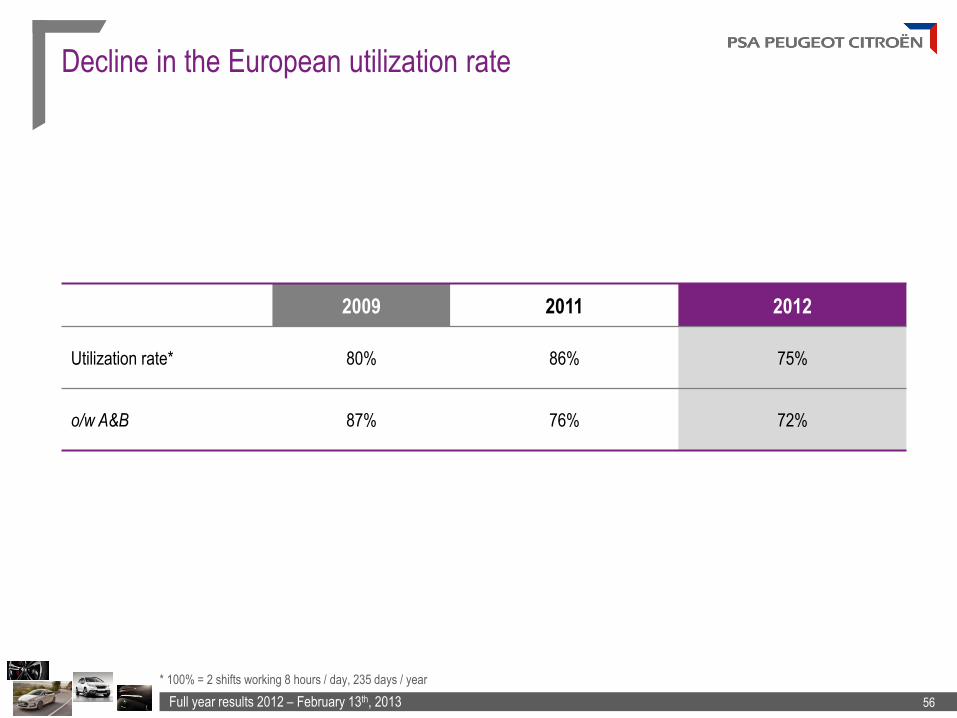
Decline in the European utilization rate
* 100% = 2 shifts working 8 hours / day, 235 days / year
2009 2011 2012
Utilization rate* 80% 86% 75%
o/w A&B 87% 76% 72%
Full year results 2012 – February 13th, 2013 57
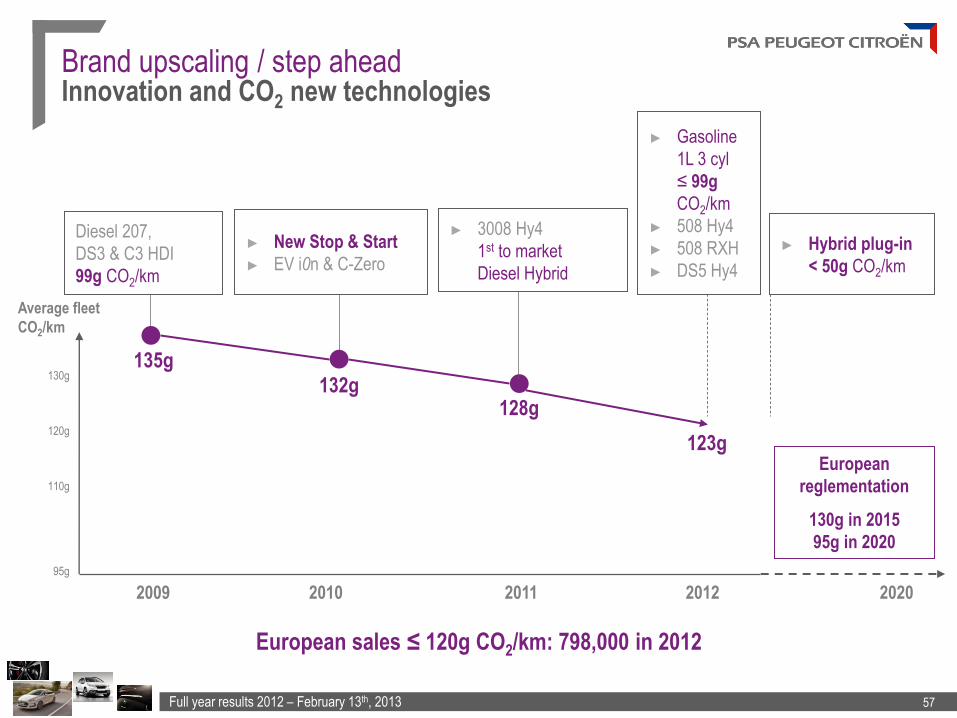
132g 128g
135g
European sales ≤ 120g CO2/km: 798,000 in 2012
► Gasoline
1L 3 cyl
≤ 99g
CO2/km
► 508 Hy4
► 508 RXH
► DS5 Hy4
► Hybrid plug-in
< 50g CO2/km
European
reglementation
130g in 2015
95g in 2020
130g
120g
2009 2010 2011 2012
95g
Average fleet
CO2/km
2020
110g
123g
► 3008 Hy4
1st to market
Diesel Hybrid
Diesel 207,
DS3 & C3 HDI
99g CO2/km
► New Stop & Start
► EV i0n & C-Zero
Brand upscaling / step ahead Innovation and CO2 new technologies