Embed Size (px)
Citation preview


This presentation is designed to show the features of four ‘third-party’GO analysis tools. These tools and others listed on http://www.geneontology.org/GO.tools.shtml#micro can be used in proteomics studies to view GO terms associated with a list of proteins obtained from high-throughput experiments and their statistical significancecompared with a reference set of proteins.*
Each presentation was prepared by the developers of the tools, using for the analysis a list of human cardiovascular-related protein accessions (or in the case of Blast2GO, the equivalent bovine protein sequences).
*All of these tools have been created outside of the GO Consortium. The articles authors do not intend to recommend any tool, merely demonstrate how GO analysis of proteome sets could be performed using some of these tools. We advise researchers to try several different tools to find one which suits their needs.
IntroductionIntroduction

Blast2GO Slide 4
FatiGO Slide 13
Onto-Express Slide 20
Ontologizer Slide 27
ContentsContents
Accession list I Slide 35
Accession list II Slide 36

Functional Annotation: First, the BLAST step to obtain the homologue sequences for the query sequences. Second, the actual GO annotation by applying the Blast2GO method which, basically, transfers the most confident and appropriate GO annotations to the novel sequences. Statistical charts help here to understand and interpret the annotation results.
Visualization: This step allows the users to get an overall idea of the assigned GO annotations of the sequence dataset making use of GO's graph structure.
Conesa, A., Götz, S., García-Gómez, J.M., Terol, J., Talón, M. & Robles, M. (2005). Blast2GO: A universal tool for annotation, visualization and
analysis in functional genomics research. Bioinformatics 21: 3674-3676
Blast2GO in BabelomicsBlast2GO in Babelomics
Bioinformatics DepartmentCentro de Investigación Príncipe Felipe (CIPF)
http://babelomics.bioinfo.cipf.es

2. GO terms are selected from this original pool to extract the most reliable annotationOnce all this information is gathered, an annotation score is computed for each {GO,Query Sequence} pair. Only the most specific GO term within a branch of the GO is assigned to the query sequence, and this assignment is dependent on the 'annotation score', the threshold for which is preset by the user. The annotation score is computed as:
Annotation score{GO, Seq} = (max.sim * ECw) + (#GO-1 * GOw)Annotation score{GO, Seq} = (max.sim * ECw) + (#GO-1 * GOw)
where: max.sim: is the maximal value of similarity between the query and hit sequences that have the given GO annotation ECw: is the weight given to the Evidence Code of the original annotation. Blast2GO has defined values for these weights, which can also be modified by the user. In general, ECw = 1 for experimental evidence codes and ECw < 1 for non-experimental evidence codes. #GO: is the number of annotated children terms GOw: is the weight given to the contribution of annotated children term to a given term
Annotation is the process of assigning functional categories to gene or gene products. In Blast2GO this assignment is performed for each sequence based on the information available for the homologous sequences retrieved by BLAST. Blast2GO annotation proceeds through a 2 step strategy:
Functional Annotation with Blast2GO
1. All GO terms for the BLAST hit sequences are collectedFor the first step, BLAST results are parsed and the identifiers of the BLAST hits are found and used to query the Gene Ontology database to recover associated functional terms. Also the evidence code of each particular annotation is recovered. The evidence codes indicate how the functional assignment in the Gene Ontology database has been obtained.

Upload your sequence file in FASTA format, choose the appropriate BLAST parameters and database (blastp for protein sequences) and press RUN
The homology search is the first and most time consuming step when attempting to transfer functional information from similar sequences to uncharacterized sequence data. This simple tool gives you the option to perform high-throughput BLAST searches against several protein databases, keep processes running until they are finished monitoring its actual status and saving the generated alignments as XML file. These XML-files can than be used as input data for the Blast2GO annotation method.
In this tab you can see the actual status of your job and for big datasets come back later to retrieve the results.
The BLAST Step (1/2)

Open the results with this link
Save your results as an XML file.
The BLAST Step (2/2)

Evidence code weights can be set to in/decrease the influence of different kinds of annotation
evidence e.g. automatically generated source annotation
Annotation rule parameters: e-Value cut-off as minimal quality criteria annotation rule cut-off (coverage vs. exactness) GO-Weight (more general vs. more specific terms) define a minimal alignment length allowed for function transfer
Upload and parse your BLAST results in NCBI's
XML format applying several filters
The Annotation Step
Start the annotation assignment

The Blast2GO web tool generates a multitude of statistical charts to understand the underlying dataset and to better interpret the generated
annotation results
A chart showing the e-value distribution of the BLAST results
A chart showing from which source databases the transferred GO terms were originally coming from
The result table to browse and export the generated annotations
review
browse
export
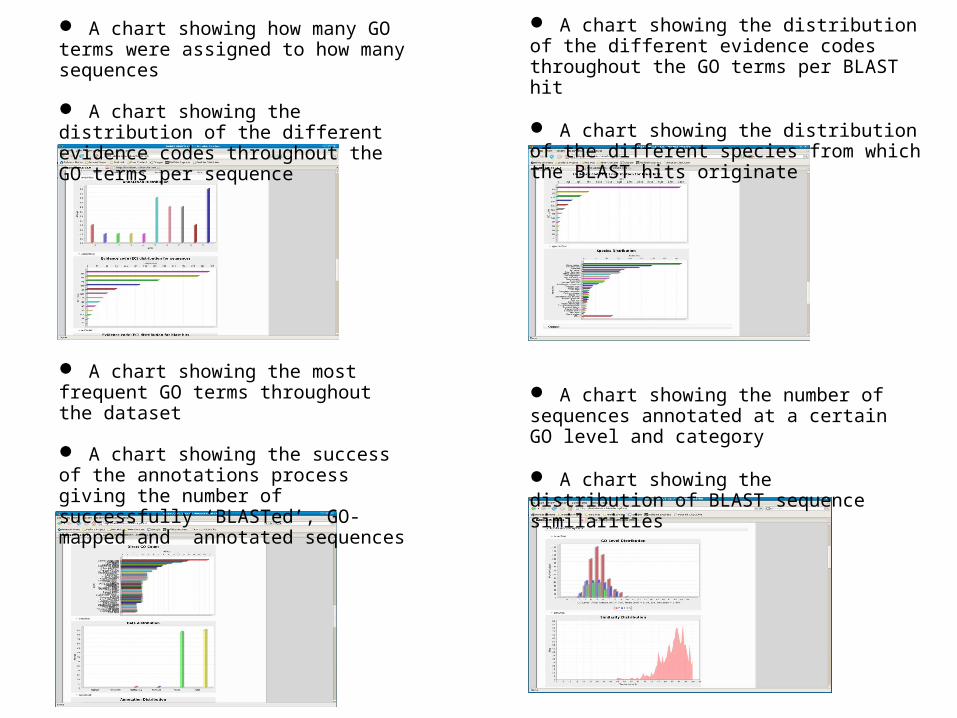
A chart showing the most frequent GO terms throughout the dataset
A chart showing the success of the annotations process giving the number of successfully ‘BLASTed’, GO-mapped and annotated sequences
A chart showing how many GO terms were assigned to how many sequences
A chart showing the distribution of the different evidence codes throughout the GO terms per sequence
A chart showing the number of sequences annotated at a certain GO level and category
A chart showing the distribution of BLAST sequence similarities
A chart showing the distribution of the different evidence codes throughout the GO terms per BLAST hit
A chart showing the distribution of the different species from which the BLAST hits originate
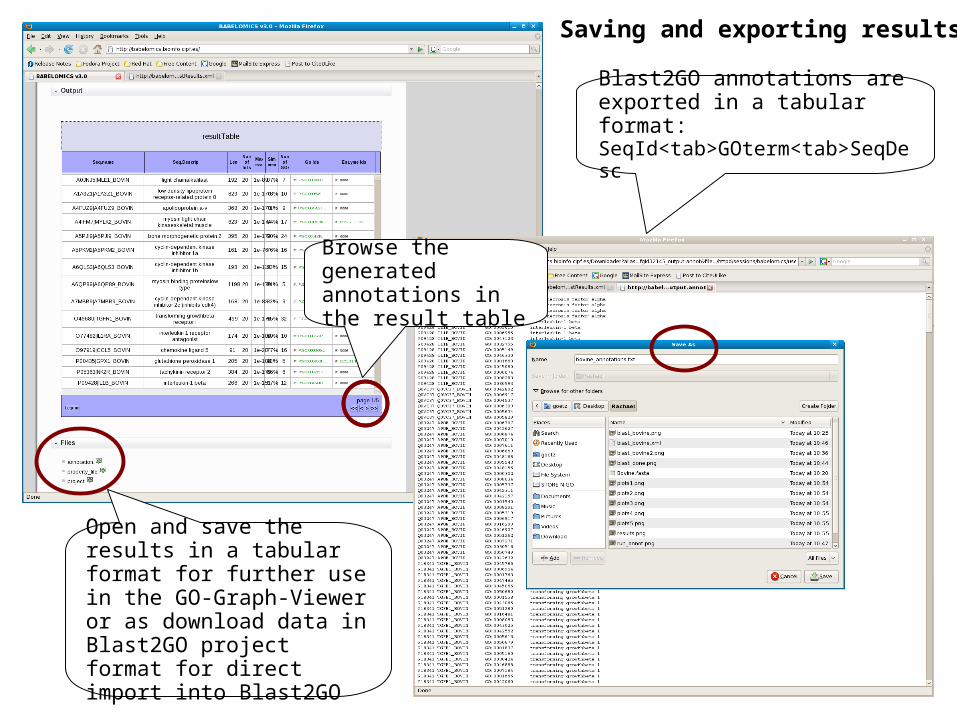
Open and save the results in a tabular format for further use in the GO-Graph-Viewer or as download data in Blast2GO project format for direct import into Blast2GO
Saving and exporting results
Blast2GO annotations are exported in a tabular format: SeqId<tab>GOterm<tab>SeqDesc
Browse the generated annotations in the result table

Start the interactive graph visualization tool with Java Web Start
Visualization: The GO-Graph-ViewerThe DAG viewer tool generates joined Gene Ontology graphs (DAGs) to create overviews of the functional context of groups of sequences. Interactive graph visualization allows the navigation of large and unwieldy graphs often generated when trying to biologically explore large sets of sequence annotations. Zoom and graph navigation is provided through the DAG viewer Java Web Start tool.
Define graph filtering parameters for more dense and informative graphs
Save parts of your graphs in high resolution images to better communicate your results
Upload your Blast2GO generated annotations

FatiGOFunctional enrichment analysis
Al-Shahrour, F., et al. (2005), Babelomics: a suite of web-tools for functional annotation and analysis of group of genes in high-throughput experiments, Nucleic Acids Research, 33, W460-W464
Al-Shahrour, F., et al. (2004), FatiGO: a web tool for finding significant associations of Gene Ontology terms with groups of genes, Bioinformatics, 20, 578-580
Bioinformatics DepartmentCentro de Investigación Príncipe Felipe (CIPF)
http://www.fatigo.orghttp://www.babelomics.org

Select your organism *Several types of identifier are acceptable,
such as UniProtKB, Ensembl IDs, HGNC symbols, RefSeq, Entrez Gene etc.
Enter your list or file of genes/proteins*
In this example, list #1 is a list of BHF-UCLannotated cardiovascular-related proteins (see Slide 35) and list #2 is the “Rest of genome”
Click options to filter the database
(optional)
Select the database(s) you
want to query

Filter Tool
Babelomics allows for sub-selection of gene annotations, in which gene modules are based, in order to test hypotheses in a more focused and sensitive manner. Removing from the analysis modules whose testing is unnecessary and superfluous increases the power of the tests in the multiple-testing adjustment step.
Use the level of the DAG and the evidence code as filtering criteria
Select subsets of annotations based on keywords and on the
size of the gene module

Results of GO analysis
Level 3 is less-granular terms. Level 9 is more-granular terms.
The number of annotated proteins per GO level is displayed

FatiGO returns a list of GO terms which are over-represented in the list of interest, in this case the BHF-UCL list. For Biological Process terms at level 3 of the ontology, the terms that are over-represented in the BHF-UCL list include muscle contraction, cell cycle and anatomical structure development.
Low p-value = more significant
The proteins from your query set that are annotated to each GO
term are listed

Best p-value
FatiGO shows terms deeper in the ontology, at level 6, which are over-represented in the BHF-UCL list (but not necessarily significantly – compare p-values) such as regulation of progression through cell cycle, heart development and cholesterol absorption. These are all processes you would expect cardiovascular-related proteins to be involved in.
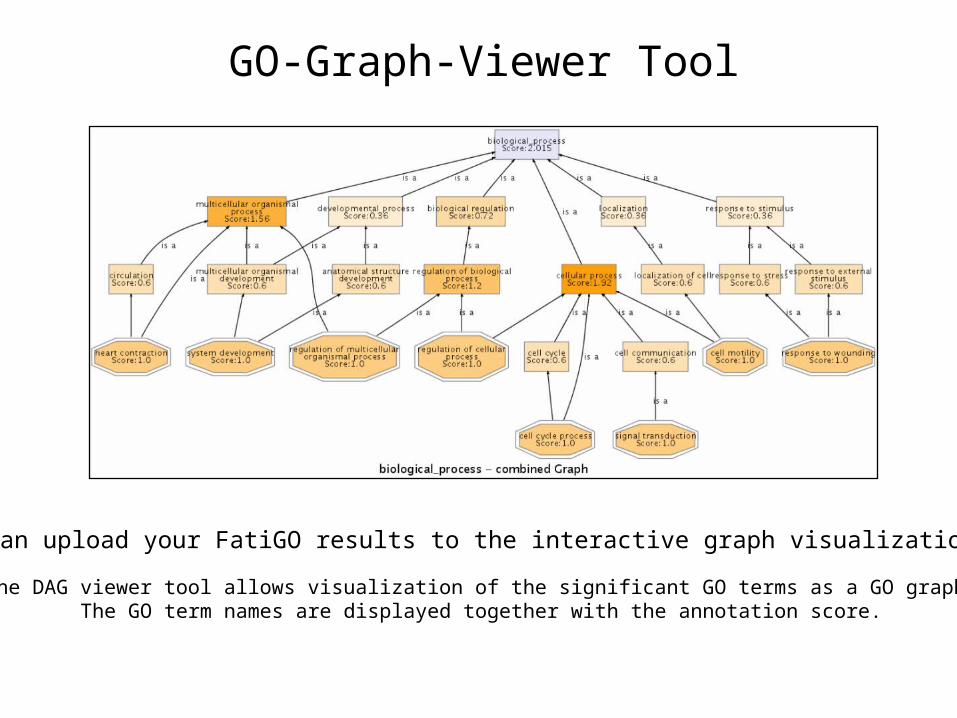
The DAG viewer tool allows visualization of the significant GO terms as a GO graph.The GO term names are displayed together with the annotation score.
GO-Graph-Viewer Tool
You can upload your FatiGO results to the interactive graph visualization tool

Onto-Express Features at a Glance
Purvesh Khatri ([email protected])Sorin Draghici ([email protected])
Intelligent Systems and Bioinformatics LabDepartment of Computer Science
Wayne State University
http://vortex.cs.wayne.edu/projects.htm#Onto-Express
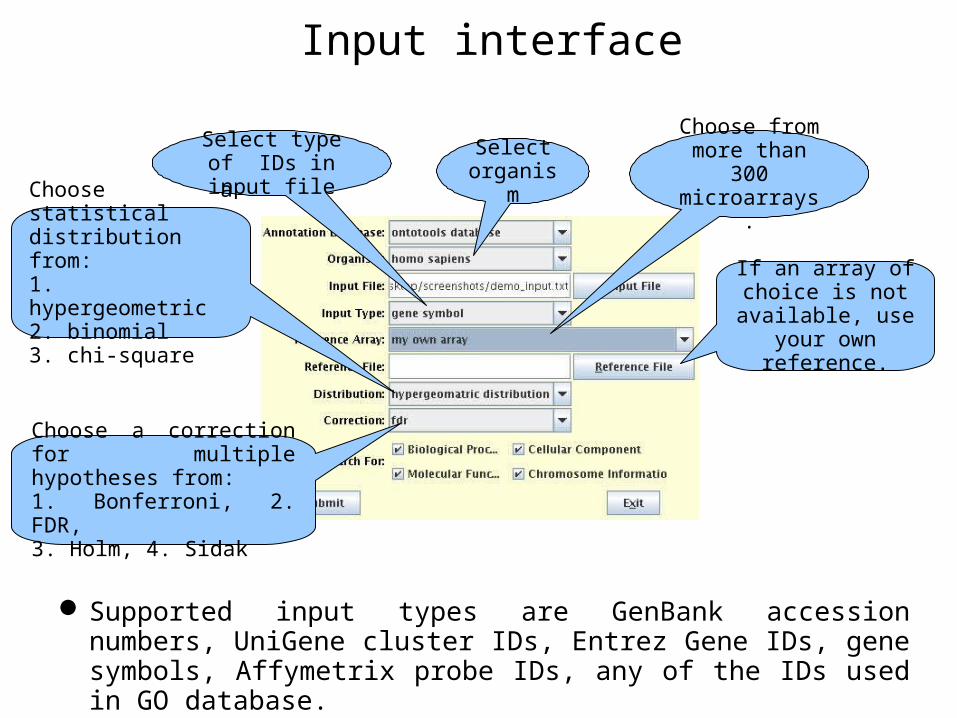
Input interface
Select organism
Select type of IDs in input file
Choose from more than 300 microarrays.
If an array of choice is not
available, use your own reference.
Choose a statistical distribution from:1. hypergeometric2. binomial3. chi-square
Choose a correction for multiple hypotheses from:1. Bonferroni, 2. FDR,3. Holm, 4. Sidak
Supported input types are GenBank accession numbers, UniGene cluster IDs, Entrez Gene IDs, gene symbols, Affymetrix probe IDs, any of the IDs used in GO database.

Results – Flat view

Results – tree view
• Choose a level to expand the GO tree and click “Expand” button.
• Only the GO terms with at least one input gene are displayed in the tree.

Results – chromosome view
• Chromosome information is supported for human, mouse and rat. It displays number of genes on each chromosome and their positions.
• Clicking on “NCBI Genome view” links out to NCBI Mapviewer.

Results – single gene view
Selecting “show in gene view” in the tree view displays the annotations for the selected gene in the GO hierarchy in the single gene view.

References
• Purvesh Khatri, Sorin Draghici, G. Charles Ostermeier, Stephen A. Krawetz. Profiling Gene Expression Using Onto-Express. Genomics, 79(2):266-270, February 2002.
• Sorin Draghici, Purvesh Khatri, Rui P. Martins, G. Charles Ostermeier and Stephen A.Krawetz. Global functional profiling of gene expression. Genomics 81(2):98-104, February 2003.
• Purvesh Khatri and Sorin Draghici. Ontological analysis of gene expression data: current tools, limitations, and open problems. Bioinformatics, 21(18):3587-95, September 2005.
• http://vortex.cs.wayne.edu/projects.htm.

Ontologizer
http://compbio.charite.de/ontologizer/
Institute for Medical GeneticsCharité Universitätsmedizin Berlin
Ontologizer Open Source Team
located at
Robinson P.N., Wollstein A., Böhme U., Beattie B. Ontologizing gene-expression microarray data: characterizing clusters with Gene Ontology. Bioinformatics. 2004 Apr 12;20(6):979-81.
Grossman S., Bauer S., Robinson P.N., Vingron M. Improved detection of overrepresentation of Gene Ontology annotations with parent child analysis. Bioinformatics. 2007 Nov 15;23(22):3024-31.
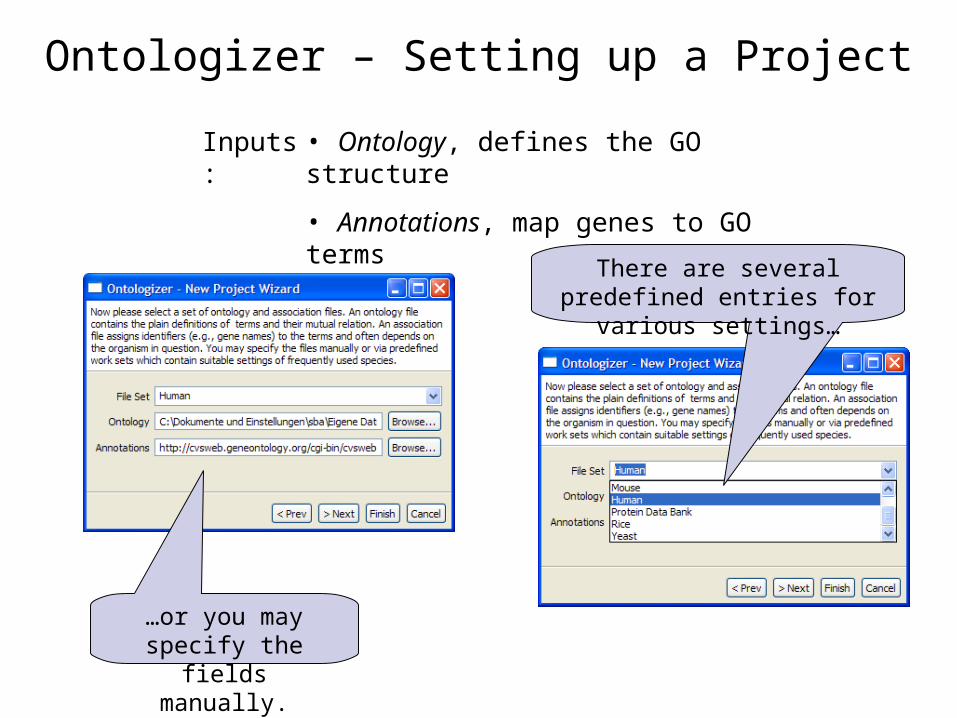
Ontologizer – Setting up a Project
• Ontology, defines the GO structure
• Annotations, map genes to GO terms
There are several predefined entries for various settings…
…or you may specify the fields manually.
Inputs:
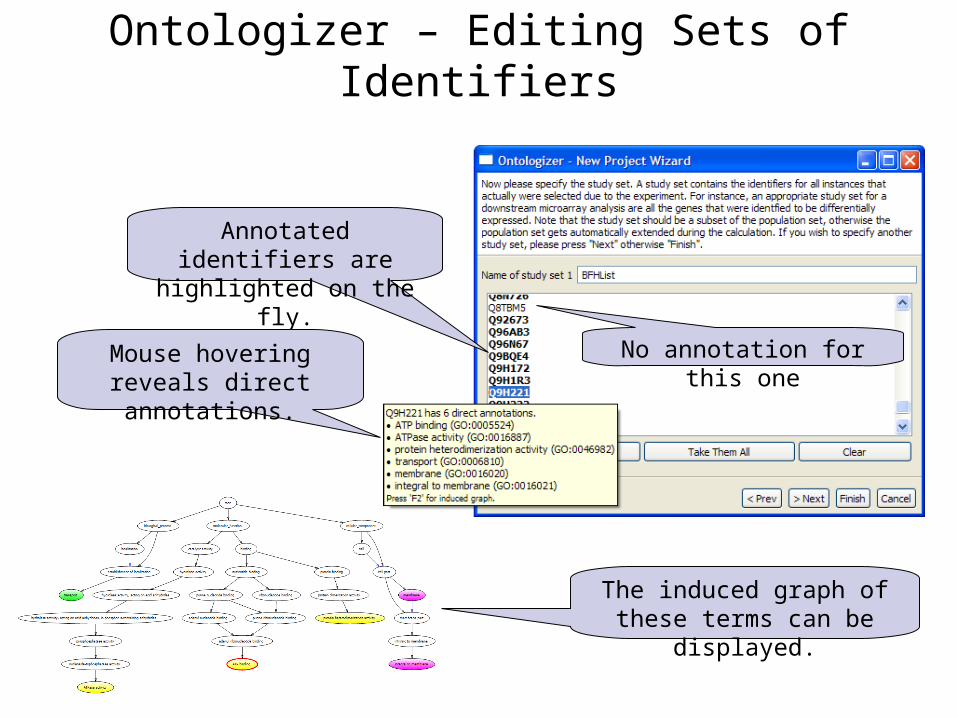
The induced graph of these terms can be displayed.
Annotated identifiers are highlighted on the fly.
Ontologizer – Editing Sets of Identifiers
Mouse hovering reveals direct annotations.
No annotation for this one

Of interest here are two lists of identifiers – study and population.*
*In this example the study list is a list of BHF-UCL annotated cardiovascular-related proteins (see Slide 35) and the population list is a random list of human UniProtKB accessions.
Choose analysis method; parent-child takes account of the ontology structure, term-for-term treats
each term independently.
Ontologizer – Overview
But multiple projects may reside in the workspace.

A list of terms is displayed. The shading indicates significance – darker shading is more
significant.
Click on a term to display its position in the
ontology, definition and the proteins annotated to
it and its parents.
Ontologizer – Results

The term highlighted in the table will also be highlighted red in the graph.
Yellow = Molecular Function
Pink = Cellular Component
Green = Biological Process
Ontologizer – Graphical View of Results

Ontologizer – What Else?
• Can be easily invoked from the Web.
• Input files can be located remotely.
• Several procedures of multiple testing correction are supported.
• Results can be filtered and stored in a tabular as well as in a graphical fashion.
• A command line version is available.

AcknowledgmentsThe authors wish to thank the developers of the tools for preparing
these presentations as follows;
• FatiGO Fatima Al-Shahrour
• Blast2GO Stefan Götz
• Ontologizer Sebastian Bauer and Peter Robinson
• Onto-Express Sorin Draghici and Purvesh Khatri

List of human UniProtKB accessions used in FatiGO, Onto-Expressand Ontologizer analyses
O00273
O60543
O75955
O95477
P00519
P01127
P01137
P01375
P01584
P02647
P02649
P02652
P02655
P02656
P04114
P04180
P05231
P05976
P06727
P06741
P06858
P07203
P08590
P09493
P09958
P10253
P10636
P10916
P11597
P11802
P12643
P12829
P12830
P13501
P16519
P17947
P18510
P22301
P24385
P25098
P25103
P29120
P30279
P30281
P34947
P35226
P36897
P37173
P38936
P40337
P42684
P42771
P42772
P42773
P45379
P45844
P46527
P49918
P50150
P55273
P55290
P61812
P84022
Q00534
Q00872
Q01449
Q13485
Q14114
Q14896
Q15796
Q16665
Q5JRA6
Q6PGN9
Q6Q788
Q86Y82
Q8N726
Q8TBM5
Q92673
Q96AB3
Q96N67
Q9BQE4
Q9H172
Q9H1R3
Q9H221
Q9H222
Q9HC96
Q9UKX2
Q9UNQ0
Q9UPY8
Q9Y5C1
Q9Y623

List of bovine UniProtKB accessions used in Blast2GO analysis
A0JNJ5
A1A3Z1
A4FUX1
A4FUZ9
A4IFM7
A5PJI9
A5PKM2
A6QLS3
A6QP89
A7MBB9
O46680
O77482
O97919
P00435
P05363
P09428
P11151
P13789
P15497
P18341
P19034
P19035
P21146
P21214
P26892
P43249
P43480
P81644
P85100
Q03247
Q06599
Q08DE0
Q0P5D3
Q0VC16
Q0VC37
Q0VD56
Q1HE26
Q1RMM7
Q1W668
Q24JY8
Q28193
Q29RJ9
Q29RV0
Q2KI22
Q2KI76
Q2KIW4
Q2KJB3
Q2KJD8
Q2KJD8
Q2TBI0
Q32KX0
Q32KX7
Q32KY4
Q32PJ1
Q32PJ2
Q3B7N0
Q3MHH5
Q3SYR3
Q3SZE5
Q3SZE5
Q4GZT4
Q4TTZ1
Q4ZJV8
Q4ZJV9
Q58D48
Q5E9I5
Q5KR49
Q6R8F2
Q9BE40
Q9BE41
Q9GLR0
Q9GLR1
Q9MYM4
Q9XTA5