Embed Size (px)
Citation preview

PHILIPPINE ENGINEERING JOURNAL
PEJ 2012; Vol. 33, No. 2: 44-60
Copyright © 2012 Philippine Engineering Journal Received: May 31, 2011
Accepted: June 29, 2012
THREE-DIMENSIONAL NONLINEAR TIME-HISTORY ANALYSIS
OF TWO-STOREY CONCRETE WALL-TYPE STRUCTURE
Fernando J. Germar1 and Benito M. Pacheco
2
1 Associate Professor, Institute of Civil Engineering, University of the Philippines, Diliman, Quezon City,
Philippines, e-mail: [email protected] 2 Professor, Institute of Civil Engineering, University of the Philippines, Diliman, Quezon City,
Philippines, e-mail: [email protected]
ABSTRACT
A two-storey concrete wall-type structure is analyzed using three-dimensional nonlinear time-
history analysis. Ground acceleration records of the magnitude 7.2 Kobe earthquake are used to
simulate a scenario earthquake from the 67 km West Valley fault in Metro Manila. Ansys®
software is used in the analysis to enable the modeling of concrete inelasticity: due to both
concrete cracking and concrete crushing, using Solid65 concrete element. Using this element,
smeared reinforcement is also introduced in the model. Results of simulation show that the failure
mode is governed by tension cracks in the concrete adjacent to the corners of openings in the
walls, especially in the absence of additional diagonal reinforcement thereat. It is also shown that
concrete crushing failure is not critical for the structure analyzed, even in the absence of special
boundary elements. Comparison of the result of simulation using different ground acceleration
records scaled up to the same level shows that both stresses and deflections are higher for the
record that has a predominant period of 0.34sec which is relatively nearer that of the natural
period of structure of 0.15sec. The effect of frequency content of the input ground motion, which
may be attributed to the soil condition, is evident in this study. There is a need for further research
on more appropriate ground acceleration inputs for simulations like this study. The computational
effort of about 10 hours using 1.83 GHz Intel Core Duo processor and 2.49GB RAM for a 10-sec
simulation at 0.01sec interval is too much for most engineering design offices. While the
computational effort for a 16-sec simulation at 0.02 sec interval for a small structure as in this
paper could be reduced from 8 hours to 2.5 hours using a much powerful HP Proliant ML150 G6
server with 2.26 GHz, 8-core processor and 48 GB RAM, this computer is still not the norm for
ordinary engineering design office. Aside from considerable storage disk requirement, software
commercially available to engineering design offices are typically less powerful; there is thus still
a need for simplified analytical tools, e.g. 2-dimensional nonlinear static analysis by pushover.
Keywords: Nonlinear Time-History Analysis, Concrete, Wall-Type Structure, Ground
Acceleration
_____________________
Correspondence to: F.J. Germar, Institute of Civil Engineering, University of the Philippines, Diliman,
Quezon City, 1101, PHILIPPINES, e-mail: [email protected]

TWO-STOREY CONCRETE WALL-TYPE STRUCTURE
Copyright © 2012 Philippine Engineering Journal Phil. Eng’g. J. 2012; 33: 44-60
45
1. INTRODUCTION
New technologies and structural systems are recently introduced in the Philippine housing
industry. One such technology is the reinforced concrete bearing wall type construction system.
This construction system without beams and columns is now beginning to be used in multi-storey,
multi-dwelling units as well as in one or two-storey single-family dwelling units. Shorter
construction period for this construction system makes it an attractive alternative to housing
developers. However, while excellent performance of moderate-rise bearing wall type buildings
was observed during the 1985 Viña del Mar, Chile earthquake (Wood, 1992), this particular
technology, which is characterized by modest reinforcement details by US standards, is still
untested under earthquakes in the Philippines. It may be noted that expected earthquakes in our
country may exceed the peak ground acceleration of 0.36g experienced in Viña del Mar, Chile
located 80kms from the epicenter. Moreover, building code requirements in the country, which are
based on US codes, present some technical difficulties for the adoption of this type of construction
system locally since it has been observed that the cost of detailing makes this construction system
uneconomical following the United States building code (Wallace & Moehle, 1992). The use of
bearing wall type system for low-rise single-family dwelling structures also requires particular
attention due to the presence of many perforations. It is thus necessary to assess the seismic
performance of concrete bearing-wall type structural system considering local earthquake
scenario. It is also necessary to develop practical analysis tools for such assessment.
2. OBJECTIVES
Previous unpublished work by the first author on this type of structure using linear elastic
analysis implemented using ETABS showed that boundary elements are required on certain areas
of the structure following the provisions of the National Structural Code of the Philippines (NSCP,
2010), validating the observation in the United States. The special requirement for boundary
elements makes the detailing of wall-type structure rather uneconomical. Moreover, it may be
observed that while most commercially available software used by practicing engineers such as
ETABS, SAP2000, and STAAD can do nonlinear analysis of frame-type structures, walls
elements can only be modeled therein as line elements. Shear-type of failure for walls is not
adequately addressed.
This study therefore seeks to simulate the behavior of a two-storey concrete bearing-wall type
structure under earthquakes that may be expected to occur in the country using nonlinear time-
history analysis. Potential compression mode of failure, which is the reason for special boundary
element, as well as critical locations for tension cracking mode of failure are investigated.
Among the challenges are: appropriate modeling of concrete wall-type structure with
nonlinear material properties and appropriate modeling of time history of ground motion.
3. NUMERICAL SIMULATION
Nonlinear time-history analysis of the 3-dimensional model, shown in Figure1, is performed
using different earthquake record data as alternative input. Transient Analysis facility of ANSYS®
(ANSYS, 2010) (ANSYS, 2010) using Ansys Parametric Design Language (APDL) is used in this
study. Seismic load is introduced in the form of acceleration applied at the foundation level.

F. J. GERMAR and B. M. PACHECO
Copyright © 2012 Philippine Engineering Journal Phil. Eng’g. J. 2012; 33: 44-60
46
An APDL code is written for transient analysis to enable the software to read the input
acceleration applied at different time increment. All points at the ground level are assumed to be
synchronously accelerated. The ground acceleration digital record is stored in an array for input in
the analysis. Gravity load is introduced in the form of inertia load along the global y-axis.
3.1 Structural Model
For this two-storey wall-type structure, walls are modeled using SOLID65 element. An
important aspect of this element is that it can model nonlinear material property. This material
type can model both concrete cracking in tension and crushing in compression as well as the
reinforcing bars. Eight nodes with three translational degrees of freedom each define the element.
Cracking is permitted at each integration point. Reinforcing bars are assumed to be smeared over
the element. The slabs, on the other hand, are modeled as concrete SHELL63 elements. The finite
element model using mapped meshing for walls and free-meshing for slabs is shown in Figure
1.Wall thickness used is 100mm so as not to exceed the maximum length to thickness ratio of 25
for the unsupported length of 2.6 m per section 414.6.3.15 of the National Structural Code of the
Philippines (NSCP, 2010). Floor slabs are 125 mm thick. The computed (fundamental) natural
period, using ANSYS, of the structure in Fig. 1 as described above is 0.15 sec.
Figure 1. Structure 3-D Model
Input data includes volumetric ratio and direction of reinforcing bars in addition to concrete
properties.
The following material properties are used for SOLID65 element in the analysis:
Concrete Properties:
Concrete Strength = 13.3 MPa; Compressive (Crushing) Strength = 8.666 MPa; Cracking
Strength = 1.13 MPa; E = 14.131 GPa; Poisson’s Ratio = 0.25

TWO-STOREY CONCRETE WALL-TYPE STRUCTURE
Copyright © 2012 Philippine Engineering Journal Phil. Eng’g. J. 2012; 33: 44-60
47
Concrete softening is introduced in the model by using a concrete softening factor. Concrete
softening is the reduction of compressive strength due to tension in the transverse direction. This
phenomenon was first understood when it was observed by J. Peter in his 1964 dissertation at
Technische Hochscule Stuttgart (Mo & Rothert, 1997) that concrete panels subjected to
compression were softened by tension in the transverse direction. A softening parameter was first
quantified by Vecchio and Collins in 1981 in their Compression Field Theory based on test results
of 17 reinforced concrete panels (Mo & Rothert, 1997). By combining equilibrium, compatibility,
and a softened stress-strain relation of concrete, Vecchio and Collins also developed the Modified
Compression Field Theory in 1986 (Palermo & Vecchio, 2004). Hsu (1991) also proposed a
softened truss model theory based on the work of Vecchio and Collins. Hwang, Fang, Lee, & Yu
(2001) used a softened strut and tie model to predict the strength of squat walls. The Modified
Compression Field Theory was also implemented by Palermo and Vecchio (2004) for finite
element formulation. Salem & Maekawa (2006) also applied concrete softening using the
Okamura-Maekawa concrete softening model in finite element analysis. An advantage of the
Okamura-Maekawa concrete softening model is the consideration of the strain-rate factor in the
model.
Ansys default failure criteria for concrete is based on the work of Willam and Warnke [Ansys
Theory Reference, (Ansys, Inc., 2009)]. Failure criteria is expressed in the form:
[Eq. 1]
Where F is a function of state of principal stress
S is a failure surface in terms of principal stresses and concrete parameters
fc = uniaxial crushing strength
The functions F and S are defined for four different domains depending on the nature of
stresses at the point. These domains are:
0 ≥σ1≥σ2≥σ3(compression-compression-compression),
σ1≥0 ≥σ2 ≥σ3(tension-compression-compression),
σ1≥ σ2≥0 ≥σ3(tension-tension-compression), and
σ1≥σ2≥σ3≥0 (tension-tension-tension)
Graph of the failure surface is shown in the following:
Figure 2. 3-D Failure Surface in Principal Stress Space (Ansys, Inc., 2009)

F. J. GERMAR and B. M. PACHECO
Copyright © 2012 Philippine Engineering Journal Phil. Eng’g. J. 2012; 33: 44-60
48
Other details of the concrete failure criteria can be found in Ansys Theory Reference (Ansys,
Inc., 2009).
In Ansys concrete modeling, shear transfer coefficient is used to represent the condition of the
crack face. A shear transfer coefficient of zero means complete loss of shear transfer while a shear
transfer coefficient of 1.0 means no loss of shear transfer (for rough crack). Different values of
shear transfer coefficient were used by different authors. Baetu and Ciongradi (2011) used shear
transfer coefficient of 0.4 and 0.8 respectively for open (βt) and closed (βc) cracks. Greeshna, Jaya,
and Annilet (2011) used shear transfer coefficients of 0.2 and 0.9 respectively for open and closed
cracks. Qi Zhang (2004) used shear transfer coefficient of 0.125 to 1.0 for open cracks and
observed that “Although there is no significant difference of the ultimate loading with the different
βt , accompanying with the increase of βt , the ultimate loading is slightly increased after the
displacement is beyond 3mm”. For this study, shear transfer coefficient is taken to be zero for
open crack while closed crack shear transfer coefficient is conservatively taken to be 0.6,
considering the small amount of reinforcement used. Effect of using higher values of βt and βc is
currently under study. Discussion of concrete material property can be found in Ansys Theory
Reference – Concrete (ANSYS, 2010).
It may be noted that a study conducted by Cheng, Sun, and Fan (2002) used the Okamura-
Maekawa sheared concrete softening model for 2-D analysis in Ansys to account for concrete
softening.
In this study, Ansys concrete material property was used with concrete softening coefficient of
0.65 in compression based on the result of a previous study (Germar, 2011) for lattice wall model.
A need for further research on concrete softening for finite element application is acknowledged.
Viscous damping is used in Ansys in the form C = αM + βK. In this study, α was taken to be 0
while β was taken to be 0.05: hence damping is assumed to be proportional to the stiffness.
It may also be observed that the concrete strength used in this study is smaller than what may
be commonly used in actual construction practice. Initial analysis using 20 MPa concrete showed
that compression mode of failure is not critical. Hence, concrete strength is reduced to 13.3 MPa
to see potential compression mode failure at reduced concrete strength. Moreover, code
requirement for 16mm bars around the openings is not applied, coupled with reduced concrete
strength, to expose critical locations in tension cracking during the simulation.
Steel Properties:
The reinforcement provided in the model is the minimum requirement for the horizontal
reinforcement. The vertical reinforcement of 0.0025 is adopted similar to the horizontal
reinforcement for simplicity though higher than the minimum requirement of 0.0015.
3.2 Earthquake Ground Motion Data
Scenario earthquake from the West Valley fault system based on the Metro Manila
Earthquake Impact Reduction Study (MMEIRS) (JICA, 2004) is considered in this study. This
67km fault is a strike-slip fault capable of generating a magnitude 7.2 earthquake. The fault
system is similar in mechanism to the San Andreas Fault, Kobe Fault, and the North Anatolian
Fault in Turkey which are also mainly strike-slip faults. The 1995 magnitude 7.2 Kobe earthquake
thus appears to be a reasonable approximation of the West Valley Fault scenario earthquake.

TWO-STOREY CONCRETE WALL-TYPE STRUCTURE
Copyright © 2012 Philippine Engineering Journal Phil. Eng’g. J. 2012; 33: 44-60
49
Accelerograms of Kobe earthquake recorded at JMA station and Port Island station were
used in the MMEIRS. JMA and Port Island stations have epicentral distances of 18.27km and
19.25km respectively. For this study, the JMA record and the Nishi-Akashi record are used with
or without scaling of the amplitudes. Based on PEER database (Pacific Earthquake Engineering
Research Center), the JMA record was recorded on diluvium while the Nishi-Akashi record, at
epicentral distance of 8.5km, was recorded on soft soil (Manfredi, Polese, & Cosenza, 2003).
Ground motions in two perpendicular directions are used as input data in this study. Considering
the source faulting mechanism and maximum capable magnitude, the earthquake records are
selected because of their proximity to the epicenter. It should be noted that due to limited
earthquake record available, the present structural code (NSCP, 2010) requires earthquake records
to be used to be scaled only to a certain level regardless of the soil condition under which the
earthquakes were recorded. Based on the Code, “Appropriate time histories shall have magnitudes,
fault distances and source mechanisms that are consistent with those that control the design-basis
earthquake (or maximum capable earthquake).”
Accelerograms and acceleration spectra at Nishi-Akashi station are shown in Figures. A.1,
A.2, and A.5. Earthquake record NIS000 has a maximum ground acceleration of 0.509g and
predominant period of 0.46sec. NIS090 has a maximum ground acceleration of 0.503g and
predominant period of 0.44sec.
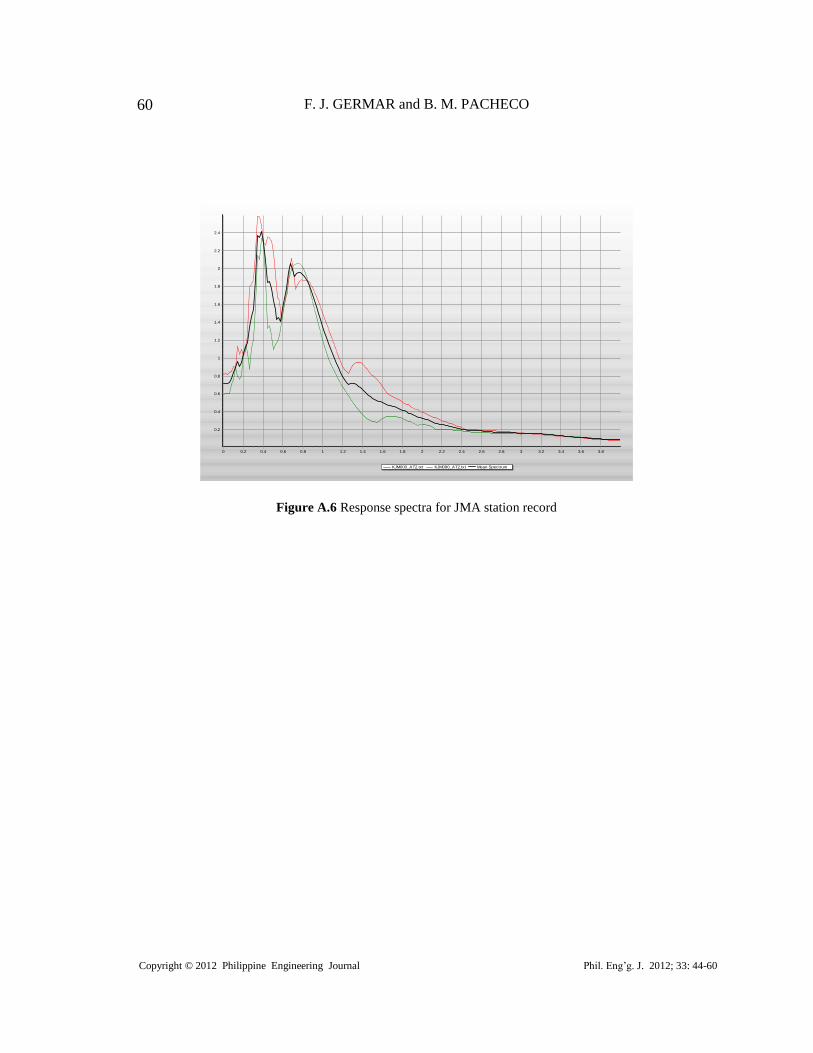
As shown in Figures A.3, A.4, and A.6,for JMA station, maximum recorded ground
acceleration is 0.821g with predominant period of 0.34sec for JMA000 and 0.599g with
predominant period of 0.38sec for JMA090. Note that for this record, spectral acceleration at 0.15
sec is almost 1g.
Time-history, acceleration spectra, and other ground motion parameters are obtained using
SeismoSignal and SeismoSpect by Seismosoft® (Seismosoft, 2010).
Selection of earthquake ground motion based on National Structural Code (NSCP, 2010)
provisions for time-history analysis requires an average value of SRSS spectra of at least 1.4 times
the 5% damped spectrum of the design basis earthquake for period from 0.2T second to 1.5T
seconds. For the computed period of the structure of 0.15 second, this corresponds to the range of
0.03 to 0.225 seconds.
For Nishi-Akashi station records, the response spectrum at 0.15 second is approximately
0.80g in both directions. Due to limited available earthquake records of similar magnitude, fault
distance, and source mechanism, the Nishi-Akashi record is used in this study with a scale factor
of 1/0.80 or 1.25 to approximate the target demand spectrum of 1g for 5% damped spectrum of the
design basis earthquake. A scale factor of 1.75 is also used for the Nishi-Akashi record to
approximate the code requirement that the response spectrum be at least 1.4 times that of design
basis earthquake within the period 0.2T to 1.5T.
As previously noted spectral acceleration at 0.15 sec is almost 1g for the JMA record. For
JMA record, a scale factor of 1.27 is also used in this study to raise it to the same level of response
as that of 1.75 x Nishi-Akashi record which is 1.4 times that of the design basis earthquake. It is
acknowledged though that simply scaling the acceleration amplitudes without considering the
frequency content may not be entirely realistic. Hence it is imperative to continue the research on
realistic ground acceleration time-histories that may be used in nonlinear simulation like this
study. For now, the Kobe records with amplitude scaling as described above are considered
appropriate.

F. J. GERMAR and B. M. PACHECO
Copyright © 2012 Philippine Engineering Journal Phil. Eng’g. J. 2012; 33: 44-60
50
The selection of appropriate ground motion for performance evaluation still presents a
problem in many studies. As noted by Krawinkler (1997), in the seismic demand evaluation of
steel frame structures in SAC steel project, the first storey drift for a 2.4 sec structure had a
coefficient of variation of 0.68 and a ratio of maximum to mean drift of 3.9 using a 10%
probability of exceedance for 50 year earthquakes for Los Angeles, California.
4. DISCUSSION OF RESULTS
4.1 Result of 3-D Time History Analysis
Detailed results of the above simulation are presented in Germar (2011), where it is also noted
that at the time of this study it takes around 10 hours to compute a 10-second response time
history at 0.01 sec time step using 1.83 GHz Intel Core Duo processor and 2.49GB RAM. A 16-
second simulation using a time step of 0.02 sec took 8 hours to complete using the same machine.
Example results of nonlinear time-history analysis using the Nishi-Akashi record are shown in
Figures 2; 4 - 6. Relative displacement response for the first 10 seconds of a sample point at roof
level of longitudinal wall 1 for 1.75 x Nishi-Akashi record is shown in Figure 2. The maximum
relative displacement of 0.93mm occurs at time 9.01 sec.
Maximum and minimum principal stresses at time 9.01 sec are shown in Figures4 and 5.
Maximum principal stress shows the location of elements in tension. Minimum principal stress, on
the other hand, shows the location of elements under compression. The diagonal pattern of both
tensile and compressive stresses is quite evident in both figures. (The slabs are not shown in the
figures, to show the stresses in the walls.)
Largest compressive stress amounts to around 3.3 MPa (color yellow) in the vicinity of the
corners of windows and door openings and the base corner. Largest tensile stress amounts to
around 1.13 MPa, (color yellow-green), which is the cracking strength of concrete, also in the
vicinity of the corners of windows and door openings and forming diagonal lines into the base
corner.
Figures 3; 7-9 show the corresponding results for the JMA record scaled by 1.27. Maximum
roof displacement for the 1.27x JMA record for the first 14 seconds amounts to 1.37mm at time =
8.58 sec.
Maximum compressive stress amounts to around 5.8MPa (color green) in the vicinity of the
corners of windows and door openings and the base corner. Maximum tensile stress amounts to
around 1.13 MPa, (color yellow-green), which is the cracking strength of concrete, also in the
vicinity of the corners of windows and door openings and forming diagonal lines into the base
corner.
For both the 1.75 xNishi-Akashi and 1.27 x JMA records, the compressive stresses are within
the compressive strength limit while the tensile strength limits are reached in the vicinity of the
openings (in the absence of additional diagonal reinforcing bars as intended in the simulation).
Based on the results of simulation, it can be observed that while 1.75 x Nishi-Akashi record
and the 1.27 x JMA station record have the same level of maximum acceleration and response
spectrum, the 1.27 x JMA records result in higher roof displacement and state of stress. A possible
explanation could be the effect of frequency content of JMA record nearer that of the structure: the
Nishi-Akashi record has a predominant period of 0.46 sec while the JMA record has a
predominant period of 0.34sec that is nearer that of the fundamental natural period of structure
which is 0.15sec. It is even possible, and potentially more adverse to the structure, to have ground
accelerations with predominant periods even closer to 0.15sec: e.g nearer the fault and/or on stiffer
ground.

TWO-STOREY CONCRETE WALL-TYPE STRUCTURE
Copyright © 2012 Philippine Engineering Journal Phil. Eng’g. J. 2012; 33: 44-60
51
Figure 3. Longitudinal wall 1 relative roof displacement (1.75 x Nishi-Akashi)
Figure 4. Longitudinal wall 1 relative roof displacement (1.27 x JMA)

F. J. GERMAR and B. M. PACHECO
Copyright © 2012 Philippine Engineering Journal Phil. Eng’g. J. 2012; 33: 44-60
52
Figure 5. Maximum principal stress (1.75 x Nishi-Akashi)
Figure 6. Minimum principal stress (1.75 x Nishi-Akashi)

TWO-STOREY CONCRETE WALL-TYPE STRUCTURE
Copyright © 2012 Philippine Engineering Journal Phil. Eng’g. J. 2012; 33: 44-60
53
Figure 7. Crack locations (1.75 x Nishi-Akashi)
Figure 8. Maximum principal stress (1.27 x JMA)

F. J. GERMAR and B. M. PACHECO
Copyright © 2012 Philippine Engineering Journal Phil. Eng’g. J. 2012; 33: 44-60
54
Figure 9
Minimum Principal Stress (1.27 x JMA)
Figure 10 Crack locations (1.27 x JMA)
TWO-STOREY CONCRETE WALL-TYPE STRUCTURE
Copyright © 2012 Philippine Engineering Journal Phil. Eng’g. J. 2012; 33: 44-60
55
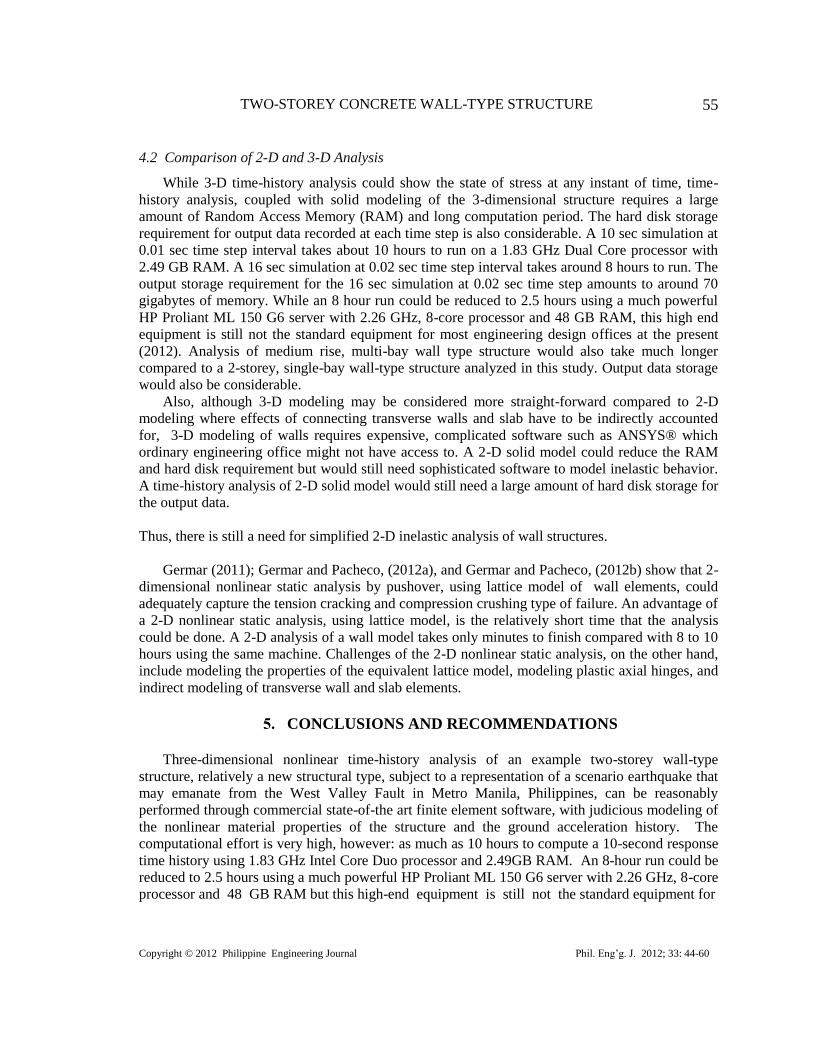
4.2 Comparison of 2-D and 3-D Analysis
While 3-D time-history analysis could show the state of stress at any instant of time, time-
history analysis, coupled with solid modeling of the 3-dimensional structure requires a large
amount of Random Access Memory (RAM) and long computation period. The hard disk storage
requirement for output data recorded at each time step is also considerable. A 10 sec simulation at
0.01 sec time step interval takes about 10 hours to run on a 1.83 GHz Dual Core processor with
2.49 GB RAM. A 16 sec simulation at 0.02 sec time step interval takes around 8 hours to run. The
output storage requirement for the 16 sec simulation at 0.02 sec time step amounts to around 70
gigabytes of memory. While an 8 hour run could be reduced to 2.5 hours using a much powerful
HP Proliant ML 150 G6 server with 2.26 GHz, 8-core processor and 48 GB RAM, this high end
equipment is still not the standard equipment for most engineering design offices at the present
(2012). Analysis of medium rise, multi-bay wall type structure would also take much longer
compared to a 2-storey, single-bay wall-type structure analyzed in this study. Output data storage
would also be considerable.
Also, although 3-D modeling may be considered more straight-forward compared to 2-D
modeling where effects of connecting transverse walls and slab have to be indirectly accounted
for, 3-D modeling of walls requires expensive, complicated software such as ANSYS® which
ordinary engineering office might not have access to. A 2-D solid model could reduce the RAM
and hard disk requirement but would still need sophisticated software to model inelastic behavior.
A time-history analysis of 2-D solid model would still need a large amount of hard disk storage for
the output data.
Thus, there is still a need for simplified 2-D inelastic analysis of wall structures.
Germar (2011); Germar and Pacheco, (2012a), and Germar and Pacheco, (2012b) show that 2-
dimensional nonlinear static analysis by pushover, using lattice model of wall elements, could
adequately capture the tension cracking and compression crushing type of failure. An advantage of
a 2-D nonlinear static analysis, using lattice model, is the relatively short time that the analysis
could be done. A 2-D analysis of a wall model takes only minutes to finish compared with 8 to 10
hours using the same machine. Challenges of the 2-D nonlinear static analysis, on the other hand,
include modeling the properties of the equivalent lattice model, modeling plastic axial hinges, and
indirect modeling of transverse wall and slab elements.
5. CONCLUSIONS AND RECOMMENDATIONS
Three-dimensional nonlinear time-history analysis of an example two-storey wall-type
structure, relatively a new structural type, subject to a representation of a scenario earthquake that
may emanate from the West Valley Fault in Metro Manila, Philippines, can be reasonably
performed through commercial state-of-the art finite element software, with judicious modeling of
the nonlinear material properties of the structure and the ground acceleration history. The
computational effort is very high, however: as much as 10 hours to compute a 10-second response
time history using 1.83 GHz Intel Core Duo processor and 2.49GB RAM. An 8-hour run could be
reduced to 2.5 hours using a much powerful HP Proliant ML 150 G6 server with 2.26 GHz, 8-core
processor and 48 GB RAM but this high-end equipment is still not the standard equipment for

F. J. GERMAR and B. M. PACHECO
Copyright © 2012 Philippine Engineering Journal Phil. Eng’g. J. 2012; 33: 44-60
56
most engineering design offices. The hard disk storage requirement for output data is also
considerable even for just a small structure as in this paper. The software commercially available
to engineering design offices are also typically less powerful. Hence there is still a continuing
need to develop simplified analytical tools. Germar(2011); Germar and Pacheco, (2012a), and
Germar and Pacheco, (2012b) show that 2-dimensional nonlinear static analysis by pushover,
using lattice model of wall elements, could adequately capture the tension cracking and
compression crushing type of failure.
For the time history in this study, the failure mode is governed by diagonal tension in the wall
piers. Compression mode failure is also shown to be not critical for the structure analyzed despite
the slenderness ratio of the wall reaching the Code-prescribed limits. Even with reduced concrete
strength, compression mode failure is still not critical. A practical significance of this finding is
that the Code requirement for buildings to have special boundary element details may need to be
re-assessed for low-rise bearing wall-type residential structures. Arguably, it may be simpler and
more effective to increase slightly the uniform steel reinforcement in all the walls of the structure
or at the vicinity of the openings than to make special details at designated boundary elements.
The simulation results also show the significance of frequency content of the earthquake
record. The effect of soil condition on the frequency is also acknowledged. It shall be noted that to
date (2012), selection of earthquake records for purposes of nonlinear time-history simulation is
not required to consider yet the effect of soil condition. Additional research on proper selection of
input earthquake ground motion is strongly recommended for future studies.
Acknowledgments
The first author wishes to thank the Department of Science and Technology- Engineering
Research and Development for Technology (DOST-ERDT) Project for the financial support for
this study. This paper is also a part of the Doctoral Dissertation of the first author under the
supervision of the second author.
REFERENCES
1. ANSYS. (2010). Analysis System Multiphysics Release 12.1.
2. Ansys, Inc. (2009). Theory Reference for the Mechanical APDL and Mechanical
Applicaitions. Philadelphia: Ansys.
3. Baetu, S., & Ciongradi, I.-P. (2011). Nonlinear Finite Element Analysis of Reinforced
Concrete Slit Walls with Ansys (I). Buletinul Institutuli Politehnic din Iasi.
4. Cheng, W., Sun, L.-M., Zhou, C., & Fan, L.-C. (2002). Realization of User Defined 2D
Smeared Elements and Material in Ansys for Reinforced Concrete. Seventh International
Symposium on Structural Engineering for Young Experts. Tianjin, China.
5. Germar, F. J. (2011). Nonlinear Static Analysis of Concrete Bearing-Wall TYpe, Low-Rise
Single-Family Dwelling Structures. Quezon City: University of the Philippines Diliman.
6. Germar, F. J., & Pacheco, B. M. (2012B). Lattice Model of Concrete Wall-Type Buildings
with Pushover Analysis: Comparisons with Experiment and Nonlinear Time-History Analysis.
7. Germar, F. J., & Pacheco, B. M. (2012A). Pushover Analysis of Squat-Type Concrete Wall
Using Lattice Model.

TWO-STOREY CONCRETE WALL-TYPE STRUCTURE
Copyright © 2012 Philippine Engineering Journal Phil. Eng’g. J. 2012; 33: 44-60
57
8. Greeshma, S., Jaya, K. P., & Annilet Sheeja, L. (2011). Analysis of Flanged Shear Wall Using
Ansys Concrete Model. International Journal of Civil and Structural Engineering , 2 (2), 454-
465.
9. Hsu, T. T. (1991). Nonlinear Analysis of Concrete Membrane Elements. ACI Structural
Journal , 88 (5), 552-561.
10. Hsu, T. T. (1996). Towards a Unified Nomenclature for Reinforced-Concrete Theory. ASCE
Journal of Structural Engineering , 122 (3), 275-283.
11. Hwang, S.-J., Fang, W.-H., Lee, H.-J., & Yu, H.-W. (2001, January). Analytical Model for
Predicting Shear Strength of Squat Walls. Journal of Structural Engineering, ASCE , 43-50.
12. JICA. (2004). Earthquake Impact Reduction Study for Metropolitan Manila, Republic of the
Philippines. Manila.
13. Manfredi, G., Polese, M., & Cosenza, E. (2003). Cumulative demand of the earthquake
ground motions in the near source. Earthquake Engineering and Structural Dynamics , 32,
1853-1865.
14. Mo, Y. L., & Rothert, H. (1997). Effect of Softening Models on Behavior of Reinforced
Concrete Framed Shearwalls. ACI Structural Journal , 94 (6), 730-744.
15. NSCP. (2010). National Structural Code of the Philippines - Buildings, Towers, and Other
Vertical Structures (6th ed., Vol. 1). Association of Structural Engineers of the Philippines.
16. Okamura, H., & Maekawa, K. (1991). Nonlinear Analysis and Constitutive Models of
Reinforced Concrete. Tokyo: Giho-do.
17. Pacific Earthquake Engineering Research Center. (n.d.). Retrieved 2010, from
http://peer.berkeley.edu\smcat
18. Palermo, D., & Vecchio, F. J. (2004). Compression Field Modeling of Reinforced Concrete
Subjected to Reversed Loading: Verification. ACI Structural Journal , 101 (2), 155-164.
19. Salem, H., & Maekawa, K. (2006). Computer-Aided Analysis of Concrete Using a Refined
Nonlinear Strut and Tie Model Approach. Journal of Advanced Concrete Technology , 4 (2),
325-336.
20. Seismosoft. (2010). SeismoSignal and SeismoSpect- Software for signal processing.
21. Wallace, J. W., & Moehle, J. P. (1992). Ductility and Detailing Requirements of Bearing Wall
Buildings. Journal of Structural Engineering, ASCE , 118 (6), 1625-1645.
22. Wood, S. L. (1992). Design of R/C Structural Walls: Balancing Toughness and Stiffness. In P.
Fajfar, & H. Krawinkler, Nonlinear Seismic Analysis and Design of Reinforced Concrete
Buildings (pp. 151-160). London and New York: Taylor and Francis.
23. Zhang, Q. (2004). Finite Element Application to Slab-column Connections Reinforced with
Glass-Fiber Reinforced Polymers. Memorial University of Newfoundland.

F. J. GERMAR and B. M. PACHECO
Copyright © 2012 Philippine Engineering Journal Phil. Eng’g. J. 2012; 33: 44-60
58
APPENDIX
Nishi-Akashi Record
Time [sec]
4038363432302826242220181614121086420
Accele
ratio
n [g]
0.4
0.2
0
-0.2
-0.4
Figure A.1 NIS000 acceleration record
Time [sec]
4035302520151050
Accele
ration [g]
0.3
0.2
0.1
0
-0.1
-0.2
-0.3
-0.4
-0.5
Figure A.2 NIS090 acceleration record
JMA Station Record
Time [sec]
4038363432302826242220181614121086420
Accele
ration [g]
0.6
0.4
0.2
0
-0.2
-0.4
-0.6
-0.8
Figure A.3 JMA000 Acceleration record

TWO-STOREY CONCRETE WALL-TYPE STRUCTURE
Copyright © 2012 Philippine Engineering Journal Phil. Eng’g. J. 2012; 33: 44-60
59
Time [sec]
4038363432302826242220181614121086420
Accele
ration [g]
0.6
0.5
0.4
0.3
0.2
0.1
0
-0.1
-0.2
-0.3
-0.4
Figure A.4 JMA090 Acceleration record
Response Spectra
NIS000_AT2.txt NIS090_AT2.txt Mean Spectrum
3.83.63.43.232.82.62.42.221.81.61.41.210.80.60.40.20
2.6
2.4
2.2
2
1.8
1.6
1.4
1.2
1
0.8
0.6
0.4
0.2
Figure A.5 Response spectra for Nishi-Akashi record
F. J. GERMAR and B. M. PACHECO
Copyright © 2012 Philippine Engineering Journal Phil. Eng’g. J. 2012; 33: 44-60
60
KJM000_AT2.txt KJM090_AT2.txt Mean Spectrum
3.83.63.43.232.82.62.42.221.81.61.41.210.80.60.40.20
2.4
2.2
2
1.8
1.6
1.4
1.2
1
0.8
0.6
0.4
0.2
Figure A.6 Response spectra for JMA station record