Embed Size (px)
Citation preview

Thurston 1
Climate Change Effects on the Rhizosphere: A Comparative Study of the Enzyme Activity of
Mycorrhizae in Heated and Unheated Forest Soils at Harvard Forest, Petersham MA
Alana Marie Thurston Haverford College
Haverford, PA 19041
Advisors: John Hobbie and Jerry Melillo Ecosystems Center, Marine Biological Laboratory
Woods Hole, MA 02543

Thurston 2
Abstract:
Climate change models predict that the annual average temperature could increase
up to 5° Celsius within the next century, which has serious implications for nutrient cycles,
gas fluxes, and species populations. Experiments carried out in the Prospect Hill and Barre
Woods soil plots in Harvard Forest have already shown that heating soils affects
mineralization rates, soil respiration, and tree growth, which led me to predict that heating
will also impact mycorrhizal relationships. I made measurements to see how heating would
affect the species abundance and diversity of soil fungi and also the enzymatic activity of
soil fungi. I identified and counted the fungi on root tips in a series of soil cores taken from
Barre Woods and also isolated these root tips to evaluate the enzymatic activity for
chitobiase, endopeptidase, phosphatase, and cellobiase. I observed a shift in the fungal
community in which there was an increase in the abundance of Russula and a decrease in
the abundance of Cortinarius in response to soil warming. Additionally, between these two
species, I saw that both had differences in enzymatic activity in endopeptidase and
cellobiase with higher activity observed in the control plots. The species shifts I observed
do not match those observed in tundra heating experiments at the LTER site in the Brooks
Range, Alaska, where there was a significant increase in Cortinarius over Russula. For the
Harvard Forest soil warming studies, I predict that if nutrient pools are depleted over time
due to the increased rates of soil processes that trends similar to those observed in Alaska
might surface.
Key Words: Mycorrhizae, Ectomycorrhizae, Enzyme Activity, Climate Change, Nutrient
cycling.

Thurston 3
Introduction: Mycorrhiza refers to the mutualistic relationship between fungi and plant roots. The
fungal hyphae form in a sheath around the roots, and the ends of the hyphae move out into
the surrounding soil. This enables the plant to take up a variety of nutrients, such as
phosphorus, nitrogen, zinc, sulfur, calcium, and potassium, better than plants without
mycorrhizal roots (Allen et al. 2003). These fungal hyphae also secrete enzymes that break
down organic material and thus increase the available nutrients in the ecosystem. In
return, the plant provides the fungi with photosynthetically derived carbohydrates
(Brundrett et al. 1996). These relationships can be extremely complex, especially because a
single host plant can form mycorrhizal associations with a variety of different fungal
species (Allen et al. 2003).
Studies of the interactions between host plants and soil fungi have identified seven
types of mycorrhizal relationships, each of which interacts with root tips in a unique
manner. Ectomycorrhizae are a type of mycorrhizae that characteristically form a
surrounding sheath around a root and forms a Hartig net, which is hyphae that have
penetrated into the root but remain between the root cells. This arrangement provides a
location where nutrient and carbon exchange can occur between the plant and fungi.
Ectomycorrhizae tend to form on fine root tips and closer to surface soil than in the mineral
layer (Brundrett et al. 1996).
Different species of ectomycorrhizae have different nutrient uptake capabilities,
abilities to break down organic material, and physical appearances. One characteristic that
has been used to categorize ectomycorrhizae is the distance the hyphae extend into the
soil. Some ectomycorrhizae, such as Russula, have only short hyphae and form a close-
contact relationship with an organic source. The ectomycorrhizae that do form hyphae can

Thurston 4
be classified as short-distance exploration, medium-distance fringe, mat, or smooth
exploration, and long-distance exploration (Agerer 2001).
While there is still much to learn about both the structure and function of mycorrhizal
hyphae, one proposed mode of function is that the hyphal tip produces a
mucopolysaccharide exudate that surrounds both the hyphal tip and organic particles. This
keeps secreted fungal enzymes from being lost into the soil and also keeps the hyphal tip in
contact with organic compounds produced by enzymatic action. Enzymes, such as
proteases, chitinases, and peroxidases, are released from the hyphal tip to break down
plant litter and large organic matter compounds into smaller ones, such as amino acids.
These smaller compounds can enter the hyphal tip and then be transported back to the
host plant (Hobbie and Hobbie 2008).
Three important enzymes that work to make either nitrogen or phosphorus available
are chitinases, endopeptidases, and phosphases. Chitin is an amide-sugar polysaccharide
that is found in many natural sources, including the cell walls of fungi and arthropod shells.
Chitinases act to break glycosidic bonds in chitin, which makes nitrogenous compounds
available (Cohen 1987). Similarly, endopeptidase is a protease that also makes nitrogen
available by breaking peptide bonds in amino acids. Phosphatases on the other hand
remove phosphate groups from organic compounds to make phosphorus available.
Another common enzyme found in soils is the cellulases, for example cellobiase, which
breaks cellulose into smaller polysaccharides.
The Harvard Forest soil warming experiment was initiated in 1991 and was
designed to test the response of soil processes under a 5° C increase in temperature. This
temperature was chosen because it is at the upper end of climate-change projections of a

Thurston 5
soil temperature rise of 2° to 5° C over the next century (Cox et al. 2000). Current research
in the Prospect Hill 6 by 6-meter plots has measured CO2, CH4, and N2O gaseous fluxes and
nitrogen mineralization to determine how heating will affect soil processes (Melillo et al.
1999). In 2003, another set of soil warming plots was established in Barre Woods, but
these plots were significantly larger, 30 by 30 meters. The size of these larger plots
captures entire tree and root systems, which has allowed research to focus on the effect of
soil warming on root processes and tree growth.
In both soil warming experiments, it was noted that heated plots had increased
nitrogen availability within the first few years of the project, but this increase has declined
steadily in recent years (Melillo et al. 2001, Burton et al. 2011). Additionally, in studying
root biomass in the large heated plots, researchers have found that while there has been an
increase in respiration rates of roots that there has been a substantial decrease in the fine
root biomass (Zhou et al. 2011). Specifically, it was estimated that over the course of a 7-
year study the fine root biomass in the top ten cm of soil decreased by 62%. The current
hypothesis for this observation is that because soil warming has increased nitrogen
availability in soils, trees are not allocating as much carbon and energy into forming fine
roots for nitrogen acquisition (Melillo et al. 2011).
Decreasing fine root biomass could be correlated to changes in soil fungi species
diversity and abundance, as it may not be energetically favorable for plants to form
mutualistic relationships with certain species of fungi if there are excess nitrogen and
nutrients readily available in the ecosystem. This could have further implications on the
enzymatic activity in the soil, as fungi secrete enzymes to break down organic molecules so
that plants can take them up.

Thurston 6
In my project, I tested the hypothesis that there would be a shift in soil fungi
communities between the heated and control soil plots. While I was not able to perform
DNA sequencing analysis of soil fungi in Barre Woods, I was able to microscopically identify
some fungal lineages by looking at photographs of DNA-identified root tip hyphae from
chronic nitrogen addition plots at Harvard Forest. Additionally, I analyzed the potential
enzymatic activity of both the soil and the root tips for chitobiase, endopeptidase,
phosphatase, and cellobiase through the use of fluorogenic substrates to determine if soil
heating has implications for the activity levels of the fungal and microbial community.
Methods: Field Sampling:
Barre Woods contains two 30 by 30 meter experimental plots that contain nine
different species of trees, including black birch (Betula lenta), red oak (Quercus rubra),
white ash (Fraxinus americana), and red maple (Acer rubrum) (Melillo et al. 2011). One
plot has been heated 5° C above ambient temperature since 2003, which was achieved by
embedding wires beneath the surface of the soil, while the other is an undisturbed control
plot. Within these larger plots, a series of smaller subplots had been established. I selected
four subplots in the heated and control plots to sample; two that contained Betula lenta and
two that contained Quercus rubra. I excluded any plots that were in close proximity to Acer
rubrum, as these trees are known to have arbuscular mycorrhizae and not
ectomycorrhizae. In each subplot, I collected two soil cores that were five cm in diameter
and 15 cm deep and as close to the base of the tree of interest as possible, <15 cm away, in
an attempt to ensure that the roots collected would be from the species I identified.

Thurston 7
In addition to collecting soil cores, I photographed and collected nine mushrooms
that were present within the plots (Image 2).
Laboratory Analysis: Core Analysis:
The soil cores and mushroom samples were stored on ice and transported back to
Woods Hole. Upon returning to the lab, I separated the undecomposed organic material
into soil, root, and debris portions. Tree bark, branches, and leaves were considered to be
debris. I separated the soil cores by hand and not through a mesh sieve, so that I did not
damage the root tips. Approximately one hour was spent sifting through each core, after
which the soil, root, and debris portions were weighed and recorded. Soil and roots were
stored in the refrigerator in plastic bags with a damp paper towel to ensure that the
samples did not dry out and that the roots would remain healthy.
Root Tip Identification:
The root portion of the soil cores were further separated by mycorrhizae type
through a visual comparison between the appearance of the root tips and images taken by
Jesse Sadowsky of fungi from the Harvard Forest chronic nitrogen addition plots that had
been identified through genetic sequencing (Sadowsky and Frey 2014). Even with guidance
from these images, I only felt comfortable distinguishing between Russula, Cortinarius,
Tomentella, and Cenococcum. After I had made my species identifications, I photographed
examples of each root tip and sent them to Jesse Sadowsky for confirmation.
In addition to separating the roots tips by species, I made counts for each species
based on the number of root tips observed. Roots were stored in Petri dishes with a moist
paper towel in the refrigerator.

Thurston 8
Enzyme Activity of Root Tips: For my study of mycorrhizal enzyme activity, I adapted methods of Pritsch et al.
(2011) and Higgins and Cohen (2012). The resulting protocol optimized conditions for the
enzyme assays.
Roots were thoroughly cleaned and the root tips with previously identified
mycorrhizae were severed with a scalpel so that all root tips were approximately the size of
a single Cenococcum root tip, 0.5 to 2 mm long. Because there were not enough root tips to
run separate analysis on the Betula lenta and Quercus rubra plots, root tips from the two
treatments were combined.
A total of ten root tips for each species from both plots were tested for enzymatic
activity. Each root tip was placed into an individual well on a 96-microwell plate with 150
μL of deionized water. Two of these root tips were reserved as deionized water controls,
while the other eight were tested for the enzymatic activity of chitobiase, endopeptidase,
phosphatase, and cellobiase in replicate. Different substrates were used to test the activity
of each enzyme: MUF-N-acetyl-D-glucosaminide for chitobiase, a chitinase; MUF-phosphate
for phosphatase; L-Leucine-7-amido-4-methylcoumarin HCl for endopeptidase; and MUF-
D-glucoside for cellobiase, a cellulase. I added 50 μL of an enzyme substrate to the
corresponding well and inserted the plate into a Biotek reader. The plate was set to a shake
cycle so that the plate would shake for four minutes and a reading of fluorescence would be
performed every fifth minute for a total of 30 minutes. Plates were read at wavelengths of
364 nm excitation and 445 nm emission.
Because this assay yielded overflowing fluorescence response from some of the
more active root tips, I set up a second run for enzyme activity that used less enzyme

Thurston 9
substrate, only 25 μL. For the second run, the plates were read every minute for the first six
minutes for fluorescence, and after that they were only ready once every five minutes for a
total of 30 minutes.
For both experiments, 0.01, 0.05, 0.1, 0.3, 0.4, and 0.5 μM of MUF substrate was
added to a series of wells to create a standard curve. Additionally, enzyme substrates and
deionized water were added as controls.
To analyze the data, the absorbance of deionized water was subtracted from all of
the experimental wells and the absorbance of enzyme substrate was subtracted from their
respective wells. After deriving an equation from the standard curve (R2=0.94342), the
absorbance of each well was entered into the equation to calculate potential enzyme
activity. I adjusted the activity to account for differences in surface area of the root tips by
photographing subsamples of each root tip type using an Axio View microscope and
measuring the length and width of each root tip. I estimated surface area based on the
equation for surface area of a rectangular prism, in which I assumed that the width and the
height were the same for all species except Cortinarius, which was very thin. For
Cortinarius, I set the height equal to 0.05 mm. I divided the enzymatic activity by the
average surface area of each species of root tip to determine the activity per mm2 of root tip
(Image 1).
Soil Potential Enzyme Activity:
I also sieved the soil portion of each core through a 1.00 mm mesh screen to ensure
that all root had been separated from the sample. Because the fluorometer can only make
measurements on liquid samples, I followed Yangtsho Gyaltshen’s (2013) procedure for
making soil slurries. To do this, I collected 0.5 g of the sifted soil and transferred it to a 50

Thurston 10
mL Falcon tube with 25 mL of deionized water. To test for enzymatic activity, I scaled up
the procedure written by Joseph Vallino (SES Microbial Ecology Course, unpublished) for
microbial methods. After the soil slurries had been shaken and well mixed, four mL of
liquid sample was transferred into four 15 mL Falcon tubes. To each set of four tubes, 400
μL substrate of enzyme substrate – to test chitobiase, endopeptidase, phosphatase, and
cellobiase – was added, and the tubes were vortexed and stored in the dark.
While the samples were incubating, I prepared borosilicate tubes for each Falcon
tube with four mL of 200 uM glycine buffer (10.5 pH). After one hour, 1.5 mL of enzyme-
sample solution was transferred from the incubation tube to a microcentrifuge tube. Each
sample was centrifuged for two minutes to ensure that all sediment particles were
separated from the liquid portion. From these tubes, one mL of liquid was transferred to
the borosilicate tubes to stop the reaction. This was repeated again four hours after the
enzyme substrate was initially added, and both time points were read on a fluorometer.
I made a standard curve by reading the fluorescence of MUF substrate at 0, 0.1, and
one μM (R2=0.99993), and I used this equation to convert absorbance to concentration.
Standard error was calculated so that error bars could be added to the bar graph.
Isotope Analysis of Mushrooms:
Out of the nine mushrooms initially collected from Barre Woods, only eight had
enough biomass in the cap to run for isotope analysis. I separated the mushroom cap from
the stalk, and placed them each in a 20 mL glass scintillation vial in the drying oven
overnight. After they had been thoroughly dried, I ground them using a mortar and pestle
and between 2.7 and 3.4 mg of each sample was run for δ13C and δ15N analysis on the mass
spectrometer in the Ecosystems Center, Woods Hole.

Thurston 11
Phosphorus Content of Harvard Forest Leaf Samples: Leaf samples taken in 2012 and 2013 from the three species of trees that are most
abundant in Harvard Forest plots – Acer rubrum, Quercus rubra, and Fraxinus americana –
were analyzed for both total and inorganic phosphorus content. A modification of the
method of Murphy and Riley (1962) was used to analyze the samples. Approximately 0.1
gram of dried, ground sample was added to 20 mL glass scintillation vials. For the samples
that were being analyzed for total phosphorus content, 0.5 mL of 50% w/v Mg(NO3)2 was
added to each vial and they were allowed to ash for two hours at 550° C. After the total
phosphorus samples had cooled, ten mL of 1N HCl was added to both the total and
inorganic phosphorus samples and they were placed on a shaker for 16 hours. Total
phosphorus samples were diluted 30:1 with deionized water, while the inorganic
phosphorus samples were diluted 20:1 so that each borosilicate tube had a total of three
mL of sample. To each vial, 0.3 mL of PO43- was added, and samples were allowed to
incubate for 30 minutes in the dark to develop. After color had developed in the tubes,
absorbance was measured at 885 nm on a spectrophotometer.
I made a standard curve with 0, 0.5, 2.5, 5, 10, 15, 25 μM PO43- in 1 N HCl
(R2=0.99896) to convert from absorbance to concentration.
Results: Core Contents:
For the control and heated plots, the shift between soil, root, and debris content of
the cores was graphed as percent composition. While the data suggested that there was an
increase in the soil content in the heated cores and a decrease in both the roots and debris,
the standard deviation was too large to determine if these shifts were significant (Figure 1).
Thurston 12
The distribution of core elements was also broken down between the Betula lenta
and Quercus rubra sites. On a species to species basis, the Betula lenta plots had the same
high standard deviation as previously observed. The Quercus rubra sites on the other hand
had lower standard deviation and showed a 7% increase in soil mass and a 2.4% decrease
in root biomass in the heated plots (Figure 2).
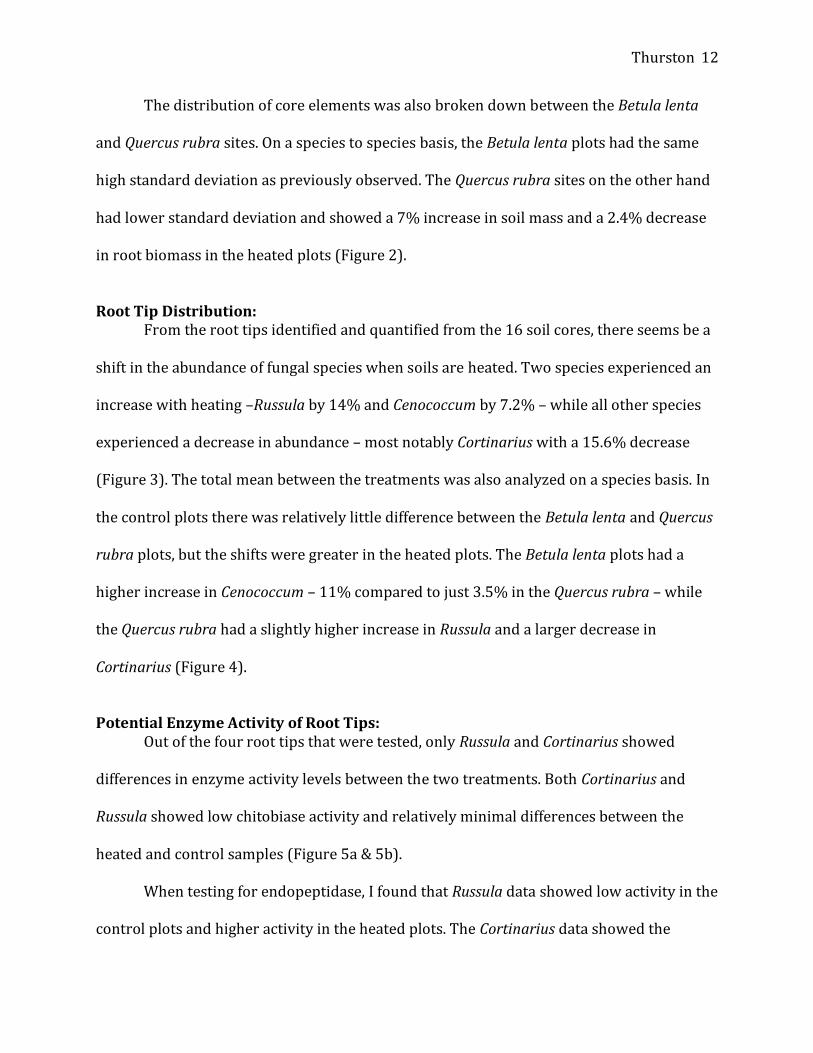
Root Tip Distribution:
From the root tips identified and quantified from the 16 soil cores, there seems be a
shift in the abundance of fungal species when soils are heated. Two species experienced an
increase with heating –Russula by 14% and Cenococcum by 7.2% – while all other species
experienced a decrease in abundance – most notably Cortinarius with a 15.6% decrease
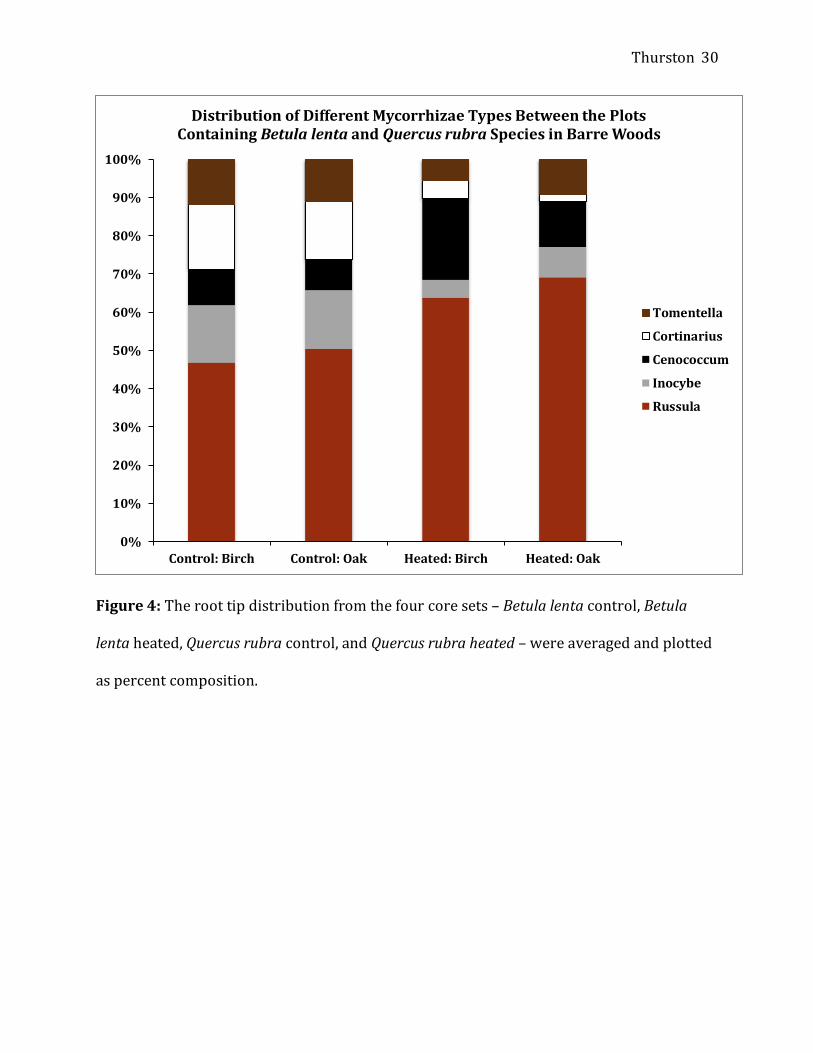
(Figure 3). The total mean between the treatments was also analyzed on a species basis. In
the control plots there was relatively little difference between the Betula lenta and Quercus
rubra plots, but the shifts were greater in the heated plots. The Betula lenta plots had a
higher increase in Cenococcum – 11% compared to just 3.5% in the Quercus rubra – while
the Quercus rubra had a slightly higher increase in Russula and a larger decrease in
Cortinarius (Figure 4).
Potential Enzyme Activity of Root Tips:
Out of the four root tips that were tested, only Russula and Cortinarius showed
differences in enzyme activity levels between the two treatments. Both Cortinarius and
Russula showed low chitobiase activity and relatively minimal differences between the
heated and control samples (Figure 5a & 5b).
When testing for endopeptidase, I found that Russula data showed low activity in the
control plots and higher activity in the heated plots. The Cortinarius data showed the

Thurston 13
opposite trend, although even in the heated plots there was high activity. In comparing the
Russula and Cortinarius activity rates for endopeptidase, the Cortinarius overall had higher
activity (Figure 5c & 5d).
Cortinarius samples also showed similar trends in the phosphatase activity, where
the activity rates were higher than that of the Russula (Figure 5e & 5f). For both species,
there was a slight increase in activity in the heated plots.
Both Russula and Cortinarius had higher cellobiase activity in the control plots, more
than three times the activity rate of the heated plots. As seen in the other activity
measurements, there was higher overall activity in the Cortinarius (Figure 5g & 5h).
Soil Enzyme Activity:
Out of the four enzymes that were being tested, phosphatase had the highest activity
and endopeptidase had the lowest. For these two enzymes, there was no difference in the
activity rates between the two treatments. While both chitobiase and cellobiase had
roughly half the activity of phosphatase, they showed differences in the activity between
the heated and control plots. For chitobiase, the heated plots had higher activity, while for
cellobiase the control plots had higher activity (Figure 6).
Isotope Analysis of Mushroom Caps:
Five out of the eight samples collected had a δ13C of ~-28 and a δ15N of ~12 while
the remaining samples were much lower with a δ13C of ~-23 and a δ15N of ~1.5 (Table 1).
Despite these differences, there was no apparent trend between the heated and control
plots and I was not able to draw any conclusions.

Thurston 14
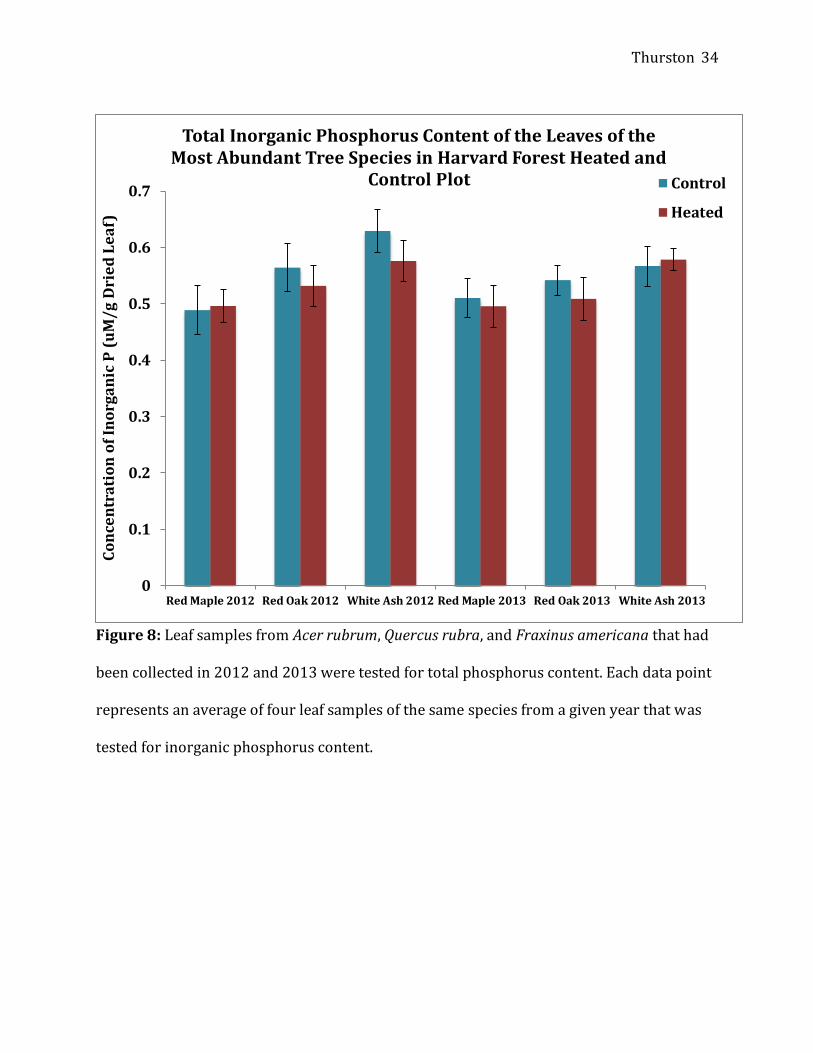
Phosphorus Analysis of Harvard Forest Leaf Samples: The total phosphorus concentration was observed to be slightly higher in control
plots, with the exception of Quercus rubra in 2012 (Figure 7). The inorganic phosphorus
analysis reflected the same trend, in which there was higher inorganic phosphorus content
in all samples, except Fraxinus americana in 2013, which consequently indicated that the
heated plots had a higher proportion of organic phosphorus (Figure 8). In general, the
Fraxinus americana had higher phosphorus concentrations than the other two species.
While this trend was seen across an annual and species basis, due to overlapping of
error bars it is difficult to determine if this trend is significant.
Discussion: The difference I observed in enzymatic activity between the heated and control
plots suggests that warming of soils does impact the production of enzymes by soil fungi.
The decrease in endopeptidase activity in the heated samples, most prominently seen in
Cortinarius samples, may be attributed to the effect heating has on net nitrogen
mineralization rates. Previous studies have shown that heating soils 5° C above ambient
temperature has resulted in a 45% increase in the average net mineralization rate (Butler
et al. 2012). The increase in net mineralization would result in increased nitrogen
availability to plants. Increased nitrogen availability may decrease both fine root biomass
and the amount of mycorrhizae and could also decrease the production of enzymes related
to the breakdown of nitrogenous compounds by fungi. Because enzymes are energetically
expensive to produce, if there are nutrients readily available to the plants, the fungi may
not expend resources to make endopeptidase.
Similarly, soil warming has been shown to increase the decomposition rate of
woody debris. A 2-year study showed that soil warming increased the mass loss of woody
Thurston 15
debris by as much as 30%, but that lignin degradation did not follow the same mass loss
trend (Berbeco et al. 2012). Thus, soil warming appears to deplete labile rich carbon
sources, which consequently increases the proportion of lignin. This would explain the
trend I observed in both the Russula and Cortinarius data, in which the control plots had
higher activity rates than their heated counterparts. The heated plots may have lower
cellobiase activity rates because there is an overall decrease in the amount of cellulose and
woody biomass present in the soil, and so there may be a shift in enzyme production in
which cellulases are less active and enzymes that act on lignified compounds may be more
active.
Further studies could test this hypothesis by measuring chemical soil fractionations
with hot water and strong acids to quantify the starches, cellulose, and lignified carbon
pools (Ryan et al. 1990). Additionally, while my data from core separation showed that the
heated plots had increased soil mass and a decrease in both root and woody debris, the
standard deviation was so high that it cannot be determined if this is a significant trend. By
taking more replicates between the plots it would be possible to see if this trend is upheld,
which would also have implications on the decomposition rate of woody biomass.
The trends that I found for both endopeptidase and cellobiase on the root tips are
supported by the trends in enzyme activity that I observed in the soil. By measuring the
enzymatic activity of the root tips, I was focusing on the activity of the fungi, whereas the
enzymatic activity of the soil represents the activity of both the fungi and soil bacteria.
Previous findings from Harvard Forest show that soil warming increases nitrogen
mineralization; therefore the increase in chitobiase activity in the soil may be a reflection of
the increased activity of soil microbes (Melillo et al. 1999).
Thurston 16
For cellobiase activity in both the root tips and the soil, it was found that the control
plots have higher activity than that in the warming plots. These findings, like the enzyme
data for the root tips, suggests that over the ten years that the Barre Woods experiments
have been running, the labile carbon of the organic matter in the soil has become depleted.
Because I had observed slightly lower phosphatase activity in the heated plots, I
thought this might suggest that there was increased organic phosphorus available in the
heated plots. To test this hypothesis, I measured the total and inorganic phosphorus
content of leaves from the three most abundant species observed in the Harvard Forest
warming experiment. My hypothesis was not supported, and I observed that the leaves
from the heated plots were instead slightly nitrogen depleted. However, due to the large
standard deviation and small sample size, it is likely that there was no significant
difference. This indicates that perhaps there is no difference in phosphatase activity
between the heated and control plot, or if there is increased phosphate availability in the
heated plots, that it is coming from a different source or input to the system.
I observed consistent differences in cellobiase activity, which I thought could lead to
shifts in the δ15N, which may be observed in mushrooms. In general, over time there are
shifts to greater δ15N soil content, as it is a heavier isotope; consequently soil fungi and
microbes more readily take up amino acids and compounds with 14N. In the heated plots
where there is an increase in net mineralization and organic matter decomposition, there is
an increase in the uptake of nitrogenous compounds by trees, which leads to higher growth
rates (Butler et al. 2011). The increase in nitrogen uptake has the potential to cause the
roots and fungi in the heated plots to leave more compounds with a high δ15N content and
thus increase the 15N content of the control plots. If this process were present, then it might

Thurston 17
be observed in the fruiting bodies of the mushrooms. However, the mushroom caps
collected from Barre Woods did not show this trend.
There was no significant change in δ15N across treatments and differences in δ15N
instead seemed to be more a function of the mushroom species. I think that this experiment
may have failed to generate a trend in part due to the extremely small sample size and the
fact that I was not able to collect species replicates between the two plots. There is also a
possibility that the Cortinarius fruiting bodies have a much higher δ15N than those of the
Russula (Hobbie and Agerer 2010). If this experiment were to be carried out again in Barre
Woods, I would suggest that mushroom samples be collected throughout the year and that
there be a focus to identify species that are present in both plots.
While Cortinarius on the root tips showed higher enzyme activity, there was an
overall decrease in Cortinarius abundance in the heated plots in comparison to Russula. The
average length of Cortinarius that I measured was 7.57 mm while the average length of
Russula was only 1.99 mm. The difference in fungi size on the root tip may be an indication
that Cortinarius are more carbon expensive than Russula, and while they appear to have
much higher activity rates, that they may be energetically unfavorable to sustain in the
heated plots due to the increased accessibility of nutrients.
The fungal species shift I observed in Barre Woods was different from that of the
Alaskan heated plots. These plots favored species like Cortinarius, which form rhizomorphs
and relatively long hyphae; these are categorized as medium fringe exploration types
(Deslippe et al. 2010). This difference may be explained by the fact that the tundra is a
more nitrogen-limited system than Harvard Forest. Thus by heating the Alaskan soils it is
possible that increased mineralization rates and nitrogen uptake by plants may have

Thurston 18
caused the heated experimental plots to become even more nitrogen depleted than the
control plots. If this is the case, then plants may be investing in Cortinarius because while it
is more carbon expensive, it has the potential to explore further in the soil to access less
recalcitrant material. With this Alaskan example in mind, the Barre Woods may not be
showing this trend because there is still an abundance of available organic material.
However if over time the mineralization and decomposition rates remain high, these
resources may too become depleted and a similar shift in soil fungi could be observed. I
think it would be useful for subsequent experiments to monitor soil fungi abundance over
time, especially in regard to how nutrient cycles and concentrations change, to see if this
trend presents itself.

Thurston 19
Acknowledgments: I would like to thank my mentors, John Hobbie and Jerry Melillo, for both their
continual guidance throughout my project and also the knowledge that they shared with
me pertaining to fungi and enzymatic activity. This project could not have happened
without support from Fangyuan Hong, Fiona Jevon, William Werner, and Michael Bernard
for working with me to identify potential plots to sample and also aiding me in collecting
my cores. Both Will and Mike also provided me with supplemental data taken from Barre
Woods involving soil respiration and nitrogen mineralization and also worked with me to
edit my presentation, for which I am incredibly thankful. I also received help from
numerous people from the Ecosystem Center – Elena Lopez Peredo who took the time to
teach me how to use the Biotek reader, Joseph Vallino for providing me with enzyme assay
protocols and showing me how to operate the fluorometer, Marshall Otter who ran the
carbon and nitrogen isotopes for my mushroom samples, Emily Reddington for allowing
me to borrow an 8-channel micropipette, and JC Weber who helped me photograph my
root tips. Our teaching assistants – Rich McHorney, Fiona Jevon, Tyler Messerschmidt, and
Nick Barrett – who have been instrumental throughout the semester, also provided me
with support throughout the project period, especially Nick who worked with me on all of
my enzyme assays. Finally, I would like to thank Jesse Sadowsky from the University of
New Hampshire who provided me with enzyme activity methods for root tips, confirmed
the identifications, and also answered any questions I had throughout this process.

Thurston 20
References: Agerer R. 2001. Exploration types of ectomycorrhizae: A proposal to classify
ectomycorrhizal mycelial systems according to their patterns of differentiation and
putative ecological importance. Mycorrhiza; 11:107-114.
Allen M.F., Swenson W., Querejeta J.I., Egerton-Warburton L.M.m and Treseder K.K. 2003.
Ecology of mycorrhizae: A conceptual framework for complex interactions among
plants and fungi. Ann. Rev. Phytopathol. 41:271-303.
Berbeco M. R., Melillo J. M., and Orians C. M. 2012. Soil warming differentially accelerates
decomposition of woody debris. Plant and Soil 356: 405-417.
Burton A, Melillo J, Frey S. 2011. Root and mycorrhizal respiration at Harvard Forest soil
warming experiments since 2007. Harvard Forest Data Archive: HF171.
Butler S. M., Melillo J. M., Johnson J. E., Mohan J. E., Steudler P. A., Lux H., Burrows R., Smith
R. M., Vario C. L., Scott L., Hill T. D., Aponte N., and Bowles F. P. 2001. Soil warming
alters nitrogen cycling in a New England forest: implications for ecosystem function
and structure. Oecologia: DOI 10.007/s00442-011-2133-7.
Brundrett M., Bougher N., Dell B., Grove T., and Malajczuk N. 1995. Working with
mycorrhizas in forestry and agriculture. Canberra, ACT: Austrailian Centre for
International Agricultural Research, 1996. Print.

Thurston 21
Cohen E. 1987. Chitin biochemistry: Synthesis and inhibition. Ann. Rev. Entomol; 32:71-93.
Cox P.M., Betts R.A., Jones C.D., Spall S.A., and Totterdell I.J. 2000. Acceleration of global
warming due to carbon-cycle feedbacks in a coupled climate model. Nature; 408:
184-187
Deslippe J.R., Hartmann M., Mohn W.W., and Simard S.W. 2010. Long-term experimental
manipulation of climate alters the ectomycorrhizal community of Betula nana in
Arctic tundra. Global Change Biology, doi: 10.1111/j.1365-2486.2010.02318.x
Gyaltshen Y. 2013. A comparative study on the nutrient acquisition strategies of
arbuscular mycorrhizal and ectomycorrhizal-dominated tree stands at Harvard
Forest, Petersham MA. SES at MBL Woods Hole, MA.
Higgins L. and Cohen H. 2012. Profiling enzymatic activity of ectomycorrhizal root tips
using fluorogenic substrates(β-glucosidase (BG), N-acetyl-β-D-glucosaminidase
(NAG), acid phosphotase (AP), and leucine aminopeptidase (LAP)). Lewis & Clark
University.
Hobbie E.A. and Agerer R. 2010. Nitrogen isotopes in ectomycorrhizal sporocarps
correspond to belowground exploration types. Plant and Soil; 327:71-83.

Thurston 22
Hobbie E. A. and J. E. Hobbie 2008. Natural abundance of 15N in nitrogen-limited forests
and tundra can estimate nitrogen cycling through mycorrhizal fungi: A review.
Ecosystems; 11:815-830.
Melillo J.M., Steudler P, Mohan J. 1999. Prospect Hill soil warming experiment at Harvard
Forest since 1991. Harvard Forest Data Archive: HF005.
Melillo J.M., Butler S., Johnson J., Mohan J., Steudler P., Lux H., Burrows E., Bowles F., Smith
R., Scott L., Vario C., Hill T., Burton A., Zhou Y., and Tang J. 2011. Soil warming,
carbon-nitrogen interactions, and forest carbon budgets. Proc Natl Acad Sci U S A;
108(23): 9508-9512
Melillo J., Steudler P., Mohan J. 2003. Barre Woods soil warming experiment at Harvard
Forest since 2001. Harvard Forest Data Archive: HF018.
Murphy J., and Riley J. P. 1962. A modified single solution method for the determination of
phosphate in natural waters. Anal. Chim. Acta. 27(1962) 31-36.
Pritsch K., Courty P. E., Churin J., Cloutier-Hurteau B., Ali M. A., Damon C., Duchemin M., Egli
S., Ernst J., Fraissinet-Tachet L., Kuhar F., Legname E., Marmeisse R., Müller A.,
Nikolova P., Peter M., Plassard C., Richard F., Schloter M., Selosse M., Franc A., and
Garbaye J. 2011. Optimized assay and storage conditions for enzyme activity
profiling of ectomycorrhizae. Mycorrhiza (2011) 21:589-600.

Thurston 23
Ryan M.G., Melillo J.M., and Ricca A. 1990. A comparison of methods for determining
proximate carbon fractions of forest litter. Canadian Journal of Forest Research
20:166-171, doi: 10.1139/x90-023
Sadowsky J. and Frey S. 2014. Repertoire of secreted enzymes underlies a shift in
abundance of ectomycorrhizal fungal lineages due to long-term nitrogen
enrichment. Unpublished manuscript.
Vallino J. 2014. Ecto- and extracellular enzyme activity. SES at MBL Woods Hole, MA.
Zhou Y., Tang J., Melillo J., Butler S., and Mohan J. 2011. Root standing crop and chemistry
after six years of soil warming in a temperate forest. Tree Physiology 31(7):707-717,
doi:10.1093/treephys/tpr066
Thurston 24
Figures, Tables and Images:
Figure 1: Soil sores were separated into soil, root, and debris portions. These portions were
weighed and percent content of each core was determined. All eight cores from each
treatment plot were averaged to show the shift in core content.
Figure 2: The soil core distribution from the four core sets – Betula lenta control, Betula
lenta heated, Quercus rubra control, and Quercus rubra heated – were averaged and plotted
as percent composition.
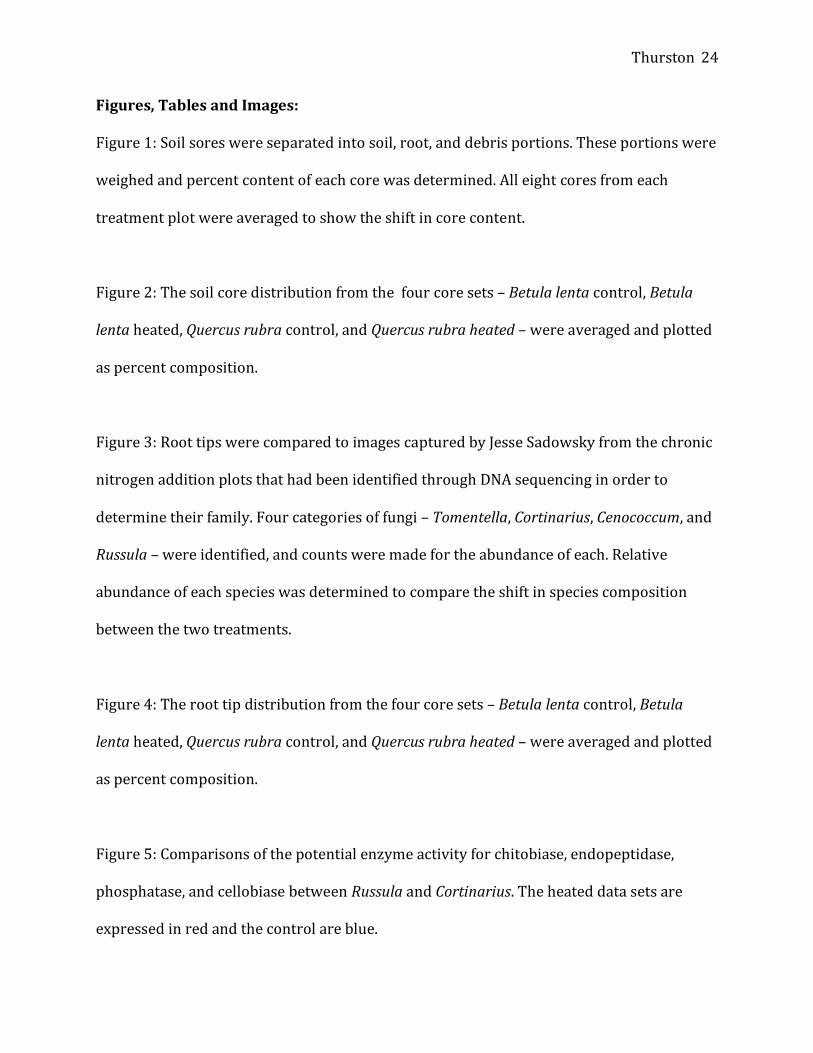
Figure 3: Root tips were compared to images captured by Jesse Sadowsky from the chronic
nitrogen addition plots that had been identified through DNA sequencing in order to
determine their family. Four categories of fungi – Tomentella, Cortinarius, Cenococcum, and
Russula – were identified, and counts were made for the abundance of each. Relative
abundance of each species was determined to compare the shift in species composition
between the two treatments.
Figure 4: The root tip distribution from the four core sets – Betula lenta control, Betula
lenta heated, Quercus rubra control, and Quercus rubra heated – were averaged and plotted
as percent composition.
Figure 5: Comparisons of the potential enzyme activity for chitobiase, endopeptidase,
phosphatase, and cellobiase between Russula and Cortinarius. The heated data sets are
expressed in red and the control are blue.
Thurston 25
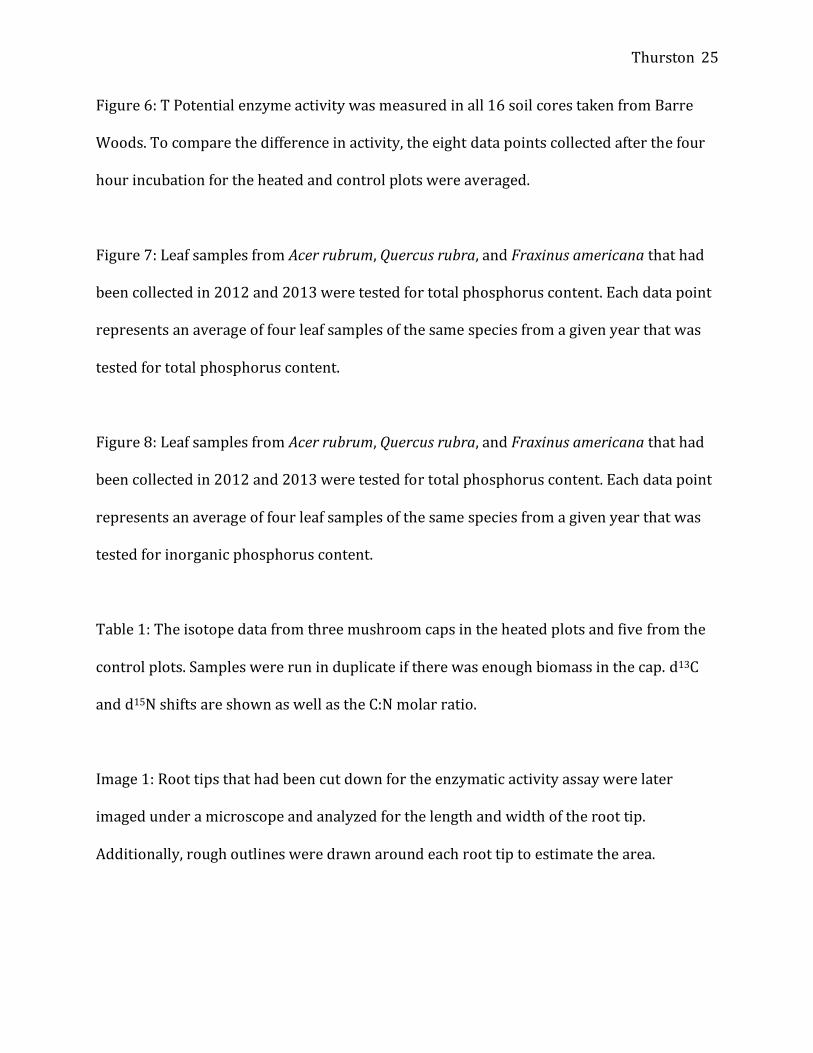
Figure 6: T Potential enzyme activity was measured in all 16 soil cores taken from Barre
Woods. To compare the difference in activity, the eight data points collected after the four
hour incubation for the heated and control plots were averaged.
Figure 7: Leaf samples from Acer rubrum, Quercus rubra, and Fraxinus americana that had
been collected in 2012 and 2013 were tested for total phosphorus content. Each data point
represents an average of four leaf samples of the same species from a given year that was
tested for total phosphorus content.
Figure 8: Leaf samples from Acer rubrum, Quercus rubra, and Fraxinus americana that had
been collected in 2012 and 2013 were tested for total phosphorus content. Each data point
represents an average of four leaf samples of the same species from a given year that was
tested for inorganic phosphorus content.
Table 1: The isotope data from three mushroom caps in the heated plots and five from the
control plots. Samples were run in duplicate if there was enough biomass in the cap. d13C
and d15N shifts are shown as well as the C:N molar ratio.
Image 1: Root tips that had been cut down for the enzymatic activity assay were later
imaged under a microscope and analyzed for the length and width of the root tip.
Additionally, rough outlines were drawn around each root tip to estimate the area.

Thurston 26
Image 2: The mushrooms collected from Barre Woods. No species identifications were
made, but images were taken of each mushroom collected. The photographs with blue
notation in the upper right corner are from the control plots, while those with red notation
on the upper left corner are from the heated plots.

Thurston 27
Figure 1: Soil sores were separated into soil, root, and debris portions. These portions
were weighed and percent content of each core was determined. All eight cores from each
treatment plot were averaged to show the shift in core content.
75%
80%
85%
90%
95%
100%
105%
110%
Control Heated
Differences in the Distribution of Core Elements Between the Heated and Control Plots in Barre Woods
Debris
Roots
Soil

Thurston 28
Figure 2: The soil core distribution from the four core sets – Betula lenta control, Betula
lenta heated, Quercus rubra control, and Quercus rubra heated – were averaged and plotted
as percent composition.
75%
80%
85%
90%
95%
100%
105%
110%
Control: Birch Control: Oak Heated: Birch Heated: Oak
Differences in the Distribution of Core Elements Between Heated and Control Plots Containing Betula lenta and
Quercus rubra Species in Barre Woods
Debris
Roots
Soil

Thurston 29
Figure 3: Root tips were compared to images captured by Jesse Sadowsky from the chronic
nitrogen addition plots that had been identified through DNA sequencing in order to
determine their family. Four categories of fungi – Tomentella, Cortinarius, Cenococcum, and
Russula – were identified, and counts were made for the abundance of each. Relative
abundance of each species was determined to compare the shift in species composition
between the two treatments.
0%
10%
20%
30%
40%
50%
60%
70%
80%
90%
100%
Control Heated
Distribution of Different Mycorrhizae Types Between the Heated and Control Plots in Barre Woods
Tomentella
Cortinarius
Cenococcum
Inocybe
Russula
Thurston 30
Figure 4: The root tip distribution from the four core sets – Betula lenta control, Betula
lenta heated, Quercus rubra control, and Quercus rubra heated – were averaged and plotted
as percent composition.
0%
10%
20%
30%
40%
50%
60%
70%
80%
90%
100%
Control: Birch Control: Oak Heated: Birch Heated: Oak
Distribution of Different Mycorrhizae Types Between the Plots Containing Betula lenta and Quercus rubra Species in Barre Woods
Tomentella
Cortinarius
Cenococcum
Inocybe
Russula

Thurston 31
Figure 5: Comparisons of the potential enzyme activity for chitobiase, endopeptidase,
phosphatase, and cellobiase between Russula and Cortinarius. The heated data sets are
expressed in red and the control are blue.

Thurston 32
Figure 6: Potential enzyme activity was measured in all 16 soil cores taken from Barre
Woods. To compare the difference in activity, the eight data points collected after the four
hour incubation for the heated and control plots were averaged.
0
0.5
1
1.5
2
2.5
3
Chitobiase Endopeptidase Phosphatase Cellobiase
En
zym
ati
c A
ctiv
ity
pe
r g
ram
So
il
Enzymatic Activity of Soil from Barre Woods Heated and Control Plots
Heated
Control

Thurston 33
Figure 7: Leaf samples from Acer rubrum, Quercus rubra, and Fraxinus americana that had
been collected in 2012 and 2013 were tested for total phosphorus content. Each data point
represents an average of four leaf samples of the same species from a given year that was
tested for total phosphorus content.
0.000
0.005
0.010
0.015
0.020
0.025
0.030
0.035
0.040
0.045
Red Maple2012
Red Oak2012
White Ash2012
Red Maple2013
Red Oak2013
White Ash2013
Co
nce
ntr
aio
n o
f P
(u
M/g
dri
ed
le
af)
Total Phosphorus Content of the Leaves of the Most
Abundant Tree Species in Harvard Forest Heated and Control Plots
Control
Heated
Thurston 34
Figure 8: Leaf samples from Acer rubrum, Quercus rubra, and Fraxinus americana that had
been collected in 2012 and 2013 were tested for total phosphorus content. Each data point
represents an average of four leaf samples of the same species from a given year that was
tested for inorganic phosphorus content.
0
0.1
0.2
0.3
0.4
0.5
0.6
0.7
Red Maple 2012 Red Oak 2012 White Ash 2012 Red Maple 2013 Red Oak 2013 White Ash 2013
Co
nce
ntr
ati
on
of
Ino
rga
nic
P (
uM
/g D
rie
d L
ea
f)
Total Inorganic Phosphorus Content of the Leaves of the Most Abundant Tree Species in Harvard Forest Heated and
Control Plot Control
Heated

Thurston 35
Sample ID d13C (o/oo vs. PDB)
d15N (o/oo vs. AIR)
Mole C:N
H1 -24.0 1.0 7.56 H1 Duplicate -24.1 1.3 7.57 H2 -27.4 11.6 7.53 H2 Duplicate -27.3 11.6 7.50 H3 -27.3 12.7 9.39 H3 Duplicate -27.4 12.6 9.40 C1 -26.5 12.8 10.55 C1 Duplicate -26.7 12.9 10.62 C2 -29.1 11.6 10.53 C2 Duplicate -28.9 11.4 10.53 C3 -23.3 0.5 8.16 C3 Duplicate -23.5 0.4 8.06 C4 -22.5 2.9 6.04 C5 -28.4 11.4 8.94 C5 Duplicate -28.2 11.4 8.92
Table 1: The isotope data from three mushroom caps in the heated plots and five from the
control plots. Samples were run in duplicate if there was enough biomass in the cap. d13C
and d15N shifts are shown as well as the C:N molar ratio.

Thurston 36
Image 1: Root tips that had been cut down for the enzymatic activity assay were later
imaged under a microscope and analyzed for the length and width of the root tip.
Additionally, rough outlines were drawn around each root tip to estimate the area.

Thurston 37
Image 2: The mushrooms collected from Barre Woods. No species identifications were
made, but images were taken of each mushroom collected. The photographs with blue
notation in the upper right corner are from the control plots, while those with red notation
on the upper left corner are from the heated plots.