Embed Size (px)
Citation preview
Icarus 198 (2008) 435–451
Contents lists available at ScienceDirect
Icarus
www.elsevier.com/locate/icarus
Tidally driven stress accumulation and shear failure of Enceladus’s tiger stripes
Bridget Smith-Konter a,b,∗, Robert T. Pappalardo a
a Jet Propulsion Laboratory, California Institute of Technology, M/S 183-301, Pasadena, CA 91109, USAb University of Texas at El Paso, Department of Geological Sciences, El Paso, TX 79968, USA
a r t i c l e i n f o a b s t r a c t
Article history:Received 8 December 2007Revised 25 June 2008Available online 6 August 2008
Keywords:EnceladusTectonicsTides, solid bodyIces, mechanical properties
Straddling the south polar region of Saturn’s moon Enceladus, the four principal “tiger stripe” fracturesare a likely source of tectonic activity and plume generation. Here we investigate tidally driven stressconditions at the tiger stripe fractures through a combined analysis of shear and normal diurnal tidalstresses and accounting for additional stress at depth due to the overburden pressure. We computeCoulomb failure conditions to assess failure location, timing, and direction (right- vs left-lateral slip)throughout the Enceladus orbital cycle and explore a suite of model parameters that inhibit or promoteshear failure at the tiger stripes. We find that low coefficients of friction (μ f = 0.1–0.2) and shallowoverburden depths (z = 2–4 km) permit shear failure along the tiger stripe faults, and that right-and/or left-lateral slip responses are possible. We integrate these conditions into a 3D time-dependentfault dislocation model to evaluate tectonic displacements and stress variations at depth during a tigerstripe orbital cycle. Depending on the sequence of stress accumulation and subsequent fault slip, whichvaries as a function of fault location and orientation, frictional coefficient, and fault depth, we estimateresolved shear stress accumulation of ∼70 kPa prior to fault failure, which produces modeled strike-slipdisplacements on the order of ∼0.5 m in the horizontal direction and ∼5 mm in the vertical direction perslip event. Our models also indicate that net displacements on the order of 0.1 m per orbital cycle, in bothright- and left-lateral directions, are possible for particular fault geometries and frictional parameters.Tectonic activity inferred from these analyses correlates with observed plume activity and temperatureanomalies at Enceladus’s south polar region. Moreover, these analyses provide important details of stressaccumulation and the faulting cycle for icy satellites subjected to diurnal tidal stress.
© 2008 Elsevier Inc. All rights reserved.
1. Introduction
Recent Cassini observations of Enceladus, a small icy satelliteof Saturn, revealed four prominent linear fractures, each sepa-rated by ∼30 km and spanning ∼130 km in length, straddlingthe south polar region (Porco et al., 2006). These fractures, in-formally termed “tiger stripes,” show dark flanks in the near-IR(perhaps because of local heating causing larger ice grain size),and are identified individually as Alexandria, Cairo, Baghdad, andDamascus (Fig. 1). The tiger stripes are a likely source of tectonicactivity and plume generation, providing convincing evidence oflocal geological activity (Spencer et al., 2006; Porco et al., 2006;Spitale and Porco, 2007). Recent work by Nimmo et al. (2007) andHurford et al. (2007a) suggest that the tiger stripes may be experi-encing strike-slip faulting and/or open-close motions in responseto variations in tidal stresses, similar to motions previously in-ferred for some fractures on Europa (e.g., Greenberg et al., 1998;
* Corresponding author at: University of Texas at El Paso, Department of Geolog-ical Sciences, El Paso, TX 79968, USA.
E-mail address: [email protected] (B. Smith-Konter).
0019-1035/$ – see front matter © 2008 Elsevier Inc. All rights reserved.doi:10.1016/j.icarus.2008.07.005
Head et al., 1999; Hoppa et al., 1999; Kattenhorn, 2002). UnlikeEuropa’s many recognizable offset fractures, however, unambigu-ous evidence for large strike-slip offsets at Enceladus’s tiger stripeshave yet to be reported, although some minor strike-slip offsetshave been inferred (Hurford et al., 2007b).
Time-varying gravitational tidal forces are likely responsible forthe activity inferred at Enceladus’s tiger stripes (Nimmo et al.,2007; Hurford et al., 2007a). Tidally induced stresses are ex-erted on Enceladus during its daily (diurnal) elliptical orbital cy-cle around Saturn, analogous to stress variations modeled for theEuropa–Jupiter system (Greenberg et al., 1998; Hoppa et al., 1999;Wahr et al., 2007). These stresses can be resolved onto the tigerstripe fractures in the form of resolved shear (fault-parallel) andnormal (fault-perpendicular) stresses. While previous Enceladusstudies have followed comparable approaches for investigating in-dividual behaviors of tidal diurnal shear stress (Nimmo et al.,2007) and tidal diurnal normal stress (Hurford et al., 2007a), nei-ther study fully considered the combined effect of the two com-ponents. Dombard (2007) concurs that an assimilated shear andnormal tidal stress investigation is extremely relevant to Enceladustectonics, specifically, and to outer planet satellite tectonics, in gen-eral. The relevance lies in the fact that tensile stresses reduce the
436 B. Smith-Konter, R.T. Pappalardo / Icarus 198 (2008) 435–451
frictional contact between fault surfaces, and compressive stressesinhibit shear slip and enhance fault locking, possibly leading tolarge strike-slip fault motions on tidally strained satellites, giventhe appropriate failure conditions.
Previous studies first introduced the concept of tidal “walk-ing” to the community (Tufts et al., 1999, 2000; Hoppa et al.,1999, 2001). This model provides a qualitative description of howfault normal and shear stresses fluctuate throughout the diurnaltidal cycle to drive open/close and right- or left-lateral strike-slip motions. Fundamental to this model is the premise that faultmovement is inhibited by compressive normal stress and pro-moted by tensile stress: when normal stresses are in tension,a fault opens and shear displacements are permitted, and alter-natively, when normal stresses are in compression, a fault closesand shear displacements stop. While the tidal walking model pro-vides a straightforward portrayal of tidal stressing and resultantfault behavior, it neglects overburden pressure and oversimplifiesthe physics that determine shear failure. In this study, we developa more sophisticated, quantitative model that balances the stresseswhich encourage and resist the motion of a fault, simultaneouslyaccounting for both resolved normal and shear tidal stresses, thecoefficient of friction of ice, and additional stress at depth due tothe overburden pressure. The premise of this model is governed bythe Coulomb criterion (see Section 4.1) and based on previous ter-restrial models of fault failure (e.g. King et al., 1994; Stein, 1999;King and Cocco, 2001; Stein, 2003; Cochran et al., 2004). In short,the Coulomb criterion is a simple model for assessing a fault’sfailure potential: if resolved shear stress magnitudes exceed theCoulomb failure criterion, shear failure will occur and be mani-fested as either right- or left-lateral displacements.
This improved model of tidally driven strike-slip displacementspreserves the original concept proposed by the tidal walkingmodel, in that the rising and falling of normal stresses act to clampa fault together for some portion of the orbital cycle, and un-clamp a fault over another portion. This theory deviates, however,from the original tidal walking model in that we add the addi-tional constraint that strike-slip displacement cannot occur untilthe Coulomb failure criterion is met, considering the normal andshear stress components, and overburden stress. This improvedmodel supports the simple concept that tidal variations controlthe timing of slip events and that these events are associated withthe release of elastic strain that temporarily removes the accumu-lated stress on a fault (e.g., Kattenhorn, 2002; Cochran et al., 2004;Nimmo and Schenk, 2006).
Here we investigate the tidally driven stress conditions at Ence-ladus’s south polar region for clues about the tiger stripes’ poten-tial tectonic activity by building upon previous terrestrial and outerplanet satellite research. We develop an approach for assessingthe conditions necessary for shear failure in a faulting environ-ment subjected to variable tidal diurnal stresses. Our objectives,which differ from previous studies, are (1) to quantitatively eval-uate the influence of both resolved shear and normal stress, usingthe Coulomb failure criterion, in order to identify critical modelparameters that impact failure conditions (i.e., the coefficient offriction, the vertical depth of a fault); (2) to demonstrate the vari-ability of failure, in both time and space, of the tiger stripe faultsystem for a given set of parameters; and (3) to incorporate a 3Dtime-dependent dislocation model for simulation of stress accumu-lation at depth and possible subsequent strike-slip displacementsof the tiger stripe fault system, once the Coulomb criterion hasbeen met. While simplifications have been made to reduce thecomplexities introduced by a system that varies spatially and tem-porally, the examples presented here provide important detailsabout aspects of the faulting cycle that will ultimately lead to agreater understanding of more complex failure scenarios in icy en-vironments.
2. Diurnal tidal stress
Stresses arising from time variable tidal deformation have beenused by many investigators to explain the pattern of observed frac-tured lineaments on the surface of icy satellites (e.g., Helfensteinand Parmentier, 1985; McEwen, 1986; Leith and McKinnon, 1996;Geissler et al., 1998; Greenberg et al., 1998; Hoppa, 1998; Hoppaet al., 1999; Figueredo and Greeley, 2000; Kattenhorn, 2002; Spaunet al., 2003; Schenk et al., 2008). Possible sources of tidal stressthat have been associated with the formation of global tectonicfeatures include the following: reorientation relative to the spinaxis (Melosh, 1975), tidal despinning (Melosh, 1977), radial and li-brational tides due to an eccentric orbit (Yoder, 1979; Greenberget al., 1998), nonsynchronous rotation (Helfenstein and Parmentier,1985), orbital recession or procession (Squyres and Croft, 1986;Croft et al., 1995), and polar wander (Leith and McKinnon, 1996;Sarid et al., 2002; Matsuyama and Nimmo, 2007; Schenk et al.,2008).
In this study, we limit our focus to diurnal stresses, the on-going mechanism of tidal deformation that appears most relevantto the tiger stripes of Enceladus. As a satellite orbits its parentplanet, variations in gravitational tidal forces, due in part to thesatellite’s eccentric orbit, act to deform the satellite’s surface (e.g.,Yoder, 1979; Ojakangas and Stevenson, 1989; Greenberg et al.,1998). These stresses vary over a period equal to that of the satel-lite’s orbital period. As the satellite orbits, radial and librationaltides combine to create a pattern of stresses that sweep across thesurface. For Enceladus, the diurnal period is 1.37 days. Previousstudies have suggested that diurnal tidal stresses are responsi-ble for the formation of Europa’s ridges (Greenberg et al., 1998;Hoppa et al., 1999; Nimmo and Gaidos, 2002), and also for tec-tonic features on Triton (Prockter et al., 2005) and Io (Bart et al.,2004). Recent studies of Enceladus’s tidal stress environment havelinked diurnal stress variations to geological activity at the tigerstripes (Nimmo et al., 2007; Hurford et al., 2007a).
To calculate diurnal tidal stress as a function of orbital positionpast periapse (i.e., the mean anomaly, m, in degrees) and geo-graphic location on the surface of Enceladus, we utilize SatStress,a 2D numerical code that implements the tidal stress model de-veloped by Wahr et al. (2007), which calculates tidal stresses atany point on the surface of a satellite for both diurnal and non-synchronous rotation stresses. SatStress computes stresses basedon tidal potential theory (e.g., Wahr, 1981), allowing both elasticand layered Maxwell viscoelastic treatments of the icy shell, andcomputes both raw and diagonalized stress tensor components.SatStress is a publicly available source code, complete with webinterface, and is available at http://icymoons.com/satstress (webinterface) and http://code.google.com/p/satstress (source code anddocumentation).
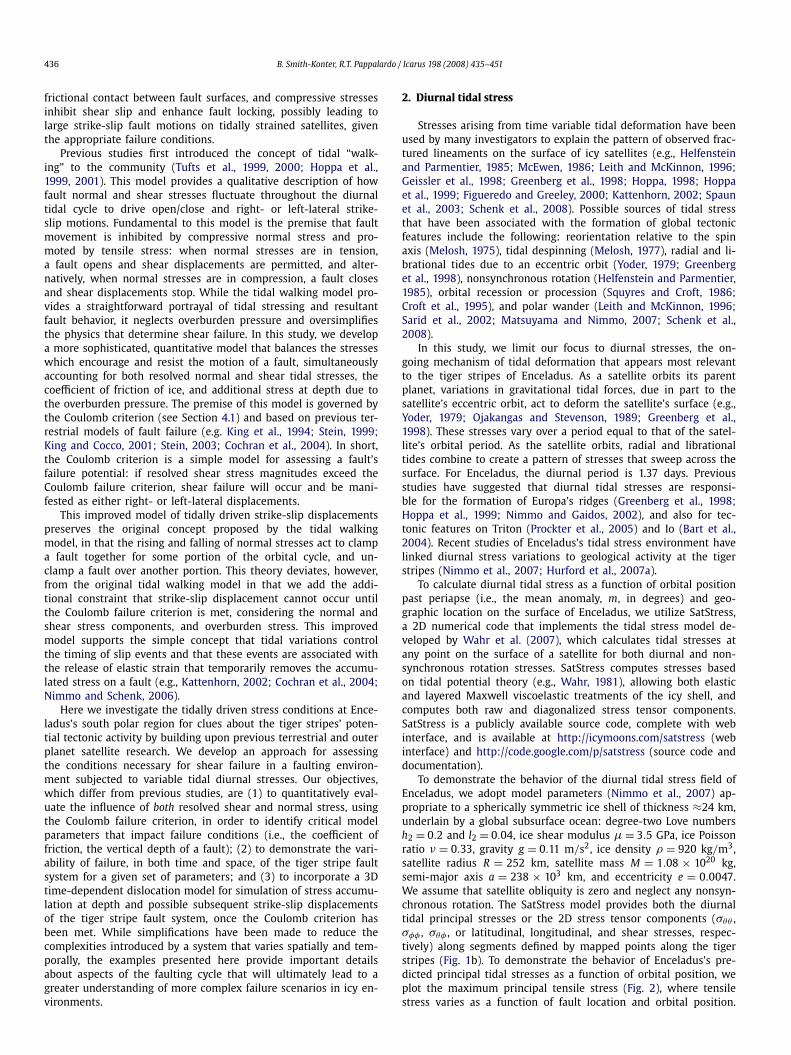
To demonstrate the behavior of the diurnal tidal stress field ofEnceladus, we adopt model parameters (Nimmo et al., 2007) ap-propriate to a spherically symmetric ice shell of thickness ≈24 km,underlain by a global subsurface ocean: degree-two Love numbersh2 = 0.2 and l2 = 0.04, ice shear modulus μ = 3.5 GPa, ice Poissonratio ν = 0.33, gravity g = 0.11 m/s2, ice density ρ = 920 kg/m3,satellite radius R = 252 km, satellite mass M = 1.08 × 10²⁰ kg,semi-major axis a = 238 × 103 km, and eccentricity e = 0.0047.We assume that satellite obliquity is zero and neglect any nonsyn-chronous rotation. The SatStress model provides both the diurnaltidal principal stresses or the 2D stress tensor components (σθθ ,σφφ , σθφ , or latitudinal, longitudinal, and shear stresses, respec-tively) along segments defined by mapped points along the tigerstripes (Fig. 1b). To demonstrate the behavior of Enceladus’s pre-dicted principal tidal stresses as a function of orbital position, weplot the maximum principal tensile stress (Fig. 2), where tensilestress varies as a function of fault location and orbital position.

Shear failure of Enceladus’s tiger stripes 437
Fig. 1. Enceladus’s south polar region in polar stereographic projection. (a) High resolution Enceladus map derived from Cassini ISS images (Roatsch et al., 2008). (b) Locationof the four tiger stripe mapped faults, with name labels, used this analyses. The small open dot along the Damascus stripe identifies the fault segment location used inFigs. 3, 5, 6, and 7; solid black dots identify the locations of example fault segments referred to in Table 1.
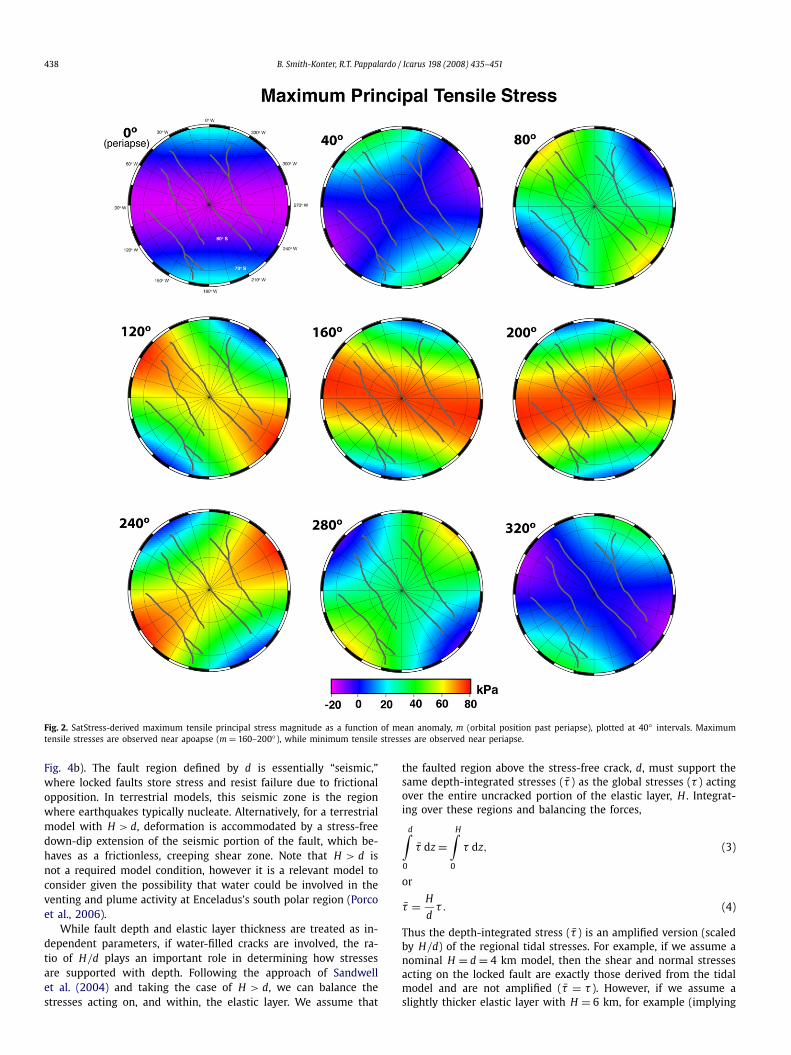
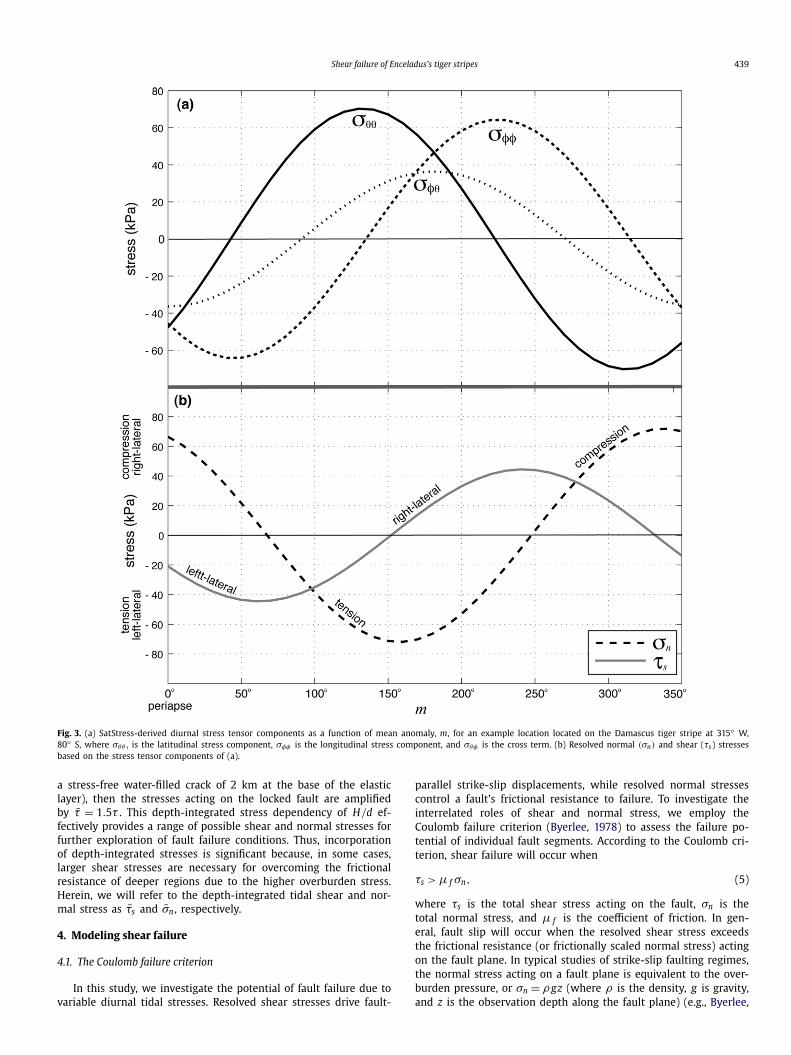
Maximum tensile stresses are observed near apoapse, while min-imum tensile stresses are observed near periapse. To demonstratethe behavior of each stress tensor component, we illustrate thetime-variable stress tensor components for an example location onthe Damascus tiger stripe at 315◦ W, 80◦ S (Fig. 3a). At this loca-tion, peak absolute stress amplitudes approach ∼70 kPa, howeverthe magnitude and phase of stresses varies with geographic posi-tion.
Next we resolve stress tensor components calculated by Sat-Stress onto discrete fault segments of varying orientation, into bothresolved normal (σn) and shear (τs) stress (e.g., King and Cocco,2001; Turcotte and Schubert, 2002; Schulson, 2002; Nimmo et al.,2007). To calculate these components, we utilize the following ex-pressions for resolved shear and normal stress (cf. King et al., 1994;Turcotte and Schubert, 2002):
τs = 1
2(σφφ − σθθ ) sin 2β + σθφ cos 2β, (1)
σn = σθθ cos2 β + σφφ sin2 β + σθφ sin 2β. (2)
These equations provide the resolved shear and normal stressas a function fault orientation, β , defined with respect to the longi-tudinal direction, specifically the 0◦–180◦ great circle (see Supple-mentary information of Nimmo et al., 2007). To demonstrate thebehavior of resolved shear and normal stresses, we plot these com-ponents (Fig. 3b), again for the example Damascus stripe location.Note that the magnitude and phase of resolved shear and normalstress on a fault segment also varies with geographic position andfault orientation. At this example location, peak absolute magni-tudes approach ∼70 kPa (resolved normal stress) and ∼45 kPa(resolved shear stress). Maximum tensile stress at this locationis predicted at 160◦ past periapse, or m = 160◦ , and maximumcompressive stress at m = 340◦ , or π radians after peak tension.Maximum resolved left-lateral shear stress is predicted at m = 65◦ ,with maximum right-lateral shear stress predicted at m = 245◦ .
3. Depth-integrated stress of the tiger stripe fault zone
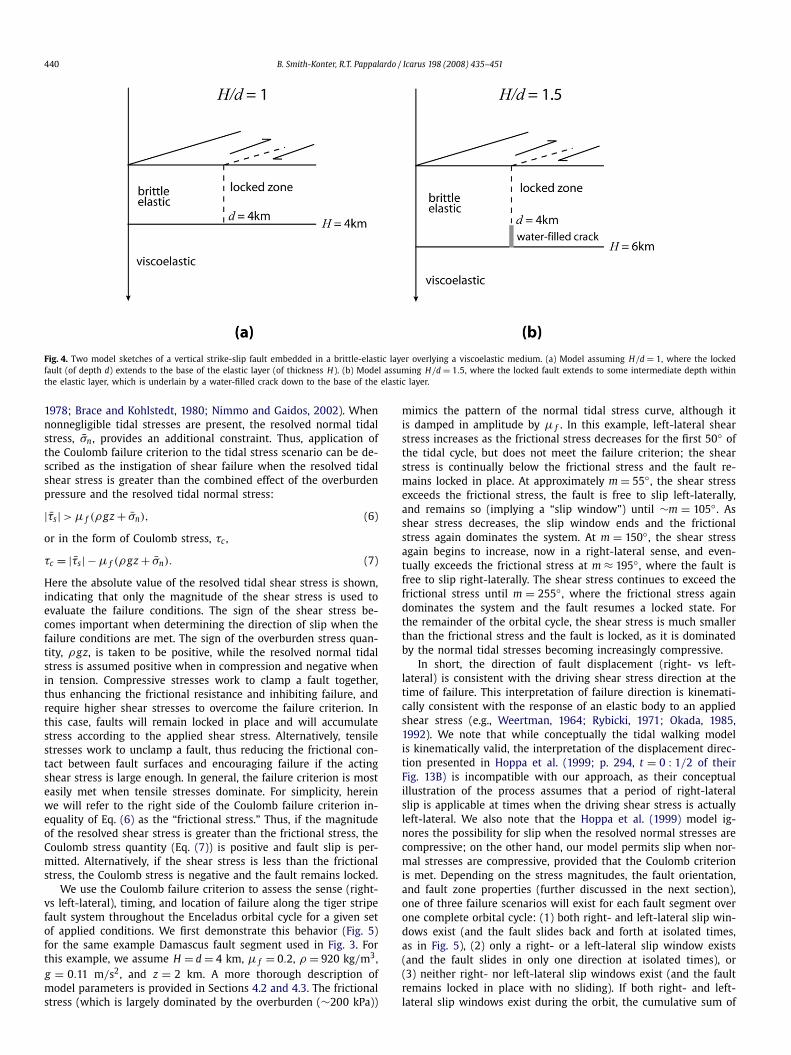
In this study, we focus our attention to the shallow subsur-face of Enceladus’s south polar region in the vicinity of the tigerstripe fault system. To calculate stress and displacements at depth,we construct a model (cf. Smith and Sandwell, 2004) (further dis-cussed in Section 6) that assumes an elastic layer overlying aviscoelastic medium, which together comprise the entire ice shell(Fig. 4). The elastic layer thickness, H , is assumed laterally con-stant in the vicinity of the tiger stripe fault zone. We assume thatvertical faults are embedded in the elastic layer and extend fromthe surface to a constant depth d. It is reasonable to assume anear-vertical fault geometry if the tiger stripes formed as tensionfractures, as is consistent with inferred jet orientations (Spitaleand Porco, 2007) and tiger stripe orientations perpendicular to thegreatest tensile stress direction of the time-varying diurnal stresses(Nimmo et al., 2007). Moreover, strike-slip faults tend to be near-vertical, arguing that they would maintain such an orientation.Thus, modeling the tiger stripes as vertical faults is consistent withtheir inferred evolution.
Inferences of the elastic layer depth and of the vertical extentof the tiger stripe faults are not well constrained. Nimmo and Pap-palardo (2006) estimate a maximum elastic lithosphere thicknessfor Enceladus’s south polar terrain of 10 km at the time of satellitereorientation, Kargel and Pozio (1996) suggest an elastic thicknessof 4 km from flexure studies, and Nimmo et al. (2007) suggest abrittle-ductile transition depth of 4 km based on their model ofshear heating. In this study, we assume a vertical fault geometryfor the tiger stripe faults that extend from the surface to a depthd = 4 km, based on a priori calculations of the maximum depththat can support Coulomb failure (further discussed Section 4.4).We also assume a lower bound on the elastic layer thickness ofd = H = 4 km and explore two distinct elastic thickness/fault depthscenarios: (1) H = d, where faults extend from the surface to thebase of the elastic layer (Fig. 4a) and (2) H > d, where faults arelimited to some intermediate depth within the elastic layer, belowwhich a water-filled crack is assumed (cf. Sandwell et al., 2004;
438 B. Smith-Konter, R.T. Pappalardo / Icarus 198 (2008) 435–451
Fig. 2. SatStress-derived maximum tensile principal stress magnitude as a function of mean anomaly, m (orbital position past periapse), plotted at 40◦ intervals. Maximumtensile stresses are observed near apoapse (m = 160–200◦), while minimum tensile stresses are observed near periapse.
Fig. 4b). The fault region defined by d is essentially “seismic,”where locked faults store stress and resist failure due to frictionalopposition. In terrestrial models, this seismic zone is the regionwhere earthquakes typically nucleate. Alternatively, for a terrestrialmodel with H > d, deformation is accommodated by a stress-freedown-dip extension of the seismic portion of the fault, which be-haves as a frictionless, creeping shear zone. Note that H > d isnot a required model condition, however it is a relevant model toconsider given the possibility that water could be involved in theventing and plume activity at Enceladus’s south polar region (Porcoet al., 2006).
While fault depth and elastic layer thickness are treated as in-dependent parameters, if water-filled cracks are involved, the ra-tio of H/d plays an important role in determining how stressesare supported with depth. Following the approach of Sandwellet al. (2004) and taking the case of H > d, we can balance thestresses acting on, and within, the elastic layer. We assume that
the faulted region above the stress-free crack, d, must support thesame depth-integrated stresses (τ̄ ) as the global stresses (τ ) actingover the entire uncracked portion of the elastic layer, H . Integrat-ing over these regions and balancing the forces,
d∫
0
τ̄ dz =H∫
0
τ dz, (3)
or
τ̄ = H
dτ . (4)
Thus the depth-integrated stress (τ̄ ) is an amplified version (scaledby H/d) of the regional tidal stresses. For example, if we assume anominal H = d = 4 km model, then the shear and normal stressesacting on the locked fault are exactly those derived from the tidalmodel and are not amplified (τ̄ = τ ). However, if we assume aslightly thicker elastic layer with H = 6 km, for example (implying
Shear failure of Enceladus’s tiger stripes 439
Fig. 3. (a) SatStress-derived diurnal stress tensor components as a function of mean anomaly, m, for an example location located on the Damascus tiger stripe at 315◦ W,80◦ S, where σθθ , is the latitudinal stress component, σφφ is the longitudinal stress component, and σθφ is the cross term. (b) Resolved normal (σn) and shear (τs) stressesbased on the stress tensor components of (a).
a stress-free water-filled crack of 2 km at the base of the elasticlayer), then the stresses acting on the locked fault are amplifiedby τ̄ = 1.5τ . This depth-integrated stress dependency of H/d ef-fectively provides a range of possible shear and normal stresses forfurther exploration of fault failure conditions. Thus, incorporationof depth-integrated stresses is significant because, in some cases,larger shear stresses are necessary for overcoming the frictionalresistance of deeper regions due to the higher overburden stress.Herein, we will refer to the depth-integrated tidal shear and nor-mal stress as τ̄s and σ̄n , respectively.
4. Modeling shear failure
4.1. The Coulomb failure criterion
In this study, we investigate the potential of fault failure due tovariable diurnal tidal stresses. Resolved shear stresses drive fault-
parallel strike-slip displacements, while resolved normal stressescontrol a fault’s frictional resistance to failure. To investigate theinterrelated roles of shear and normal stress, we employ theCoulomb failure criterion (Byerlee, 1978) to assess the failure po-tential of individual fault segments. According to the Coulomb cri-terion, shear failure will occur when
τs > μ f σn, (5)
where τs is the total shear stress acting on the fault, σn is thetotal normal stress, and μ f is the coefficient of friction. In gen-eral, fault slip will occur when the resolved shear stress exceedsthe frictional resistance (or frictionally scaled normal stress) actingon the fault plane. In typical studies of strike-slip faulting regimes,the normal stress acting on a fault plane is equivalent to the over-burden pressure, or σn = ρgz (where ρ is the density, g is gravity,and z is the observation depth along the fault plane) (e.g., Byerlee,
440 B. Smith-Konter, R.T. Pappalardo / Icarus 198 (2008) 435–451
Fig. 4. Two model sketches of a vertical strike-slip fault embedded in a brittle-elastic layer overlying a viscoelastic medium. (a) Model assuming H/d = 1, where the lockedfault (of depth d) extends to the base of the elastic layer (of thickness H). (b) Model assuming H/d = 1.5, where the locked fault extends to some intermediate depth withinthe elastic layer, which is underlain by a water-filled crack down to the base of the elastic layer.
1978; Brace and Kohlstedt, 1980; Nimmo and Gaidos, 2002). Whennonnegligible tidal stresses are present, the resolved normal tidalstress, σ̄n , provides an additional constraint. Thus, application ofthe Coulomb failure criterion to the tidal stress scenario can be de-scribed as the instigation of shear failure when the resolved tidalshear stress is greater than the combined effect of the overburdenpressure and the resolved tidal normal stress:
|τ̄s| > μ f (ρgz + σ̄n), (6)
or in the form of Coulomb stress, τc ,
τc = |τ̄s| − μ f (ρgz + σ̄n). (7)
Here the absolute value of the resolved tidal shear stress is shown,indicating that only the magnitude of the shear stress is used toevaluate the failure conditions. The sign of the shear stress be-comes important when determining the direction of slip when thefailure conditions are met. The sign of the overburden stress quan-tity, ρgz, is taken to be positive, while the resolved normal tidalstress is assumed positive when in compression and negative whenin tension. Compressive stresses work to clamp a fault together,thus enhancing the frictional resistance and inhibiting failure, andrequire higher shear stresses to overcome the failure criterion. Inthis case, faults will remain locked in place and will accumulatestress according to the applied shear stress. Alternatively, tensilestresses work to unclamp a fault, thus reducing the frictional con-tact between fault surfaces and encouraging failure if the actingshear stress is large enough. In general, the failure criterion is mosteasily met when tensile stresses dominate. For simplicity, hereinwe will refer to the right side of the Coulomb failure criterion in-equality of Eq. (6) as the “frictional stress.” Thus, if the magnitudeof the resolved shear stress is greater than the frictional stress, theCoulomb stress quantity (Eq. (7)) is positive and fault slip is per-mitted. Alternatively, if the shear stress is less than the frictionalstress, the Coulomb stress is negative and the fault remains locked.
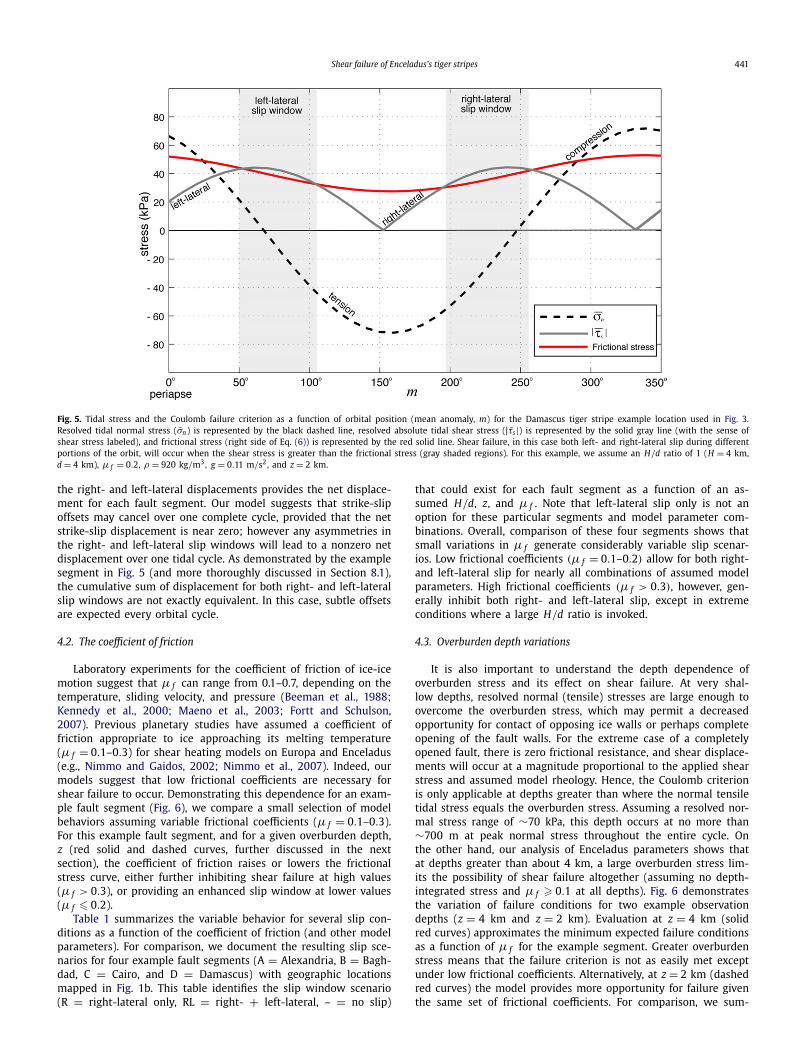
We use the Coulomb failure criterion to assess the sense (right-vs left-lateral), timing, and location of failure along the tiger stripefault system throughout the Enceladus orbital cycle for a given setof applied conditions. We first demonstrate this behavior (Fig. 5)for the same example Damascus fault segment used in Fig. 3. Forthis example, we assume H = d = 4 km, μ f = 0.2, ρ = 920 kg/m3,g = 0.11 m/s2, and z = 2 km. A more thorough description ofmodel parameters is provided in Sections 4.2 and 4.3. The frictionalstress (which is largely dominated by the overburden (∼200 kPa))
mimics the pattern of the normal tidal stress curve, although itis damped in amplitude by μ f . In this example, left-lateral shearstress increases as the frictional stress decreases for the first 50◦ ofthe tidal cycle, but does not meet the failure criterion; the shearstress is continually below the frictional stress and the fault re-mains locked in place. At approximately m = 55◦ , the shear stressexceeds the frictional stress, the fault is free to slip left-laterally,and remains so (implying a “slip window”) until ∼m = 105◦ . Asshear stress decreases, the slip window ends and the frictionalstress again dominates the system. At m = 150◦ , the shear stressagain begins to increase, now in a right-lateral sense, and even-tually exceeds the frictional stress at m ≈ 195◦ , where the fault isfree to slip right-laterally. The shear stress continues to exceed thefrictional stress until m = 255◦ , where the frictional stress againdominates the system and the fault resumes a locked state. Forthe remainder of the orbital cycle, the shear stress is much smallerthan the frictional stress and the fault is locked, as it is dominatedby the normal tidal stresses becoming increasingly compressive.
In short, the direction of fault displacement (right- vs left-lateral) is consistent with the driving shear stress direction at thetime of failure. This interpretation of failure direction is kinemati-cally consistent with the response of an elastic body to an appliedshear stress (e.g., Weertman, 1964; Rybicki, 1971; Okada, 1985,1992). We note that while conceptually the tidal walking modelis kinematically valid, the interpretation of the displacement direc-tion presented in Hoppa et al. (1999; p. 294, t = 0 : 1/2 of theirFig. 13B) is incompatible with our approach, as their conceptualillustration of the process assumes that a period of right-lateralslip is applicable at times when the driving shear stress is actuallyleft-lateral. We also note that the Hoppa et al. (1999) model ig-nores the possibility for slip when the resolved normal stresses arecompressive; on the other hand, our model permits slip when nor-mal stresses are compressive, provided that the Coulomb criterionis met. Depending on the stress magnitudes, the fault orientation,and fault zone properties (further discussed in the next section),one of three failure scenarios will exist for each fault segment overone complete orbital cycle: (1) both right- and left-lateral slip win-dows exist (and the fault slides back and forth at isolated times,as in Fig. 5), (2) only a right- or a left-lateral slip window exists(and the fault slides in only one direction at isolated times), or(3) neither right- nor left-lateral slip windows exist (and the faultremains locked in place with no sliding). If both right- and left-lateral slip windows exist during the orbit, the cumulative sum of
Shear failure of Enceladus’s tiger stripes 441
Fig. 5. Tidal stress and the Coulomb failure criterion as a function of orbital position (mean anomaly, m) for the Damascus tiger stripe example location used in Fig. 3.Resolved tidal normal stress (σ̄n) is represented by the black dashed line, resolved absolute tidal shear stress (|τ̄s|) is represented by the solid gray line (with the sense ofshear stress labeled), and frictional stress (right side of Eq. (6)) is represented by the red solid line. Shear failure, in this case both left- and right-lateral slip during differentportions of the orbit, will occur when the shear stress is greater than the frictional stress (gray shaded regions). For this example, we assume an H/d ratio of 1 (H = 4 km,d = 4 km), μ = 0.2, ρ = 920 kg/m3, g = 0.11 m/s2, and z = 2 km.
fthe right- and left-lateral displacements provides the net displace-ment for each fault segment. Our model suggests that strike-slipoffsets may cancel over one complete cycle, provided that the netstrike-slip displacement is near zero; however any asymmetries inthe right- and left-lateral slip windows will lead to a nonzero netdisplacement over one tidal cycle. As demonstrated by the examplesegment in Fig. 5 (and more thoroughly discussed in Section 8.1),the cumulative sum of displacement for both right- and left-lateralslip windows are not exactly equivalent. In this case, subtle offsetsare expected every orbital cycle.
4.2. The coefficient of friction
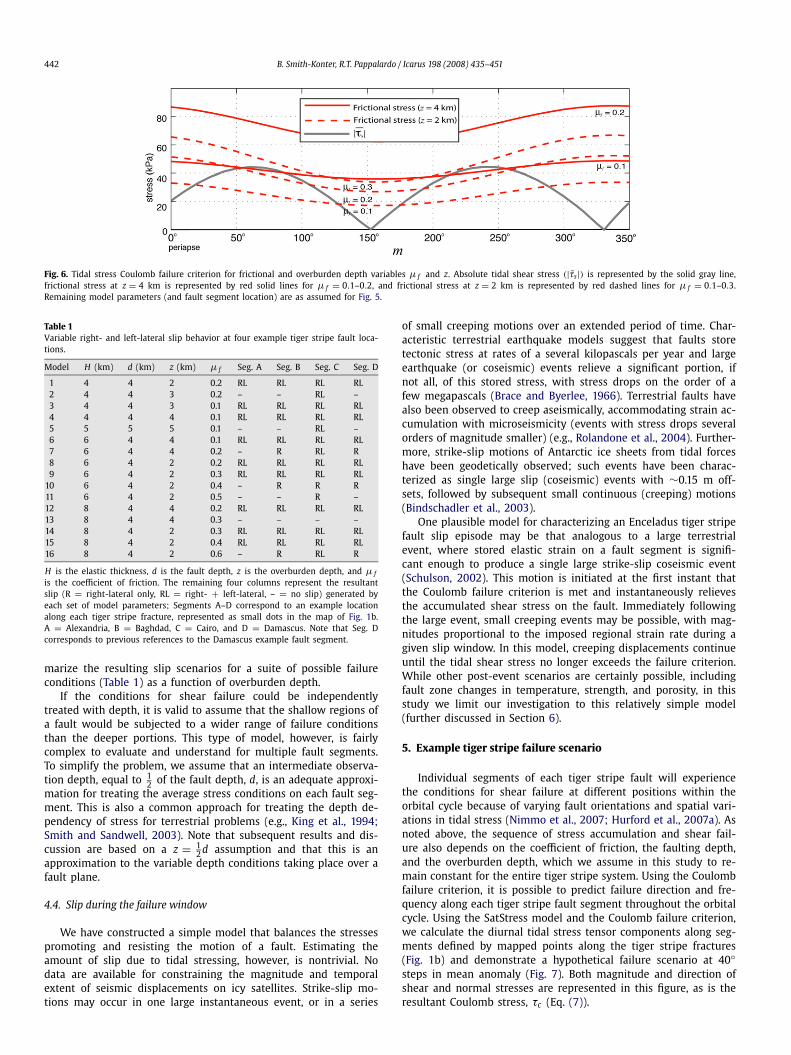
Laboratory experiments for the coefficient of friction of ice-icemotion suggest that μ f can range from 0.1–0.7, depending on thetemperature, sliding velocity, and pressure (Beeman et al., 1988;Kennedy et al., 2000; Maeno et al., 2003; Fortt and Schulson,2007). Previous planetary studies have assumed a coefficient offriction appropriate to ice approaching its melting temperature(μ f = 0.1–0.3) for shear heating models on Europa and Enceladus(e.g., Nimmo and Gaidos, 2002; Nimmo et al., 2007). Indeed, ourmodels suggest that low frictional coefficients are necessary forshear failure to occur. Demonstrating this dependence for an exam-ple fault segment (Fig. 6), we compare a small selection of modelbehaviors assuming variable frictional coefficients (μ f = 0.1–0.3).For this example fault segment, and for a given overburden depth,z (red solid and dashed curves, further discussed in the nextsection), the coefficient of friction raises or lowers the frictionalstress curve, either further inhibiting shear failure at high values(μ f > 0.3), or providing an enhanced slip window at lower values(μ f � 0.2).
Table 1 summarizes the variable behavior for several slip con-ditions as a function of the coefficient of friction (and other modelparameters). For comparison, we document the resulting slip sce-narios for four example fault segments (A = Alexandria, B = Bagh-dad, C = Cairo, and D = Damascus) with geographic locationsmapped in Fig. 1b. This table identifies the slip window scenario(R = right-lateral only, RL = right- + left-lateral, – = no slip)
that could exist for each fault segment as a function of an as-sumed H/d, z, and μ f . Note that left-lateral slip only is not anoption for these particular segments and model parameter com-binations. Overall, comparison of these four segments shows thatsmall variations in μ f generate considerably variable slip scenar-ios. Low frictional coefficients (μ f = 0.1–0.2) allow for both right-and left-lateral slip for nearly all combinations of assumed modelparameters. High frictional coefficients (μ f > 0.3), however, gen-erally inhibit both right- and left-lateral slip, except in extremeconditions where a large H/d ratio is invoked.
4.3. Overburden depth variations
It is also important to understand the depth dependence ofoverburden stress and its effect on shear failure. At very shal-low depths, resolved normal (tensile) stresses are large enough toovercome the overburden stress, which may permit a decreasedopportunity for contact of opposing ice walls or perhaps completeopening of the fault walls. For the extreme case of a completelyopened fault, there is zero frictional resistance, and shear displace-ments will occur at a magnitude proportional to the applied shearstress and assumed model rheology. Hence, the Coulomb criterionis only applicable at depths greater than where the normal tensiletidal stress equals the overburden stress. Assuming a resolved nor-mal stress range of ∼70 kPa, this depth occurs at no more than∼700 m at peak normal stress throughout the entire cycle. Onthe other hand, our analysis of Enceladus parameters shows thatat depths greater than about 4 km, a large overburden stress lim-its the possibility of shear failure altogether (assuming no depth-integrated stress and μ f � 0.1 at all depths). Fig. 6 demonstratesthe variation of failure conditions for two example observationdepths (z = 4 km and z = 2 km). Evaluation at z = 4 km (solidred curves) approximates the minimum expected failure conditionsas a function of μ f for the example segment. Greater overburdenstress means that the failure criterion is not as easily met exceptunder low frictional coefficients. Alternatively, at z = 2 km (dashedred curves) the model provides more opportunity for failure giventhe same set of frictional coefficients. For comparison, we sum-
442 B. Smith-Konter, R.T. Pappalardo / Icarus 198 (2008) 435–451
Fig. 6. Tidal stress Coulomb failure criterion for frictional and overburden depth variables μ f and z. Absolute tidal shear stress (|τ̄s|) is represented by the solid gray line,frictional stress at z = 4 km is represented by red solid lines for μ f = 0.1–0.2, and frictional stress at z = 2 km is represented by red dashed lines for μ f = 0.1–0.3.Remaining model parameters (and fault segment location) are as assumed for Fig. 5.
Table 1Variable right- and left-lateral slip behavior at four example tiger stripe fault loca-tions.
Model H (km) d (km) z (km) μ f Seg. A Seg. B Seg. C Seg. D
1 4 4 2 0.2 RL RL RL RL2 4 4 3 0.2 – – RL –3 4 4 3 0.1 RL RL RL RL4 4 4 4 0.1 RL RL RL RL5 5 5 5 0.1 – – RL –6 6 4 4 0.1 RL RL RL RL7 6 4 4 0.2 – R RL R8 6 4 2 0.2 RL RL RL RL9 6 4 2 0.3 RL RL RL RL
10 6 4 2 0.4 – R R R11 6 4 2 0.5 – – R –12 8 4 4 0.2 RL RL RL RL13 8 4 4 0.3 – – – –14 8 4 2 0.3 RL RL RL RL15 8 4 2 0.4 RL RL RL RL16 8 4 2 0.6 – R RL R
H is the elastic thickness, d is the fault depth, z is the overburden depth, and μ f
is the coefficient of friction. The remaining four columns represent the resultantslip (R = right-lateral only, RL = right- + left-lateral, – = no slip) generated byeach set of model parameters; Segments A–D correspond to an example locationalong each tiger stripe fracture, represented as small dots in the map of Fig. 1b.A = Alexandria, B = Baghdad, C = Cairo, and D = Damascus. Note that Seg. Dcorresponds to previous references to the Damascus example fault segment.
marize the resulting slip scenarios for a suite of possible failureconditions (Table 1) as a function of overburden depth.
If the conditions for shear failure could be independentlytreated with depth, it is valid to assume that the shallow regions ofa fault would be subjected to a wider range of failure conditionsthan the deeper portions. This type of model, however, is fairlycomplex to evaluate and understand for multiple fault segments.To simplify the problem, we assume that an intermediate observa-tion depth, equal to 1
2 of the fault depth, d, is an adequate approxi-mation for treating the average stress conditions on each fault seg-ment. This is also a common approach for treating the depth de-pendency of stress for terrestrial problems (e.g., King et al., 1994;Smith and Sandwell, 2003). Note that subsequent results and dis-cussion are based on a z = 1
2 d assumption and that this is anapproximation to the variable depth conditions taking place over afault plane.
4.4. Slip during the failure window
We have constructed a simple model that balances the stressespromoting and resisting the motion of a fault. Estimating theamount of slip due to tidal stressing, however, is nontrivial. Nodata are available for constraining the magnitude and temporalextent of seismic displacements on icy satellites. Strike-slip mo-tions may occur in one large instantaneous event, or in a series
of small creeping motions over an extended period of time. Char-acteristic terrestrial earthquake models suggest that faults storetectonic stress at rates of a several kilopascals per year and largeearthquake (or coseismic) events relieve a significant portion, ifnot all, of this stored stress, with stress drops on the order of afew megapascals (Brace and Byerlee, 1966). Terrestrial faults havealso been observed to creep aseismically, accommodating strain ac-cumulation with microseismicity (events with stress drops severalorders of magnitude smaller) (e.g., Rolandone et al., 2004). Further-more, strike-slip motions of Antarctic ice sheets from tidal forceshave been geodetically observed; such events have been charac-terized as single large slip (coseismic) events with ∼0.15 m off-sets, followed by subsequent small continuous (creeping) motions(Bindschadler et al., 2003).
One plausible model for characterizing an Enceladus tiger stripefault slip episode may be that analogous to a large terrestrialevent, where stored elastic strain on a fault segment is signifi-cant enough to produce a single large strike-slip coseismic event(Schulson, 2002). This motion is initiated at the first instant thatthe Coulomb failure criterion is met and instantaneously relievesthe accumulated shear stress on the fault. Immediately followingthe large event, small creeping events may be possible, with mag-nitudes proportional to the imposed regional strain rate during agiven slip window. In this model, creeping displacements continueuntil the tidal shear stress no longer exceeds the failure criterion.While other post-event scenarios are certainly possible, includingfault zone changes in temperature, strength, and porosity, in thisstudy we limit our investigation to this relatively simple model(further discussed in Section 6).
5. Example tiger stripe failure scenario
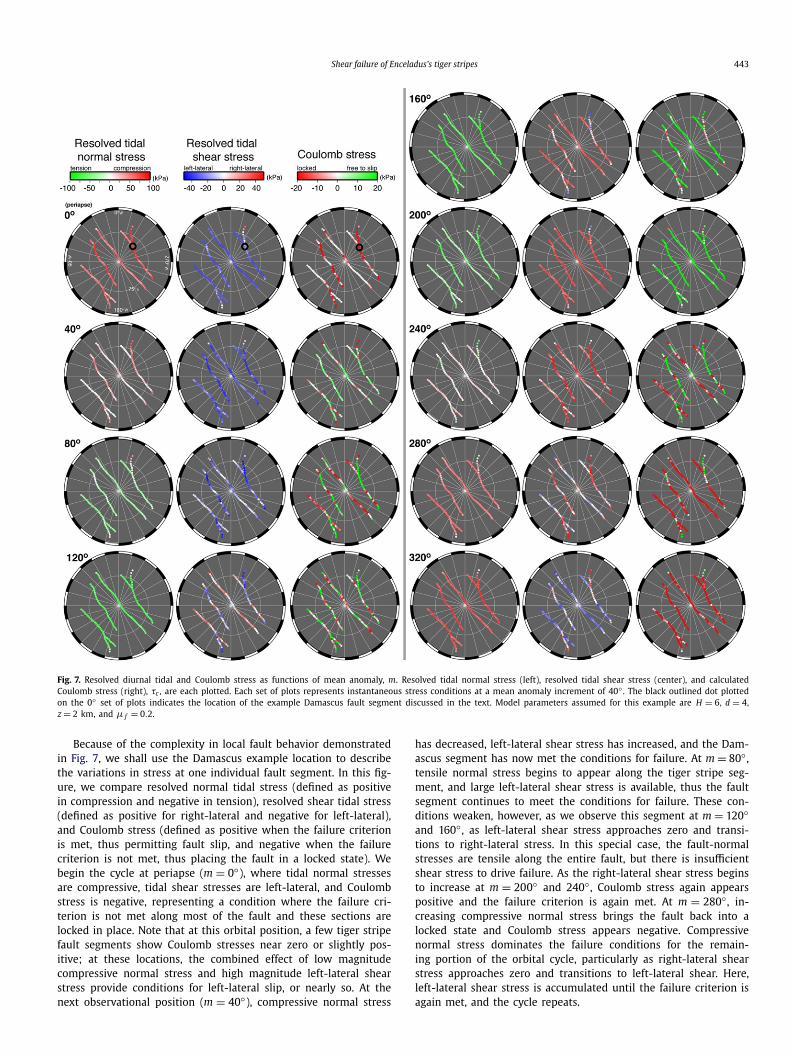
Individual segments of each tiger stripe fault will experiencethe conditions for shear failure at different positions within theorbital cycle because of varying fault orientations and spatial vari-ations in tidal stress (Nimmo et al., 2007; Hurford et al., 2007a). Asnoted above, the sequence of stress accumulation and shear fail-ure also depends on the coefficient of friction, the faulting depth,and the overburden depth, which we assume in this study to re-main constant for the entire tiger stripe system. Using the Coulombfailure criterion, it is possible to predict failure direction and fre-quency along each tiger stripe fault segment throughout the orbitalcycle. Using the SatStress model and the Coulomb failure criterion,we calculate the diurnal tidal stress tensor components along seg-ments defined by mapped points along the tiger stripe fractures(Fig. 1b) and demonstrate a hypothetical failure scenario at 40◦steps in mean anomaly (Fig. 7). Both magnitude and direction ofshear and normal stresses are represented in this figure, as is theresultant Coulomb stress, τc (Eq. (7)).
Shear failure of Enceladus’s tiger stripes 443
Fig. 7. Resolved diurnal tidal and Coulomb stress as functions of mean anomaly, m. Resolved tidal normal stress (left), resolved tidal shear stress (center), and calculatedCoulomb stress (right), τc , are each plotted. Each set of plots represents instantaneous stress conditions at a mean anomaly increment of 40◦ . The black outlined dot plottedon the 0◦ set of plots indicates the location of the example Damascus fault segment discussed in the text. Model parameters assumed for this example are H = 6, d = 4,z = 2 km, and μ f = 0.2.
Because of the complexity in local fault behavior demonstratedin Fig. 7, we shall use the Damascus example location to describethe variations in stress at one individual fault segment. In this fig-ure, we compare resolved normal tidal stress (defined as positivein compression and negative in tension), resolved shear tidal stress(defined as positive for right-lateral and negative for left-lateral),and Coulomb stress (defined as positive when the failure criterionis met, thus permitting fault slip, and negative when the failurecriterion is not met, thus placing the fault in a locked state). Webegin the cycle at periapse (m = 0◦), where tidal normal stressesare compressive, tidal shear stresses are left-lateral, and Coulombstress is negative, representing a condition where the failure cri-terion is not met along most of the fault and these sections arelocked in place. Note that at this orbital position, a few tiger stripefault segments show Coulomb stresses near zero or slightly pos-itive; at these locations, the combined effect of low magnitudecompressive normal stress and high magnitude left-lateral shearstress provide conditions for left-lateral slip, or nearly so. At thenext observational position (m = 40◦), compressive normal stress
has decreased, left-lateral shear stress has increased, and the Dam-ascus segment has now met the conditions for failure. At m = 80◦ ,tensile normal stress begins to appear along the tiger stripe seg-ment, and large left-lateral shear stress is available, thus the faultsegment continues to meet the conditions for failure. These con-ditions weaken, however, as we observe this segment at m = 120◦and 160◦ , as left-lateral shear stress approaches zero and transi-tions to right-lateral stress. In this special case, the fault-normalstresses are tensile along the entire fault, but there is insufficientshear stress to drive failure. As the right-lateral shear stress beginsto increase at m = 200◦ and 240◦ , Coulomb stress again appearspositive and the failure criterion is again met. At m = 280◦ , in-creasing compressive normal stress brings the fault back into alocked state and Coulomb stress appears negative. Compressivenormal stress dominates the failure conditions for the remain-ing portion of the orbital cycle, particularly as right-lateral shearstress approaches zero and transitions to left-lateral shear. Here,left-lateral shear stress is accumulated until the failure criterion isagain met, and the cycle repeats.
444 B. Smith-Konter, R.T. Pappalardo / Icarus 198 (2008) 435–451
Treating the system as a whole, this example failure scenarioindicates that nearly all fault segments remain continuously lockedfor roughly a 100◦ span of the orbital cycle, and that conditionsfor both right- and left-lateral fault slip exist. Anomalous fault seg-ments (i.e., those with delayed or reversed failure responses rela-tive to the overall tiger strip behavior) are noted along branches ofboth the Alexandria and Damascus tiger stripes, where fault geom-etry plays a major role. We also note that for this demonstration,we have applied a depth-averaged scaling of stresses appropriateto a fault (d = 4 km) overlying a water-filled crack, embeddedwithin an elastic layer (H = 6 km). This particular model providesa more “active” faulting scenario than a model assuming H = d, inthat a reduced opportunity for overall failure (and combined right-and left-lateral slip directions) is computed when the fault depthextends to the base of the elastic layer.
This failure scenario indicates where and when the failure cri-terion has been met, and subsequently, where and when displace-ments should be prescribed. It does not, however, provide an obvi-ous indication of the displacement that may occur at each observa-tional stage, nor does it account for spatial variations (horizontally,or with depth) of displacement and stress. A 3D time-dependentfault dislocation model, which incorporates the elastic response ofthe lithosphere to seismic faulting (described next), can be usedto integrate tidally induced Coulomb failure with the seismic re-sponse of a fault to evaluate both stress and displacement alongprescribed fault segments.
6. 3D fault dislocation model
Using the tiger stripe failure scenario derived above, we sim-ulate strike-slip deformation using a 3D semi-analytic dislocationmodel, originally developed for terrestrial applications, which cal-culates stress, strain, and displacement caused by horizontal shearas a function of depth (Smith and Sandwell, 2003, 2004, 2006;Smith-Konter and Sandwell, in preparation). This model, here-after referred to as the SK&S model, calculates the 3D (horizon-tal and vertical) time-dependent response of vertical point dis-locations embedded in an elastic layer overlying a viscoelastichalf-space (e.g., Rundle and Jackson, 1977; Savage and Prescott,1978). The SK&S model, however, is based on mathematical so-lutions that are analytic in the vertical and time dimensions,while primarily numeric in the two horizontal dimensions; thehorizontal solutions are provided in the Fourier transform (spec-tral) domain, which enable the use of the Fast Fourier Transform(FFT) computation algorithm. The model is purely kinematic inthat slip on faults is prescribed based on a given failure sce-nario. The model is, to first-order, sensitive to fault depth d, theshear modulus μ, and the restoring force of gravity, g . Here weassume d = 4 km, μ = 3.5 GPa, and other model parametersidentical to those used to derive the tidal stresses using the Sat-Stress model. While the SK&S model is capable of assessing ad-ditional displacements and stresses due to viscoelastic relaxation,in this study we limit the simulations to the purely static, elas-tic case so that first-order model results can be assessed; thus,our results described here are insensitive to changes in viscosityand ice shell thickness. The SK&S model source code and exe-cutable files, for terrestrial applications, are available at http://topex.ucsd.edu/body_force.
Because the SK&S model is based on surface deformation so-lutions for arbitrarily oriented dislocations imbedded in a layeredhalf-space, displacement calculations require the utilization of pla-nar fault geometry. For application to Enceladus, we preserve faultspacing and segment separation (geographic coordinates) by pro-jecting each curved tiger stripe fault about an effective “pole ofdeformation” (cf. Wdowinski et al., 2007), best defined by a polerunning through the equatorial plane and a longitudinal position
roughly perpendicular to the overall strike of the tiger stripe sys-tem. This inferred pole of deformation (0◦ , 110◦) was chosen tominimize spatial distortion across all four tiger stripe faults andto primarily align the Baghdad stripe, the lengthiest and poten-tially most active of the faults (Spitale and Porco, 2007), roughlynorth–south (the direction of applied far-field shear motion) inour model-space planar coordinate system. A transverse Mercatorprojection about this pole provides a means for representing thespherical tiger stripe fault system geometry, after which fault seg-ments in are imbedded in a model grid of 512×512 elements witha grid spacing of 1 km. After calculations are performed, we thenreverse the transformation for plotting purposes and evaluation ofthe deformation components. We note that this first-generationmodel provides approximate relative surface deformation on Ence-ladus, as omission of curvature effects are likely to introduce smallspatial errors in the displacement fields. The temporal responseof Coulomb fault failure due to resolved tidal stresses, however,is unaffected by this approximation, as failure stress occurrenceand magnitude are directly computed from the spherical SatStressmodel, which accounts for satellite curvature.
To demonstrate the behavior of the SK&S dislocation modelin response to a tidal stress Coulomb failure scenario, we simu-late stress accumulation across the tiger stripe system by resolvingtidal shear stresses onto the fault plane segments and calculatingthe resultant local strain (stress, τ , divided by the shear modu-lus, μ), at each orbital position. We assume that coseismic dis-placement (a large initial slip) on each fault segment is determinedby the accumulated tidally induced shear strain at the instant thatthe Coulomb criterion is met, multiplied by the average fault spac-ing (cf. Greenberg et al., 1998; Nimmo et al., 2007). This methodmay also be thought of in terms of a “strain marker,” where theamount of accumulated strain at the instant of failure must bal-ance the amount of equivalent displacement on the fault at thetime of slip. For example, if the shear stress at the time of initialfailure is 40 kPa, then the slip required to balance the accumu-lated strain is ∼0.3 m (assuming ∼30 km fault spacing). Followingthe initial coseismic slip event, we allow the model to creep ata rate consistent with that of the imposed shear strain at Ence-ladus’s south polar region (∼10−5 s−1; cf. Nimmo et al., 2007)throughout the failure window. These subsequent creep events aremuch smaller in magnitude, averaging ∼50 mm per 10◦ of orbit.In short, the magnitude of the initial strike-slip displacement isproportional to the accumulated tidally induced strain, and the di-rection of fault displacement (right- vs left-lateral) is consistentwith the driving shear stress direction at the time of failure.
7. Results: A tiger stripe quake cycle
7.1. Stress accumulation
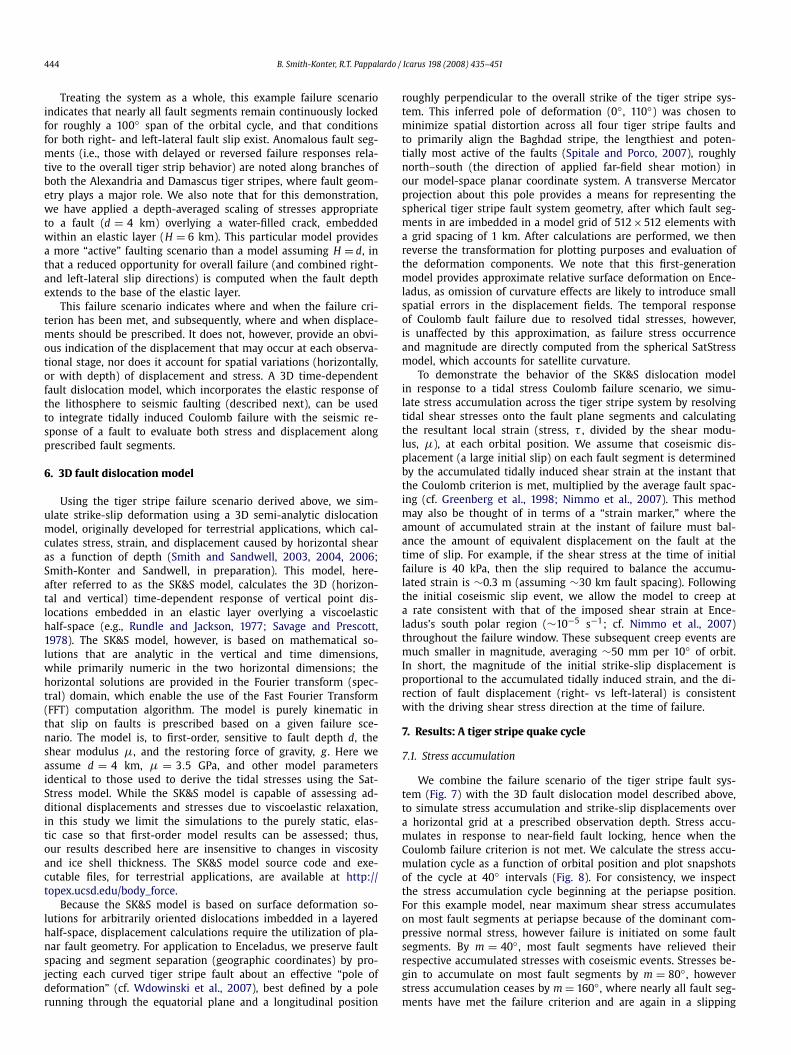
We combine the failure scenario of the tiger stripe fault sys-tem (Fig. 7) with the 3D fault dislocation model described above,to simulate stress accumulation and strike-slip displacements overa horizontal grid at a prescribed observation depth. Stress accu-mulates in response to near-field fault locking, hence when theCoulomb failure criterion is not met. We calculate the stress accu-mulation cycle as a function of orbital position and plot snapshotsof the cycle at 40◦ intervals (Fig. 8). For consistency, we inspectthe stress accumulation cycle beginning at the periapse position.For this example model, near maximum shear stress accumulateson most fault segments at periapse because of the dominant com-pressive normal stress, however failure is initiated on some faultsegments. By m = 40◦ , most fault segments have relieved theirrespective accumulated stresses with coseismic events. Stresses be-gin to accumulate on most fault segments by m = 80◦ , howeverstress accumulation ceases by m = 160◦ , where nearly all fault seg-ments have met the failure criterion and are again in a slipping
Shear failure of Enceladus’s tiger stripes 445
Fig. 8. Shear stress accumulation of the tiger stripes shown at 40◦ intervals of the orbital position (mean anomaly, m), draped over a Cassini image mosaic of Enceladus’ssouth polar region. Each plot represents the instantaneous absolute value of accumulated shear stress resolved along each fault segment and plotted in the fault-paralleldirection. Stresses range from ∼0–70 kPa, where warm colors represent high stress accumulation and cool colors represent zero stress accumulation (in the case of a slippingfault segment) or low stress accumulation due to the tidal stress cycle. Stress observations are made a depth of 2 km. Model parameters are as assumed in Fig. 7.
state. Subsequent orbital positions (m � 240◦) yield stress accu-mulation on most segments as Enceladus approaches apoapse.
7.2. Displacements
Complementary to the stress accumulation model, displace-ments are prescribed when the Coulomb failure criterion is metand fault motions relieve stress through an imposed dislocation.Model displacements are calculated at the surface, where space-craft observations (and terrestrial measurements) are typicallymade. Model calculations are performed in Cartesian coordinatesand then displayed in a polar stereographic projection, where lon-gitudinal and latitudinal components have been reprojected alongeach fault segment’s local orientation to represent fault-parallelmotion relative to local fault geometry, in either the right- or left-lateral direction (Fig. 9). We begin inspection of the displacement
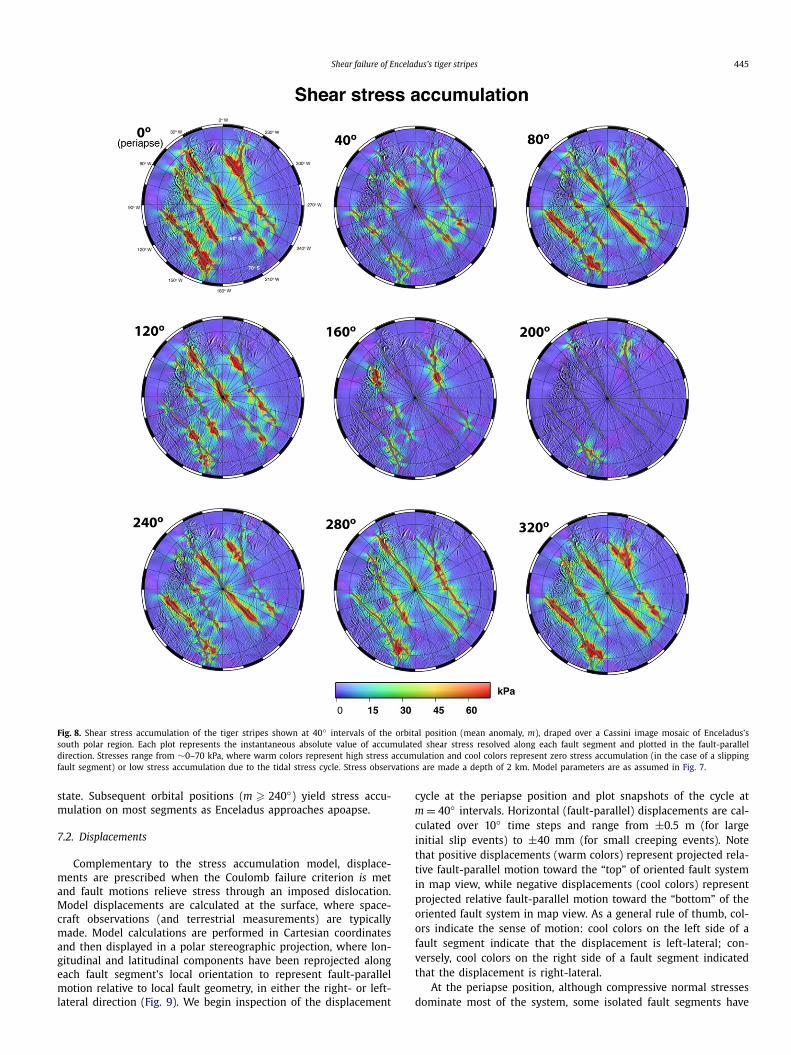
cycle at the periapse position and plot snapshots of the cycle atm = 40◦ intervals. Horizontal (fault-parallel) displacements are cal-culated over 10◦ time steps and range from ±0.5 m (for largeinitial slip events) to ±40 mm (for small creeping events). Notethat positive displacements (warm colors) represent projected rela-tive fault-parallel motion toward the “top” of oriented fault systemin map view, while negative displacements (cool colors) representprojected relative fault-parallel motion toward the “bottom” of theoriented fault system in map view. As a general rule of thumb, col-ors indicate the sense of motion: cool colors on the left side of afault segment indicate that the displacement is left-lateral; con-versely, cool colors on the right side of a fault segment indicatedthat the displacement is right-lateral.
At the periapse position, although compressive normal stressesdominate most of the system, some isolated fault segments have
446 B. Smith-Konter, R.T. Pappalardo / Icarus 198 (2008) 435–451
Fig. 9. Horizontally projected fault-parallel displacements shown at 40◦ intervals of the orbital position (mean anomaly, m), draped over a Cassini image mosaic of Enceladus’ssouth polar region. Each plot represents relative fault-parallel displacement integrated over a 10◦ interval. The color scale is saturated at ±40 mm, where large coseismic slipevents (on the order of 0.1 m) are revealed as intense zones of deformation and small creeping events (on the order of 10 mm over a 10◦ interval) are revealed as subtlerelative deformation. Model parameters are as assumed in Figs. 7 and 8, but displacements here are calculated at the surface.
met the failure criterion and exhibit large left-lateral displace-ments. Note the saturated colors, corresponding to ∼0.4 m dis-placements, along small fault segments of the Alexandria, Cairo,and Damascus tiger stripes. Small left-lateral creeping displace-ments follow each large coseismic event and remain until ∼m =80◦ , where stresses begin to re-accumulate for a brief period oftime and left-lateral slip is limited to a few isolated fault seg-ments. Large right-lateral displacements of ∼0.3 m begin to appearat m = 120◦ and are followed by subsequent small right-lateralcreeping displacements. Note that right-lateral creep remains un-til m ≈ 280◦ , or until compressive stresses begin to increase whileright-lateral stresses decrease. A quiescent period occurs for the re-mainder of the cycle, as compressive stresses lock the tiger stripefault segments in place and faulting activity ceases. Animationsthat capture the variations in orbital behavior at smaller (10◦) in-crements can be viewed online at http://icymoons.com/tigerstripes.
These animations illustrate the predicted varying direction andmagnitude of fault displacements throughout the Enceladus tidalcycle.
Overall, maximum left-lateral displacements occur over a spanof the orbital cycle from periapse to m = 40◦ , where left-lateralshear stresses (and strain accumulation) are at a near maxi-mum. Alternatively, maximum right-lateral displacements occurfrom m = 120◦–200◦; however, coseismic right-lateral displace-ments are smaller in magnitude, in comparison to coseismic left-lateral displacements, because they occur at a time when shearstresses are smaller. Right-lateral creeping displacements dominatethe system for a significant period of time, however, adding tothe total right-lateral displacement. Depending on the length ofthe slip window, however, the sum of creeping displacements mayhave only a very minor impact on the net displacement. Variationsin the coefficient of friction, the overburden depth, and the H/d ra-
Shear failure of Enceladus’s tiger stripes 447
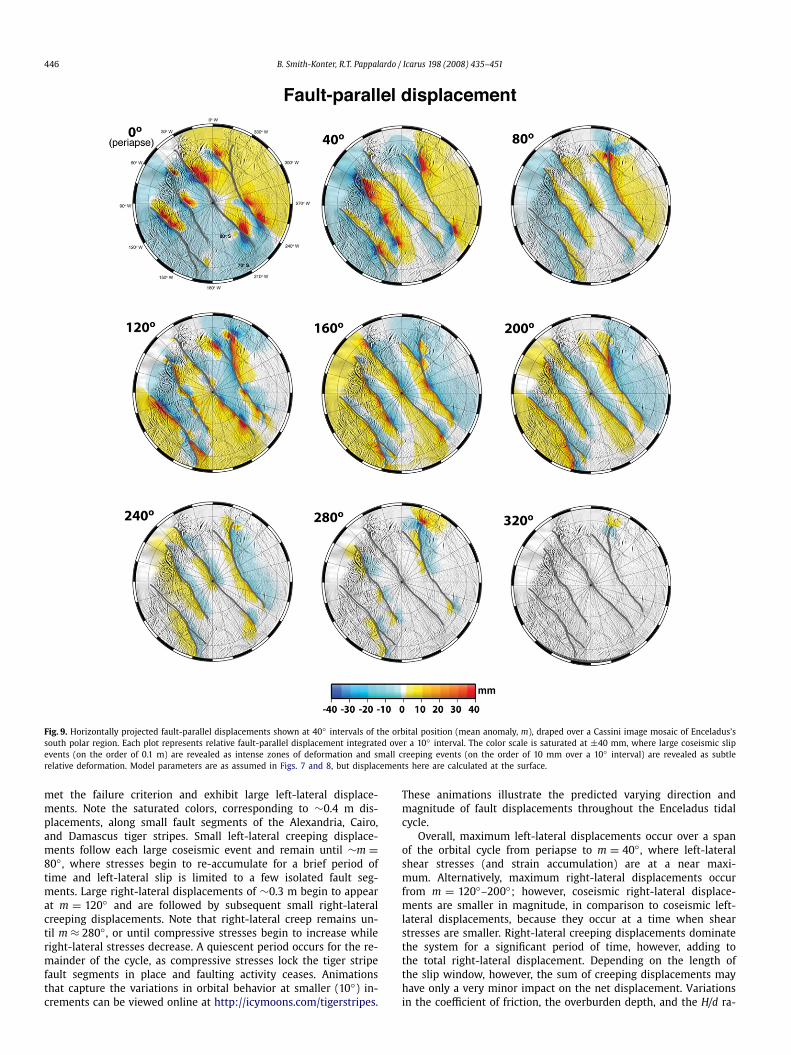
Fig. 10. Vertical surface displacements as a function of orbital position (mean anomaly, m). Each plot represents relative displacement integrated over a 10◦ period and isdraped over a Cassini image mosaic of Enceladus’s south polar region. Color scale is saturated at ±5 mm, where warm colors represent uplift and cool colors representsubsidence. Model parameters are as assumed in Figs. 7, 8, and 9.
tio will produce variable net displacements, as further discussed inSection 8.1.
In addition to horizontal displacements, vertical displacementsdriven by strike-slip lateral motions are also calculated (Fig. 10).These displacements span a range of 10 mm (±5 mm) of verti-cal uplift and subsidence, which are principally a result of vari-able fault slip and fault orientation along the length of eachtiger stripe. Vertical uplift is predicted at the restraining end ofa fault tip, while vertical subsidence is predicted at the releas-ing end. For a vertically oriented strike-slip fault dislocation, suchdisplacement is manifested as a small-wavelength butterfly-likepattern surrounding the failing fault segment, with two nodesof uplift and two nodes of subsidence, each at opposite ends ofthe fault segment (e.g., Deng et al., 1998; Pollitz et al., 2001;Smith and Sandwell, 2004). Because vertical deformation is de-pendent upon Possion’s ratio and is a direct response to a lateraldisplacement, vertical displacements are proportional to the fault-
parallel displacements illustrated in Fig. 9, but they are substan-tially smaller in magnitude. For the example model demonstratedhere, maximum subsidence and uplift are predicted near periapsein response to the large left-lateral offsets. Reversed vertical dis-placements are predicted near m = 120◦ . Vertical deformation ac-tivity decreases as the orbital cycle approaches periapse.
8. Discussion
8.1. Net displacements
If opportunities for both right- and left-lateral slip are avail-able over one complete orbital cycle, as demonstrated by Fig. 5, afault segment’s net displacement may cancel completely, providingno observable offset features. This special case would require thatthe cumulative sum of the coseismic displacement, plus additionalcreeping displacements, for both right- and left-lateral directions,are nearly equivalent. Alternatively, if cumulative displacements
448 B. Smith-Konter, R.T. Pappalardo / Icarus 198 (2008) 435–451
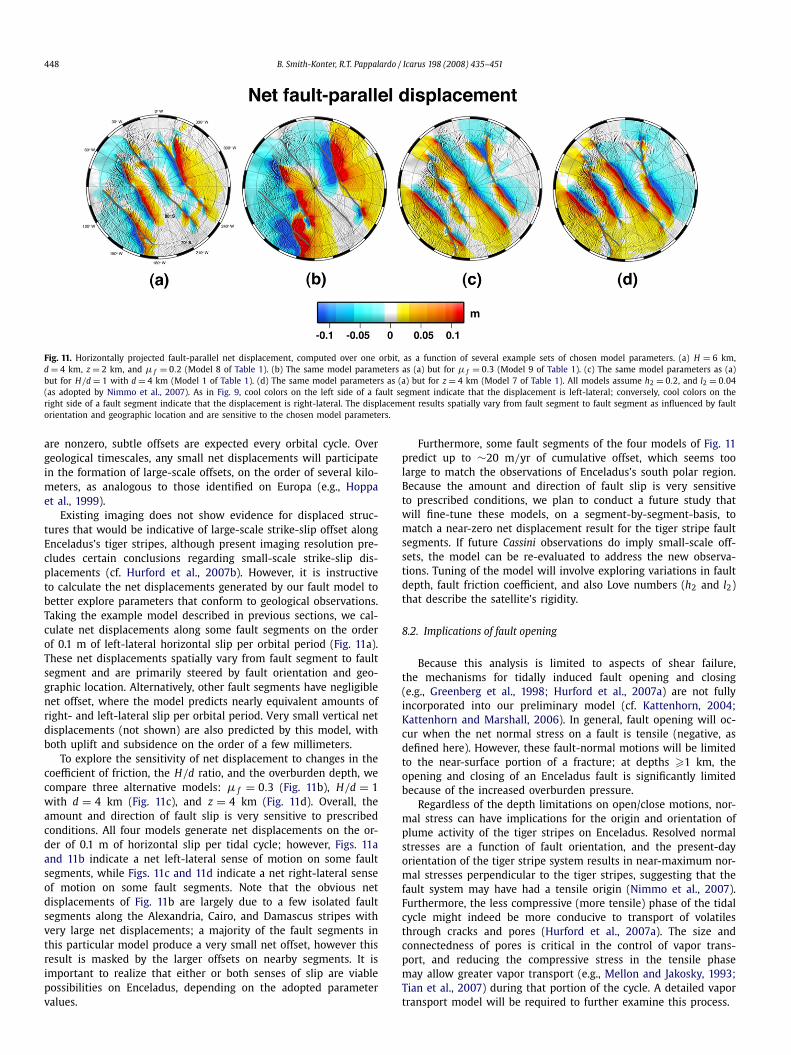
Fig. 11. Horizontally projected fault-parallel net displacement, computed over one orbit, as a function of several example sets of chosen model parameters. (a) H = 6 km,d = 4 km, z = 2 km, and μ f = 0.2 (Model 8 of Table 1). (b) The same model parameters as (a) but for μ f = 0.3 (Model 9 of Table 1). (c) The same model parameters as (a)but for H/d = 1 with d = 4 km (Model 1 of Table 1). (d) The same model parameters as (a) but for z = 4 km (Model 7 of Table 1). All models assume h2 = 0.2, and l2 = 0.04(as adopted by Nimmo et al., 2007). As in Fig. 9, cool colors on the left side of a fault segment indicate that the displacement is left-lateral; conversely, cool colors on theright side of a fault segment indicate that the displacement is right-lateral. The displacement results spatially vary from fault segment to fault segment as influenced by faultorientation and geographic location and are sensitive to the chosen model parameters.
are nonzero, subtle offsets are expected every orbital cycle. Overgeological timescales, any small net displacements will participatein the formation of large-scale offsets, on the order of several kilo-meters, as analogous to those identified on Europa (e.g., Hoppaet al., 1999).
Existing imaging does not show evidence for displaced struc-tures that would be indicative of large-scale strike-slip offset alongEnceladus’s tiger stripes, although present imaging resolution pre-cludes certain conclusions regarding small-scale strike-slip dis-placements (cf. Hurford et al., 2007b). However, it is instructiveto calculate the net displacements generated by our fault model tobetter explore parameters that conform to geological observations.Taking the example model described in previous sections, we cal-culate net displacements along some fault segments on the orderof 0.1 m of left-lateral horizontal slip per orbital period (Fig. 11a).These net displacements spatially vary from fault segment to faultsegment and are primarily steered by fault orientation and geo-graphic location. Alternatively, other fault segments have negligiblenet offset, where the model predicts nearly equivalent amounts ofright- and left-lateral slip per orbital period. Very small vertical netdisplacements (not shown) are also predicted by this model, withboth uplift and subsidence on the order of a few millimeters.
To explore the sensitivity of net displacement to changes in thecoefficient of friction, the H/d ratio, and the overburden depth, wecompare three alternative models: μ f = 0.3 (Fig. 11b), H/d = 1with d = 4 km (Fig. 11c), and z = 4 km (Fig. 11d). Overall, theamount and direction of fault slip is very sensitive to prescribedconditions. All four models generate net displacements on the or-der of 0.1 m of horizontal slip per tidal cycle; however, Figs. 11aand 11b indicate a net left-lateral sense of motion on some faultsegments, while Figs. 11c and 11d indicate a net right-lateral senseof motion on some fault segments. Note that the obvious netdisplacements of Fig. 11b are largely due to a few isolated faultsegments along the Alexandria, Cairo, and Damascus stripes withvery large net displacements; a majority of the fault segments inthis particular model produce a very small net offset, however thisresult is masked by the larger offsets on nearby segments. It isimportant to realize that either or both senses of slip are viablepossibilities on Enceladus, depending on the adopted parametervalues.
Furthermore, some fault segments of the four models of Fig. 11predict up to ∼20 m/yr of cumulative offset, which seems toolarge to match the observations of Enceladus’s south polar region.Because the amount and direction of fault slip is very sensitiveto prescribed conditions, we plan to conduct a future study thatwill fine-tune these models, on a segment-by-segment-basis, tomatch a near-zero net displacement result for the tiger stripe faultsegments. If future Cassini observations do imply small-scale off-sets, the model can be re-evaluated to address the new observa-tions. Tuning of the model will involve exploring variations in faultdepth, fault friction coefficient, and also Love numbers (h2 and l2)that describe the satellite’s rigidity.
8.2. Implications of fault opening
Because this analysis is limited to aspects of shear failure,the mechanisms for tidally induced fault opening and closing(e.g., Greenberg et al., 1998; Hurford et al., 2007a) are not fullyincorporated into our preliminary model (cf. Kattenhorn, 2004;Kattenhorn and Marshall, 2006). In general, fault opening will oc-cur when the net normal stress on a fault is tensile (negative, asdefined here). However, these fault-normal motions will be limitedto the near-surface portion of a fracture; at depths �1 km, theopening and closing of an Enceladus fault is significantly limitedbecause of the increased overburden pressure.
Regardless of the depth limitations on open/close motions, nor-mal stress can have implications for the origin and orientation ofplume activity of the tiger stripes on Enceladus. Resolved normalstresses are a function of fault orientation, and the present-dayorientation of the tiger stripe system results in near-maximum nor-mal stresses perpendicular to the tiger stripes, suggesting that thefault system may have had a tensile origin (Nimmo et al., 2007).Furthermore, the less compressive (more tensile) phase of the tidalcycle might indeed be more conducive to transport of volatilesthrough cracks and pores (Hurford et al., 2007a). The size andconnectedness of pores is critical in the control of vapor trans-port, and reducing the compressive stress in the tensile phasemay allow greater vapor transport (e.g., Mellon and Jakosky, 1993;Tian et al., 2007) during that portion of the cycle. A detailed vaportransport model will be required to further examine this process.
Shear failure of Enceladus’s tiger stripes 449
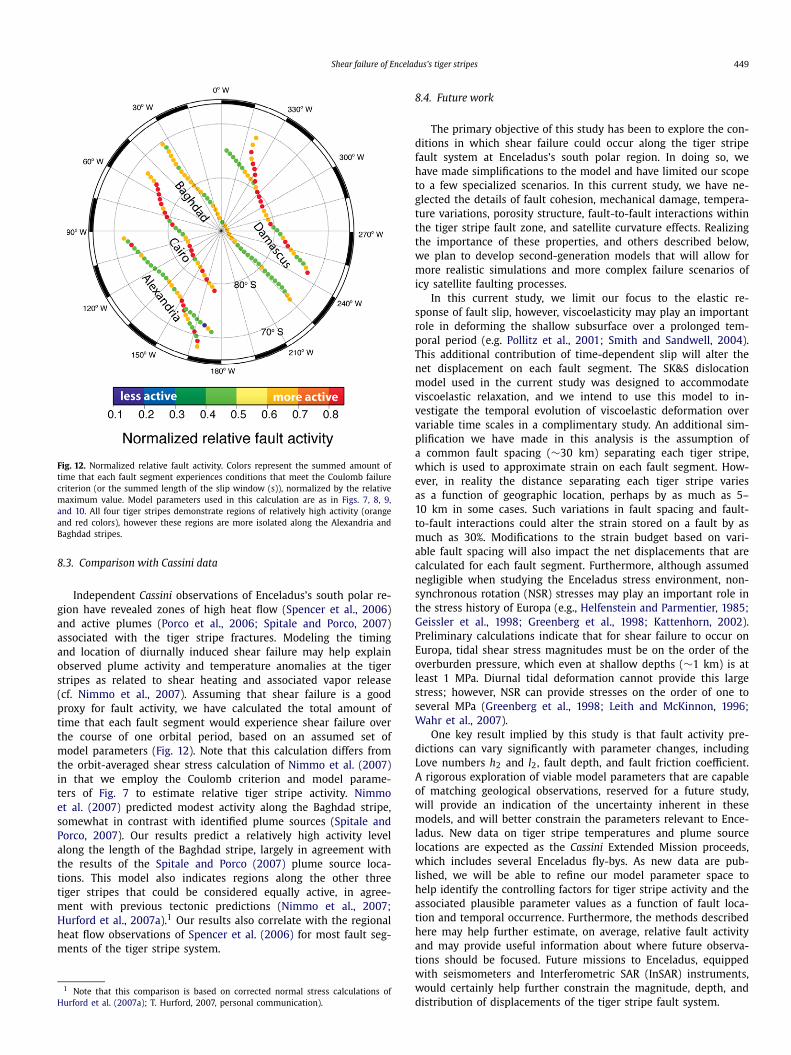
Fig. 12. Normalized relative fault activity. Colors represent the summed amount oftime that each fault segment experiences conditions that meet the Coulomb failurecriterion (or the summed length of the slip window (s)), normalized by the relativemaximum value. Model parameters used in this calculation are as in Figs. 7, 8, 9,and 10. All four tiger stripes demonstrate regions of relatively high activity (orangeand red colors), however these regions are more isolated along the Alexandria andBaghdad stripes.
8.3. Comparison with Cassini data
Independent Cassini observations of Enceladus’s south polar re-gion have revealed zones of high heat flow (Spencer et al., 2006)and active plumes (Porco et al., 2006; Spitale and Porco, 2007)associated with the tiger stripe fractures. Modeling the timingand location of diurnally induced shear failure may help explainobserved plume activity and temperature anomalies at the tigerstripes as related to shear heating and associated vapor release(cf. Nimmo et al., 2007). Assuming that shear failure is a goodproxy for fault activity, we have calculated the total amount oftime that each fault segment would experience shear failure overthe course of one orbital period, based on an assumed set ofmodel parameters (Fig. 12). Note that this calculation differs fromthe orbit-averaged shear stress calculation of Nimmo et al. (2007)in that we employ the Coulomb criterion and model parame-ters of Fig. 7 to estimate relative tiger stripe activity. Nimmoet al. (2007) predicted modest activity along the Baghdad stripe,somewhat in contrast with identified plume sources (Spitale andPorco, 2007). Our results predict a relatively high activity levelalong the length of the Baghdad stripe, largely in agreement withthe results of the Spitale and Porco (2007) plume source loca-tions. This model also indicates regions along the other threetiger stripes that could be considered equally active, in agree-ment with previous tectonic predictions (Nimmo et al., 2007;Hurford et al., 2007a).1 Our results also correlate with the regionalheat flow observations of Spencer et al. (2006) for most fault seg-ments of the tiger stripe system.
1 Note that this comparison is based on corrected normal stress calculations ofHurford et al. (2007a); T. Hurford, 2007, personal communication).
8.4. Future work
The primary objective of this study has been to explore the con-ditions in which shear failure could occur along the tiger stripefault system at Enceladus’s south polar region. In doing so, wehave made simplifications to the model and have limited our scopeto a few specialized scenarios. In this current study, we have ne-glected the details of fault cohesion, mechanical damage, tempera-ture variations, porosity structure, fault-to-fault interactions withinthe tiger stripe fault zone, and satellite curvature effects. Realizingthe importance of these properties, and others described below,we plan to develop second-generation models that will allow formore realistic simulations and more complex failure scenarios oficy satellite faulting processes.
In this current study, we limit our focus to the elastic re-sponse of fault slip, however, viscoelasticity may play an importantrole in deforming the shallow subsurface over a prolonged tem-poral period (e.g. Pollitz et al., 2001; Smith and Sandwell, 2004).This additional contribution of time-dependent slip will alter thenet displacement on each fault segment. The SK&S dislocationmodel used in the current study was designed to accommodateviscoelastic relaxation, and we intend to use this model to in-vestigate the temporal evolution of viscoelastic deformation overvariable time scales in a complimentary study. An additional sim-plification we have made in this analysis is the assumption ofa common fault spacing (∼30 km) separating each tiger stripe,which is used to approximate strain on each fault segment. How-ever, in reality the distance separating each tiger stripe variesas a function of geographic location, perhaps by as much as 5–10 km in some cases. Such variations in fault spacing and fault-to-fault interactions could alter the strain stored on a fault by asmuch as 30%. Modifications to the strain budget based on vari-able fault spacing will also impact the net displacements that arecalculated for each fault segment. Furthermore, although assumednegligible when studying the Enceladus stress environment, non-synchronous rotation (NSR) stresses may play an important role inthe stress history of Europa (e.g., Helfenstein and Parmentier, 1985;Geissler et al., 1998; Greenberg et al., 1998; Kattenhorn, 2002).Preliminary calculations indicate that for shear failure to occur onEuropa, tidal shear stress magnitudes must be on the order of theoverburden pressure, which even at shallow depths (∼1 km) is atleast 1 MPa. Diurnal tidal deformation cannot provide this largestress; however, NSR can provide stresses on the order of one toseveral MPa (Greenberg et al., 1998; Leith and McKinnon, 1996;Wahr et al., 2007).
One key result implied by this study is that fault activity pre-dictions can vary significantly with parameter changes, includingLove numbers h2 and l2, fault depth, and fault friction coefficient.A rigorous exploration of viable model parameters that are capableof matching geological observations, reserved for a future study,will provide an indication of the uncertainty inherent in thesemodels, and will better constrain the parameters relevant to Ence-ladus. New data on tiger stripe temperatures and plume sourcelocations are expected as the Cassini Extended Mission proceeds,which includes several Enceladus fly-bys. As new data are pub-lished, we will be able to refine our model parameter space tohelp identify the controlling factors for tiger stripe activity and theassociated plausible parameter values as a function of fault loca-tion and temporal occurrence. Furthermore, the methods describedhere may help further estimate, on average, relative fault activityand may provide useful information about where future observa-tions should be focused. Future missions to Enceladus, equippedwith seismometers and Interferometric SAR (InSAR) instruments,would certainly help further constrain the magnitude, depth, anddistribution of displacements of the tiger stripe fault system.
450 B. Smith-Konter, R.T. Pappalardo / Icarus 198 (2008) 435–451
9. Conclusions
In this study we investigate the conditions necessary for tidallydriven tectonic faulting on Enceladus using methods derived fromtidal stress models and terrestrial earthquake physics. Our crit-ical objectives are to understand and compute Coulomb failureconditions to assess the variability of fault failure (in both timeand space) throughout the Enceladus orbital cycle and to simulatestress accumulation at depth and resulting horizontal and verti-cal surface displacements along the tiger stripes. We find that thetiger stripe fault segments can accumulate up to ∼70 kPa of shearstress, at 2 km depth, before meeting the Coulomb failure crite-rion and generating a strike-slip event. Displacements modeled bya single coseismic slip event can be as large as 0.5 m in the hor-izontal direction and 5 mm in the vertical direction. We have ex-plored the significance of the coefficient of friction and the depthdependency of a fault, and have showed that a combined lowercoefficient of friction (μ f = 0.2) and more shallow fault depthwith respect to the elastic layer thickness (H = 6 km, d = 4 km,z = 2 km) are conducive to fault activity on Enceladus. Alterna-tive combinations of model parameters have also been explored(μ f = 0.1–0.6, H = 4–8 km, d = 4–8 km, z = 2–4 km), howevernot all of these models produce the conditions that satisfy theCoulomb failure criterion. We find that either or both right- andleft-lateral senses of slip are viable possibilities on Enceladus andthat net displacements computed for these models are on the or-der of 0.1 m per orbital cycle. Tectonic activity at the tiger stripesinferred from these analyses correlates with observed plume activ-ity and temperature anomalies at Enceladus’s south polar region.Given recent and expected Cassini data supporting geological ac-tivity at Enceladus’s south polar region, we intend to focus futurework on deriving a set of model parameters that best match thespatial and temporal diversity of active faults. Future applicationsof the methods described here are valid for deformation studies oficy satellites of the outer Solar System where diurnal and/or non-synchronous rotation stress variations are important.
Acknowledgments
We thank Scott Marshall and Bruce Bills for their extremelyhelpful comments for improving this manuscript and clarifyingthe model. We also thank Zane Selvans for providing both ac-cess and thorough guidance in the use and application of Sat-Stress. We acknowledge the GIS mapping efforts of DamhnaitGleeson. We also thank Francis Nimmo, Simon Kattenhorn, BruceBills, David Sandwell, and Terry Hurford for their valuable dis-cussions and suggestions related to the research presented here.This research was supported by the NASA Outer Planets ResearchProgram (NNG06GF44G), the Jet Propulsion Laboratory’s Director’sFellowship Program, and the JPL-Caltech Postdoctoral Scholars Pro-gram. The research described in this paper was carried out at theJet Propulsion Laboratory, California Institute of Technology, undera contract with the National Aeronautics and Space Administra-tion.
References
Bart, G.D., Turtle, E.P., Jaeger, W.L., Keszthelyi, L.P., Greenberg, R., 2004. Ridges andtidal stress on Io. Icarus 169, 111–112.
Beeman, M., Durham, W.B., Kirby, S.H., 1988. Friction of ice. J. Geophys. Res. 93,7625–7633.
Bindschadler, R.A., King, M.A., Alley, R.B., Anandakrishnan, S., Padman, L., 2003.Tidally controlled stick-slip discharge of a West Antarctic ice stream. Science 22,1087–1089.
Brace, W.F., Byerlee, J.D., 1966. Stick-slip as a mechanism for earthquakes. Sci-ence 153, 990–992.
Brace, W.F., Kohlstedt, D.L., 1980. Limits on lithospheric stress imposed by laboratoryexperiments. J. Geophys. Res. 85, 6248–6252.
Byerlee, J.D., 1978. Friction of rocks. Pure Appl. Geophys. 116, 615–626.Cochran, E.S., Vidale, J.E., Tanaka, S., 2004. Earth tides can trigger shallow thrust
fault earthquakes. Science 306, 1164–1166.Croft, S.K., Kargel, J.S., Kirk, R.L., Moore, J.M., Schenk, P.M., Strom, R.G., 1995. The
geology of Triton. In: Cruikshank, D.P. (Ed.), Neptune and Triton. University ofArizona Press, Tucson, pp. 879–947.
Deng, J., Gurnis, M., Kanamori, H., Hauksson, E., 1998. Viscoelastic flow in the lowercrust after the 1992 Landers, California, earthquake. Science 282, 1689–1692.
Dombard, A.J., 2007. Planetary science: Cracks under stress. Nature 447, 276–277.Figueredo, P.H., Greeley, R., 2000. Geologic mapping of the northern leading hemi-
sphere of Europa from Galileo solid-state imaging data. J. Geophys. Res. 105,22629–22646.
Fortt, A.L., Schulson, E.M., 2007. The resistance to sliding along Coulombic shearfaults in ice. Acta Mater. 55, 2253–2264.
Geissler, P.E., Greenberg, R., Hoppa, G., Helfenstein, P., McEwen, A., Pappalardo, R.,Tufts, R., Ockert-Bell, M., Sullivan, R., Greeley, R., Belton, M.J.S., Denk, T., Clark,B.E., Burns, J., Veverka, J., 1998. Evidence for non-synchronous rotation of Eu-ropa. Nature 391, 368–370.
Greenberg, R., Geissler, P., Hoppa, G., Tufts, B.R., Durda, D.D., Pappalardo, R., Head,J.W., Greeley, R., Sullivan, R., Carr, M.H., 1998. Tectonic processes on Europa:Tidal stresses, mechanical response and visible features. Icarus 135, 64–78.
Head, J.W., Pappalardo, R.T., Sullivan, R., 1999. Europa: Morphological characteristicsof ridges and triple bands from Galileo data (E4 and E6) and assessment of alinear diapirism model. J. Geophys. Res. 104, 24223–24236.
Helfenstein, P., Parmentier, E.M., 1985. Patterns of fracture and tidal stresses due tononsynchronous rotation: Implications for fracturing on Europa. Icarus 61, 175–184.
Hoppa, G.V., 1998. Europa: Effects of rotation and tides on tectonic processes. Ph.D.Thesis. University of Arizona, 227 pp.
Hoppa, G., Tufts, B.R., Greenberg, R., Geissler, P., 1999. Strike-slip faults on Europa:Global shear patterns driven by tidal stress. Icarus 141, 287–298.
Hoppa, G.V., Tufts, B.R., Greenberg, R., Hurford, T.A., O’Brien, D.P., Geissler, P.E., 2001.Europa’s rate of rotation derived from the tectonic sequence in the AstypalaeaRegion. Icarus 153, 208–213.
Hurford, T.A., Helfenstein, P., Hoppa, G.V., Greenberg, R., Bills, B., 2007a. Eruptionsarising from tidally controlled periodic openings of rifts on Enceladus. Na-ture 447, 292–294.
Hurford, T.A., Bills, B.G., Helfenstein, P., Hamilton, D.P., Hoppa, G.V., Greenberg, R.,Purser, C.M., 2007b. Geological evidence that Enceladus librates about syn-chronous rotation. In: DPS Meeting. Abstract 02.05.
Kargel, J.S., Pozio, S., 1996. The volcanic and tectonic history of Enceladus. Icarus 119,385–404.
Kattenhorn, S.A., 2002. Nonsynchronous rotation evidence and fracture history inthe bright plains region, Europa. Icarus 157, 490–506.
Kattenhorn, S.A., 2004. Strike-slip fault evolution on Europa: Evidence from tailcrackgeometries. Icarus 172, 582–602.
Kattenhorn, S.A., Marshall, S.T., 2006. Fault-induced perturbed stress fields and as-sociated tensile and compressive deformation at fault tips in the ice shell ofEuropa: Implications for fault mechanics. J. Struct. Geol. 28, 2204–2221.
Kennedy, F.E., Schulson, E.M., Jones, D.E., 2000. The friction of ice on ice at lowsliding velocities. Philos. Mag. A 80, 1093–1110.
King, G.C.P., Cocco, M., 2001. Fault interaction by elastic stress changes: New cluesfrom earthquake sequences. Adv. Geophys. 44, 1–38.
King, G.C.P., Stein, R.S., Lin, J., 1994. Static stress changes and the triggering of earth-quakes. Bull. Seismol. Soc. Am. 84, 935–953.
Leith, A.C., McKinnon, W.B., 1996. Is there evidence for polar wander on Europa?Icarus 120, 387–398.
Maeno, N., Arakawa, M., Yasutome, A., Mizukami, N., Kanazawa, S., 2003. Ice–icefriction measurements and water lubrication and adhesion-shear mechanisms.Can. J. Phys. 81, 241–249.
Matsuyama, I., Nimmo, F., 2007. Rotational stability of tidally deformed planetarybodies. J. Geophys. Res. 112, doi:10.1029/2007JE002942. E11003.
McEwen, A.S., 1986. Tidal reorientation and the fracturing of Jupiter’s moon Europa.Nature 321, 49–51.
Melosh, H.J., 1975. Large impact craters and the Moon’s orientation. Earth Planet.Sci. Lett. 26, 353–360.
Melosh, H.J., 1977. Global tectonics of a despun planet. Icarus 31, 221–243.Mellon, M.T., Jakosky, B.M., 1993. Geographic variations in the thermal and diffusive
stability of ground ice on Mars. J. Geophys. Res. 98, 3345–3364.Nimmo, F., Gaidos, E., 2002. Thermal consequences of strike-slip motion on Europa.
J. Geophys. Res. 107, doi:10.1029/2000JE001476.Nimmo, F., Pappalardo, R.T., 2006. Diapir-induced reorientation of Saturn’s moon
Enceladus. Nature 441, 614–616.Nimmo, F., Schenk, P., 2006. Normal faulting on Europa: Implications for ice shell
properties. J. Struct. Geol. 28, 2194–2203.Nimmo, F., Spencer, J.R., Pappalardo, R.T., Mullen, M.E., 2007. Shear heating as the
origin of the plumes and heat flux on Enceladus. Nature 447, 289–291.Ojakangas, G.W., Stevenson, D.J., 1989. Thermal state of an ice shell on Europa.
Icarus 81, 220–241.

Shear failure of Enceladus’s tiger stripes 451
Okada, Y., 1985. Surface deformation due to shear and tensile faults in a half-space.Bull. Seismol. Soc. Am. 75, 1135–1154.
Okada, Y., 1992. Internal deformation due to shear and tensile faults in a half-space.Bull. Seismol. Soc. Am. 82, 1018–1040.
Pollitz, F.F., Wicks, C., Thatcher, W., 2001. Mantle flow beneath a continental strike-slip fault: Postseismic deformation after the 1999 Hector Mine earthquake. Sci-ence 293, 1814–1818.
Porco, C.C., Helfenstein, P., Thomas, P.C., Ingersoll, A.P., Wisdom, J., West, R., Neukum,G., Denk, T., Wagner, R., Roatsch, T., Kieffer, S., Turtle, E., McEwen, A., Johnson,T.V., Rathbun, J., Veverka, J., Wilson, D., Perry, J., Spitale, J., Brahic, A., Burns, J.A.,DelGenio, A.D., Dones, L., Murray, C.D., Squyres, S., 2006. Cassini observes theactive south pole of Enceladus. Science 311, 43–64.
Prockter, L.M., Pappalardo, R.T., Nimmo, F., 2005. A shear heating origin for ridgeson Triton. Geophys. Res. Lett. 32, doi:10.1029/2005GL022832.
Roatsch, T., Wahlisch, M., Hoffmeister, A., Kuhn, A., Neukum, G., Helfenstein, P.,Porco, C., 2008. High resolution Enceladus atlas derived from Cassini-ISS im-ages. Planet. Space Sci. 56, 109–116.
Rolandone, F., Bürgmann, R., Nadeau, R.M., 2004. The evolution of the seismic–aseismic transition during the earthquake cycle: Constraints from the time-de-pendent depth distributions of aftershocks. Geophys. Res. Lett. 31, doi:10.1029/2004GL021379.
Rundle, J.B., Jackson, D.D., 1977. A three-dimensional viscoelastic model of a strike-slip fault. Geophys. J. R. Astron. Soc. 49, 575–591.
Rybicki, K., 1971. The elastic residual field of a very long strike-slip fault in thepresence of a discontinuity. Bull. Seismol. Soc. Am. 61, 72–92.
Sandwell, D.T., Rosen, P., Moore, W., Gurrola, E., 2004. Radar interferometry for mea-suring tidal strains across cracks on Europa. J. Geophys. Res. 109, doi:10.1029/2004JE002276.
Sarid, A.R., Greenberg, R., Hoppa, G.V., Hurford, T.A., Tufts, B.R., Geissler, P., 2002.Polar wander and surface convergence of Europa’s ice shell: Evidence from asurvey of strike-slip displacement. Icarus 158, 24–41.
Savage, J.C., Prescott, W.H., 1978. Asthenosphere readjustment and the earthquakecycle. J. Geophys. Res. 83, 3369–3376.
Schenk, P., Matsuyama, I., Nimmo, F., 2008. True polar wander on Europa fromglobal-scale small-circle depressions. Nature 453, 368–371.
Schulson, E.M., 2002. On the origin of a wedge-crack within the icy crust of Europa.J. Geophys. Res. 107, doi:10.1029/2001JE001586.
Smith, B., Sandwell, D.T., 2003. Coulomb stress along the San Andreas Fault System.J. Geophys. Res. 108, doi:10.1029/2002JB002136.
Smith, B., Sandwell, D.T., 2004. A 3D semi-analytic viscoelastic model for time-dependent analyses of the earthquake cycle. J. Geophys. Res. 109, doi:10.1029/2004JB003185.
Smith, B., Sandwell, D.T., 2006. A model of the earthquake cycle along the San An-dreas Fault System over the past 1000 years. J. Geophys. Res. 111, doi:10.1029/2005JB003703.
Spaun, N.A., Pappalardo, R.T., Head, J.W., 2003. Evidence for shear failure informing near-equatorial lineae on Europa. J. Geophys. Res. 108, doi:10.1029/2001JE001499.
Spitale, J., Porco, C., 2007. Association of the jets of Enceladus with the warmestregions on its south-polar fractures. Science 449, 695–697.
Spencer, J.R., Pearl, J.C., Segura, M., Flasar, F.M., Mamoutkine, A., Romani, P., Buratti,B.J., Hendrix, A.R., Spilker, L.J., Lopes, R.M.C., 2006. Cassini encounters Enceladus:Background and the discovery of a south polar hot spot. Science 311, 1401–1405.
Squyres, S.W., Croft, S.K., 1986. The tectonics of icy satellites. In: Burns, J.A.,Matthews, M.S. (Eds.), Satellites. Univ. of Arizona Press, Tucson, pp. 293–341.
Stein, R.S., 1999. The role of stress transfer in earthquake occurrence. Nature 402,605–609.
Stein, R.S., 2003. Earthquake conversations. Sci. Am. 288, 72–79.Tian, F., Stewart, A.I.F., Toon, O.B., Larsen, K.W., Esposito, L.W., 2007. Monte Carlo
simulations of the water vapor plumes on Enceladus. Icarus 188, 154–161.Tufts, B.R., Greenberg, R., Hoppa, G., Geissler, P., 1999. Astypalaea Linea: A large-
scale strike-slip fault on Europa. Icarus 141, 53–64.Tufts, B.R., Greenberg, R., Hoppa, G., Geissler, P., 2000. Lithospheric dilation on Eu-
ropa. Icarus 146, 75–97.Turcotte, D.L., Schubert, G., 2002. Geodynamics. Cambridge Univ. Press, Cambridge.Wahr, J., 1981. Body tides on an elliptical, rotating, elastic and oceanless Earth. Geo-
phys. J. R. Astron. Soc. 64, 677–704.Wahr, J., Selvans, Z.A., Mullen, M.E., Barr, A.C., Collins, G.C., Selvans, M.M., Pap-
palardo, R.T., 2007. Modeling stresses on satellites due to nonsynchronous ro-tation and orbital eccentricity using gravitational potential theory. Icarus, sub-mitted for publication.
Weertman, J., 1964. Continuum distribution of dislocations on faults with finite fric-tion. Bull. Seismol. Soc. Am. 54, 1035–1058.
Wdowinski, S., Smith, B., Bock, Y., Sandwell, D.T., 2007. Spatial characterizationof the interseismic velocity field in southern California. Geology, doi:10.1130/G22938A.1.
Yoder, C.F., 1979. How tidal heating in Io drives the Galilean orbital resonance. Na-ture 279, 767–770.