Embed Size (px)
Citation preview
Tier 1 Biosimilarity Assessments
– A Practical Illustration
Keith M. Bower, M.S.Affiliate Assistant ProfessorDepartment of Pharmacy
Disclaimer
Views, opinions and statements made during this
presentation are solely those of the presenter and may
not reflect the views of the University of Washington or
other entities.
Overview
• Publically available guidance documents for biosimilarity assessments
• Three-tier approach for biosimilarity assessments
• Overview and rationale of statistical strategy for Tier 1 biosimilarity assessments
• Example of Tier 1 biosimilarity assessments using bioassay results
Description of biosimilars*
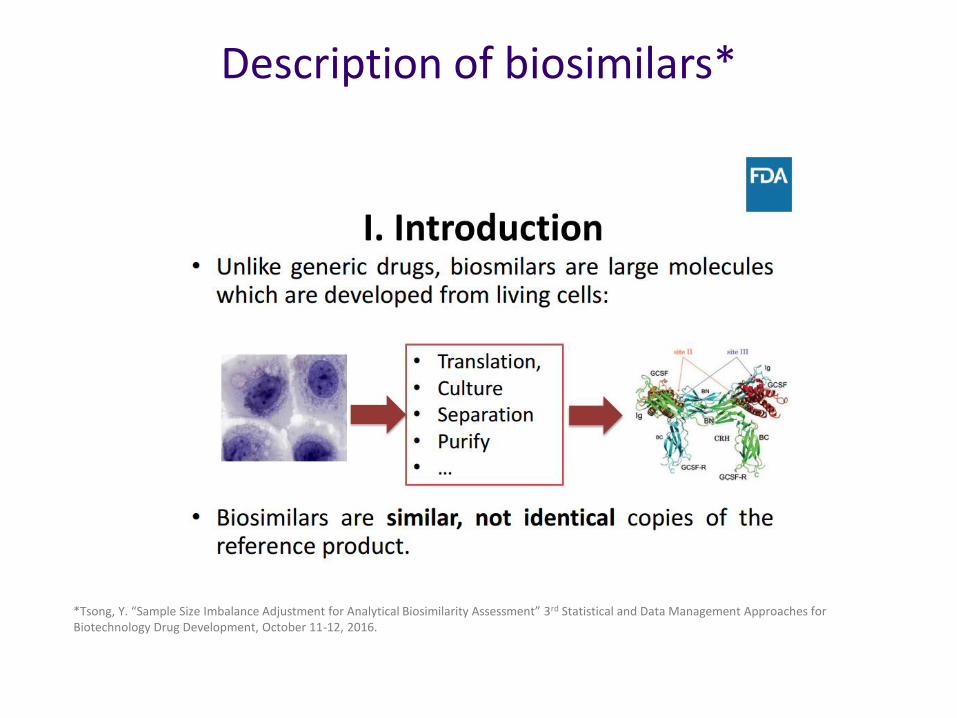
*Tsong, Y. “Sample Size Imbalance Adjustment for Analytical Biosimilarity Assessment” 3rd Statistical and Data Management Approaches for Biotechnology Drug Development, October 11-12, 2016.
Description of biosimilars*
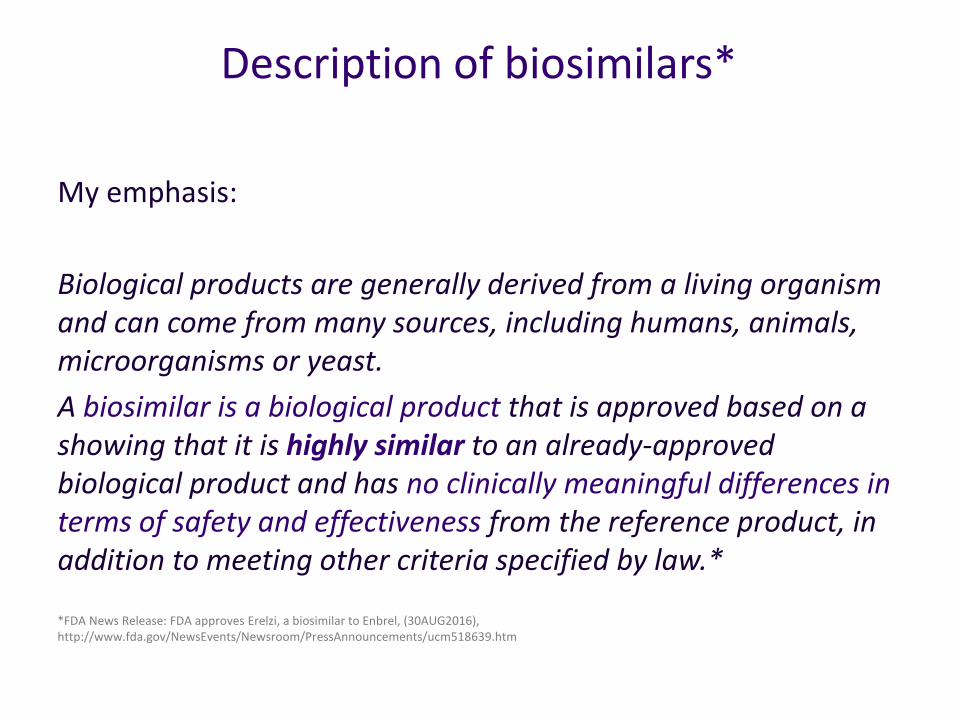
My emphasis:
Biological products are generally derived from a living organism and can come from many sources, including humans, animals, microorganisms or yeast.
A biosimilar is a biological product that is approved based on a showing that it is highly similar to an already-approved biological product and has no clinically meaningful differences in terms of safety and effectiveness from the reference product, in addition to meeting other criteria specified by law.*
*FDA News Release: FDA approves Erelzi, a biosimilar to Enbrel, (30AUG2016), http://www.fda.gov/NewsEvents/Newsroom/PressAnnouncements/ucm518639.htm
Background: relationship between biosimilarity and comparability exercises
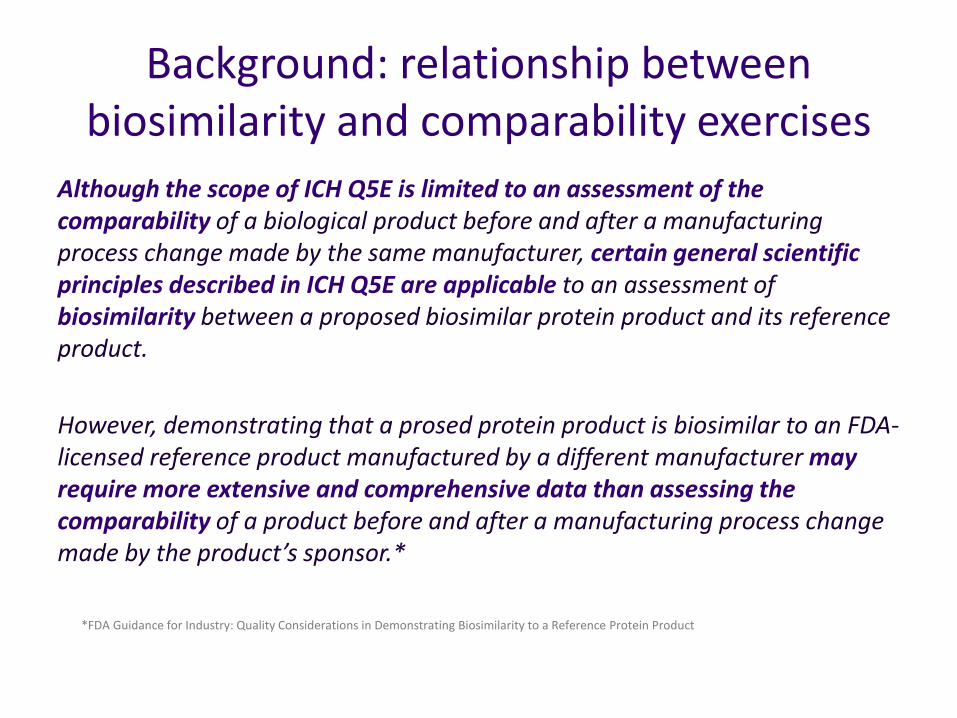
Although the scope of ICH Q5E is limited to an assessment of the comparability of a biological product before and after a manufacturing process change made by the same manufacturer, certain general scientific principles described in ICH Q5E are applicable to an assessment of biosimilarity between a proposed biosimilar protein product and its reference product.
However, demonstrating that a prosed protein product is biosimilar to an FDA-licensed reference product manufactured by a different manufacturer may require more extensive and comprehensive data than assessing the comparability of a product before and after a manufacturing process change made by the product’s sponsor.*
*FDA Guidance for Industry: Quality Considerations in Demonstrating Biosimilarity to a Reference Protein Product
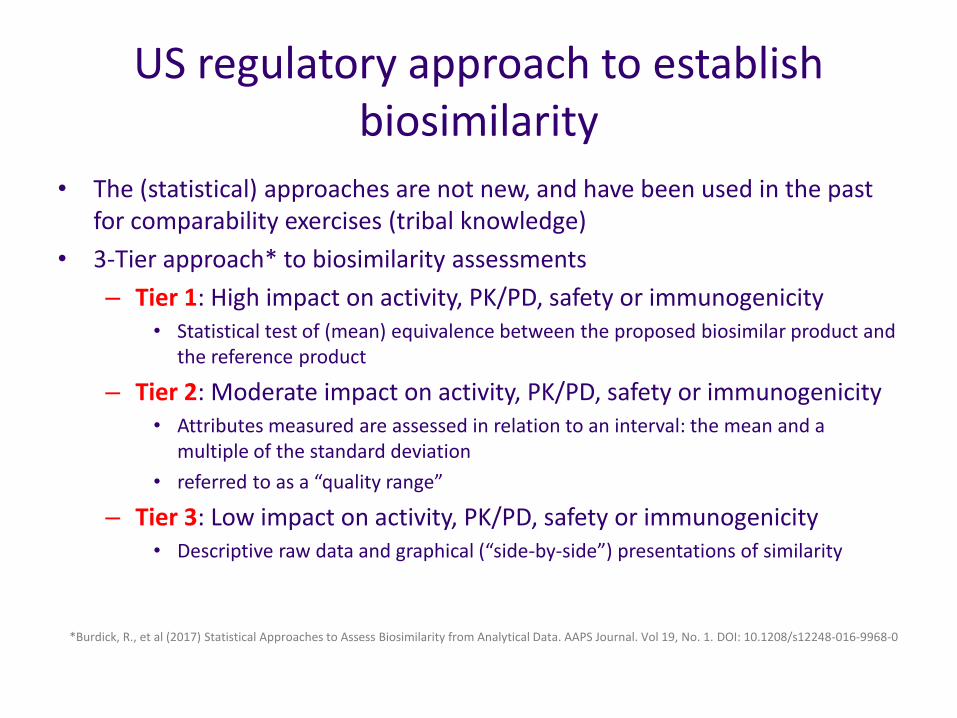
US regulatory approach to establish biosimilarity
• The (statistical) approaches are not new, and have been used in the past for comparability exercises (tribal knowledge)
• 3-Tier approach* to biosimilarity assessments
– Tier 1: High impact on activity, PK/PD, safety or immunogenicity• Statistical test of (mean) equivalence between the proposed biosimilar product and
the reference product
– Tier 2: Moderate impact on activity, PK/PD, safety or immunogenicity • Attributes measured are assessed in relation to an interval: the mean and a
multiple of the standard deviation
• referred to as a “quality range”
– Tier 3: Low impact on activity, PK/PD, safety or immunogenicity • Descriptive raw data and graphical (“side-by-side”) presentations of similarity
*Burdick, R., et al (2017) Statistical Approaches to Assess Biosimilarity from Analytical Data. AAPS Journal. Vol 19, No. 1. DOI: 10.1208/s12248-016-9968-0
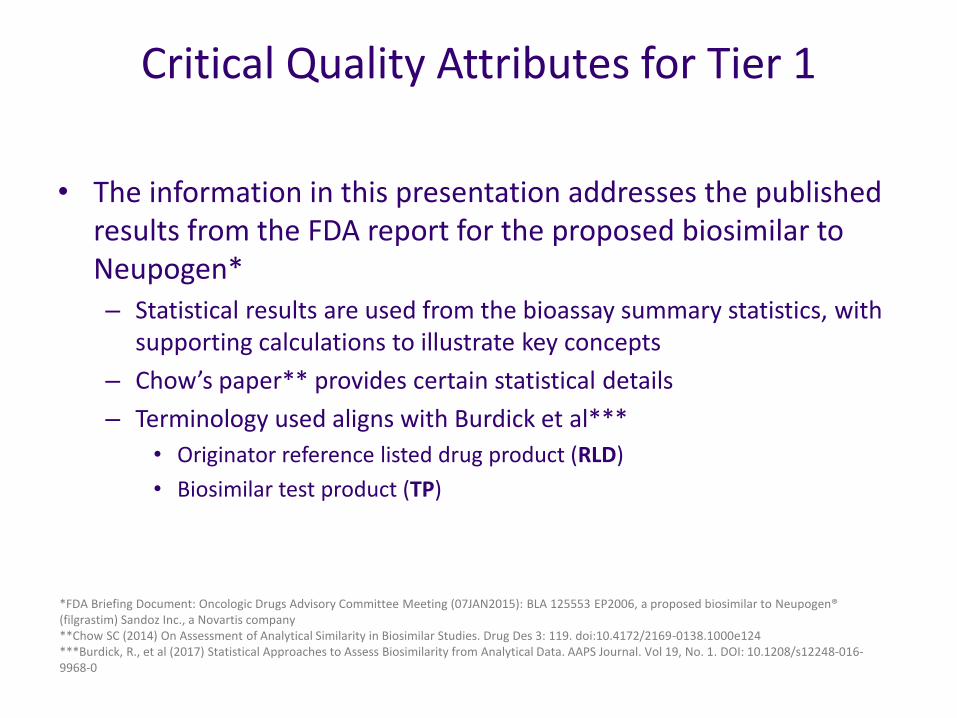
Critical Quality Attributes for Tier 1
• The information in this presentation addresses the published results from the FDA report for the proposed biosimilar to Neupogen*– Statistical results are used from the bioassay summary statistics, with
supporting calculations to illustrate key concepts
– Chow’s paper** provides certain statistical details
– Terminology used aligns with Burdick et al***
• Originator reference listed drug product (RLD)
• Biosimilar test product (TP)
*FDA Briefing Document: Oncologic Drugs Advisory Committee Meeting (07JAN2015): BLA 125553 EP2006, a proposed biosimilar to Neupogen® (filgrastim) Sandoz Inc., a Novartis company**Chow SC (2014) On Assessment of Analytical Similarity in Biosimilar Studies. Drug Des 3: 119. doi:10.4172/2169-0138.1000e124***Burdick, R., et al (2017) Statistical Approaches to Assess Biosimilarity from Analytical Data. AAPS Journal. Vol 19, No. 1. DOI: 10.1208/s12248-016-9968-0
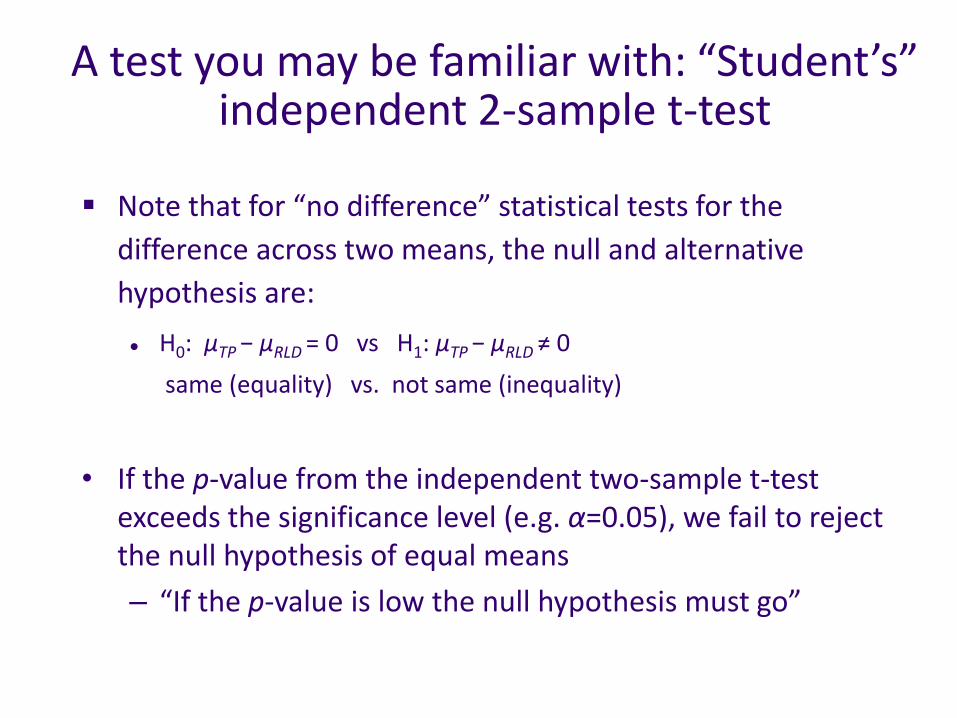
A test you may be familiar with: “Student’s”independent 2-sample t-test
Note that for “no difference” statistical tests for the
difference across two means, the null and alternative
hypothesis are:
● H0: μTP − μRLD = 0 vs H1: μTP − μRLD ≠ 0
same (equality) vs. not same (inequality)
• If the p-value from the independent two-sample t-test exceeds the significance level (e.g. α=0.05), we fail to reject the null hypothesis of equal means
– “If the p-value is low the null hypothesis must go”
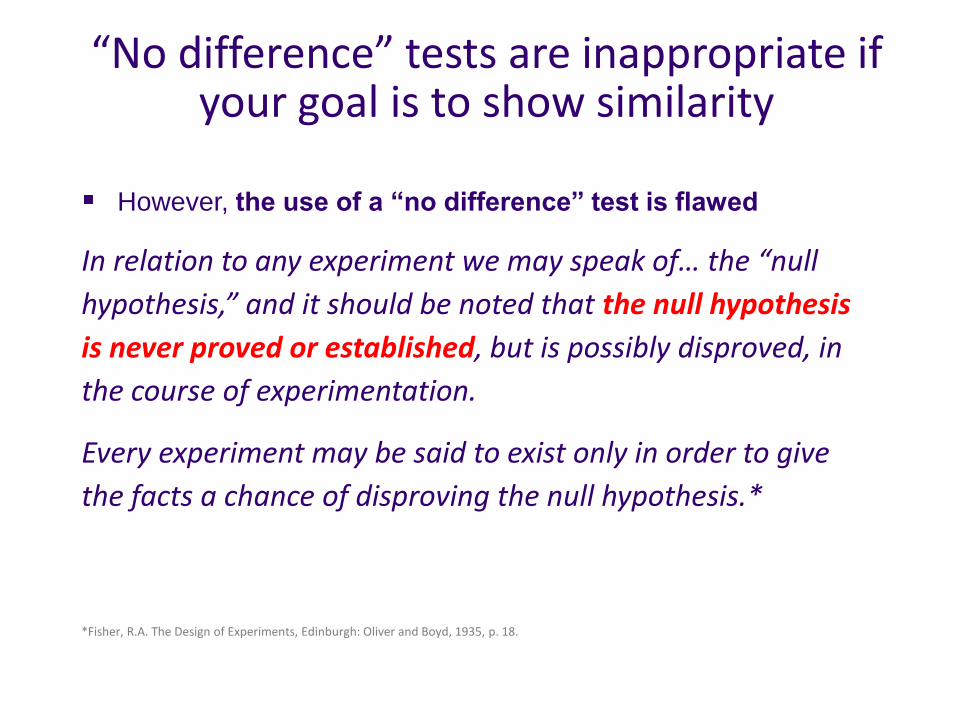
“No difference” tests are inappropriate if your goal is to show similarity
However, the use of a “no difference” test is flawed
In relation to any experiment we may speak of… the “null
hypothesis,” and it should be noted that the null hypothesis
is never proved or established, but is possibly disproved, in
the course of experimentation.
Every experiment may be said to exist only in order to give
the facts a chance of disproving the null hypothesis.*
*Fisher, R.A. The Design of Experiments, Edinburgh: Oliver and Boyd, 1935, p. 18.
Aside: this is the same argument against using the F-test for parallelism
• F-test for assessing parallelism between a reference lot (“Standard”) vs. test lot (“Test”) in the context of the Standard and test concentration–response curves:
o Null hypothesis: “no difference” (i.e. parallelism)
o Alternative hypothesis: “difference” (i.e. non-parallelism)
• If the p-value from the F-test exceeds (say) 0.05, fail to reject the null hypothesis and conclude parallelism
…failure to find that similarity is statistically improbable is then taken as a conclusion of similarity. In fact, however, this failure to establish a probabilistic basis for nonsimilarity does not prove similarity.*
*<1032> Design and Development of Biological Assays. USP 39. In: USP 39-NF 24. Vol. 1. Rockville (MD): United States Pharmacopeia Convention; 2016: 853.
Aside (cont.): parallelism considerations from the F-test
• You can obtain high p-values from the F-test for parallelism if:
1. Method variance is high, and/or
2. Number of observations is small and/or
3. There truly is a small difference across Standard and Test
• To obtain a more appropriate technique to assess parallelism, we should not be “punished” with increasing n and/or encountering reduced method variation
Because of the advantages associated with the use of equivalence testing in the assessment of similarity, analysts may transition existing assays to equivalence testing or may implement equivalence testing methods when changes are made to existing assays.*
*<1032> Design and Development of Biological Assays. USP 39. In: USP 39-NF 24. Vol. 1. Rockville (MD): United States Pharmacopeia Convention; 2016: 852.
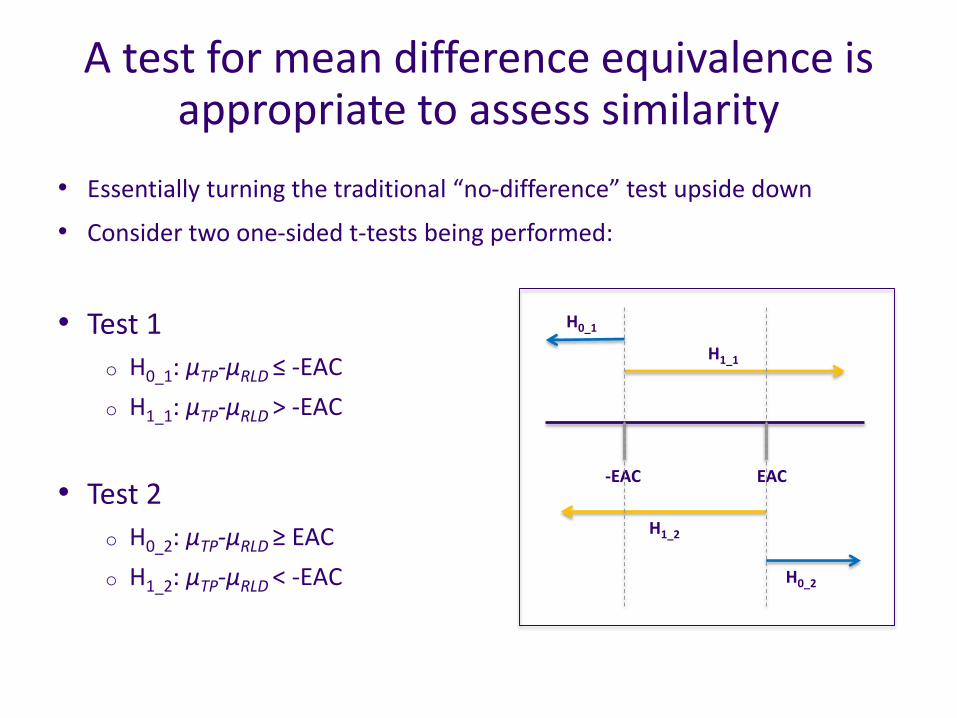
A test for mean difference equivalence is appropriate to assess similarity
• Essentially turning the traditional “no-difference” test upside down
• Consider two one-sided t-tests being performed:
• Test 1
o H0_1: µTP-µRLD ≤ -EAC
o H1_1: µTP-µRLD > -EAC
• Test 2
o H0_2: µTP-µRLD ≥ EAC
o H1_2: µTP-µRLD < -EAC
-EAC EAC
H0_1
H1_1
H0_2
H1_2
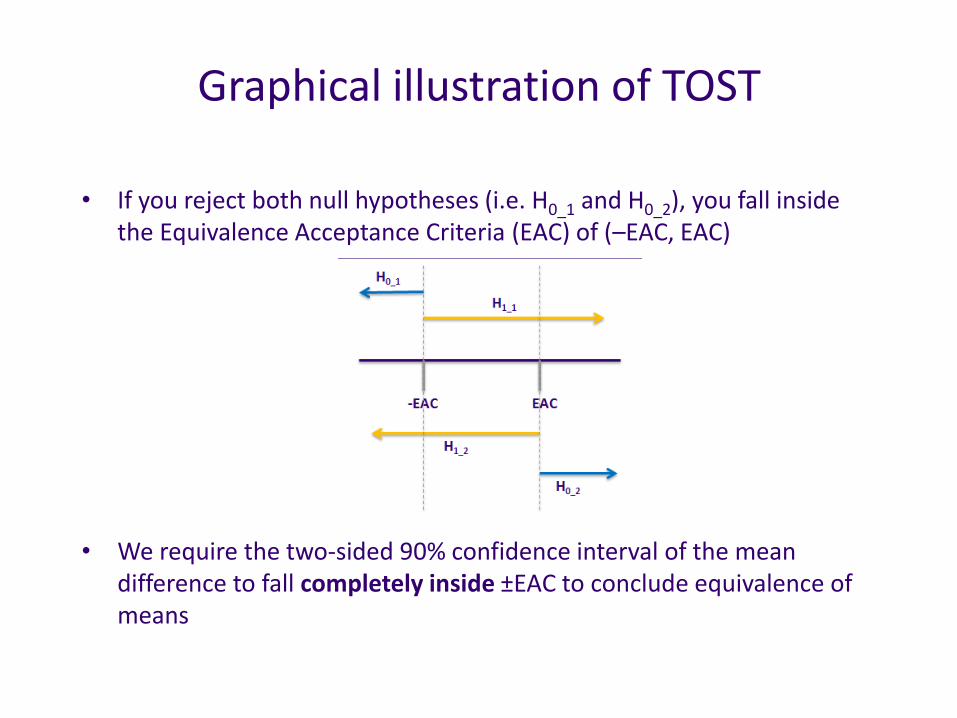
Graphical illustration of TOST
• If you reject both null hypotheses (i.e. H0_1 and H0_2), you fall inside the Equivalence Acceptance Criteria (EAC) of (–EAC, EAC)
• We require the two-sided 90% confidence interval of the mean difference to fall completely inside ±EAC to conclude equivalence of means
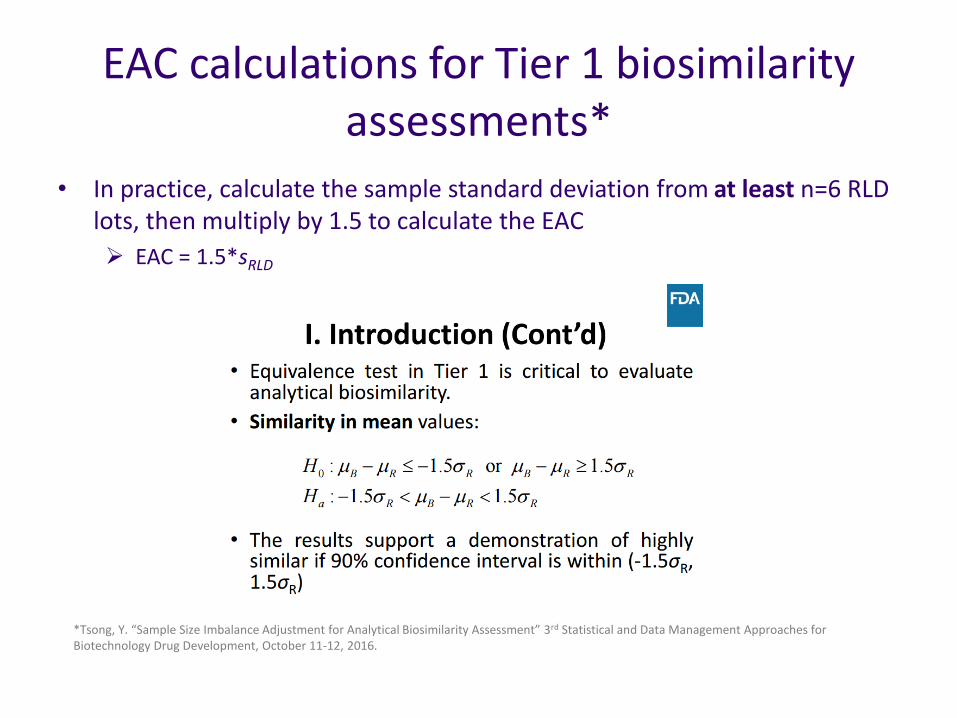
EAC calculations for Tier 1 biosimilarity assessments*
• In practice, calculate the sample standard deviation from at least n=6 RLD lots, then multiply by 1.5 to calculate the EAC
EAC = 1.5*sRLD
*Tsong, Y. “Sample Size Imbalance Adjustment for Analytical Biosimilarity Assessment” 3rd Statistical and Data Management Approaches for Biotechnology Drug Development, October 11-12, 2016.
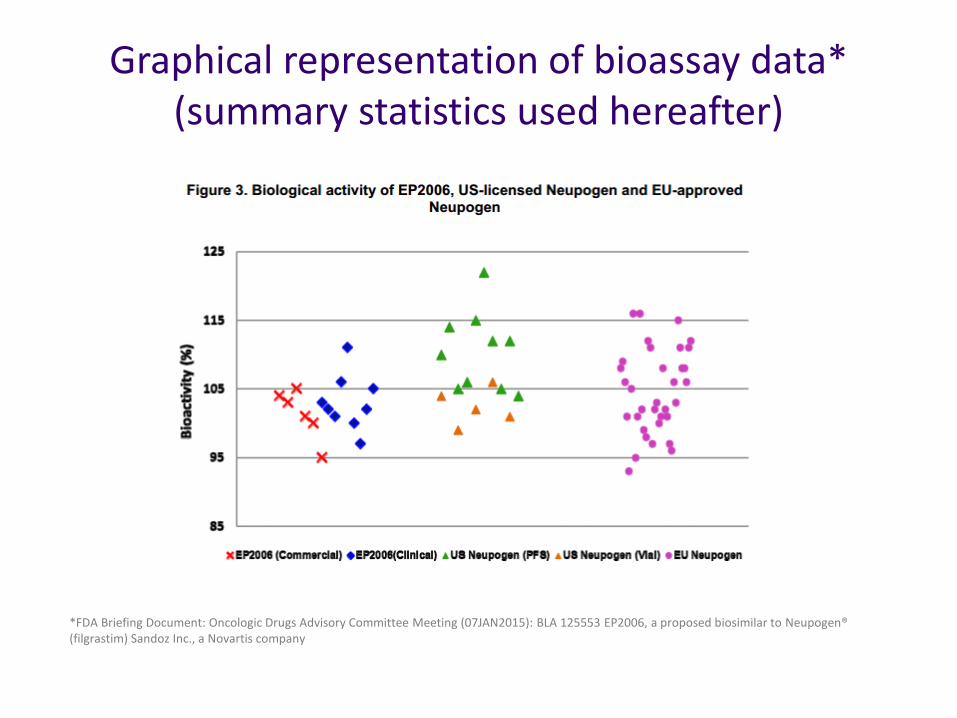
Graphical representation of bioassay data* (summary statistics used hereafter)
*FDA Briefing Document: Oncologic Drugs Advisory Committee Meeting (07JAN2015): BLA 125553 EP2006, a proposed biosimilar to Neupogen® (filgrastim) Sandoz Inc., a Novartis company
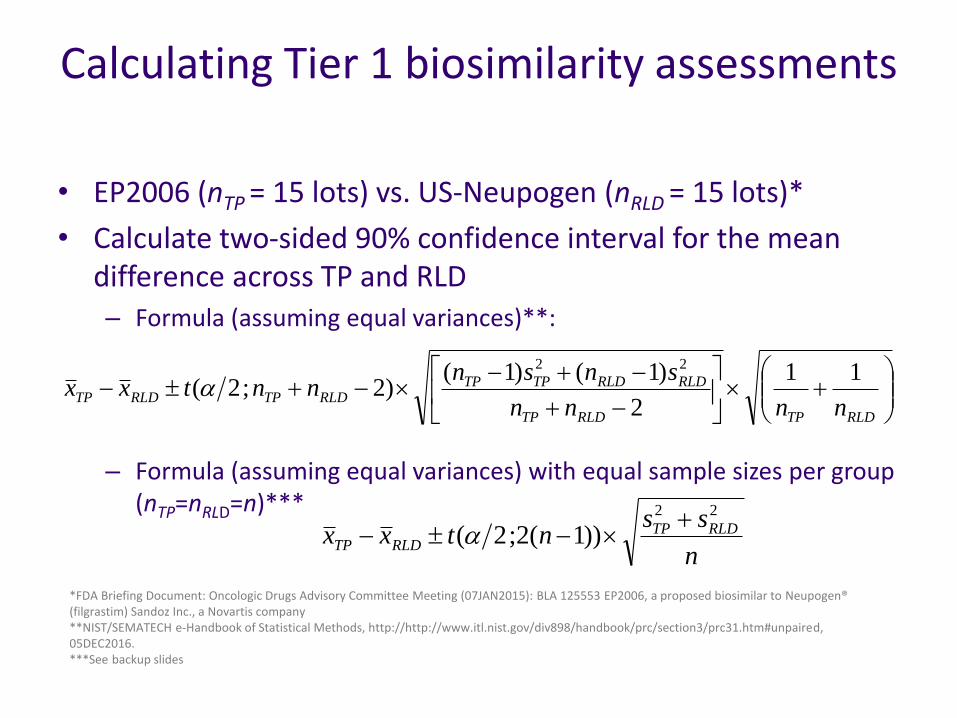
Calculating Tier 1 biosimilarity assessments
• EP2006 (nTP = 15 lots) vs. US-Neupogen (nRLD = 15 lots)*
• Calculate two-sided 90% confidence interval for the mean difference across TP and RLD– Formula (assuming equal variances)**:
– Formula (assuming equal variances) with equal sample sizes per group (nTP=nRLD=n)***
RLDTPRLDTP
RLDRLDTPTPRLDTPRLDTP
nnnn
snsnnntxx
11
2
)1()1()2;2(
22
*FDA Briefing Document: Oncologic Drugs Advisory Committee Meeting (07JAN2015): BLA 125553 EP2006, a proposed biosimilar to Neupogen® (filgrastim) Sandoz Inc., a Novartis company**NIST/SEMATECH e-Handbook of Statistical Methods, http://http://www.itl.nist.gov/div898/handbook/prc/section3/prc31.htm#unpaired, 05DEC2016.***See backup slides
n
ssntxx RLDTP
RLDTP
22
))1(2;2(
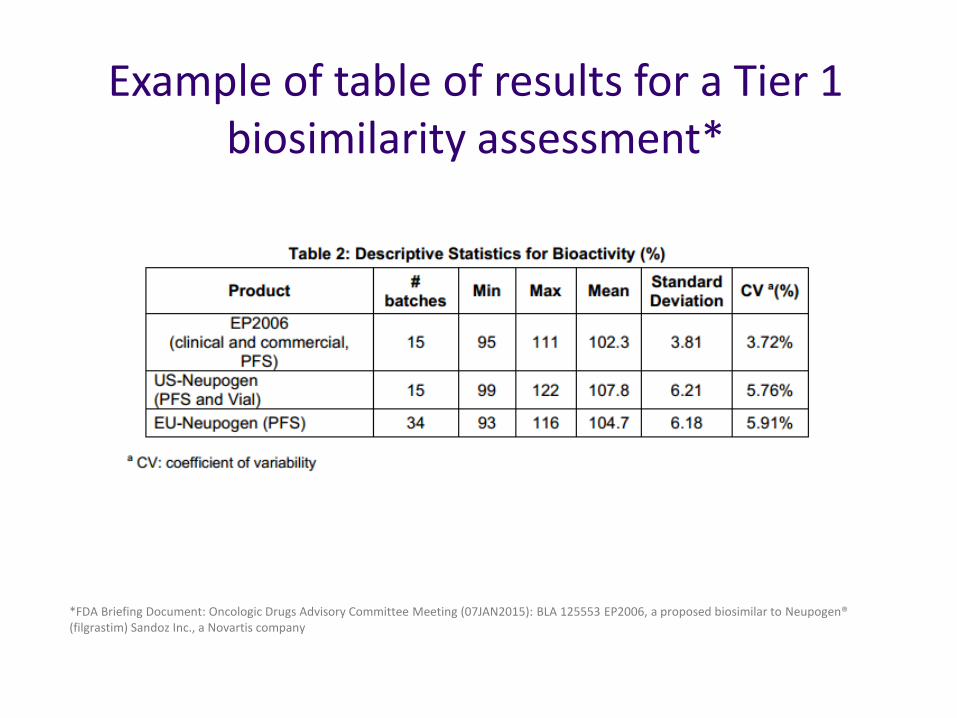
Example of table of results for a Tier 1 biosimilarity assessment*
*FDA Briefing Document: Oncologic Drugs Advisory Committee Meeting (07JAN2015): BLA 125553 EP2006, a proposed biosimilar to Neupogen® (filgrastim) Sandoz Inc., a Novartis company
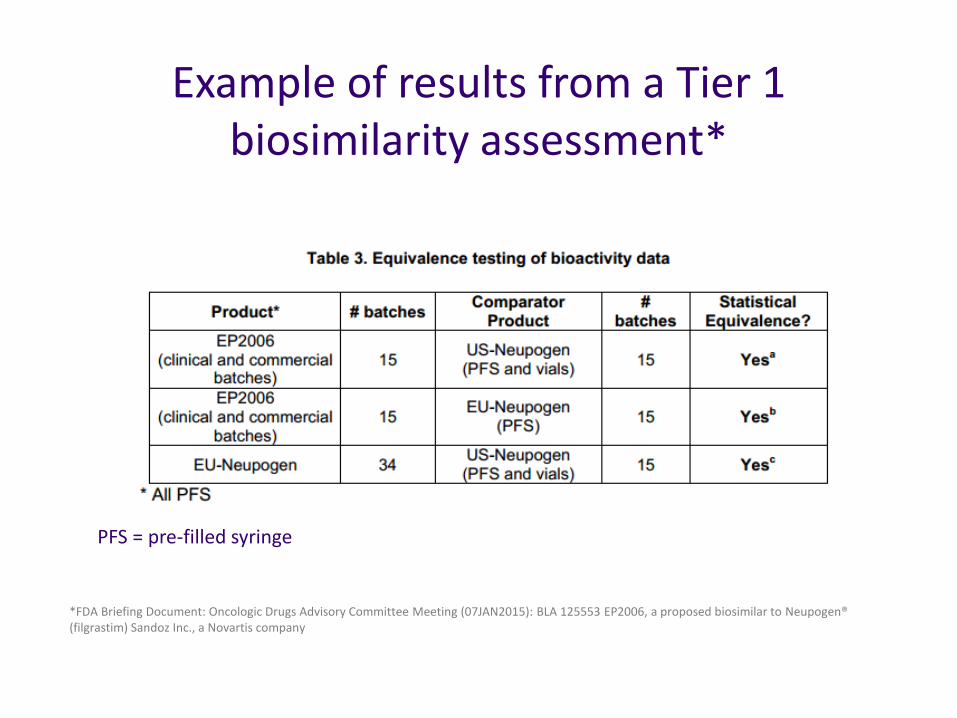
Example of results from a Tier 1 biosimilarity assessment*
*FDA Briefing Document: Oncologic Drugs Advisory Committee Meeting (07JAN2015): BLA 125553 EP2006, a proposed biosimilar to Neupogen® (filgrastim) Sandoz Inc., a Novartis company
PFS = pre-filled syringe
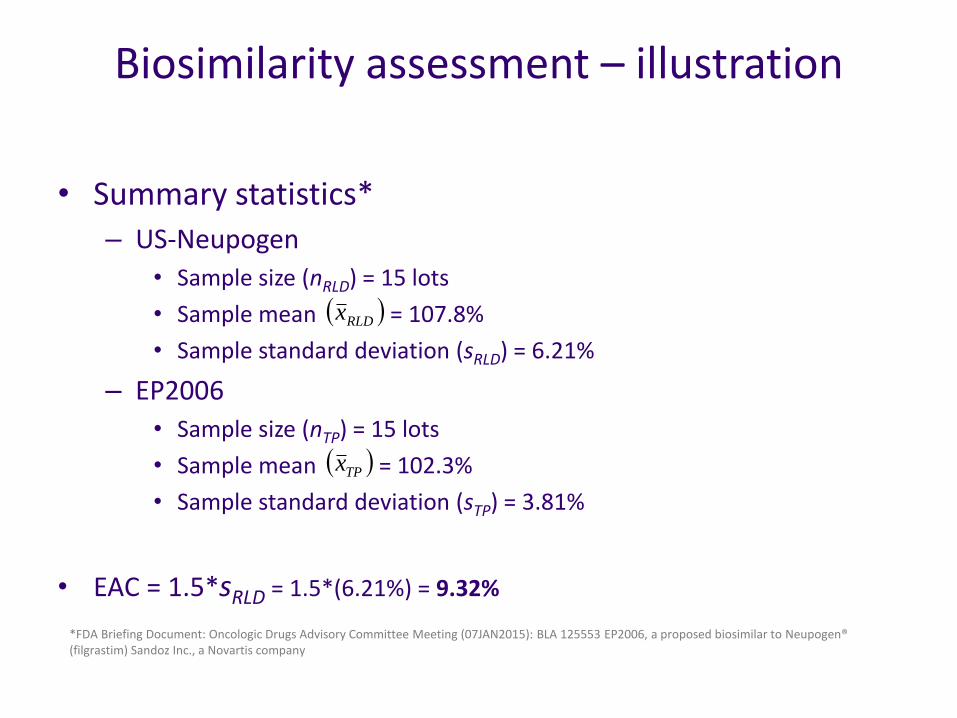
Biosimilarity assessment – illustration
• Summary statistics*
– US-Neupogen
• Sample size (nRLD) = 15 lots
• Sample mean = 107.8%
• Sample standard deviation (sRLD) = 6.21%
– EP2006
• Sample size (nTP) = 15 lots
• Sample mean = 102.3%
• Sample standard deviation (sTP) = 3.81%
• EAC = 1.5*sRLD = 1.5*(6.21%) = 9.32%
*FDA Briefing Document: Oncologic Drugs Advisory Committee Meeting (07JAN2015): BLA 125553 EP2006, a proposed biosimilar to Neupogen® (filgrastim) Sandoz Inc., a Novartis company
RLDx
TPx
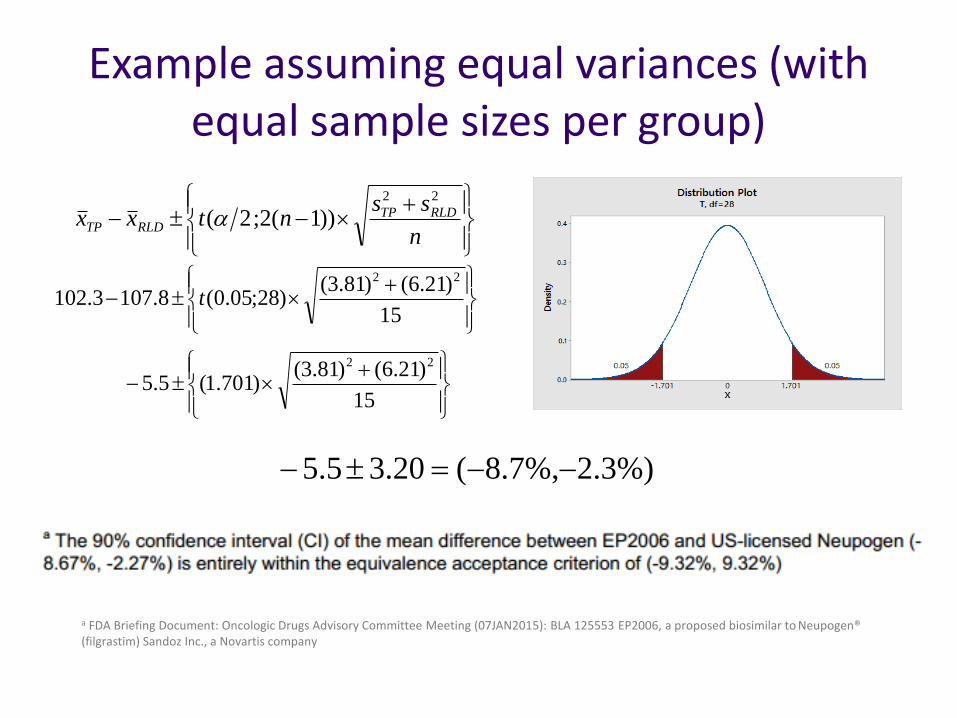
Example assuming equal variances (with equal sample sizes per group)
15
)21.6()81.3()28;05.0(8.1073.102
22
t
%)3.2%,7.8(20.35.5
a FDA Briefing Document: Oncologic Drugs Advisory Committee Meeting (07JAN2015): BLA 125553 EP2006, a proposed biosimilar to Neupogen® (filgrastim) Sandoz Inc., a Novartis company
n
ssntxx RLDTP
RLDTP
22
))1(2;2(
15
)21.6()81.3()701.1(5.5
22
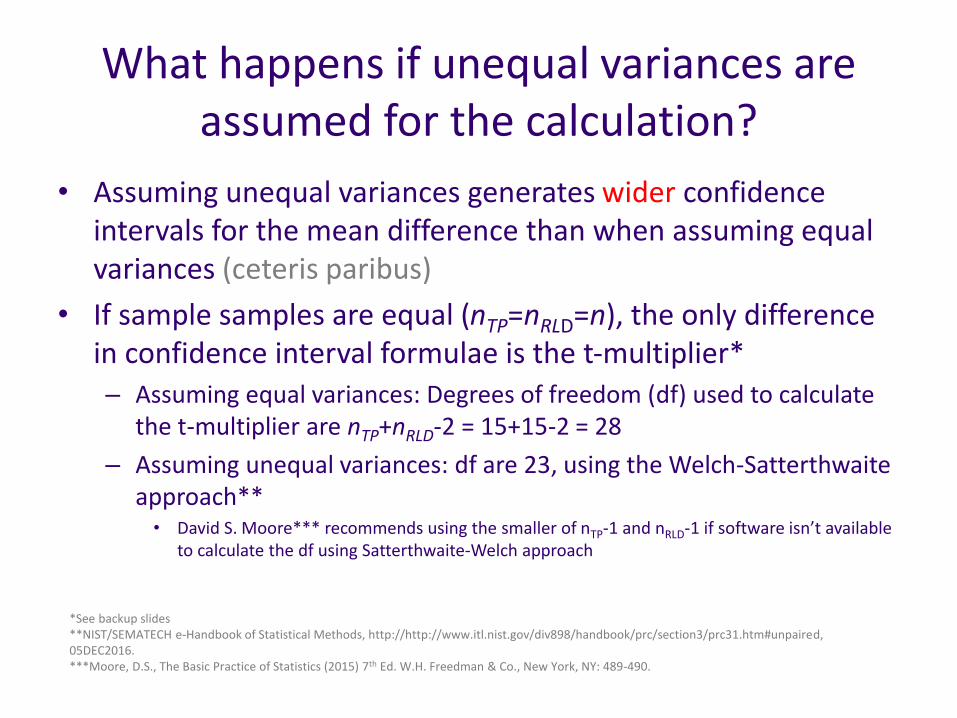
What happens if unequal variances are assumed for the calculation?
• Assuming unequal variances generates wider confidence intervals for the mean difference than when assuming equal variances (ceteris paribus)
• If sample samples are equal (nTP=nRLD=n), the only difference in confidence interval formulae is the t-multiplier*– Assuming equal variances: Degrees of freedom (df) used to calculate
the t-multiplier are nTP+nRLD-2 = 15+15-2 = 28
– Assuming unequal variances: df are 23, using the Welch-Satterthwaite approach**• David S. Moore*** recommends using the smaller of nTP-1 and nRLD-1 if software isn’t available
to calculate the df using Satterthwaite-Welch approach
*See backup slides**NIST/SEMATECH e-Handbook of Statistical Methods, http://http://www.itl.nist.gov/div898/handbook/prc/section3/prc31.htm#unpaired, 05DEC2016.***Moore, D.S., The Basic Practice of Statistics (2015) 7th Ed. W.H. Freedman & Co., New York, NY: 489-490.
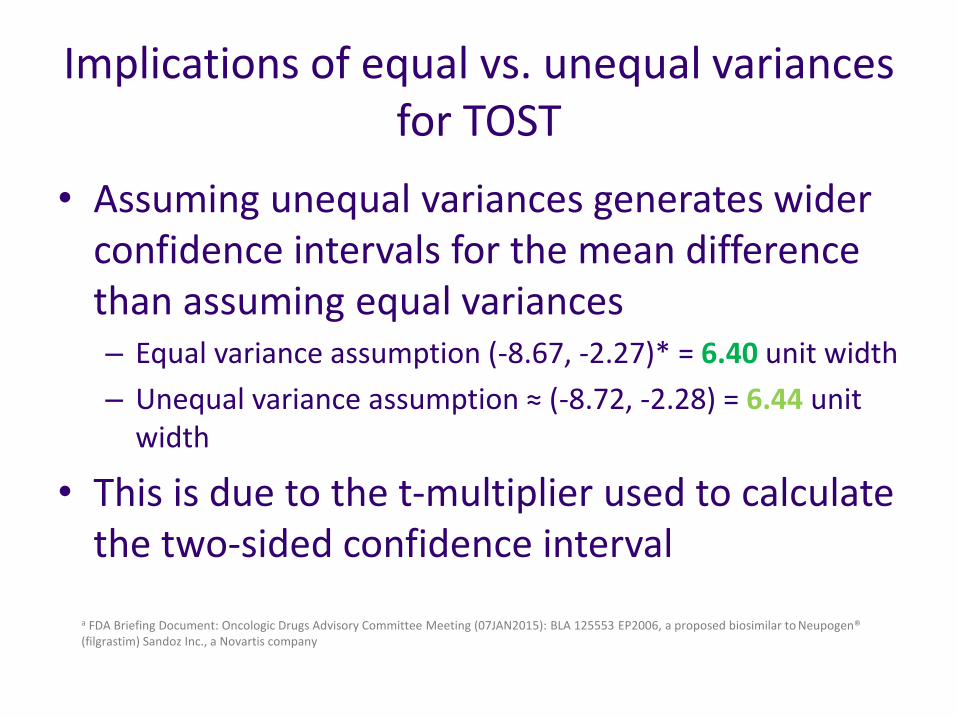
Implications of equal vs. unequal variances for TOST
• Assuming unequal variances generates wider confidence intervals for the mean difference than assuming equal variances– Equal variance assumption (-8.67, -2.27)* = 6.40 unit width
– Unequal variance assumption ≈ (-8.72, -2.28) = 6.44 unit width
• This is due to the t-multiplier used to calculate the two-sided confidence interval
a FDA Briefing Document: Oncologic Drugs Advisory Committee Meeting (07JAN2015): BLA 125553 EP2006, a proposed biosimilar to Neupogen® (filgrastim) Sandoz Inc., a Novartis company
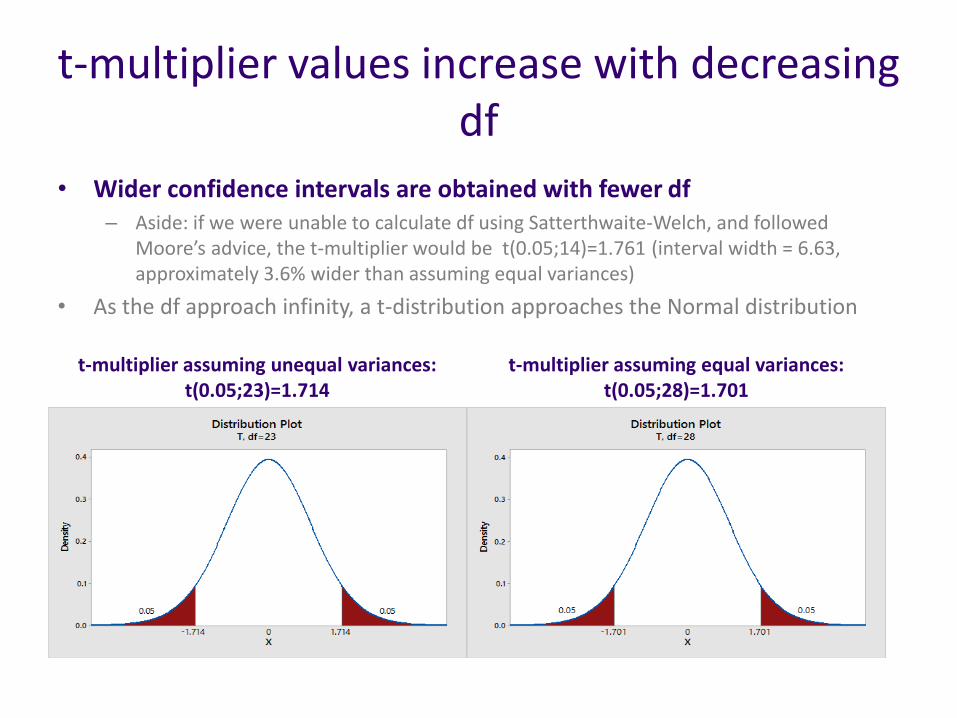
t-multiplier values increase with decreasing df
• Wider confidence intervals are obtained with fewer df– Aside: if we were unable to calculate df using Satterthwaite-Welch, and followed
Moore’s advice, the t-multiplier would be t(0.05;14)=1.761 (interval width = 6.63, approximately 3.6% wider than assuming equal variances)
• As the df approach infinity, a t-distribution approaches the Normal distribution
t-multiplier assuming unequal variances: t(0.05;23)=1.714
t-multiplier assuming equal variances: t(0.05;28)=1.701
Practical implications for Tier 1 biosimilarity assessments
• If unequal variances are assumed in the calculation for the two-sided confidence interval for mean difference:– The confidence interval is more likely to exceed the ±EAC
interval
– This makes it less likely to meet the Tier 1 requirement, as the confidence interval will be wider
• Importantly, the assumption of equal variances may not be appropriate in practice (see next slide)
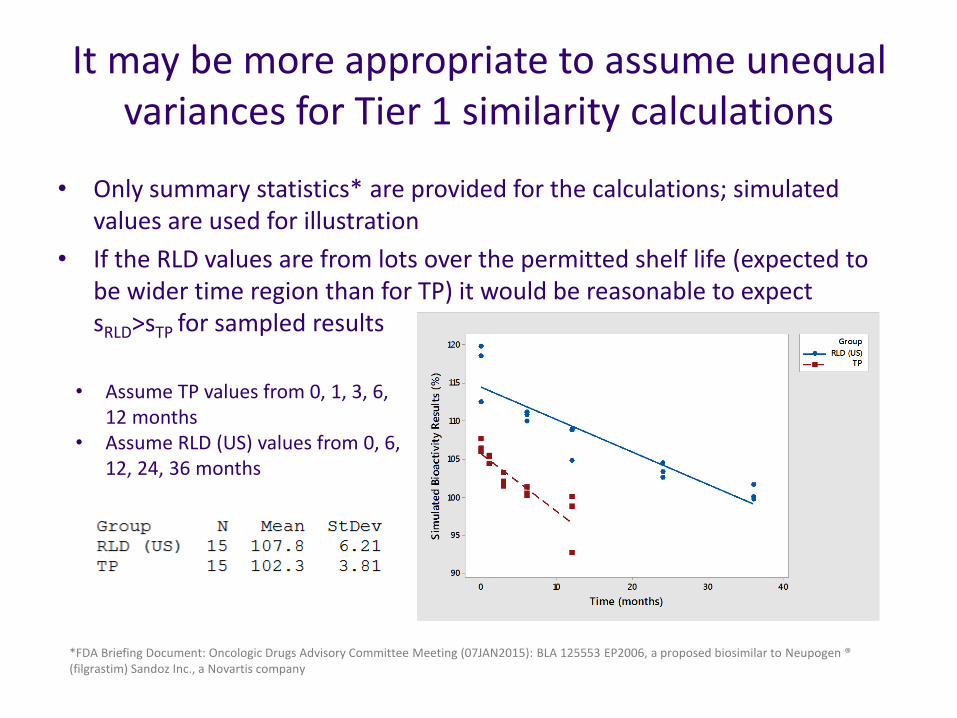
It may be more appropriate to assume unequal variances for Tier 1 similarity calculations
• Only summary statistics* are provided for the calculations; simulated values are used for illustration
• If the RLD values are from lots over the permitted shelf life (expected to be wider time region than for TP) it would be reasonable to expect sRLD>sTP for sampled results
*FDA Briefing Document: Oncologic Drugs Advisory Committee Meeting (07JAN2015): BLA 125553 EP2006, a proposed biosimilar to Neupogen ® (filgrastim) Sandoz Inc., a Novartis company
• Assume TP values from 0, 1, 3, 6, 12 months
• Assume RLD (US) values from 0, 6, 12, 24, 36 months
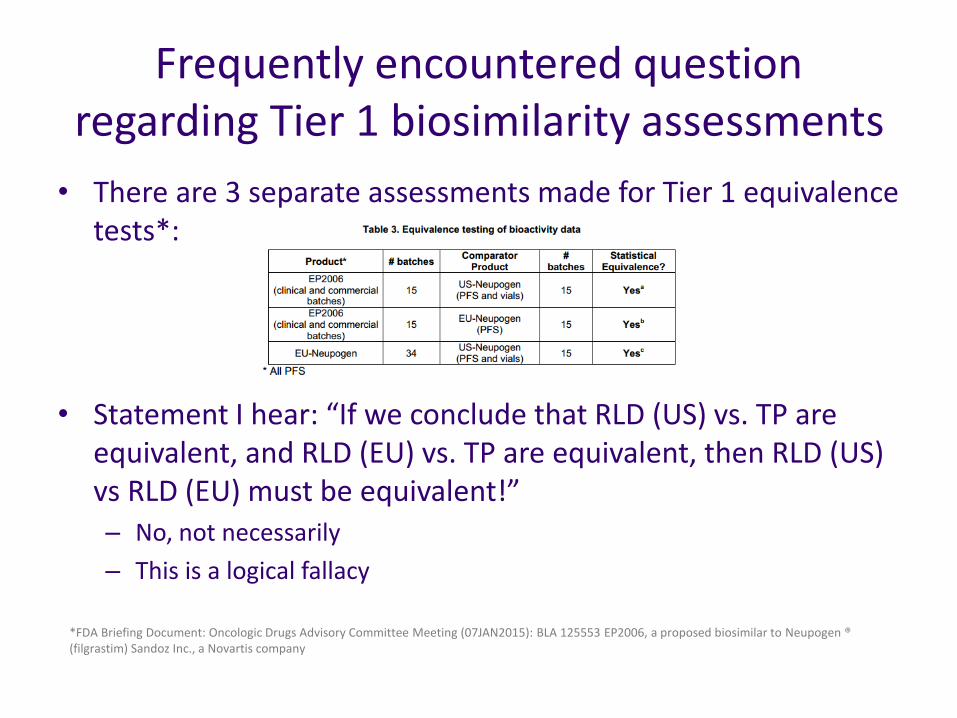
Frequently encountered question regarding Tier 1 biosimilarity assessments
• There are 3 separate assessments made for Tier 1 equivalence tests*:
• Statement I hear: “If we conclude that RLD (US) vs. TP are equivalent, and RLD (EU) vs. TP are equivalent, then RLD (US) vs RLD (EU) must be equivalent!”– No, not necessarily
– This is a logical fallacy
*FDA Briefing Document: Oncologic Drugs Advisory Committee Meeting (07JAN2015): BLA 125553 EP2006, a proposed biosimilar to Neupogen ® (filgrastim) Sandoz Inc., a Novartis company
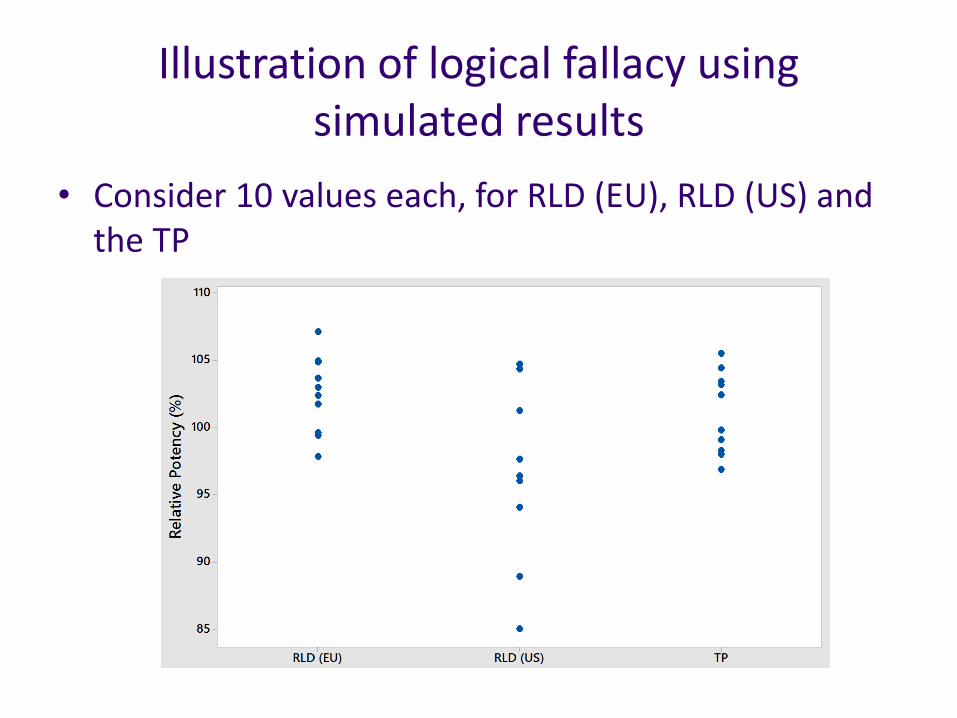
Illustration of logical fallacy using simulated results
• Consider 10 values each, for RLD (EU), RLD (US) and the TP
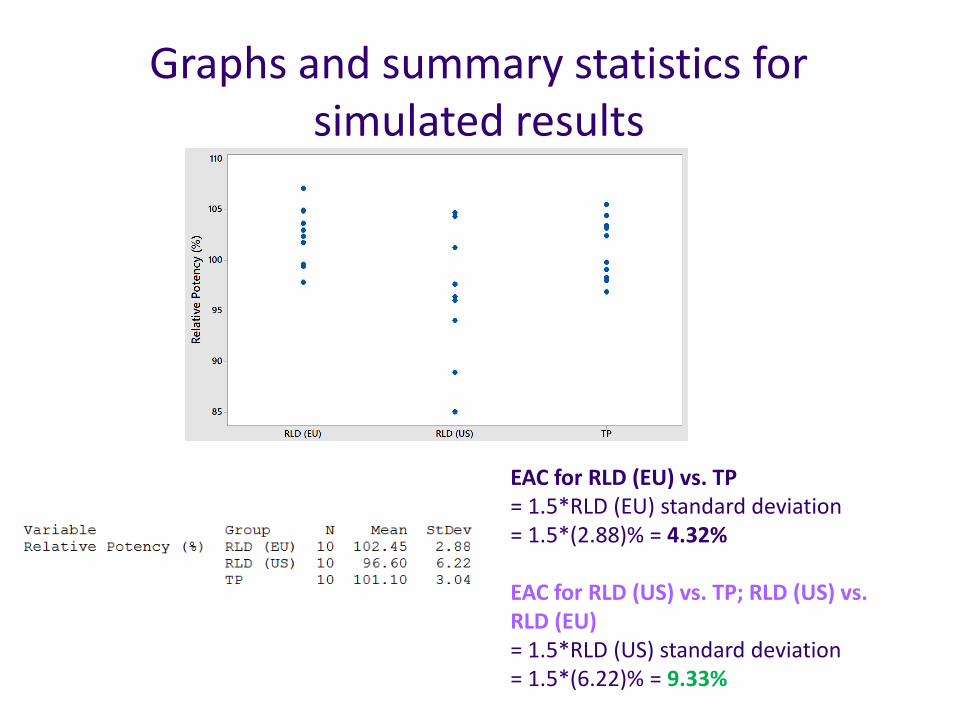
Graphs and summary statistics for simulated results
EAC for RLD (EU) vs. TP= 1.5*RLD (EU) standard deviation= 1.5*(2.88)% = 4.32%
EAC for RLD (US) vs. TP; RLD (US) vs. RLD (EU)= 1.5*RLD (US) standard deviation= 1.5*(6.22)% = 9.33%
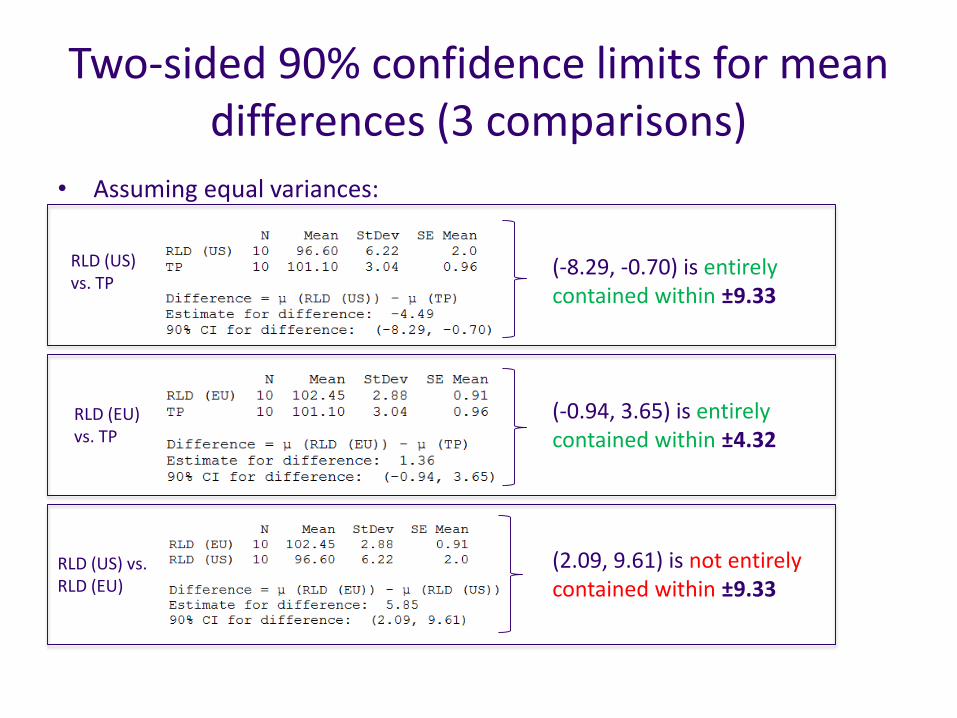
Two-sided 90% confidence limits for mean differences (3 comparisons)
• Assuming equal variances:
(-8.29, -0.70) is entirely contained within ±9.33
(-0.94, 3.65) is entirely contained within ±4.32
(2.09, 9.61) is not entirely contained within ±9.33
RLD (US) vs. TP
RLD (EU) vs. TP
RLD (US) vs. RLD (EU)
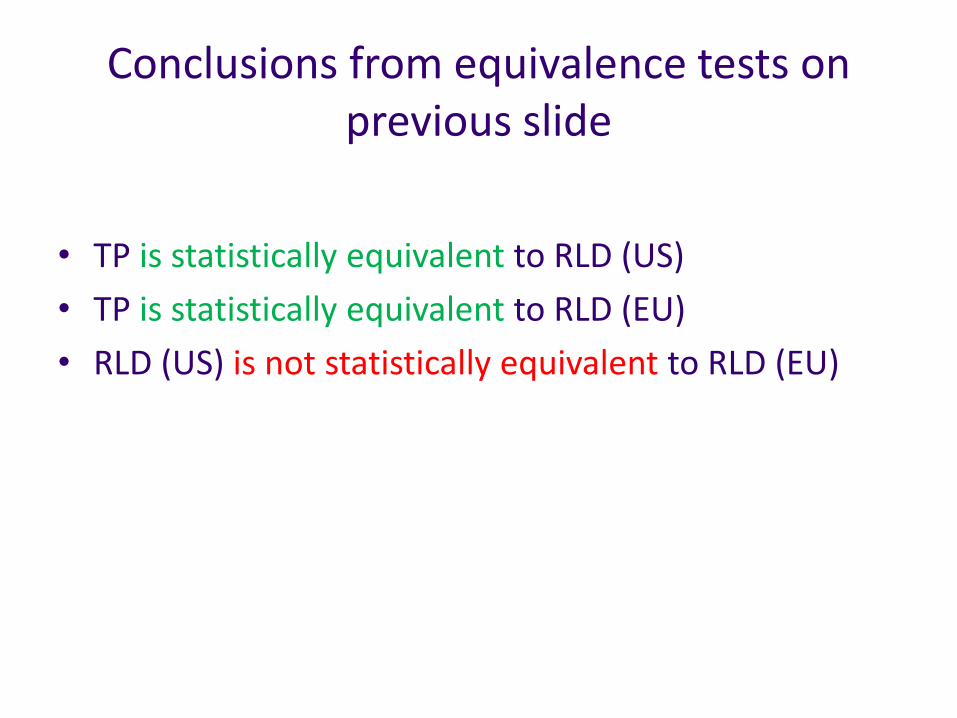
Conclusions from equivalence tests on previous slide
• TP is statistically equivalent to RLD (US)
• TP is statistically equivalent to RLD (EU)
• RLD (US) is not statistically equivalent to RLD (EU)

QUESTIONS?
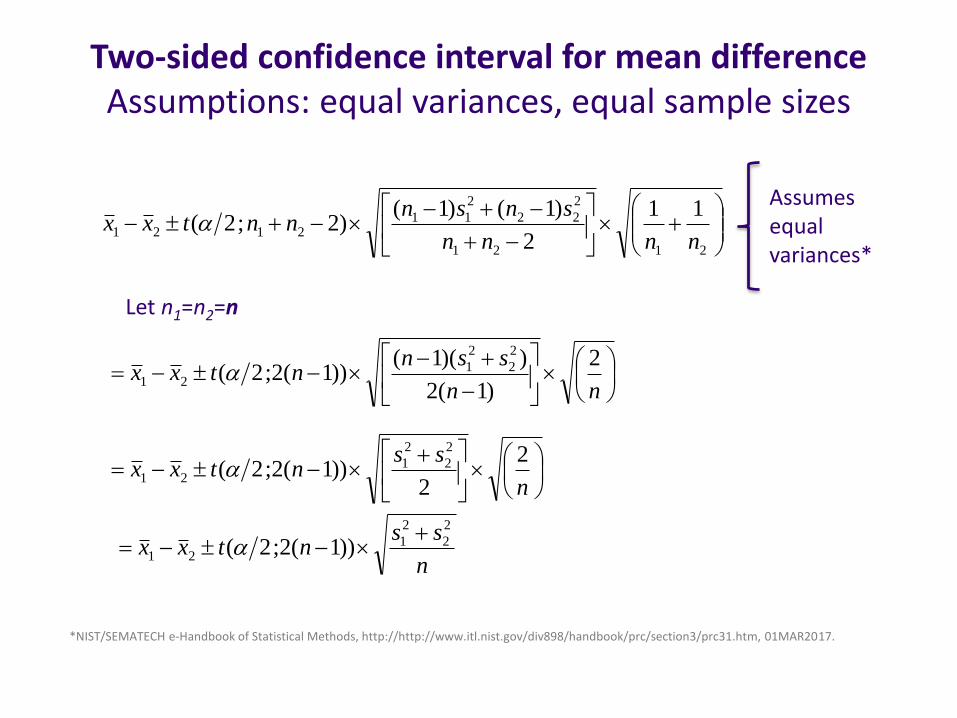
Two-sided confidence interval for mean differenceAssumptions: equal variances, equal sample sizes
2121
2
22
2
112121
11
2
)1()1()2;2(
nnnn
snsnnntxx
Let n1=n2=n
nn
ssnntxx
2
)1(2
))(1())1(2;2(
2
2
2
121
n
ssntxx
2
2))1(2;2(
2
2
2
121
n
ssntxx
2
2
2
121 ))1(2;2(
Assumes equal variances*
*NIST/SEMATECH e-Handbook of Statistical Methods, http://http://www.itl.nist.gov/div898/handbook/prc/section3/prc31.htm, 01MAR2017.
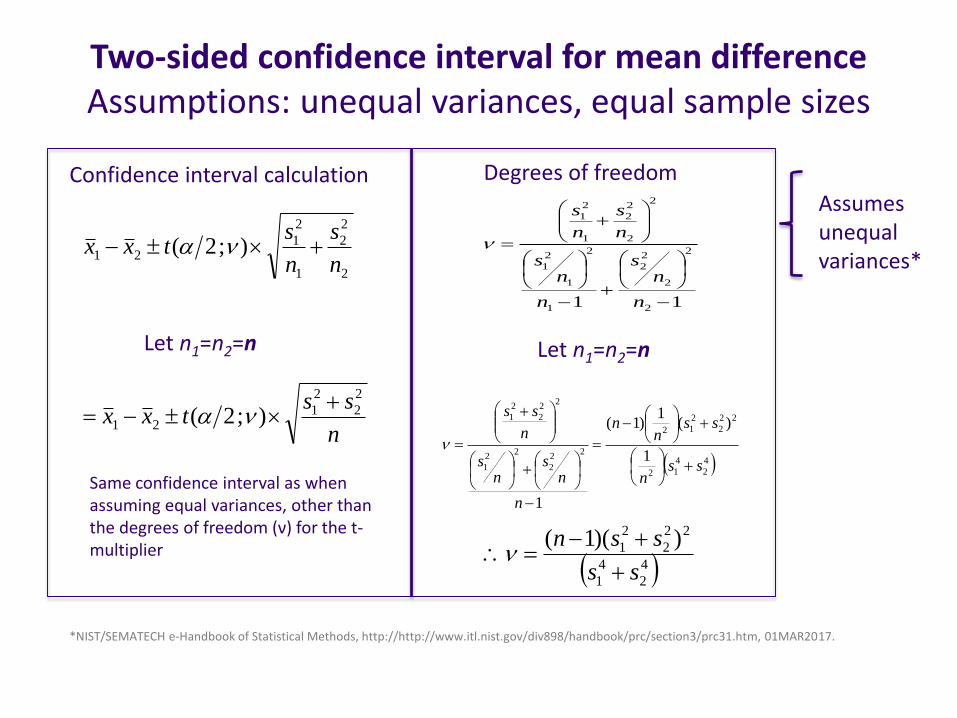
Two-sided confidence interval for mean differenceAssumptions: unequal variances, equal sample sizes
2
2
2
1
2
121 );2(
n
s
n
stxx
Let n1=n2=n
n
sstxx
2
2
2
121 );2(
Assumes unequal variances*
*NIST/SEMATECH e-Handbook of Statistical Methods, http://http://www.itl.nist.gov/div898/handbook/prc/section3/prc31.htm, 01MAR2017.
11 2
2
2
2
2
1
2
1
2
1
2
2
2
2
1
2
1
n
ns
n
ns
n
s
n
s
Let n1=n2=n
4
2
4
12
22
2
2
12
22
2
22
1
22
2
2
1
1
)(1
)1(
1
ssn
ssn
n
n
ns
ns
n
ss
4
2
4
1
22
2
2
1 ))(1(
ss
ssn
Degrees of freedomConfidence interval calculation
Same confidence interval as when assuming equal variances, other than the degrees of freedom (ν) for the t-multiplier
Reference List
Tsong, Y. “Sample Size Imbalance Adjustment for Analytical Biosimilarity Assessment” 3rd Statistical and Data Management Approaches for Biotechnology Drug Development, October 11-12, 2016.
FDA News Release: FDA approves Erelzi, a biosimilar to Enbrel, (30AUG2016), http://www.fda.gov/NewsEvents/Newsroom/PressAnnouncements/ucm518639.htm
FDA Guidance for Industry: Quality Considerations in Demonstrating Biosimilarity to a Reference Protein Product
Burdick, R., et al (2017) Statistical Approaches to Assess Biosimilarity from Analytical Data. AAPS Journal. Vol 19, No. 1. DOI:10.1208/s12248-016-9968-0
FDA Briefing Document: Oncologic Drugs Advisory Committee Meeting (07JAN2015): BLA 125553 EP2006, a proposed biosimilar to Neupogen® (filgrastim) Sandoz Inc., a Novartis company
Chow SC (2014) On Assessment of Analytical Similarity in Biosimilar Studies. Drug Des 3: 119. doi:10.4172/2169-0138.1000e124
Fisher, R.A. The Design of Experiments, Edinburgh: Oliver and Boyd, 1935, p. 18.
<1032> Design and Development of Biological Assays. USP 39. In: USP 39-NF 24. Vol. 1. Rockville (MD): United States Pharmacopeia Convention; 2016: 853.
NIST/SEMATECH e-Handbook of Statistical Methods, http://http://www.itl.nist.gov/div898/handbook/prc/section3/prc31.htm, 01MAR2017.
Moore, D.S. The Basic Practice of Statistics (2015). W.H. Freedman & Co., New York, NY: 489-490.