Embed Size (px)
Citation preview

Lifetime-oriented modelling of wind-induced vibrations on vertical bridgetie rods
M. G�alffy, A. Wellmann Jelic & D. HartmannDepartment of Computational Science in Civil Engineering, Ruhr-University Bochum, Germany
ABSTRACT: The vortex-induced across-wind vibrations of vertical bridge tie rods, often dominated by theso-called lock-in effect, have been proved as a prominent load factor in the dimensioning of particular archedsteel bridges. In order to realistically predict the oscillation amplitudes of the bridge hangers, an improved loadmodel has been developed and validated by means of full scale experiments on an arched bridge in Germany.This model is used to estimate the lifetime of the welded connection plate representing the most sensitive partof the hanger. For that, several realisations of stochastic wind processes are generated as input for the loadmodel, and the calculated lift force is applied on the hanger. Individual realisations are characterised by twoparameters: by a mean wind velocity and by an initial oscillation amplitude. The stresses in the connection plateare computed according to the structural stress concept. The damage accumulated during an excitation processcan be evaluated by using the Palmgren-Miner accumulation rule applied to an appropriate Woehler-(S/N)-curve of the selected material. Analysing several stochastically equivalent realisations of the wind process,a distribution function of the damage can be established. With this and the Weibull function describing theoccurrence-frequency of mean wind velocities, the failure probability of the plate can be estimated. In a previouswork, G�alffy et al. (2004), a detailed description of the load model and its validation has been given. In thispaper, the focus is set on the application in lifetime-oriented design.
1 MODEL FOR VORTEX-INDUCED ACROSS-WIND VIBRATIONS
In multiple cases, the influence of vortex-inducedacross-wind vibrations is a dominant load factor caus-ing the damage process in the welded connectionplates between the suspenders and the arches of steelbridges. These vibrations occur, when vortices are al-ternately shed from opposite sides of the rods, cre-ating forces in across-wind direction. In a turbulentflow, the excitation frequencies are distributed in aninterval around the mean frequency, the width of theinterval increasing with the turbulence. The synchro-nization of the vortex shedding to the system motion,for wind velocities within a critical range � calledthe lock-in effect � plays an essential role in the ex-citation process in numerous damage events.Since none of the models proposed by Ruscheweyh(1982), by Vickery and Clark (1972), or by Hansen(1998) predicts the magnitude of the across-wind os-cillation amplitude of the tie rods realistically, a windload model has been developed, which estimates theamplitude with satisfactory accuracy. The changes inthe nature of the excitation-force, caused by enteringor exiting the lock-in range, lead to an excitation pro-
cess that is basicly non-stationary. As a consequence,the load model used should describe the excitationforce in a turbulent and non-stationary flow.
1.1 Outline of the wind load modelThe model is based on the convolution integral devel-oped by Lou (1997), improved by considering timedependent wind velocities and including the lock-ineffect. The time-dependent lift force, acting on a tierod due to vortex shedding, is obtained as:
F (t) =ρ
2KDClLc
t
0un(τ) eα(t,τ) cosϕ(t, τ)dτ, (1)
Here, ρ is the density of air,D the rod-diameter,Cl thelift coefficient, u(τ) the fluctuating wind velocity, andLc the correlation length. K and n are fit-parameters.The arguments of the exponential and of the cosinefunction are defined as:
α(t, τ) = τ
tξ(x)dx, ϕ(t, τ) =
τ
tω(x)dx+ϕ0(t),
ξ(x) =√
ln 4 Iuω(x), ω(x) =2πS
Du(x), (2)
2213
��������������������������������������������������������������������������������������������

where Iu is the wind-turbulence, ω the fluctuatingStrouhal angular frequency and S the Strouhal num-ber. All quantities contained in equation (1) are time-dependent, excepting the wind turbulence, which issupposed to be constant. Therefore, this equation issuitable to describe non-stationary wind processes.The parameter ϕ0 in (2) describes the lock-in ef-
fect. For wind velocities in the lock-in range, it is setin phase with the rod motion, outside of the lock-inrange, it equals 0. The lock-in range is defined as arange around the critical wind velocity, with a widthdepending on the vibration amplitude. The assumeddependence is described in G�alffy et al. (2004).
1.2 Validation of the model by full scale experimentson an arched bridge in M�unster-Hiltrup,Germany
For the purpose of the validation, a simplified, but re-alistic finite element model of the oscillating systemhas been generated, using bar elements. The modelhas been excited with an appropriate force, that re-sulted from the convolution integral (1) applied tothe measured wind-data u(τ). The calculation of thedisplacements has been performed in the time do-main, using the Newmark-Wilson time-step method.Also, the geometric stiffness resulting from the ten-sion force under self-weight is accounted for.The bridge is provided with circular cross-section
hangers of 5 different lengths (type 1�5), which arefixed by welded steel plates. According to the Ger-man Code DIN 18800, the steel grade of the rods andthe plates is St 52. Two neighboured tie rods � oftype 4 and 5 � have been selected for the measure-ment on site. The vibration of the suspenders has beenmonitored by two digital cameras. Two measurementshave been performed: during the first one, both tierods have been filmed for ca. 50 minutes, during thesecond one, only the type 4 rod has been recorded forca. 20 minutes.Figure 1 presents the wind velocity, the measured
and the simulated rod-deflection as a function of time,obtained for the 1st measurement on the hanger type4. The experimental procedure, the complete results,as well as the parameters applied in the computer-simulation are presented in G�alffy et al. (2004).The measured and the simulated averaged rms-
amplitudes show a very good match, for very differ-ent time-ratios spent at lock-in: For the rod type 4,the 1st measurement (39.3% of time spent at lock-in) yielded an rms-amplitude of 3.81mm, and thethe 2nd measurement (lock-in time ratio 19.6%) pro-vided 1.32mm. The same values have been deter-mined from the computer simulations. For the type5 hanger (1st measurement, 0.2% of time spent atlock-in), 0.133mm has been measured and 0.130mmhas been simulated. As can be seen from figure 1, the
time-dependence of the oscillation amplitude, on en-tering or exiting the lock-in range, are satisfactorilyapproximated by the simulation.In contrast to that, the model developed by Ru-
scheweyh (1982) predicts for the type 4 rod a peakamplitude of about 5mm in the lock-in range, whilethe models in ESDU (1996) and Hansen (1998) yieldrms-amplitudes of ca. 30mm and ca. 34mm, respec-tively. It can be stated that all these models showa substantial discrepancy compared to the measuredvalues: Approximately a 9mm peak amplitude and anrms-amplitude of about 6mm have been determinedfor the time-interval between 500�800 s (see figure 1).
2 APPLICATION IN LIFETIME-ORIENTEDDESIGN
The high-cycle loading caused by the vortex-inducedvibrations very often induces cracks in the weldedconnection plates between the suspenders and thearches. Since unsuitable plate geometries, having highstress peaks, accelerate the initiaton of these cracks,a lifetime-oriented shape optimization of the platesis required, taking into consideration the stochastictime-dependent fatigue history.
2.1 Generation of the stochastic wind dataFirst, stochastic time processes, representing the windvelocity at the section of the tie rod exhibiting themaximal vibration amplitude, were generated. Forthat, white noise has been transformed into a Gaus-sian process, and then, to a wind process using the in-verse discrete Fourier-transform (FFT), in order to ob-tain a Fichtl-McVehil spectral density. Subsequently,the values have been shifted and scaled to obtain therequired mean value and standard deviation. For allruns, the standard deviation has been taken propor-tional to the mean wind velocity, the latter represent-ing the only free parameter in the definition of thestochastic wind data. The used Fichtl-McVehil spec-trum is shown as a solid line in figure 2. It has been
Figure 1: Wind velocity, measured and simulated deflec-tion, 1st measurement, tie rod type 4
2214 �����������������������������������������������

obtained from a fit to the measured wind data, shownas dots. The quantities f , Su and σu are the frequency,the spectral density and the standard deviation of thefluctuating wind velocity u, respectively.The weak damping and the large mass of the rods
lead to slow answers of the system due to changes inthe nature of the excitation force � e. g. while en-tering or exiting the lock-in range. Therefore, largerdurations of ca. 1.5 hours have been selected. Thestochastically generated time-dependent wind veloc-ities, described above, are used as input for the con-volution model introduced in section 1.1. By that,the correspondent lift forces on the tie rod orthogo-nal to the mean wind direction are computed. Then,the time-histories of the deflections are determined byvirtue of the Newmark-Wilson time-step method.
2.2 Calculation of the local stresses
The local stresses in the connection plate have beencomputed according to the structural stress concept.
For that, a realistic finite element model of the type4 tie rod of the bridge has been generated, includingits two connection plates. For the dominant load case,the connection plates are exposed to in-plain strainat the bridge girder and to bending at the arch. Thelatter represents the relevant damage process. There-fore, on the upper end of the system, a 2m portion ofthe bridge arch has been generated (figure 3), in orderto correctly map the clamping conditions of the plateedge welded to the arch profile.
y2
For the described finite element model, the eigen-shape corresponding to the lowest eigenfrequency hasbeen determined. Thereby, also the geometric stiff-ness of all bars and shell elements resulting from the780 kN tension force under self-weight has been takeninto account. Based on the computed deformation,scaled to a deflection-amplitude of 1mm, the cor-responding stresses in the shell elements have beendetermined. It turned out that the maximal stress,caused by bending in the arch connection plate, isσy = 6.1N/mm2, occuring in the elements marked infigure 4. The values refer to the center of the elements,(about 14mm= 0.56d distant from the re-entrant cor-ner of the d = 25mm thick plate). Then, the maximalvalue of σy is used as a concentration factor for deter-mining the stress from the amplitudes computed onthe simplified system (see section 1.2).
2.3 The distribution function of the mean windvelocity
The distribution of the mean wind velocity in Ger-many for one year has been published in Christof-fer and Ulbricht-Eissing (1989). The data character-ising the meteorological area in which the bridge islocated, have been used. The distribution is given bythe Weibull function:
PW (u) = 1− e−( ua )
k
, (3)
where a and k are the scale and shape parameters.
fitted Fichtl-McVehil spectrum (solid line)Figure 2: Measured wind velocity spectrum (dots) and
Figure 4: Stress σ [N/mm ] in the critical region (archconnection), caused by a rod deflection of 1 mm
Figure 3: Finite element model of the connection plate
2215����������������������������������������������

The scale and shape parameters are dependent onthe wind direction. 12 values ai and ki are given, cor-responding to sectors of 30◦. As the across-wind tierod vibrations are only caused by the component ofthe wind velocity perpendicular to the bridge axis, thedistribution function can be chosen as follows:
PW (u) =12i=1
pi
1− e
−
uai| sinαi|
ki . (4)
In (4), αi is the angle between the bridge axis and thebisector of the i-th wind direction sector, and pi therelative occurence frequency of wind velocityes lyingin sector i. Figure 5 shows the obtained distributionfunction.
2.4 Identification of the �critical� hangerFor the identification of the �critical� hanger, finite-element models for each of the 5 hanger types ofthe bridge have been created and their correspondingstress-concentration factors have been determined, asdescribed in the previous section. Subsequently, thestochastic wind data have been applied to a simplifiedFE-model (built with bar elements) containing allhanger types. From the computed amplitudes, themaximal stresses in the connection plates have beencalculated. In this calculation, the distribution of thestochastically generated mean wind velocity is pre-scribed by the Weibull-function, as mentioned in theprevious section. The tie-rod showing the higheststress value is identified as the �critical� one.In total, 11 runs have been performed, based on
stochastically equivalent realisations of the wind pro-cess. The simulated duration has been set to ca. 5.8hours for the first 10 runs, and to ca. 58 hours forthe last run. As can be seen from figure 6, the type4 hanger shows substantially higher stresses than theother tie-rods, in all cases. Thus, type 4 is the �criti-cal� hanger.
2.5 Calculation of the partial damages
The damage analysis has only been carried out for the�critical� hanger type 4.Using the maximal stress σy = 6.1N/mm2 per 1mmdeflection as a stress factor, the stress time historiesat the maximum stress point have been computed.As has turned out, besides the mean wind velocityu also the initial oscillation amplitude of the rod A0
plays a critical role with respect to the evolution ofthe stress time history. Therefore, stress time historieshave been created for 22 different constant values u,with 1.0m/s ≤ u ≤ 10.0m/s, along with 11 differentvalues for A0, 0 ≤ A0 ≤ 10mm for each u. As thestress time histories, and also the calculated damages,considerably vary between the different stochasticallyequivalent realizatons (i.e. realizations differing onlyin the initialization value of the random number gen-erator creating the white noise), 100 realizations foreach parameter-pair (u,A0) have been generated inorder to obtain a feasible statistical distribution.From the stress time histories, the histograms of cy-cles have been established for each realization (du-ration ∆t ≈ 1.5 hours), using the rainflow cycle
Figure 5: Probability function of the mean wind velocityfor the individual runscomponent perpendicular to the bridge axisFigure 6: Maximal stress in the hanger connection plates
rainflow methodFigure 7: Typical histogram of cycles obtained by the
2216 �����������������������������������������������

counting method presented by Clormann and Seeger(1986), which implements the masing and memoryeffects. Figure 7 presents one of the established his-tograms, containing the number of cycles N plottedagainst the double stress amplitude ∆σ.The partial damage has been computed accord-
ing to the Palmgren-Miner accumulation rule, us-ing the Woehler-curves given in Eurocode 3 for bulksteel, notch class 160. These curves are probabilis-tically defined, with fatigue strengths ∆σD show-ing a log-normal distribution. The standard deviationof the distribution is not specified in the Eurocodestandard. Therefore, the Woehler curves for differ-ent survival probabilities have been computed usingthe value Slog∆σD
= 0.07, given in the Backgroundinformations to Eurocode 3 (1990), along with theWoehler-curve representing the survival probabilityPs = 97.7%, given in Eurocode 3.In order to determine the damage accumulated in
the connection plate over a large period of time (e. g.one year) or, equivalently, the survival probability ofthe plate, a distribution function of the damage has tobe established. This can be accomplished by couplingthe probabilistic character of the Woehler-curves withthe stochastics of the scattering damages determinedfor the same parameter-pair (u,A0).
probability function of the
For that, the partial damages for each realiza-tion of the wind process have been computed using999 Woehler-curves, representing survival probabili-ties between 0.001 and 0.999. For each parameter-pair(u,A0) and a sharpWoehler-curve (e. g. for Ps = 0.5),a discrete distribution function of the partial dam-ages, consisting of 100 data (corresponding to the100 stochastically equivalent wind processes), canbe obtained. To catch the stochastic character of theWoehler-curves, each datum is substituted by a setof probabilistically distributed data. The probabilitydensity of this data set is given by the distributionfunction of the damage computed for the correspond-
ing wind process, using theWoehler-curves represent-ing different survival probabilities. The data preparedthis way yield the probability function of the partialdamage for a parameter-pair (u,A0). A graphical il-lustration of the probability function, obtained by theabove method, is shown in figure 8.For the assessment of the damage accumulated overthe lifetime of the structure, a distribution functionof the initial amplitudes A0 is needed as well. Thisfunction has been determined iteratively, using a self-consistent method: First, the distribution functions ofthe amplitudes have been computed from the timehistories of the amplitudes, for each parameter-pair(u,A0). These functions have been weighted by theprobabilities of the mean wind velocity PW (ui) (i =1..22), derived from the Weibull distribution function(section 2.3), as well as by the probabilities of the ini-tial amplitudes PA(A0j) (j = 1..11). Then these termshave been added up. The initial value of PA(A0j) hasbeen set to 1/11 for each j, representing a uniformdistribution. From the distribution function of the am-plitudes, calculated from the weighted sum describedabove, new values for PA(A0j) have been obtained.These have been used as input for the next step of theiteration. The iteration is continued until no changewithin the limit of the numerical error (2 · 10−7) be-tween two consecutive values of PA(A0j) is observed.The self-consistent probability function is presentedin figure 9.In the final calculation, the dependence of the dam-age accumulated in one year,Dy, on the survival prob-ability Ps is obtained as:
Dy(Ps) =C22i=1
11j=1
PW (ui)PA(A0j)D(ui,A0j, Ps).(5)
In equation (5),D is the partial damage calculated forthe parameter-pair (u,A0), and the factor C = 6019is the number of wind processes per year. In figure10, the failure probability Pf = 1− Ps is plotted as a
Figure 9: Self-consistent probability function of the initialamplitudes
Typical partial8:Figuredamage
2217����������������������������������������������
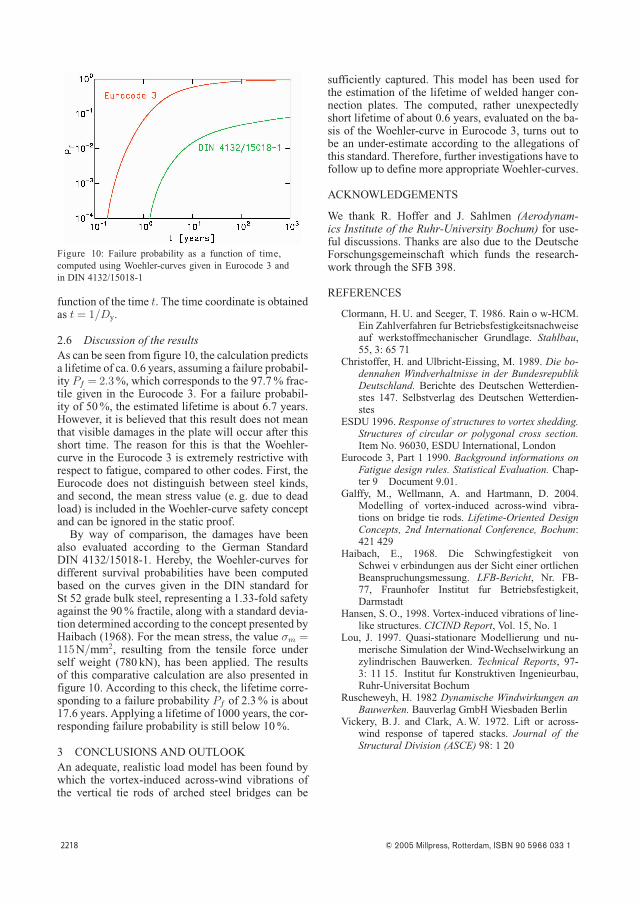
10: Failure probability as a function of
function of the time t. The time coordinate is obtainedas t = 1/Dy.
2.6 Discussion of the resultsAs can be seen from figure 10, the calculation predictsa lifetime of ca. 0.6 years, assuming a failure probabil-ity Pf = 2.3%, which corresponds to the 97.7% frac-tile given in the Eurocode 3. For a failure probabil-ity of 50%, the estimated lifetime is about 6.7 years.However, it is believed that this result does not meanthat visible damages in the plate will occur after thisshort time. The reason for this is that the Woehler-curve in the Eurocode 3 is extremely restrictive withrespect to fatigue, compared to other codes. First, theEurocode does not distinguish between steel kinds,and second, the mean stress value (e. g. due to deadload) is included in the Woehler-curve safety conceptand can be ignored in the static proof.By way of comparison, the damages have been
also evaluated according to the German StandardDIN 4132/15018-1. Hereby, the Woehler-curves fordifferent survival probabilities have been computedbased on the curves given in the DIN standard forSt 52 grade bulk steel, representing a 1.33-fold safetyagainst the 90% fractile, along with a standard devia-tion determined according to the concept presented byHaibach (1968). For the mean stress, the value σm =115N/mm2, resulting from the tensile force underself weight (780 kN), has been applied. The resultsof this comparative calculation are also presented infigure 10. According to this check, the lifetime corre-sponding to a failure probability Pf of 2.3% is about17.6 years. Applying a lifetime of 1000 years, the cor-responding failure probability is still below 10%.
3 CONCLUSIONS AND OUTLOOKAn adequate, realistic load model has been found bywhich the vortex-induced across-wind vibrations ofthe vertical tie rods of arched steel bridges can be
sufficiently captured. This model has been used forthe estimation of the lifetime of welded hanger con-nection plates. The computed, rather unexpectedlyshort lifetime of about 0.6 years, evaluated on the ba-sis of the Woehler-curve in Eurocode 3, turns out tobe an under-estimate according to the allegations ofthis standard. Therefore, further investigations have tofollow up to define more appropriate Woehler-curves.
ACKNOWLEDGEMENTS
We thank R. H�offer and J. Sahlmen (Aerodynam-ics Institute of the Ruhr-University Bochum) for use-ful discussions. Thanks are also due to the DeutscheForschungsgemeinschaft which funds the research-work through the SFB 398.
REFERENCES
Clormann, H.U. and Seeger, T. 1986. Rain�o w-HCM.Ein Z�ahlverfahren f�ur Betriebsfestigkeitsnachweiseauf werkstoffmechanischer Grundlage. Stahlbau,55, 3: 65�71
Christoffer, H. and Ulbricht-Eissing, M. 1989. Die bo-dennahen Windverh�altnisse in der BundesrepublikDeutschland. Berichte des Deutschen Wetterdien-stes 147. Selbstverlag des Deutschen Wetterdien-stes
ESDU 1996. Response of structures to vortex shedding.Structures of circular or polygonal cross section.Item No. 96030, ESDU International, London
Eurocode 3, Part 1 1990. Background informations onFatigue design rules. Statistical Evaluation. Chap-ter 9 � Document 9.01.
G�alffy, M., Wellmann, A. and Hartmann, D. 2004.Modelling of vortex-induced across-wind vibra-tions on bridge tie rods. Lifetime-Oriented DesignConcepts, 2nd International Conference, Bochum:421�429
Haibach, E., 1968. Die Schwingfestigkeit vonSchwei�v erbindungen aus der Sicht einer �ortlichenBeanspruchungsmessung. LFB-Bericht, Nr. FB-77, Fraunhofer Institut f�ur Betriebsfestigkeit,Darmstadt
Hansen, S. O., 1998. Vortex-induced vibrations of line-like structures. CICIND Report, Vol. 15, No. 1
Lou, J. 1997. Quasi-station�are Modellierung und nu-merische Simulation der Wind-Wechselwirkung anzylindrischen Bauwerken. Technical Reports, 97-3: 11�15. Institut f�ur Konstruktiven Ingenieurbau,Ruhr-Universit�at Bochum
Ruscheweyh, H. 1982 Dynamische Windwirkungen anBauwerken. Bauverlag GmbH Wiesbaden Berlin
Vickery, B. J. and Clark, A.W. 1972. Lift or across-wind response of tapered stacks. Journal of theStructural Division (ASCE) 98: 1�20
in DIN 4132/15018-1computed using Woehler-curves given in Eurocode 3 and
time,Figure
2218 �����������������������������������������������