Embed Size (px)
Citation preview
Report 6, 1991
TIIE COOLING OF TIIE SELFOSS GEOTIIERMAL RESERVOIR IN SOUIHERN ICELAND
Juraj Franko, UNU Geothennal Training Programme, Orkustofnun - National Energy Authority, Grensasvegur 9, 108 Reykjavik, ICELAND
Pennanent address: GEOFYZIKA, s. p., Geologicka 18, 822 07 Bratislava, CZECHOSLOVAKIA
3
NlSTRACf
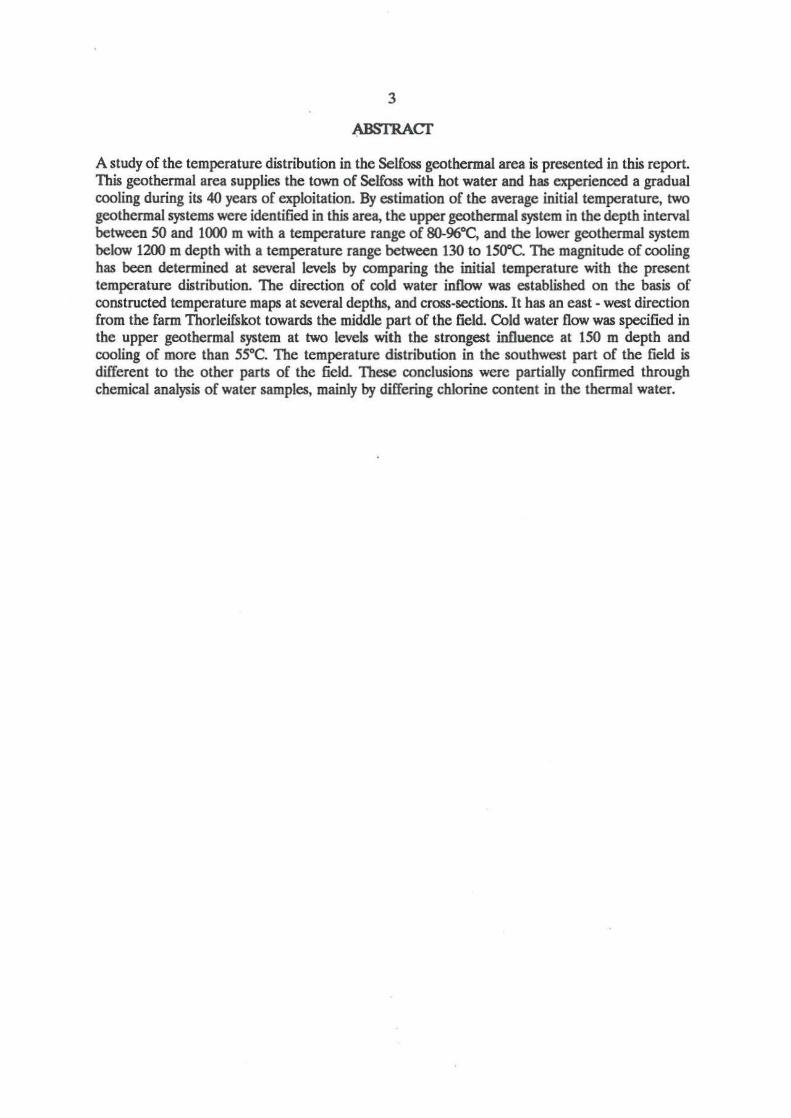
A study of the temperature distribution in the Selfoss geothermal area is presented in this report. This geothennal area supplies the town of Selfoss with hot water and has experienced a gradual cooling during its 40 years of exploitation. By estimation of the average initial temperature, two geothermal systems were identified in this area, the upper geothermal system in the depth interval between 50 and 1000 m with a temperature range of 8O-96"C, and the lower geothermal system below 1200 m depth with a temperature range between 130 to 1= The magnitude of cooling has been determined at several levels by comparing the initial temperature with the present temperature distribution. The direction of cold water inflow was established on the basis of constructed temperature maps at several depths, and cross-sections. It has an east - west direction from the farm Thorleifskot towards the middle part of the field. Cold water flow was specified in the upper geothermal system at two levels with the strongest influence at 150 m depth and cooling of more than 55°C. The temperature distribution in the southwest part of the field is different to the other parts of the field. These conclusions were partially confirmed through chemical analysis of water samples. mainly by differing chlorine content in the thermal water.
4
TABLE OF CONTENTS Page
ABS1RACT ... . . .. . . .. .. .......•..•......... . ....•..•..•............... 3
TABLE OF CONTENTS . .........•........... •..•..•. . ......•..•........ . 4
LIST OF FIGURES ............. . . ... .. .. ... .• ..•.. ......•.. •. .• .. • ...... 5
LIST OF TABLES ... .. ...... .. .. • .. .........•..•.... . .. . . . .•..• ..•..... . 5
1. INTRODUCfION ...... .... .. . .. .. .. .. •.. • ...... . . .... .....•.. •...... 6 1.1 Scope of the work ..... . ............•...........•... . .•..•. ..... 6 1.2 Geology and hydrology . . . . . . . . . . . . . . . . . . . . . . . . . . . . . . . . . • . . • . . . . .. 6 1.3 Geoehemical and geophysical survey . . . . . . . . . . . . . . . . . . . . . . . . . . • . . . . . . 9 1.4 History of field development and production ..... ...........•. .• ... .. 10
2. INTERPRETATION OF TEMPERATURE MEASUREMENTS ......•........ 12 21 Analysis of temperature measurements . .................... • ........ 12 22 &timation of the initial temperature .... . .. .. ........ ..... . .. . ..... 12 2.3 Comparison of the present and initial temperatures ...... . .. .. . .. . ..... 16
3. TEMPERATURE DISTRIBUTION IN THE FIELD ................•.. • ..... 21 3.1 Temperature cross-sections . . . . . . . . . . . . . . . . . . . . . . . . . . . . . . . . . . . . . .. 26 3.2 Three-dimensional temperature distribution ..... . ...... . .. .. . ........ 26
4. RESULTS AND CONCLUSIONS ..... .... .. . .. .. . . • .. . .. • . .•.. . ..... . .. 29
ACKNOWLEDGEMENTS. . . . . . . . . . . . . . . • . . • . . • . . . . . • . . . . . . . . • . . . . . . . . . .. 30
REFERENCES . . . . . . . . . . . . . . . • . . • . . . • . • . . • . . • . . • . . • . . . . . . . . . . . . . . . . . . . . 31
5
usr OF flGURES Page
1. Location of the Self"" geothermal area. . . . . . . . . . . . . . . . . . . . . . . . . . . . . . . .. 6 2 Location of wells and cross-sections in the Selfoss geotbermal area ............ 1 3. The geological cross-section of the upper part of the geothermal s)'tem . . . . . . . . .. 7 4. Simplified geological profiles of deep wells in the Selfoss geothermal area ........ 8 5. Head-on resistivity profiling in the Selfoss geothermal area. . . . . . . . . . . . . . . . . . . . 9 6. Selected temperature graphs for wells THK-1, 3, 4, and 6 .................... 13 7. Selected temperature graphs for wells THK-7, 8, 9, and lO ....... ............ 14 8. Selected temperature graphs for wells THK-11, 12, 13, and 14 ................ 15 9. Average initial temperatures Tin in the Selfoss geothermal area ............... 16 10. Comparison of the present andlor the latest temperature measurements
with the initial temperature curve Tin . . . . . . . . . . . . . . . . . . . . . . . . . . . . . . . . . .. 17 11. Comparison of the present and/or the latest temperature measurements
with the initial temperature curve Tin . . . . . . . . . . . . . . . . . . . . . . . . . . . . . . . . . .. 18 12 Comparison of the present andlor the latest temperature measurements
with the initial temperature curve Tin . . . . . . . . . . . . . . . . . . . . . . . . . . . . . . . . . .. 19 13. Temperature maps at !()() and 150 m depth ............... ............... 22 14. Temperature maps at 400 and 600 m depth .............................. 23 15. Temperature maps at 800 and 1200 m depth ........ .............. ....... 24 16. Cooling at 100 m depth ..... . .. ................. .......... . ... • . .... 25 17. Cooling in the Self"" geothermal area during years 1950 - 1990 . . . . . . . . . . . . . .. 25 18. Temperature measurements in well TIiK-ll .............................. 26 19. Temperature cross-sections I and IT . ... ........ .. .... .............. .... 27 20. Three-dimensional temperature models at 100 and 150 m depth . . . . . . . . . . . . . .. 27 21. Three-dimensional temperature models at 400 and 600 m depth ......... ..... . 28 22. Three-dimensional temperature models at 800 and 1200 m depth . . . . . . . . . . . . .. 28
usr OF TABLES
1. Summary of the drilling operations in the Selfoss geothermal area .. .... _ . . . . .. 11 2. Chlorine in wells THK-2 and THK-11 ............. .. . .. ...... _ ..•...... 26
6
1. INTRODUCTION
1.1 Scope of the work
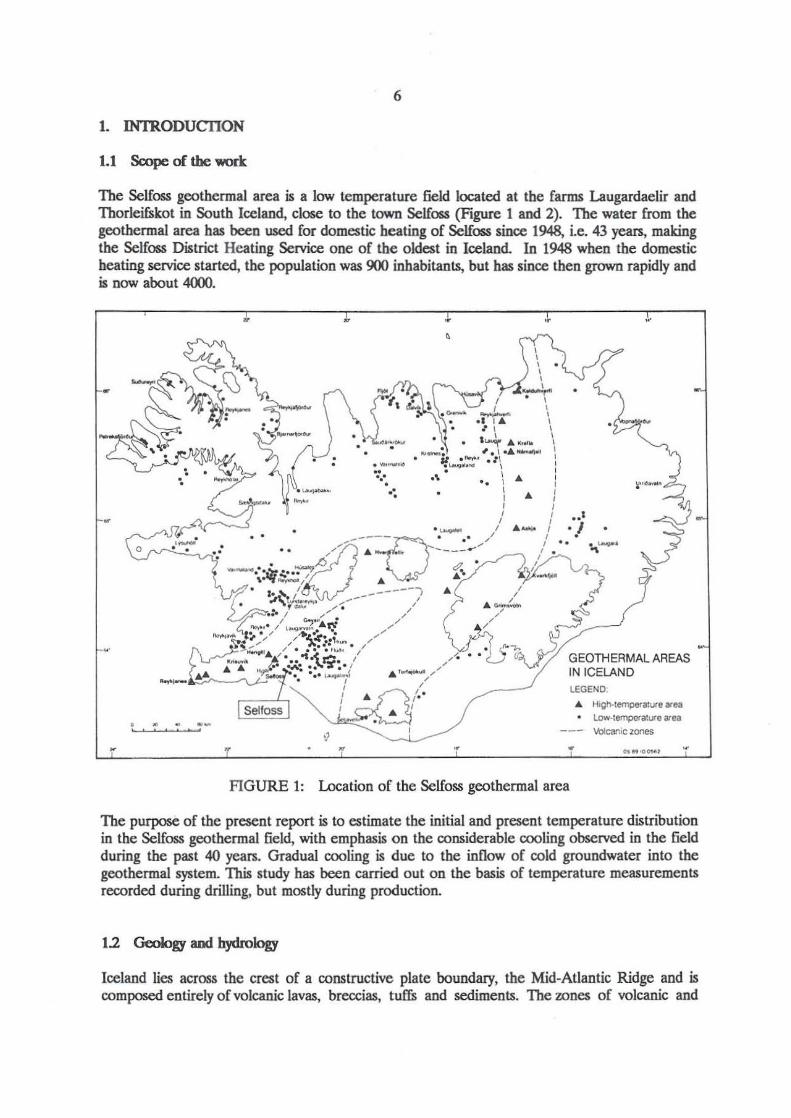
The Selfoss geothermal area is a low temperature field located at the farms Laugardaelir and Thorleifskot in South Iceland, close to the town Selfoos (Figure 1 and 2). The water from the geothermal area has heen used for domestic heating of Selfoos since 1948, i.e. 43 years, making the Selfoss District Heating Service one of the oldest in Iceland. In 1948 when the domestic heating service started, the population was 900 inhabitants, but has since then grown rapidly and is now about 4000.
,
•
o
• • 1
'.1
GEOTHERMAL AREAS IN ICELAND LEGEND'
•
... H'gMempen.'ure ... ea Low-temperature area \tIICarllC zones
FIGURE 1: Location of the Selfoss geothermal area
The purpose of the present report is to estimate the initial and present temperature distribution in the Selfoss geothermal field, with emphasis on the considerable cooling observed in the field during the past 40 years. Gradual cooling is due to the inflow of cold groundwater into the geothermal system. This study has been carried out on the basis of temperature measurements recorded during drilling, but mostly during production.
1.2 Geo\ogy and hydrology
Iceland lies across the crest of a constructive plate boundary, the Mid-Atlantic Ridge and is composed entirely of volcanic lavas, breccias, tutIs and sediments. The zones of volcanic and
7
DITCH 09 DRILlHOLES WITH PUMPS
N r" ROAD ' 7 CEMENTED DRILlHOLE
WITH NARROW CASING
1 - PIPE UNE , , DRILlHOLE CLOSED dii BUILDING BY CEMENT
.,./ CROSS · SECTION ., DRILLHOLES WHICH ARE NOT USED
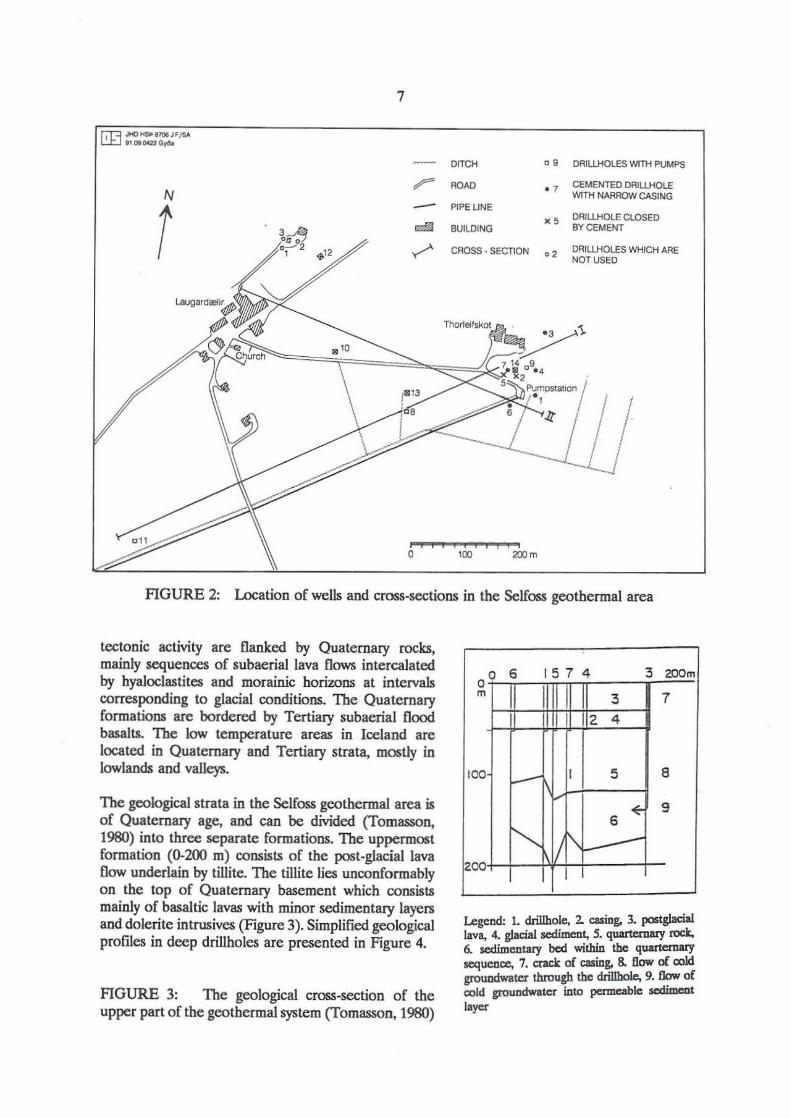
FIGURE 2: Location of wells and cross-sections in the Selfoss geothennal area
tcctonic activity are flanked by Quaternary rocks, mainly sequences of subaerial lava flows intercalated by hyaloclastites and morainic horiwns at intervals corresponding to glacial conditions. The Quaternary formations are bordered by Tertiary subaerial flood basalts. The low temperature areas in Iceland are located in Quaternary and Tertiary strata, mostly in lowlands and valleys.
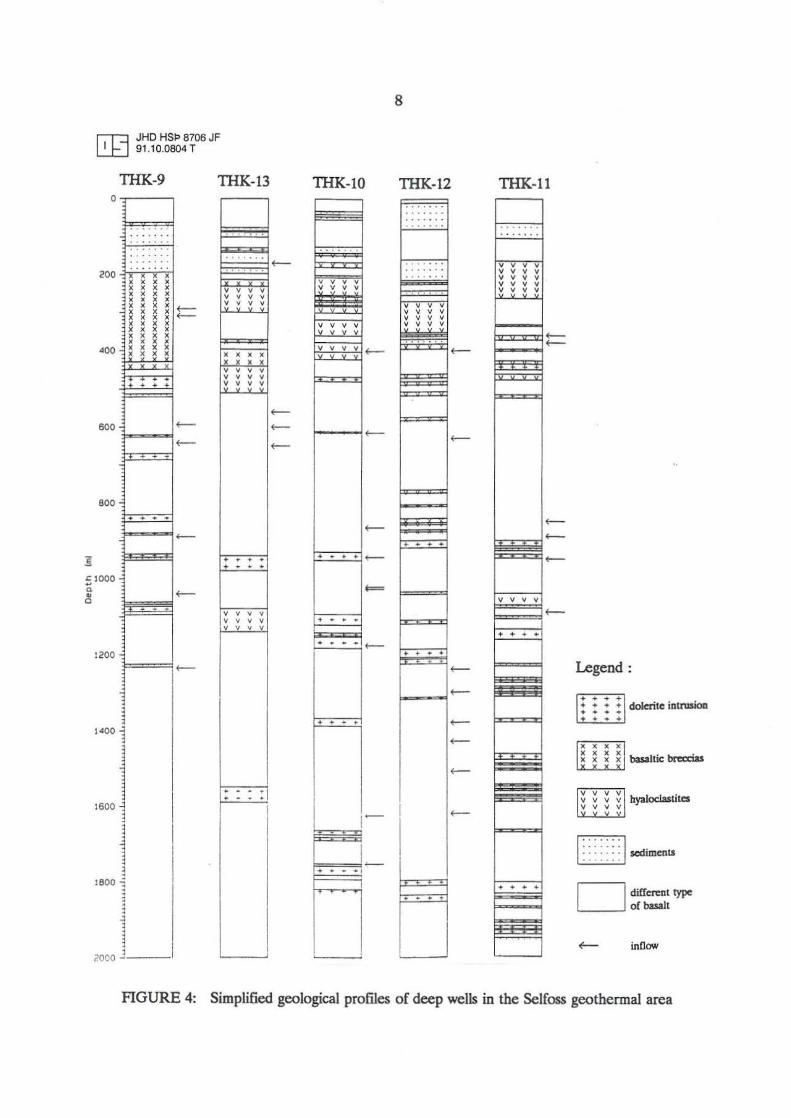
The geological strata in the Selfoss geothermal area is of Quaternary age, and can be divided (Tomasson, 1980) into three separate fonnations. The uppermost fonoation (0-200 m) consists of tbe post-glacial lava flow underJain by tillite. The tillite lies unconformably on the top of Quaternary basement which consists mainly of basaltic lavas with minor sedimentary layers and dolerite intrusives (Figure 3). Simplified geological profiles in deep drillholes are presented in Figure 4.
FIGURE 3: The geological cross-section of tbe upper part of tbe geotbermal system (Tomasson. 1980)
aa 6 15 7 4 3 ZOOm
m I 3 7
1 1 12 4
100 I 5 8
6 .., 9
~ I" 200 I
Legend: 1. drillhole, 2 cuing, 3. postglacial lava, 4. glacial sediment, 5. quartemary rock, 6. sedimentary bed within the quartcmary sequence, 7. crack of casing, 8. now of cold groundwater through the drilIhole, 9. 80w of cold groundwatcr iota permeable scdime:Dt 1.,.,.
r.r:::I JHD H$I:> 6706 JF ~ 91 .10.0804 T
TIlK-9 TIlK-\3 o
..... ... . · . . ... . . .
200 • • • • • • • • • • • • • • · • • • • • • , , , , , , , , , , , ,
• • • • • • • • • • • • • • • • • • • • • • • • • • • • • • • • '00 · : . • , , , , -- - ;
, , , , , , , ,
600
-600
-- - -
I · - - -- - - -5 1000
~ -~ , , , , , , , , , , , ,
IZOO
i
l " 00 i
1 - - - :1 - - -1600 i 1
1 1 ,
!BOO ~ 1
1 2000 2'---
TIlK-1O
~' , , , ,
, , , , , , , , ,
· - - .
• - --- - - -
• - - -
1
I - - - -,
I
8
TIlK-12
v v v y v v v v V V v v V v v y
1--"-
TIlK-II
Legend:
doIerite intrusioa
hyaJoclastitcs
I:: : :: j $Cdiments
D dirr~1 type of bowl!
~ inQow
FIGURE 4: Simplified geological promes of deep wells in the Selfoss geothennal area
9
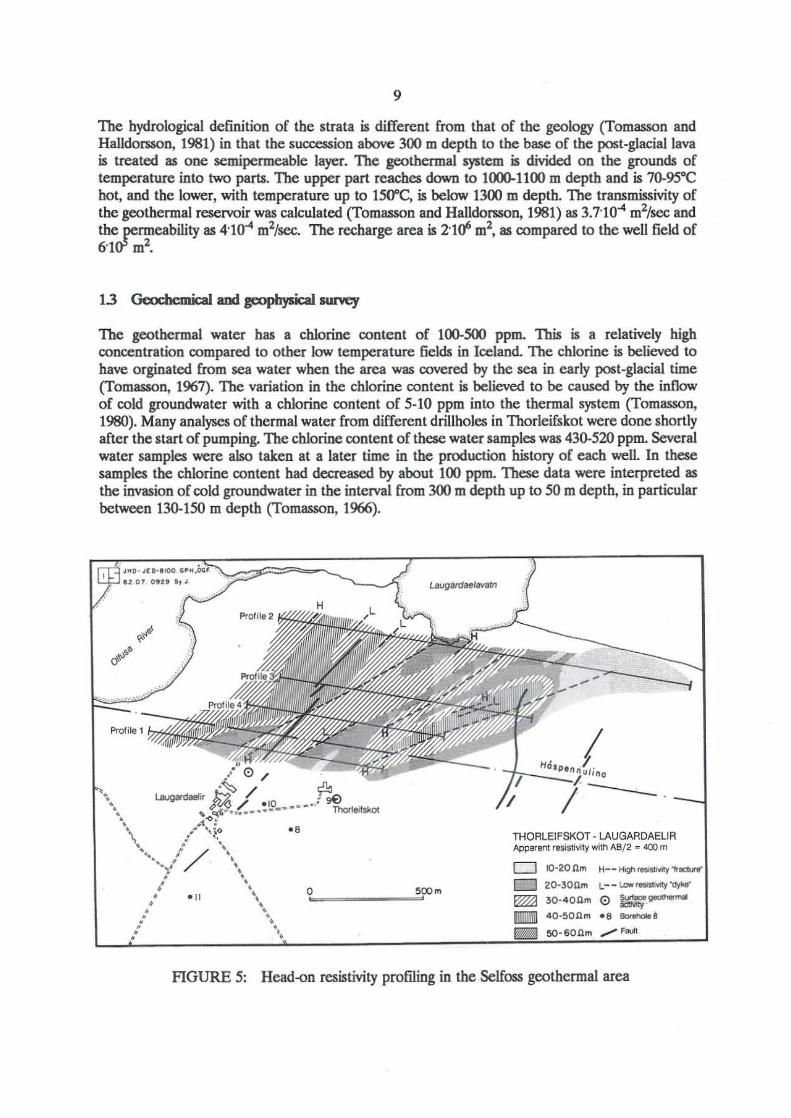
The hydrological definition of the strata is different from that of the geology (Tomasson and Halldomon, 1981) in that the succession above 300 m depth to the base of the post-glacial lava is treated as one semipermeable layer. The geotbermal system is divided on the grounds of temperature into two parts. The upper part reaches down to 1000-1100 m depth and is 70-95°C hot, and the lower, with temperature up to 1500C, is below 1300 m depth. The transmissivity of the geothermal reservoir was calculated (Tomasson and HaIldonson, 1981) as 3.7'104 m'/sec and the permeability as 4'104 m'/sec. The recharge area is 2'Ur m', as compared to the well field of 6'10' m'.
The geothermal water has a chlorine cootent of 100-500 ppm. This is a relatively high concentration compared to other low temperature fields in Iceland. The chlorine is believed to have orginated from sea water when the area was covered by the sea in early post-glacial time (Tomasson, 1967). The variation in the chlorine contcnt is believed to be caused by the inflow of cold groundwatcr with a chlorine content of 5-10 ppm into the thennal system (Tomasson, 1980). Many analyses of thermal water from different drillholes in Thorleifskot were done shortly after the start of pumping. The chlorine content of these water samples was 430-520 ppm. Several water samples were also taken at a later time in the production history of each well. In these samples the chlorine content had decreased by about lOO ppm. These data were interpreted as the invasion of cold groundwater in the interval from 300 m depth up to 50 m depth, in particular between 13().150 m depth (Tomasson, 1966).
,"O-I[D-I_
lZor 09U s"
Profi le 1
• 8
/ ." 0'-_ ____ """'" m
---- .
THQRLElf SKOT · LAUGARDAELI R Apparent resistivity with AB/2 ,. 400 m
o 1(l-20 nrn H-- Hign .... "" ·_ .... 1 c:::I ZO-30nrn L--LowI~"dyIot" ~ 30· 40.llrn 0 = _gICICI'IIm'IlII ~ 40-50.llm - 8 9ota'IoII8
SO. 60.llm ....... FaAI
FIGURE 5: Head-on resistivity profiling in the Selfoss geothermal area
10
In 1982, a head-on resistivity profile was carried out close to the Selfoss geothermal area (Figure 5). The purpose of the measurements was to determine the low resistivity woes, which are usually associated with temperature anomalies in Iceland. The following results were obtained. Two low resistivity water-bearing "fractures" with NE-SW directions towards the farm Laugardaelir were found (Figure 5). Farther to the southeast these fractures can be seen on the surface where hot springs are located. Two high resistivity "dykes" with NE-SW direction were determined in the area between the farms Laugardaelir and Thorleifskot. They could be a sign of flow barrier in this area (Hersir and Flovenz, 1982).
1.4 History of fie1d development aod production
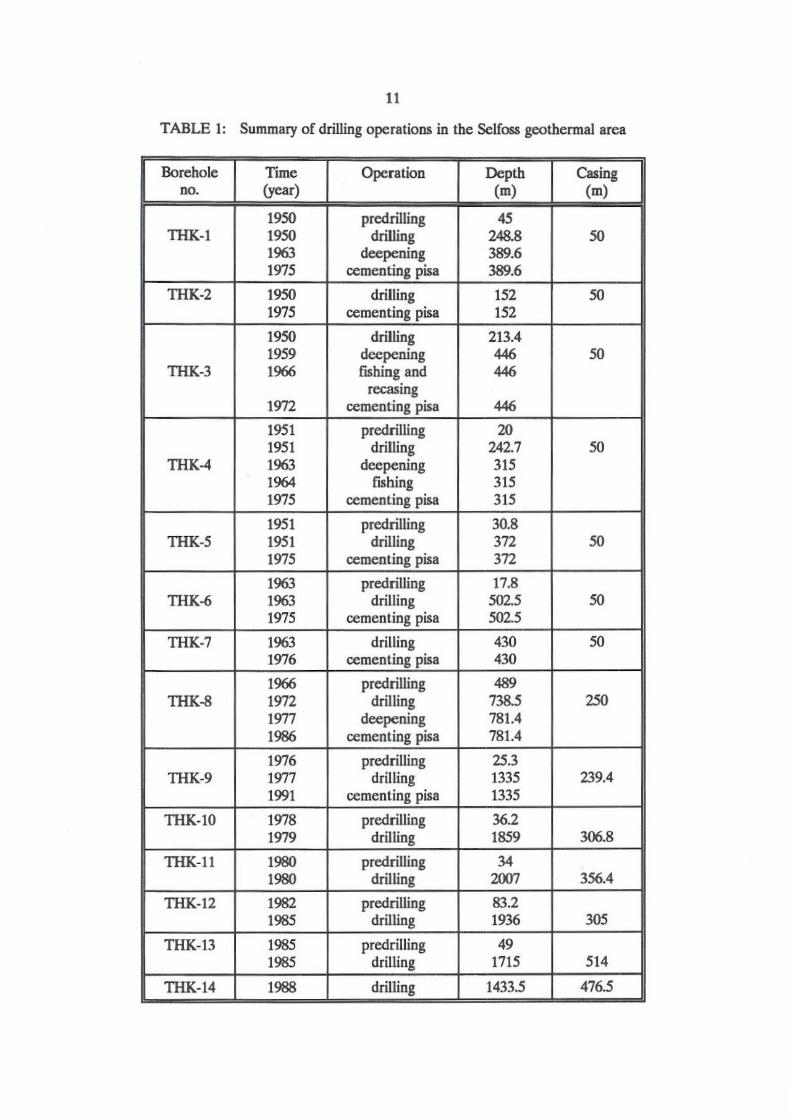
The exploitation of the area started in 1948 by utilizing the free flow of 7SOC hot water from shallow drillholes near the farm Laugardaelir (Figure 2). When utilization started, the hydrostatic pressure of the geothermal water decreased, causing the inflow of cold groundwater. Each new drillhole had to be soon abandoned due to severe cooling. Based on the results from a surface geophysical survey, the drilling operations were moved to the farm Thorleifskot (Figure 2). Between 1950 and 1952 five wells were drilled in this area with depths from 150 to 300 m. The drilling was successful. From the two first wells TIIK·1 and 2 the flow was 15 Vs of 82"e hot water from the 13()'140 m depth interval (Bodvarsson, 1951). The cold groundwater was cased off in all of these wells (Figure 3). The holes 1HK-6, which was 500 m deep, and THK-7, which was 490 m deep, were drilled in 1963 and 1964 and wells TIIK·1 and 4 were deepened. In 1964 submersible pumps were installed and with increasing pumping from the field, cooling accelerated. A new hole TIIK-8 was drilled in 1966 down to 450 m depth. It was located 200 m west of the older holes. In 1972 considerable cooling was observed in the well. The well was deepened down to 738 m and cemented from 250 m depth up to the casing at 50 m depth. After that the temperature of water from the drillhole increased. In 1975 and 1976 wells THK-1 to 7 were abandoned and cemented with a pipe for temperature measurements. In 1977 well THK-8 was deepened to a depth of 781 m. In 1977 well TIIK·9 was drilled to a depth of 1334 m and cased down to 239 m to prevent the strong inflow of cold groundwater. In 1979 well TIIK· lO was drilled 300 m west of well TIIK·9 (Figure 2). The well was 1800 m deep with casing down to 307 m. It collapsed shortly after drilling at 1100 m depth. In 1980 well TIIK-11 was drilled. It is located 500 m southwest of well TIIK· lO and is 2007 m deep with casing down to 356 m. Well TIIK-12 was drilled in 1983 at the farm Laugardaelir to a depth of 1936 m and cased down to 305 m. In 1985 well TIIK-13 was drilled close to well TIIK-8. The well is 1715 m deep with casing to 514 m depth. To prevent cooling in this well, well TIIK-8 was cemented with a pipe in 1986. In 1989 TIIK·14 was drilled, the last well to date in the Selfoss geothermal area. The well is located at the farm Thorleifskot and is 1430 m deep. Considerable cooling was observed in this well shortly after drilling. To prevent THK-14 from cooling, well THK-9 was cemented with a pipe in 1991, leaving lHK-lO, lHK-12 and THK.-13 as the remaining production wells in the area.
11
TABLE I: Summary of drilling operations in the Selfoss geothermal area
Borehole Time Operation Depth Casing no. (year) (m) (m)
1950 predrilling 45 THK-I 1950 drilling 248.8 50
1963 deepening 389.6 1975 cementing pisa 389.6
THK-2 1950 drilling 152 50 1975 cementing pisa 152
1950 drilling 213.4 1959 deepening 446 50
TIlK-3 1966 fishing and 446 recasing
1972 cementing pisa 446
1951 predrilling 20 1951 drilling 242.7 50
TIlK-4 1963 deepening 315 1964 fIShing 315 1975 cementing pisa 315
1951 predrilling 30.8 THK-5 1951 drilling 372 50
1975 cementing pisa 372
1963 predrilling 17.8 THK-6 1963 drilling 502.5 50
1975 cementing pisa 502.5
TIlK-7 1963 drilling 430 50 1976 cementing pisa 430
1966 predrilling 489 THK-8 1972 drilling 738.5 250
1977 deepening 781.4 1986 cementing pisa 781.4
1976 predrilling 25.3 THK-9 1977 drilling 1335 239.4
1991 cementing pisa 1335
TIlK-1O 1978 predrilling 36.2 1979 drilling 1859 306.8
THK-Il 1980 predrilling 34 1980 drilling 2007 356.4
THK-12 1982 predrilling 83.2 1985 drilling 1936 305
TIlK-13 1985 predrilling 49 1985 drilling 1715 514
TIlK-14 1988 drilling 1433.5 476.5
12
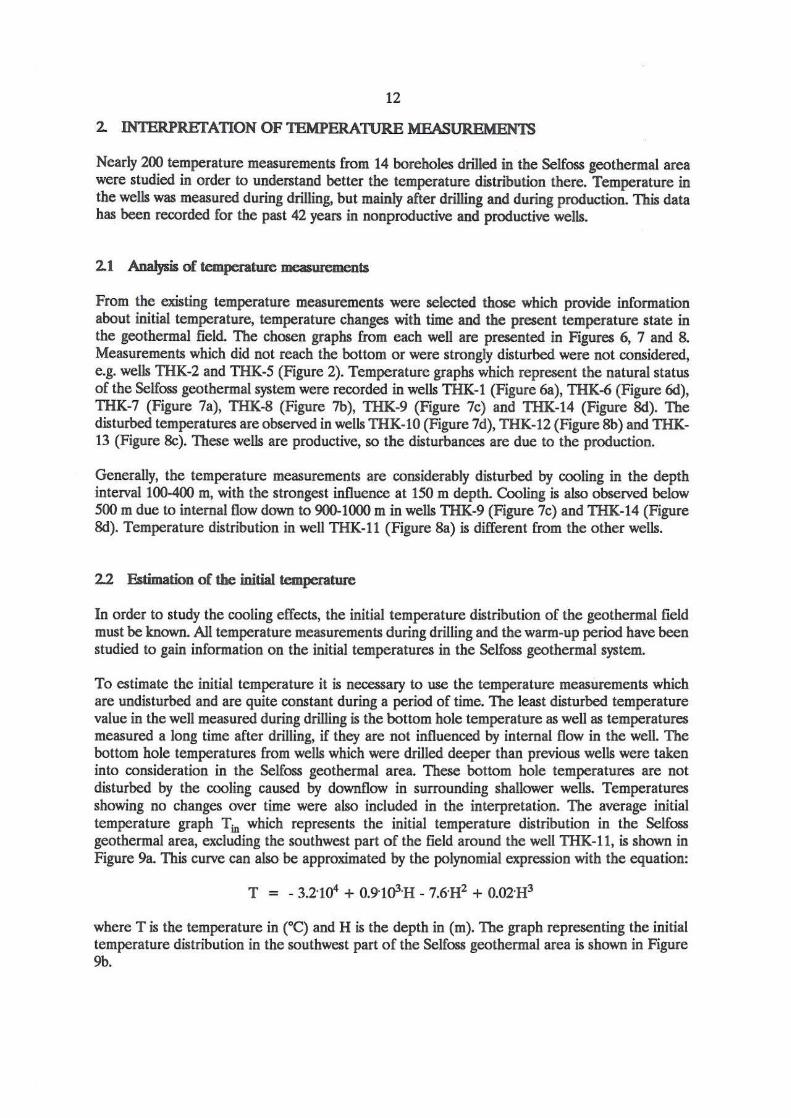
2 INTERPRETATION OF lEMPERATIJRE MEASUREMENTS
Nearly 200 temperature measurements from 14 boreholes drilled in the Selfoss geothermal area were studied in order to understand better the temperature distribution there. Temperature in the wells was measured during drilling, but mainly after drilling and during production. This data has been recorded for the past 42 years in nonproductive and productive wells.
21 Analysis of temperature measurements
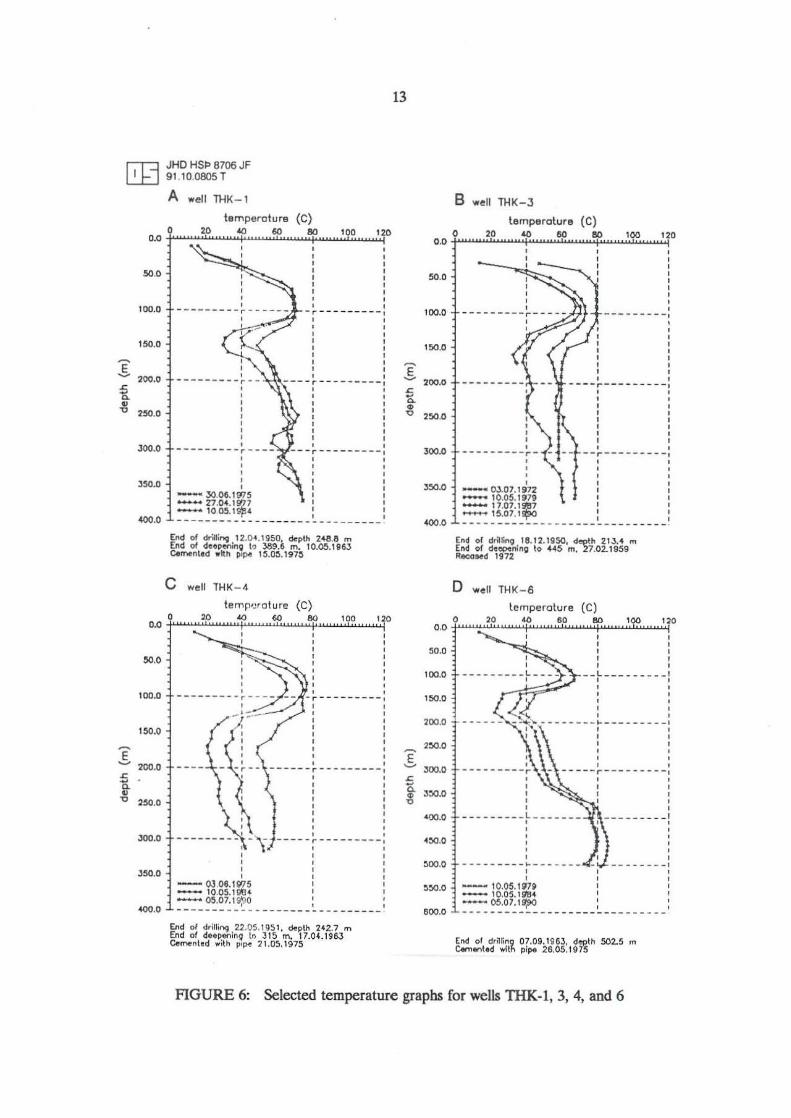
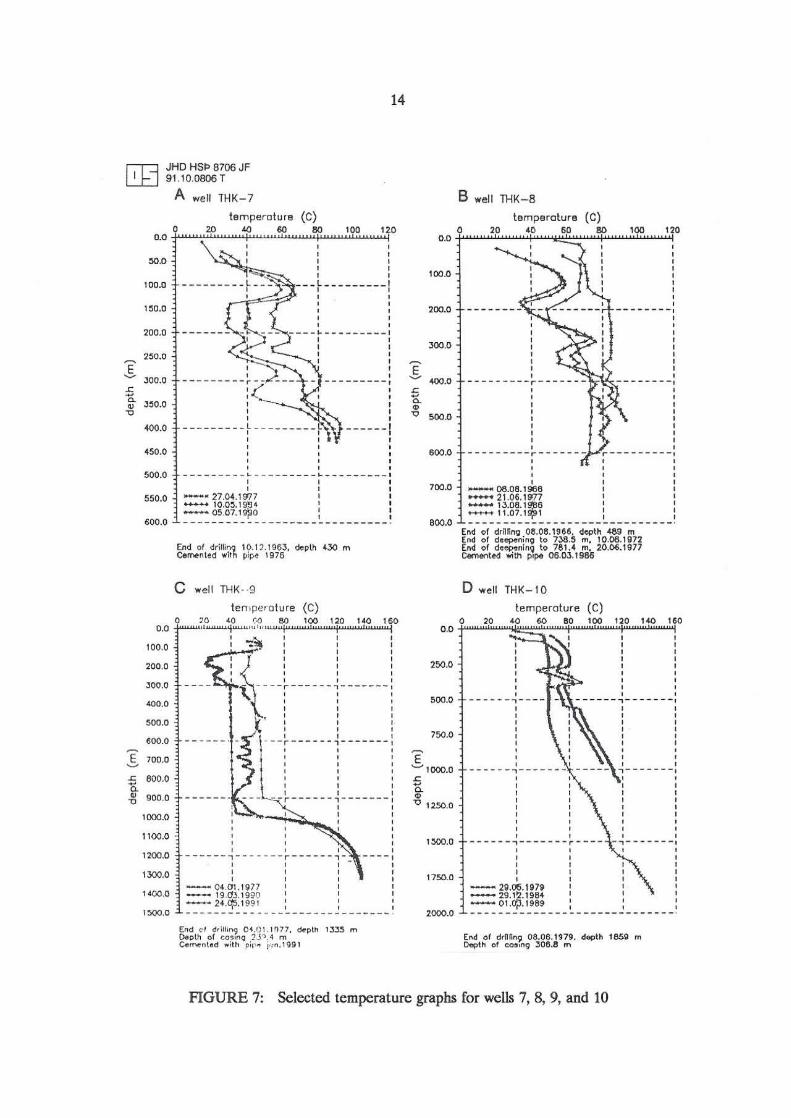
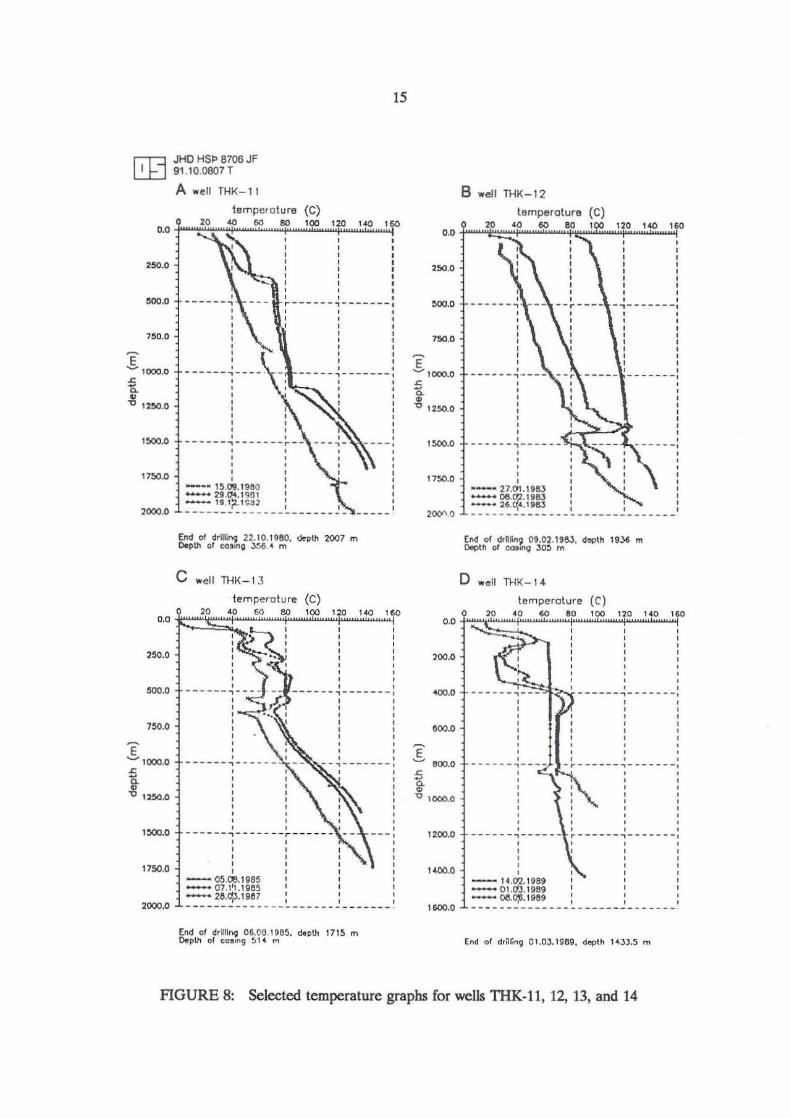
From the existing temperature measurements were selected th05e which provide information about initial temperature, temperature changes with time and the present temperature state in the geothermal field. The chooen graphs from each well are presented in Figures 6, 7 and 8. Measurements which did not reach the bottom or were strongly disturbed were not considered, e.g. wells 1HK-2 and THK-5 (Figure 2). Temperature graphs which represent the natural status of the Selfoss geothermal system were recorded in wells THK-l (Figure 60), THK-6 (Figure 6d), THK-7 (Figure 7a), THK-8 (Figure 7b), TIlK-9 (Figure 7c) and THK-14 (Figure &I). The disturbed temperatures are observed in wells TIlK-10 (Figure 7d), TIlK-12 (Figure Bb) and THK-13 (Figure 8c). These wells are productive, so the disturbances are due to the production.
Generally, the temperature measurements are considerably disturbed by cooling in the depth interval 1QO..400 m, with the strongest influence at 150 m depth. Cooling is also observed below 500 m due to internal flow down to 900-1000 m in wells THK-9 (Figure 7c) and THK-14 (Figure &I). Temperature distribution in well THK-ll (Figure 8a) is different from the other wells.
22 Estimation of the initial temperature
In order to study the cooling effects, the initial temperature distribution of the geothennal field must be known. All temperature measurements during drilling and the warm-up period have been studied to gain information on the initial temperatures in the Selfoss geothermal system.
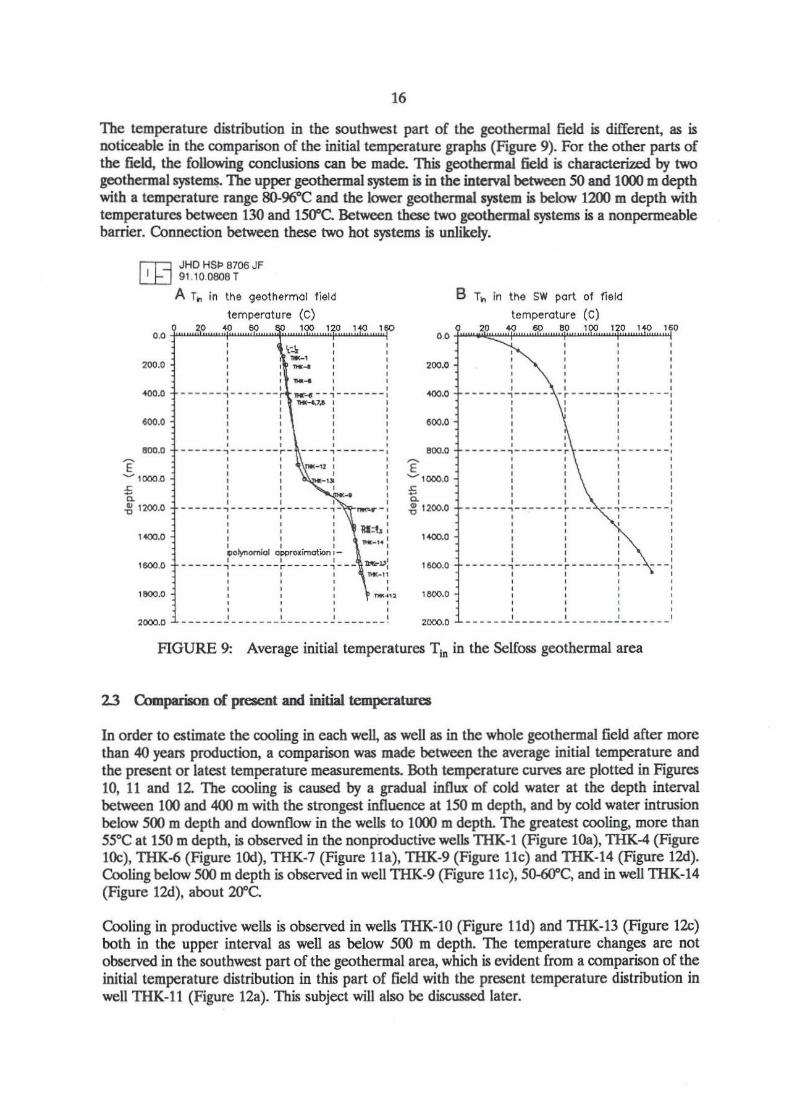
To estimate the initial temperature it is necessary to use the temperature measurements which are undisturbed and are quite constant during a period of time. The least disturbed temperature value in the well measured during drilling is the bottom hole temperature as well as temperatures measured a long time after drilling, if they are not influenced by internal flow in the well. The bottom hole temperatures from wells which were drilled deeper than previous wells were taken into consideration in the Selfoss geothermal area. These bottom hole temperatures are not disturbed by the cooling caused by downflow in surrounding shallower wells. Temperatures showing no changes over time were also included in the interpretation. The average initial temperature graph Tio which represents the initial temperature distribution in the Selfoss geothermal area, excluding the southwest part of the field around the well 11IK-ll, is shown in Figure 9a. This curve can also be approximated by the polynomial expression with the equation:
T = - 3.2·Ur' + O.~lo'·H - 7.6·H' + O.02·H3
where T is the temperature in re) and H is the depth in (m). The graph representing the initial temperature distribution in the southwest part of the Selfoss geothermai area is shown in Figure 9b.
0.0
50.0
100.0
150.0
I 200.0
250.0
JOO.a
J5000
"".0
50.0
100.0
150.0
E ~ 200.0
~ • ~ 250.0
.:mo.o
.l~O.D
400.0
JHO HSI:> 8706 JF 91.10.0805 T
A .... ell THK-l
temperature (C) 20 '06080 000
,
, , , , , , , , , ---------,. ------ -r--- ------, ,
, , , ---------r- -, , , , , , , ,
, , -- 30.06.1975
, , , , , , , , , --- -r ---------, , , , ,
, , ---r ---------, , , ,
::::: ~~.g;: :~~ , ---- -- --------------- -- ------
End of dn/!i ..... 12 .0~ . 19S0, depth 248.8 m [lie! 01 <lee~tw'lln~ I., 389.6 m. IO.~.le6J Cemenlld with PIP" t~.O~.197!1
C well THK - 4
, , , , , ---------,.- --- -r---------, , , ,
_ , -o"c-- -/ , ,
------\-\ , , , , - O3,0&,lgry5 -10,OS.1~H -0:5.07,19,1)0
, , , , , , , ----- -,.-- -------, ,
, , -----r---------, , , , , , , ,
&<1 01 drilliroQ 22.05.1951, ","plh 242.7 m End 01 d"l>.,in~ to 315 m. 17.04.19e.:J Cement.cI .. ah pIP'! 71.05.197-'
13
!.
.§.
~ ~
B well THK-3
temperature (C)
'0r-""~'o:-""C"~"""""~"".!.,~"""'~oo~""""'o 0.0 ~
50.0
100.0
150.0
"".
J""
""0
, , ---------, , , , , , , , , , ,
, -- ro.07.1972 ........ IO.OS.11l79 -- I'.07.IS'e7
---- .... ---------, , , , , , , , , , , , --r---------, ,
_15.07 . I~ • ._-- -------- -- ---------._ --- -End or dt~~"9 18. 12. 1950, depth 213.4 '" EM of dceponlnll to 445 rn. :27.02.1959 Rtoe<l .. ~ 1"2
Dwell THK-S
lemperoture (C) o '0 40 I!O 80 lOO '20 0.0 f~u::;;;.,-~'iI:...~.;:,:,'"'""'1'1 c...""C''''"~"'1 , , ,
50.0
100.0
1:50.0
200.0
:2!1O.0
300.0
J!IO.O
<00.0
4:10.0
:\00.0
:\:10.0
800.0
, , , , , , , , __ L ________ ., , ,
, , , -----.-- - -------, , , , , ,
-- -------~--- ----,
, , , , , ---------! ,
- --------~------- --------. , , -- 10.05. 11179 - 10.05.111'114 -- ~.07.11J,9O I -- --------- ------------ -- --- -
End or d,~r.no 07.09.Ig6.1. depth 502.5 m c.m .... t~ wit" pi~ 26.05.1975
, ,
FIGURE 6: Selected temperature graphs for wells THK-l, 3, 4, and 6
.5-
= ~ • ~
.5-~
" • ~
14
JHO HSp 8706 JF 91 .10.0806T
0.0
"'.0
100.0
1:50.0
200.0
2:50.0
JOO.O
J~O.O
400.0
450.0
500.0
550.0
600.0
0.0
100.0
200.0
JOO.O
400.0
500.0
~OO. O
700.0
eoo.o gOO.D
1000.0
1100.0
1700.0
1300.0
1400,0
l~,O
A well THK-7
temperature (C) 0 2.0 .40 60 80 "0
, , , , , , -- - ~ - --------l
,..-1=~ ,
, _ ___ .. _________ 1
__ ______ / :-SL '{ , -, , ,
, , , , , , , , , , ____ p o_po ,
• · • , , -- - ------~ ----- ----, ------ 1 , , ,
----- ---- ~ -- -- ----- .. ----_- ___ I , , , , , , -.27.0'.1977 I I .......... 10.0!l.1~14 ' , -05.07.19)'0 : : ---- ------- -----------------_ .
End 01 drill in<;! 10.12.1963. ~pt~ 430 m lAmented ",ith pi~ 19 76
C well TH K· ·9
tempe'o tu re (C) 0 '0 ~o (.() 60 lOO 120 10'0 160 "~ ...... u"" ·"""'1 ' I ' I
: ~: : :
~- - --l------;-------i , , , , , , Ii" , , ,..' I I
------1l --r------:-------! , , , , ------- --- -- -r------ ,-------,
'-"'>.-~- ' , , , ,
----- - ~- ----- -r ------,-, , , , , , , , ~- 04.('I . ' g77 I __ 19.0J. HI~Q I --2 • . <1,5.1991, I
, , --- -I , , , , ,
---------- -- -- --------------- . End c-f d,;U,"9 0<.1) 1.1'177 . <Hp ln 13J..5 m o..p\i1 01 ~'''''n<;l .1 J ~ :4 m C.me"lod ,.. ,11, P " '~ ),,~. I ~g l
B well THK - 8
temperature (C) \0~"".2~0c. .. ~'~0~"""'~0e" .. .,~ .. ""'~OO~ .. ~'20 0.0 1
100.0
200.0
300.0
E ~ <00.0
t • ~ 500.0
600.0
700.0
600.0
0 .0
250.0
""'.0
750.0
E ........ 1000.0 ~
~ ""0 1250.0
1~.O
1750.0
2000.0
, , , , _06.06.1966 1 ....... 21 .06.19n 1 ............ 130!l19!!6 I
......... 1107.1$1 :
, , ---- ----, , , , , , , , ,
------------- --------------- -. End or dr~r.no 08.06.'9~~ . depth 4a9 m End 01 d.~ni"o to 738.' m, 10.06. 11il72 En<! 01 d~~nl"9 to 781.4 m. 20.06.1&77 c.mtntf4 ";tn pIP<' 06.OJ.1986
Dwell THK-l0
temperature (Cl o 20 40 60 !l0 100 120 140 \GO
, ------.,- ---
, , , ---- --.,----- --, , , , , , , , ,
, , ,
, , ------,------ -, , , , , , , , , , , , , , ,
------.,-------~ - - --, , , , , , , , , , ____ llil.06.1Iilllil I __ 29.12.151114 I
-- 01.0',3.1989 ,
---- ---------- -- --- ---------_. End 01 drOIlr>9 08.06. 1979. d""th 1840 m Ooopth 01 003.n9 306.8 m
FIGURE 7: Selected temperature graphs for wells 7, 8, 9, and 10
rn •••
250.0
:100.0
750.0
E -'000.0
t • ~ 12$0.0
l~.O
1750.0
2000.0
15
JHD HSP 8706 JF 91 .10.0807 T
A well THK-ll
• temperature (C)
" ..
, , , , , , , ,
" " '''' ". , .. '"
, , , r------,-------~ , , , , , , , , , , , , , , -- --- , ----- --, , , , , , , , , ,
, , ------,-------r--, , , ,
-~ 15.09,1980 """"·29,0..1901 -.. 1I.,::u ro:l2, , ---------- -------------
End 0( dr~ 22.10.1980. depth 2007", Depth 01 cc"ng ~. 4 m
C well THK-IJ
temper'oture (C) o 20 '0 60 60 100 120 UO 160 ... ~~~""'P'4
250.0
SIlO.D
750.0
E -'000.0 ~
~ "1J ' 2~.O
"00.0
1750.0
2000.0
, , , ------,- ----- --,--- - ---,
, , , -- -- --,--- ----,.- -----, , , , , , , , , , --~.oe.li85 I
- 07. 1~.li8~ -... 28.~.1&87 I ,
, , , , , ,
-------------------- ----- ---_. End 01 drilll"'jl 0&.08.1985, de~th 1715 m Oeplil of co",ng 514 m
B well THK-12
temperature (C) o w ~ ro ~ tOO lW ,~ 1~
•.• j-""'i~~...:i'-""~""';';::"';;;;;"'''''i
2~.O
:100.0
750.0
E -'000.0 ~
"0-• '0 1~.O
l!>OO.O
1750.0
200'''')
••• 200.0
, , , -,-------, , , , , , , , , , , , --pp-pp,
, ------..,------
, , , - 27.(11 1t&J ' --- oe.Q',2 .19" ' - . U .Dj,.19&3: , ---------_._- ------------._ --
(lid of dr.r.n'jl 09.02. 19&3. <h.pth 19J.6 m Depth or 0tIS"'9 30:':1 m
Dwell THK-14
tcmperoture (C) • " .. " .. '''' ". '" ". I I , I , , , , , , , , , , , , , , ,
400.0 - - - -.~-:-:-:,~_~_""_'>l'''_.!. . -----~ --. ----:
..... S
1100.0
i "0 1000,0
1200.0
uoo.o
1600.0
, , ------ .,------
, -- 14.(12.198& -- 01.O'J.lIH!9
, , , , , , , , , , , , , , , , - .. - --- --,- --- - -.,
, , r------,-------, , , , ,
- oe.~.1989, I
-------------- -------------- -End 01 d,~r.n!il 01.0J.l~1I9. depth 1433.5 m
FIGURE 8: Selected temperature graphs for wells TIiK-ll, 12, 13, and 14
16
The temperature distribution in the southwest part of the geothermal field is different, as is noticeable in the comparison of the initial temperature graphs (Figure 9). For the other parts of the field, the following conclusions can be made. This geothermal field is characterized by two geothennal systems. The upper geothermal system is in the interval between 50 and 1000 m depth with a temperature range 8O-96·C and the lower geothermal system is below 1200 m depth with temperatures between 130 and 15(fC. Between these two geothermal systems is a nonpermeable barrier. Connection between these two bot systems is unlikely.
r.r::1 JHD HS~ 8706 JF ~ 91.10.0808 T
.,.,.,
600.'
000.'
E - 1000.0 ~
0. -!: 1200.0
.. "'. 1$00.0
leoo.O
2000.0
A T .. in the geothermol f iel(j
temperature (C)
, -~ , , , , , ------, ------- M" .. - -, - - - - -- - , , , _ 7" I I , , , , , , , , , , , , , , , , , ,
------.,----- --~- ----.,---- ---, , , ,
, 1II~~ : , , , - -,.: , , , ,
'Polynomiol opproo imotion , , , , ------.,---- -- -,--- - - - ~-- -, , , -.1.0: -" , , _ ...
, , , , , ----------------------------_ .
" 200.0
'00.0
600.'
."'. E -'000.0 ~
0. ~ 1200.0
, """' '600.0
1&00.0
2000.0
B T", in t he SW part of field
temperature (C) 20 4<l &0 80 1 1 0 H O 160
, ----- -,-----, , , ,
, , , ,
, , , , , -,------ , ------ -, , , , , , , , , , , , , , , , -- ---,-------, , , , , , , , , , , , ,
------,-------~--- --,-- ---- -, , , , , , , 1 1 , ,
------,----- - -~- - ----,-- - -- -, 1 1 , , , , , , ,
, ____ __ J _______ ~ ______ J _ __ __ _ _
FIGURE 9: Average initial temperatures Tin in the Selfoss geothermal area
2.3 Comparison of present and initial temperatures
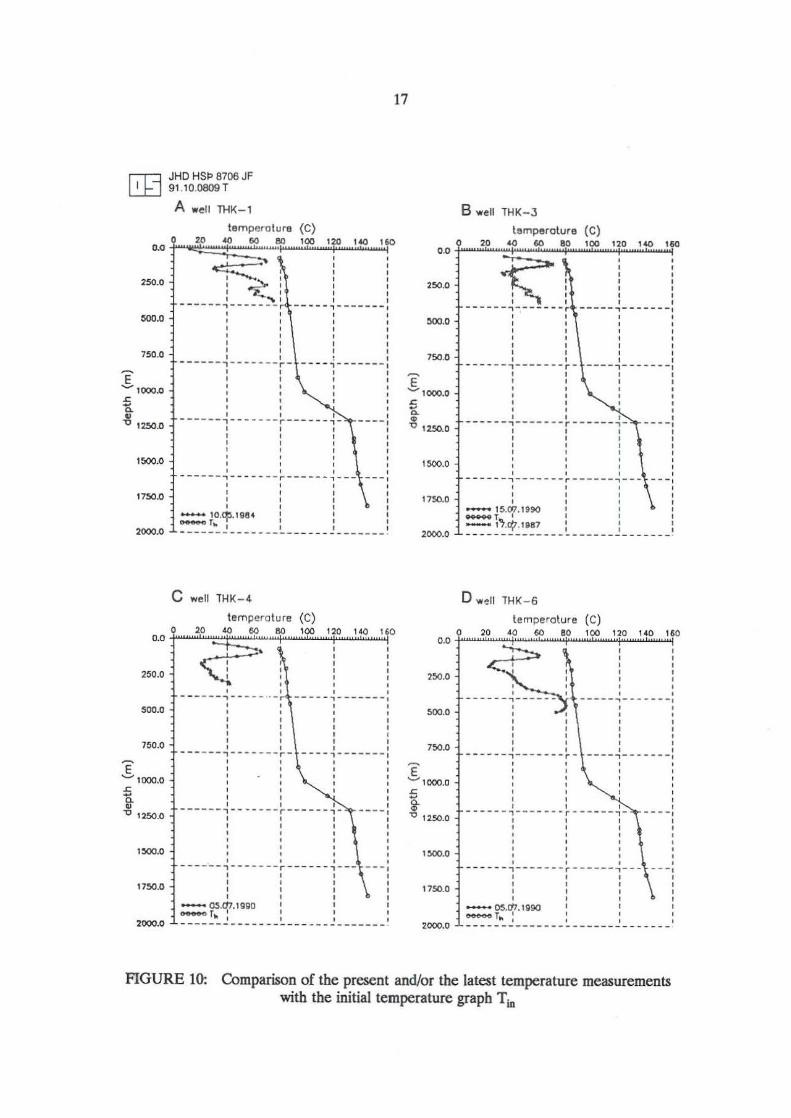
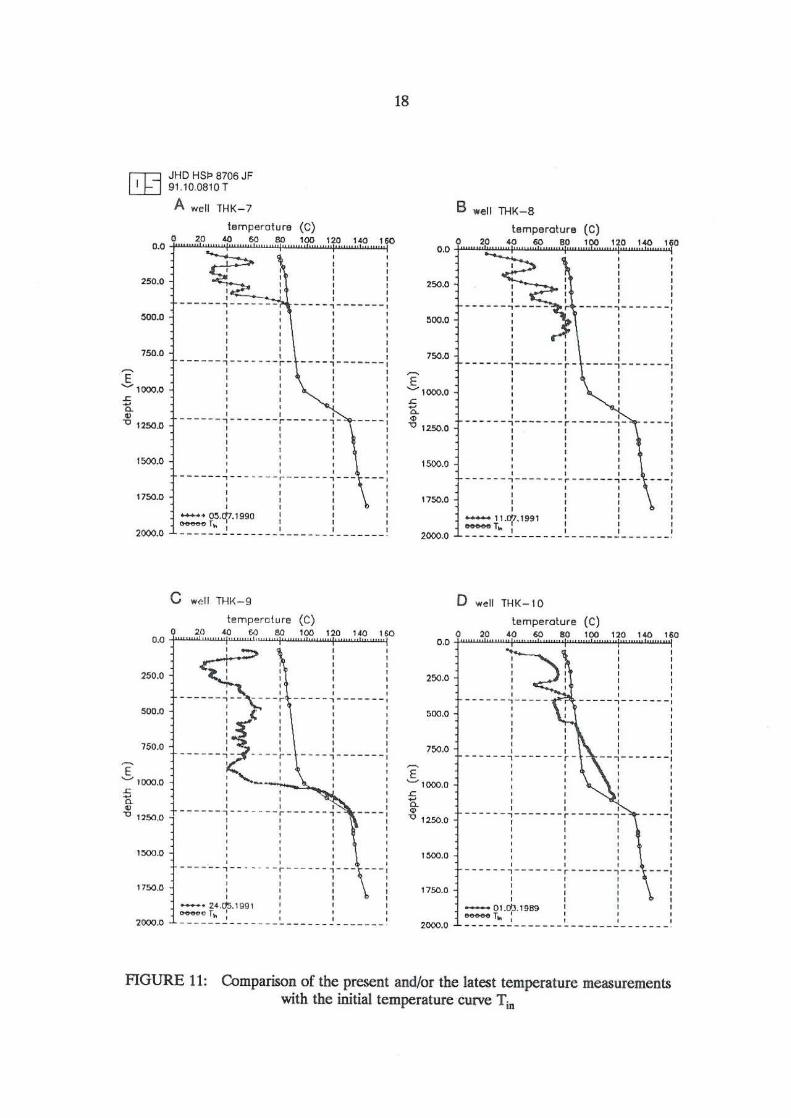
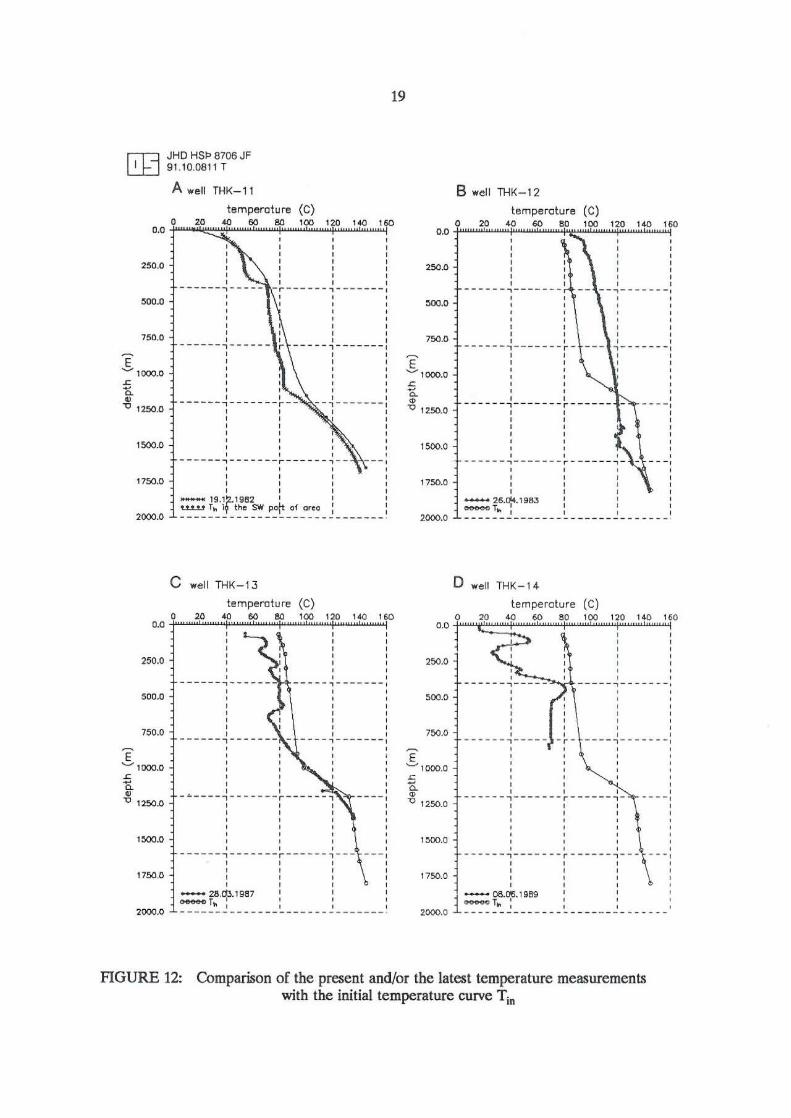
In order to estimate the cooling in each well, as well as in the whole geothermal field after more than 40 years production, a comparison was made between the average initial temperature and the present or latest temperature measurements. Both temperature curves are plotted in Figures 10, 11 and 12. The cooling is caused by a gradual inDux of cold water at the depth interval between 100 and 400 m with the strongest influence at ISO m depth, and by cold water intrusion below 500 m depth and downDow in the wells to 1000 m depth. The greatest cooling, more than 55' C at 150 m depth, is observed in the nonproductive wells THK·I (Figure lOa), THK-4 (Figure IOc), THK-6 (Figure lOcI), THK·7 (Figure lla), THK-9 (Figure l1c) and THK·14 (Figure 12d). Cooling below 500 m depth is observed in well THK·9 (Figure Ilc), 50-60"C, and in well THK-14 (Figure 12d), about 20"C.
Cooling in productive wells is observed in wells THK-IO (Figure \Id) and THK·13 (Figure 120) both in the upper interval as well as below 500 m depth. The temperature changes are not observed in the southwest part of the geothermal area, which is evident from a comparison of the initial temperature distribution in this part of field with the present temperature distribution in well THK-\I (Figure 12a). This subject will also be discussed later.
17
JHO HSI=> 8706 JF 91 .10.0809 T
A well THK-1
temperOh H 8 (C)
0.0 ...... ,
l°f-";'Eo~~"f::~"~ ., '90 'r 'to 'r 250.0
:100.0
750.0
E -'000.0
t • 1J 1150.0
1500.0
1750.0
2000.0
~ .... , ...:" I , ~ ,
, , , , , , , -" , , ------,- ------ -----,-------, , , , , ,
, , , , , ------,-------,.- ----, ----- -- , , , , , , , , ,
, , , , , ------,-- -----,.----- -,-, , , , , , , , , , , ,
, -__ A, , , , , , , , I I ,
--- - - - , - --- --- ,------,--- __ A, , " , , , , , ,
__ IO.~' 9114 I _T .. , I I :
----------- -------------------
C well TI4K-4
temperature (C) o 20 40 ro eo 100 120 140 ao
0.' tj """',,", "!:~±::-"':""";'i'1 ""';;r;;., ....:.;!"-'''', "'""i! « ~. i 250.0
,oo~
750.0
E '-' 1000.0
i 1;:1 1250.0
"00'
1750.0
2000.0
, , , , -- --- -.,-- --- -' r -----, --- ---- , , , , , , , , ,
, , , , , , , , ------,-------,.- ---- .,-------, , , , , , ,
, ,
, , , ------, ---- ---,. ------,-, , , , , , , ,
, , , , --- ---,-------,. ------, ---, , , , , , , , , , , , __ 05.c17.IIIIIO I I _r .. : : I
, , ___ A, , ,
, - - - r , , , , ,
--------- ---- -------------- --
0.'
250.0
~oo.o
750.0
E - '000.0
t • 1J I2S0.D
lSOO.0
1750.0
2000.0
M
250.0
"".0
150.0
E -'000.0
~ 1J 1250.0
1 !IOO.O
1750.0
2000.0
•
B well THK-J
temperature (C) 20 «J 60 80 100 120 HO 160
, , , , , , ~, , , ------., -------r -----.,------ -, , , , , , ,
, , , ,
,
, , , , ---- -- ., ------- r- ----.,-------, , , , , , , , ,
, , , , ------.,-------r------., -, , , , , , , , , , , , ,
, ----, , , , , , , , , , , ---- -- ., ------ -r------.,--- ---, , , , , ,
........ 15.00'.lii90 ' _T' , - ,"".0\1.1'87: , . _--- ---------- -------------_.
Dwell THK- 6
lemperature (C) ~o '0 60 eo lOO '10 HO lliO
~ , ---~:h , , -----,-- - ----, , , , , , , , , , , ,
, , , , , , , , , -- -- -- .,------- r- ----.,-- ----- , , , , , , ,
----- -.,-------r--- ---.,-, , , , , ,
, , , ------.,-------r-- ----,-- -, , , , , , , , , , - 05.00. 11190 ' _r,,: , ,
,
, ---, , , , ,
-----------------------------
FIGURE 10: Comparison of the present andlor the latest temperature measurements with the initial temperature graph Tin
0.0
250.0
:100.0
750.0
E .......... '000.0 ~
0. • 1) 1250.0
1500.0
1750.0
2000.0
0.0
250.0
500.0
750.0
E ...... 1000.0 ~
0. • "0 1250.0
l:lOO.0
1750.0
2000.0
JHD HSp 8706 JF 91.10.0810 T
A well THK-7
temperoture (C) o " ..0 60 so 100 120 140 160
~-, , , , , , , ,
------.,--- ---- -- ---,-------, , , , ,
, , , , , , , , --- ---,--- --- -r- ----,-------, , , , , , , , ,
, , , , ---- --,--- ----r------,-, , , , , , , ,
,
, , , ------,-- --- --r------~---, , , , ......... 0!l.o/.1990 : _"T~, , t
, , ----I , , , ,
, ---,
---------- -------------------
C well THK-9
o temperatu re (C)
le 40 to eo lOO ll0 HO HO ............... , I , I ' t ::> , , , , , .r.: I ,
, , ----~) , , ----- ,-------,
, , , , , ,
, , , , , , :~ : - -- -- -~- -.-- ~-
, , ----,-------, , , , , , -_.-,,-...... _. :
, , , , - -----~--- ---- ~------,-, , , , , ,
, , , , -- -- --~-- - _. -- ,..------,- --, , , , , , , -. 24 .d'5.1 119' ' _"r~: , ,
, , , ----, , ,
, --- , , , , , , --- --- -- ------- --- -----------
18
0.0
"0'
:100.0
750.0
E -'000.0 ~
0. • "0 1250.0
1500.0
1750.0
2000.0
0 .0
250.0
500.0
750.0
E - '000.0 ~
g. ""0 1250.0
l~.O
1750.0
2000.0
B well THI<-8
temperature (C) 0 " 40 60 80 100 120 IoW , 0
, , , , ,
, , , , , , , , -----,----- --, , , , ,
,
, , -- ----,-------r- ----,-------, , , , , , , , , , , , , , ------,-------r------,-, , , , , , , , , , , ,
,
, , , ----, , , , ,
I , , I ------,-------r------,--- ---, , , , , , , , , ----,1.11,7.1991 " _r .. , :: --- -- ------- -- ----- ---------_.
o welf THK-l0
temperature (C) o 20 40 60 !O 100 120 140 160
, , , , , , , ---- --, -------r -, , , , , ,
, , , -----,---- - --, , , , , , , , , , --,-------, ,
, , , , , , ------,-- -- -- -r------,-, , , , , , , , , ,
----, , ,
I , , r ------,--- -- --r------,--- ---, , t , I
It' , , , , , , , , , _ 01.Cf.l. HIM' t , _To.: ' , -------- --- -----------------_.
FIGURE 11: Comparison of the present andlor the latest temperature measurements with the initial temperature curve Tin
'.0
25C1.0
:;00.0
750.0
E .....- 1000.0 ~
0. • "'0 12.50.0
1500.0
1750.0
2000.0
,n
250.0
500.0
750.0
E ........ '000.0
~ • U 1250.0
1500.0
17M.O
2000.0
JHO HSI:> 8706 JF 91 .10.0811 T
A well THK-l1
temperoture (C)
19
, ~ 50 80 100 120 UQ '60
, , ------, --- --
, , , , -------,------
, , , , , , , , , - ~------, -- -----,
,
, , , , , , -----,- ------, , , , ,
, , ---- --,-------r--, , , , , , , ,
" , -- -- --,------ -r------, -- --, , , , , , -19.1:z.1!162 I , U1..U r~ \9 tile S'N pot'- Qf areo :
------------------- ---------_.
C well THK - 13
temperat ure (C) , " ~ 60 80 100 120 140 160
, , -----,-- --- --, , , , , ,
, , , , , , , , ------, ------- -- -- , ----- - -,
, , , - ~ ----,-- - - - - - r- - --- - , , , , ,
, , , , - - - -- .~ - - -- - -- ~ - -- --- ~ ---, , , , , , , , __ 28.cn.1987 _r~ : ,
, ---- , , ,
, --- , , , ,
--------------------- ------.-
B well THK-12
temperature (C)
,0:-",'~',"";"'''_"'''::'_~'''",~'~''''::''':'4'~'_~' ""'::"..!.j'" 0.' ,
250.0
:100.0
750.0
E -'000.0 ~
"-• "'0 12.50.0
1500.0
1750.0
2000.0
00
250.0
~oo.o
750,0
1~.0
1750.0
2000.0
, , , , , , , , , , , ,
-- ----.,------- --..,- -- ----,
, , , , ----- -,-------r-, , ,
, , , ------,-------r------, , , ,
, , ,
, , , , , , , , ---- -- -, , , ,
, , - ---, , , , ,
------,----- -- r------,-, , , , ........... 2&.114.1983 ".,.,...., To. : , , -----------. ---------------- -
Dwell THK - 14
temperature (C) , " 40 60 80 100 no 140 160
, , , -- --- .., - - --- --,
,
, , , , , , , , , , -- - - --~ - - - -- -r- --- - ~.-- - ---,
, , , , , - - - ---~- ----- - r- · ----~ -, , ,
, , , ------~--- - --- r ----- -~---, , , ,
-.- 08.0'5. 1989 _To.: , ,
,
, , --_.,
, - --,
+--- -- _. -.- ---- --- ._----- ----
HGURE 12: Comparison of the present andlor the latest temperature measurements with the initial temperature curve Tin
20
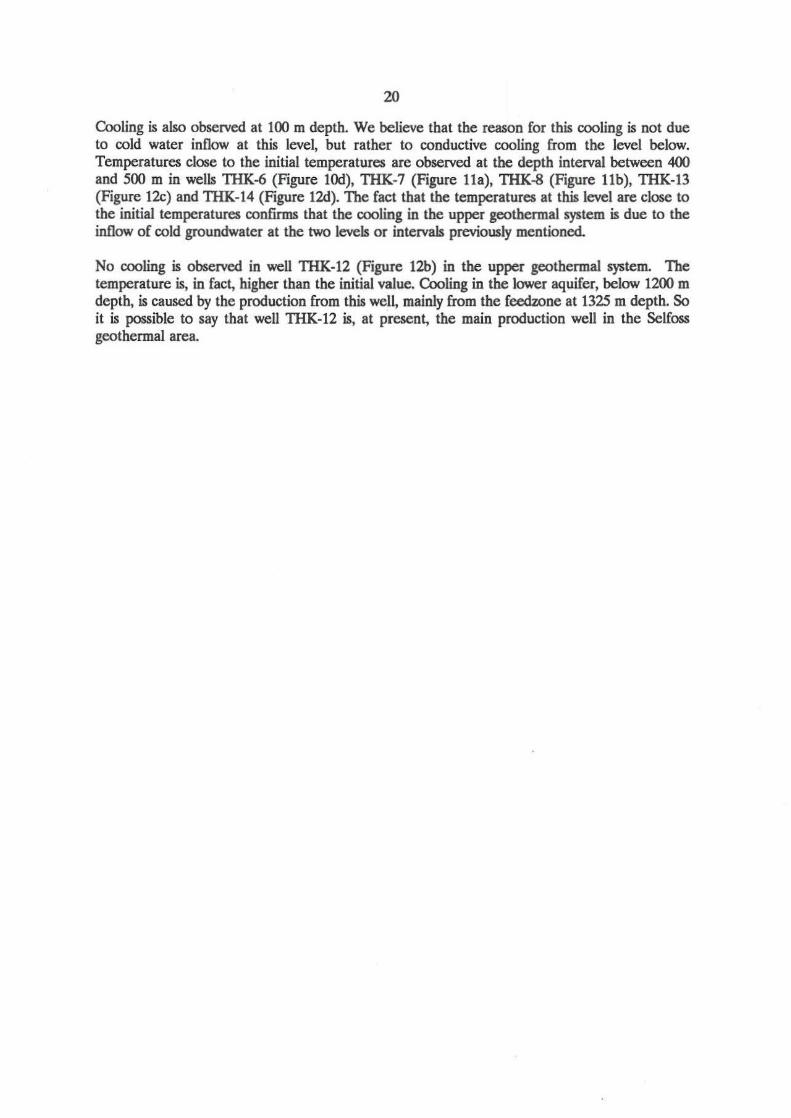
Cooling is also observed at 100 m depth. We believe that the reason for this cooling is not due to cold water inflow at this level, but rather to conductive cooling from the level below. Temperatures close to the initial temperatures arc observed at the depth interval between 400 and 500 m in wells TIfl(-6 (Figure IOd), TIfl(-7 (Figure l1a), TIfl(-8 (Figure l1b), TIfl(-13 (Figure 12c) and TIIK-14 (Figure 12d). The fact that the temperatures at this level are clooe to the initial temperatures confirms that the cooling in the upper geotbermal system is due to the inflow of cold groundwater at tbe two levels or intervals previously mentioned.
No cooling is observed in well TIfl(-12 (Figure 12b) in the upper geothermal system. The temperature is, in fact, higher than the initial value. Cooling in the lower aquifer, below 1200 m depth, is caused by the production from this wcll, mainly from the feedwne at 1325 m depth. So it is possible to say that well 1HK-12 is, at present, the main production well in tbe Selfoss geothermal area.
21
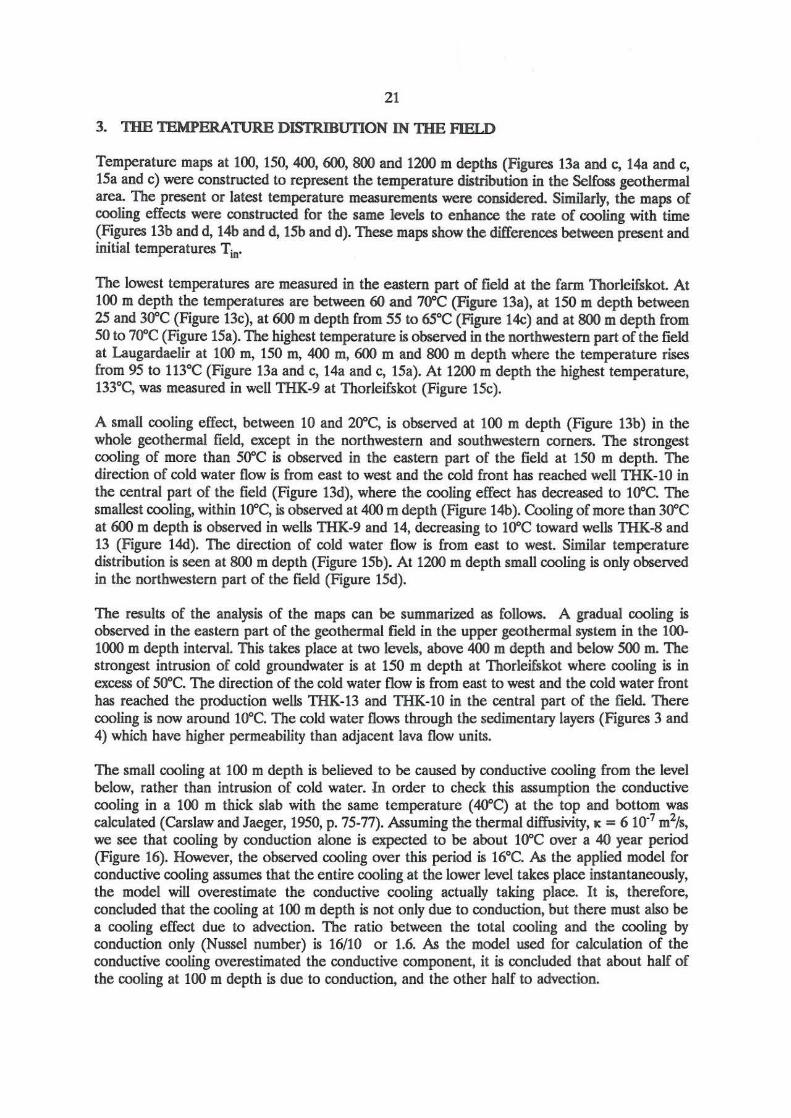
3. TIlE TEMPERATURE DISTRIBUI10N IN TIlE FIELD
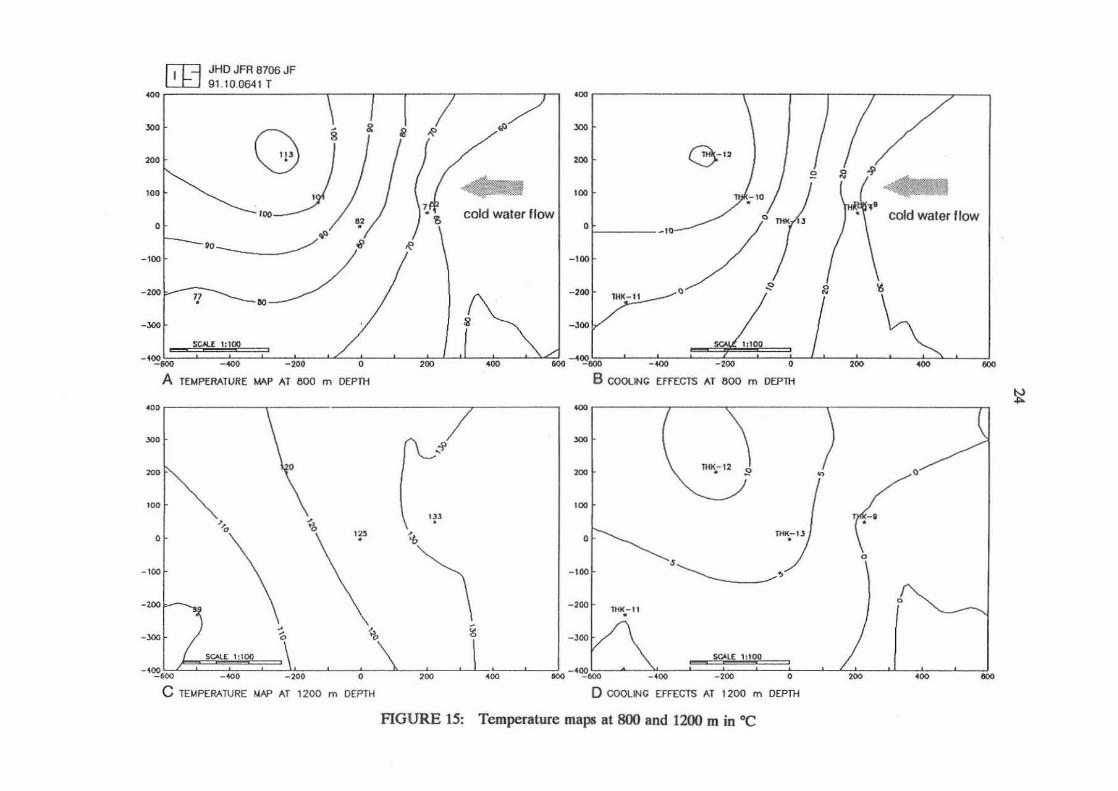
Temperature maps at lOO, 150, 400, 600, 800 and 1200 m depths (Figures Ba and c, 14a and c, 158 and c) were constructed to represent the temperature distribution in the Selfoss geothermal area. The present or latest temperature measurements were considered. Similarly, the maps of cooling effects were constructed for the same levels to enhance the rate of cooling with time (Figures 13b and d, 14b and d, 15b and d). These maps show the differences between present and initial temperatures Tin-
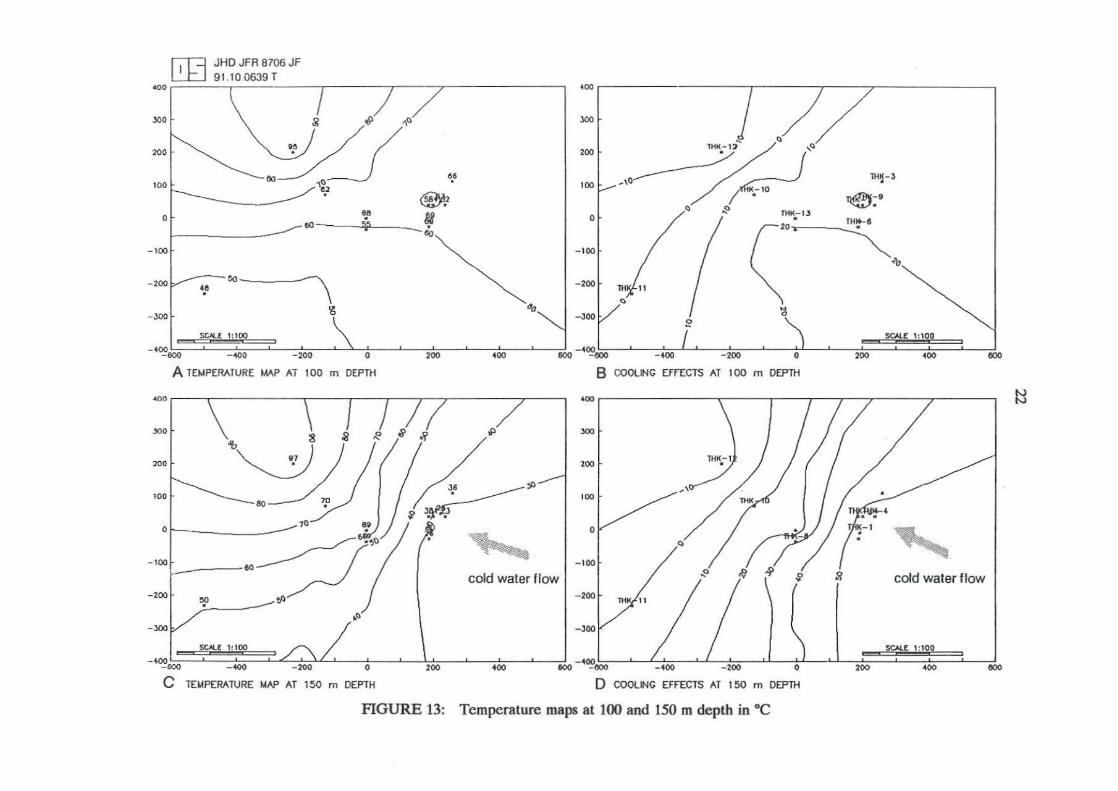
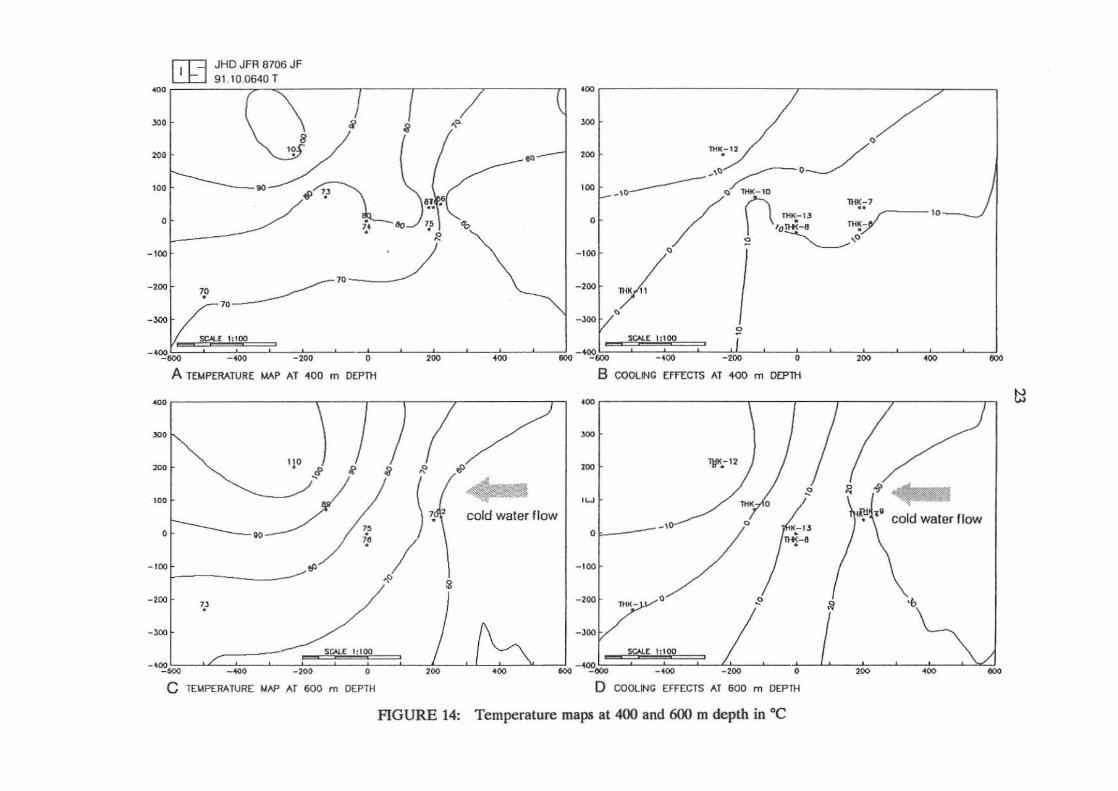
The lowest temperatures are measured in the eastern part of field at the farm Thorleifskot. At lOO m depth the temperatures are between 60 and 70"C (Figure 13a), at 150 m depth between 25 and 30"C (Figure 13c), at 600 m depth from 55 to 65°C (Figure 14c) and at 800 m depth from 50 to 70"C (Figure 15a). The highest temperature is observed in the northwestern part of the field at Laugardaelir at 100 m, 150 m, 400 rn, 600 m and 800 m depth where the temperature rises from 95 to 113°C (Figure Ba and c, 14a and c, 15a). At 1200 m depth the highest temperature, 133°C, was measured in well TIiK-9 at Thorleifskot (Figure 15c).
A small cooling effect, between 10 and 20"C, is observed at lOO m depth (Figure 13b) in the whole geothermal field, except in the northwestern and southwestern corners. The strongest cooling of more than 50"C is observed in the eastern part of the field at 150 m depth. The direction of cold water flow is from east to west and the cold front has reached welllHK-lO in the central part of the field (Figure 13d), where the cooling effect has decreased to IO"C. The smallest cooling, within 10"e, is observed at 400 m depth (Figure 14b). Cooling of more than 30"C at 600 m depth is observed in wells THK·9 and 14, decreasing to IO"C toward wells THK-8 and 13 (Figure 14d). The direction of cold water flow is from east to west. Similar temperature distribution is seen at 800 m depth (Figure ISh). At 1200 m depth small cooling is only observed in the northwestern part of the field (Figure 15d).
The results of the analysis of the maps can be summarized as follows. A gradual cooling is observed in the eastern part of the geothermal field in the upper geothermal system in the 100-1000 m depth interval. This takes place at two levels, above 400 m depth and below 500 m. The strongest intrusion of cold groundwater is at 150 m depth at Thorleifskot where cooling is in excess of SOOc. The direction of the cold water flow is from east to west and the cold water front has reached the production wells THK-13 and THK-lO in the central part of the field. There cooling is now around Hrc. The cold water flows through the sedimentary layers (Figures 3 and 4) which have higher permeability than adjacent lava flow units.
The small cooling at 100 m depth is believed to be caused by conductive cooling from the level below, rather than intrusion of cold water. In order to check this assumption the conductive cooling in a 100 m thick slab with the same temperature (400C) at the top and bottom was calculated (Carslaw and Jaeger, 1950, p. 75·77). Assuming the thermal diffusivity, K = 610" m2/s, we see that cooling by conduction alone is expected to be about 10"C over a 40 year period (Figure 16). However, the observed cooling over this period is 16°C. As the applied model for conductive cooling assumes that the entire cooling at the lower level takes place instantaneously, the model will overestimate the conductive cooling actually taking place. It is, therefore, concluded that the cooling at 100 m depth is not only due to conduction, but there must also be a cooling effect due to advection. The ratio between the total cooling and the cooling by conduction only (Nussel number) is 16/10 or 1.6. As the model used for calculation of the conductive cooling overestimated the conductive component, it is concluded that about half of the cooling at 100 m depth is due to conduction, and the other half to advection.
rjT=l JHD JFA 8706 JF LL.J 91.100639T
~ I 7
''''
~-i/~" '"
'"' '''' '.'
@k .. eo ~.,
, .,,,
.. '\ ~
.,,, ..
."",
-f~.
~I } 7
"'" ,.,
" 00
"00
.,,------Y;:.: /' /~~ (~.
' 00 lH~-3
~:' ,
lHIV- 1I
• .,., ~ • 1 sc.aL[ "'OO \ I I I ) :' £1:
1°8 I -400 ' , I ' _400" , , ,
-600 -40g -200 0 200 400 500 -1lOO -+00 -200 0 200 400 f!OO
A TEMPERATURE WJ> AT 100 m DEPTH
400 1 I J 7
~'J(~' . Y __ I/I~ r ~70 '!
~,
'"
''''
--. ""
... .... cold waler flow ~ M--:;:7'
._---,p /--
-200~ ~
~ . . "",
B COOlING EffEClS AT lOOm DEPTH
'001 \ }) I
"'"
'00 ,.,
,
" "00
~ s cold water flow · '00
.,., ."",1 "'" ":00 . /:\ /. \ . , 1 '.001 / I ,I,) ":""'"" 1
-500 400 _:MM) 0 200 400 600 - (lOO -400 -200 0 200 400 000
C TEI.4PERATURE t.Wl AT 1 ~ m DEPTH D COOlING EFrECTS AT 150 m OEPlH
FIGURE 13: Temperature maps at 100 and 150 m depth in 'C
I:l
rj"T"=l JHD JFA 8706 Jf LJ:J 9 1, 10.0640 T
400 1 7 "" 7 11
"" , ," N 0
~ " ~~.,
• ....../ 15 1 1> 7.4 • R
" ~o
." o
~ " ~" • 70-
.. '"
.,,.
. "",
'00 , 7 :/
"'"
"" .,. ,
.. '"
.,,,,
.""
lHKy .,~.,,~oJ'
/ " '0 ~'.-" "'!;' :/ ! '~y'-" • V y E 1:100 I I sg+[ I"go I I
_ 400 ' , I , , -400" ! t , ,
-6()() -400 -200 0 200 400 !lOO -600 - 400 - 200 0 200 400 eoo A TEI.4PERATURE MAP AT .. 00 m DEPTH 8 COOLING Ef fECTS AT 400 m DEPTH
400 I J 400 I j
~, "" ~ .~. [ :roo ~,> '- ~j./R ~
"'> ~ , o r------~ / ~
... cold water flow
llI".-12
of _"/0--" -,00 1-
-200 1- niK- ' '''''''''O "
- 100 t ____ fiJ
" • '.'
.,,. ~ "
."", .,,,, _ 400 1 ,,(, ~ S~[ I~ / I ': \, I -400 1 r e 1:: 00 / ' .\/1
-500 -4(10 _:KID 0 200 400 600 -/lOO -+00 -zoo 0 200 400 eoo
C TEMPERATURE MAP AT 600 m D(P1H D COOlING EFFECTS .... T 600 m OEPlH
FIGURE 14: Temperature maps at 400 and 600 m depth in °C
Cl
rn JHD JFA 8706 JF 91.10_0641 T
~OOIr-----------------------r------r---.------'------------c,-, ~
/ "" ""
'"
• -"'. -wo
cv '" " ..0' • j .. ~ " ~:/ '1
• ~ " ..... " ~ r cold water flow
"'" '" 1/ f "'" f 13-"
~ 0 . ,0
I ~ \ -100
~ -2CO l- A lHK- ,1 g ~
-"" g -,100
-... - 0 e' ":00 , ./ , I ,I , ::'.d ...... 1 , 1" ''''\'' ,I , ';--." 1
00 -400 - 200 0 200 wo IlOO -eoo -400 -too 0 200 400 &00
A TEMPERATURE IMP AT 600 m DEPTH B COOLING EffeCTS AT 800 m DEPTH
'" ~
"" ," "" "" '00
• -"'. -100
-""
'~J ~ ". '?'
''\ ;. " t,
~ " "'" .00
• -'00
-,oo r lltK .. _ ' ,
/' -lOO
'~,
lHK..-'2
(' •
•
I ( SCAl[ ",00 \ \ I I \ Tn"op I I I -400 (, , '" -400 ' L""
-Il00 -400 -200 0 200 400 IlOO - 000 - t OO _too 0 200 400 000
C TEMPERATURE )"lAP AT 1200 m DEPTH 0 COOLING EFFECTS AT 1200 m DEPTH
FIGURE 15: Temperature mapo at 800 and 1200 m in 'c
~
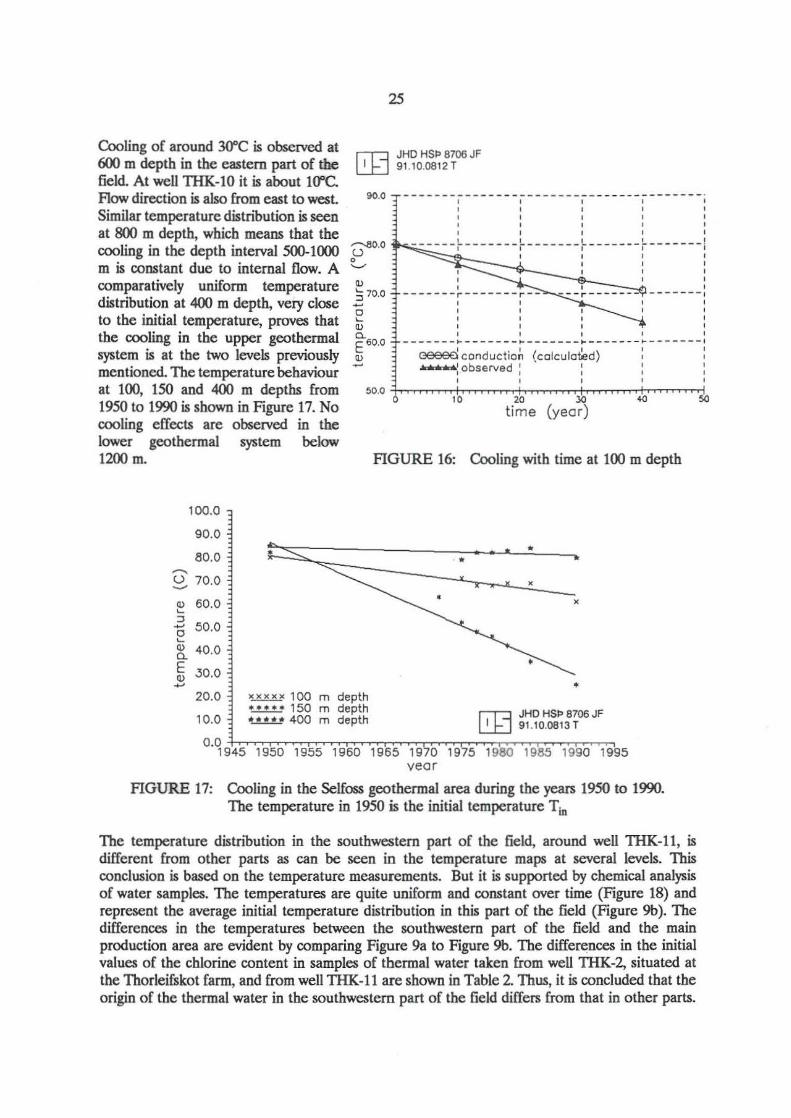
Cooling of around 3O"C is observed at 600 m depth in the eastern part of the field. At well THK-IO it is about 1(1'c. Flow direction is also from east to west. Similar temperature distribution is seen at 800 m depth, which means that the cooling in the depth interval 500-1000 m is constant due to internal flow. A comparatively uniform temperature distribution at 400 m depth, very close to the initial temperature, proves that the cooling in the upper geothermal system is at the two levels previously mentioned. The temperature behaviour at lOO, 150 and 400 m depths from 1950 to 1990 is shown in Figure 17. No cooling effects are observed in the lower geothermal system below 1200 m.
100.0
90.0
80.0 ~
u ~
70.0
~ 60.0 ~
..... 50.0 ~ ~ 40.0
~ 030.0 -
•
90.0
25
JHD HSp 8706 JF 91.10.0812 T
---------- ----- -------- -------------- -_. , , , I , , , , ,
fO.o r~-~-",-",-:::-,,-~f:::-::-::-:-::-:-~-tf:-:--~---~---~f~-----------_-l: -------i
III ~, , , 570.0 ----- --r--- ----- r-- --r--- --- -- -- ----- ,
I I " Cl I " ~
" 0. E60.0
"
I , I ,
-------~ - - - -- -- ~-------~ ---- ---~- - -----I , , C39900 conduction (colculated) - __ : observed: I
50.0 +-~~"":l"""~~T~~.,.."trr~~~~~""?, o 10 20 30 40 so time (year)
FIGURE 16: Cooling with time at 100 m depth
• •
• 20.0
10.0
~ lOO m depth ~ 150 m depth ,..~ 400 m depth ~ JHO HSp 8706 JF
~ 91.10.0813 T
0.0 3:':'C=7C='.C=::':"""='-"'=,....,="-'=,,=""== ":':=",= 1945 1950 1955 1960 1965 19 0 1975 1980 1985 1990 1995 vear
FIGURE 17: Cooling in the Selfoss geothermal area during the yean 1950 to 1990. The temperature in 1950 is the initial temperature Tin
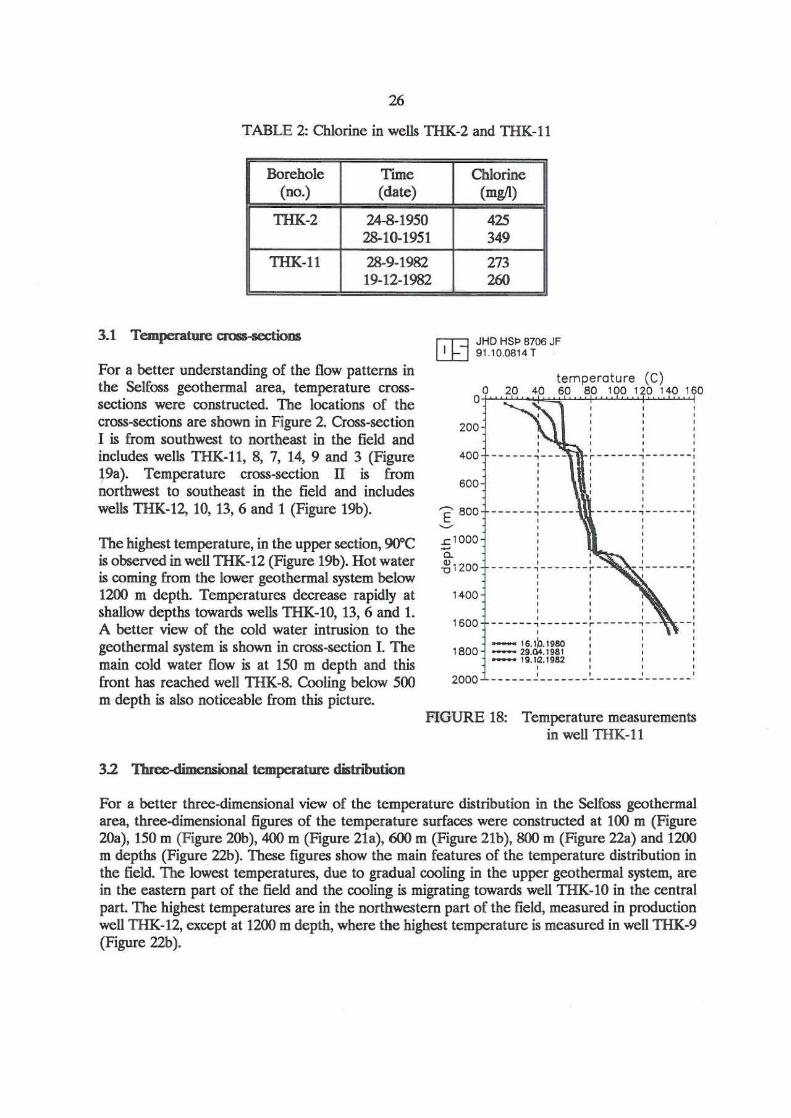
The temperature distribution in the southwestern part of the field, around well lHK-ll, is different from other parts as can be seen in the temperature maps at several levels. This conclusion is based on the temperature measurements. But it is supported by chemical analysis of water samples. The temperatures are quite uniform and constant over time (Figure 18) and represent the average initial temperature distribution in this part of the field (Figure 9b). The differences in the temperatures between the southwestern part of the field and the main production area are evident by comparing Figure 9a to Figure 9b. The differ~nces in the initial values of the chlorine content in samples of thermal water taken from well TIiK-2, situated at the Thorleifskot farm, and from well THK-I\ are shown in Table 2. Thus, it is concluded that the origin of the thennal water in the southwestern part of the field differs from that in other parts.
26
TABLE 2: Chlorine in wells TIIK-2 and TIIK-ll
Borehole Time (no.) (date)
TIIK-2 24-8-1950 28-10-1951
TIIK-ll 28-9-1982 19-12-1982
3.1 Temperature aoII-S<XIiona
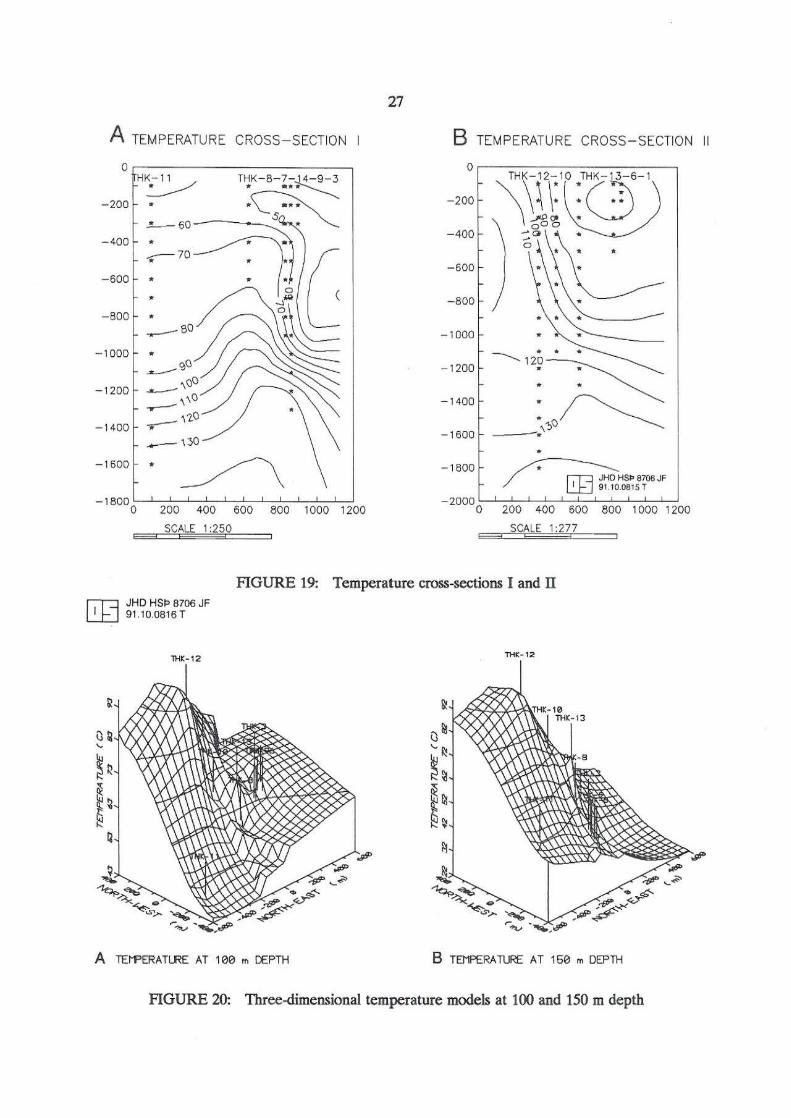
For a better understanding of the flow patterns in the Selfoss geothermal area, temperature crosssections were constructed. The locations of the cross-sections arc shown in Figure 2. Cross-section I is from southwest to northeast in the field and includes wells TIIK-ll, 8, 7, 14, 9 and 3 (Figure 19a). Temperature cross-section IT is from northwest to southeast in the field and includes wells TIIK-12, 10, 13,6 and 1 (Figure 19b).
The highest temperature, in the upper section. 9(fC is observed in well TIIK-12 (Figure 19b). Hot water is coming from the lower geothermal system below 1200 m depth. Temperatures decrease rapidly at shallow depths towards wells TIIK-IO, 13, 6 and 1. A better view of the cold water intrusion to the geothermal system is shown in cross-section I. The main cold water flow is at 150 m depth and this front has reached well TIIK-8. Cooling below 500 m depth is also noticeable from this picture.
Chlorine (m&'l)
425 349
273 260
I.T=I JHO HSP, 8706 JF ~ 91.10.0814 T
o o
200
400
600
-. 800 E ~
.s:: 1 000 0. ~1200
1400
1600
1800
2000
temperature (C) 20 40 60 80 100 120 140 160
, , , , -- ----.,---- r------.,-------, , , , ,
, , , ------.,----- ------.,-------, , , , , , ,
, , , ------.,---- ---r--, , , , ,
, , ,
, , , ------.,---- ---r------.,--, , , __ 16.1b.l~80 ' __ 2\1.G4.19Bl _ 1\1.1/2.11182 , , , , ,
, , - -, ,
------------------- -- ------ --
FIGURE 18: Temperature measurements in well TIIK-ll
3.2 Thn:e-<Iimcnsio temperature distnbution
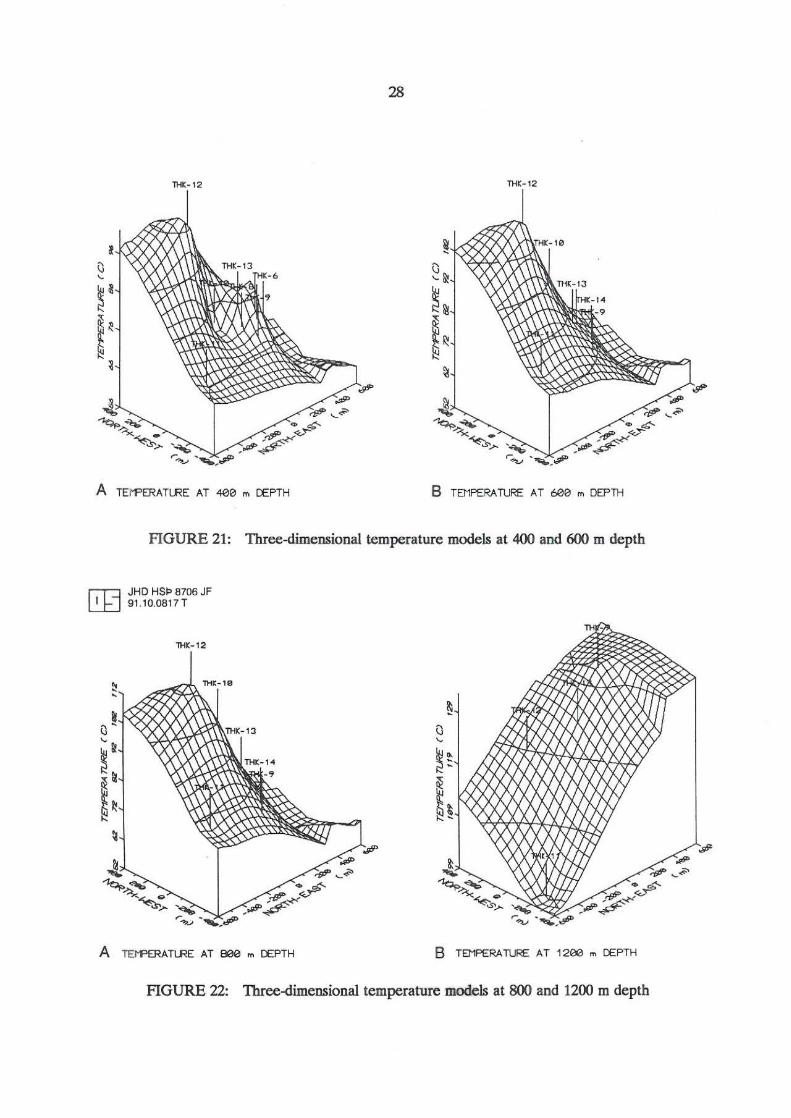
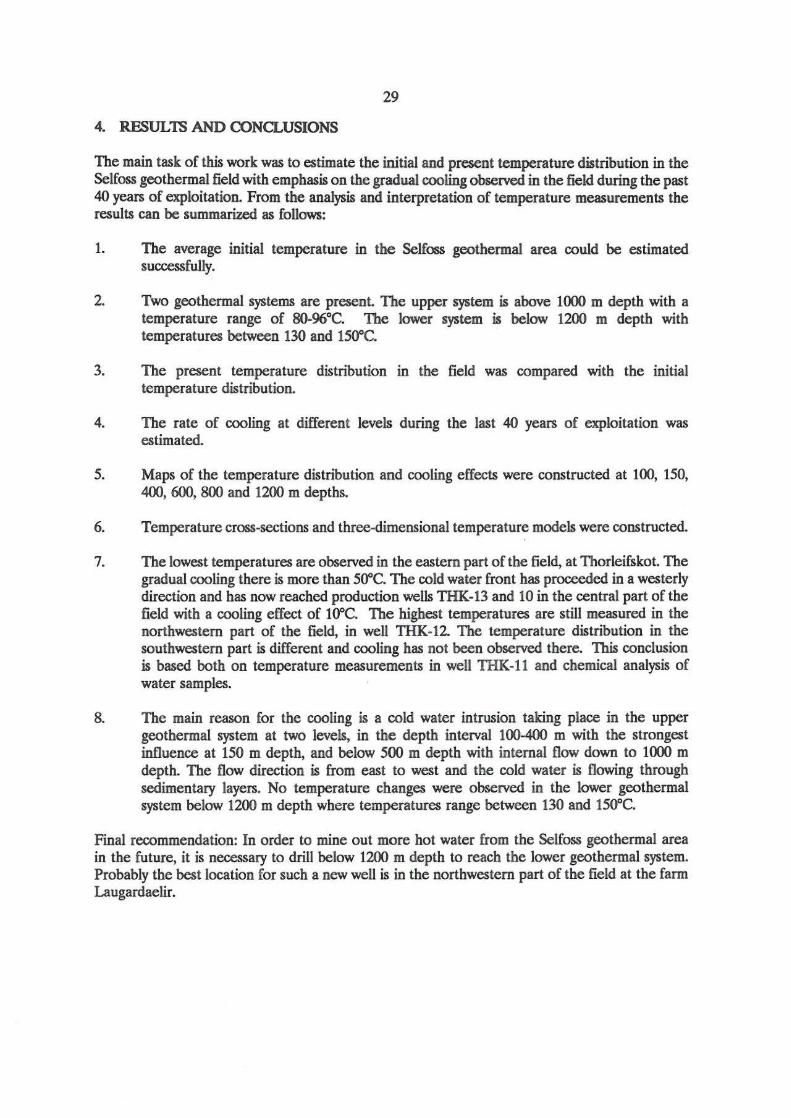
For a better three-dimensional view of the temperature distribution in the Selfoss geothermal area, three-dimensional figures of the temperature surfaces were constructed at 100 m (Figure 2IIa), 150 m (Figure 2Ob), 400 m (Figure 21a), 600 m (Figure 21b), 800 m (Figure 22a) and 1200 m depths (Figure 22b). These figures show the main features of the temperature distribution in the field. The lowest temperatures, due to gradual cooling in the upper geothermal system, are in the eastern part of the field and the cooling is migrating towards well TIIK-10 in the central part. The highest temperatures are in the northwestern part of the field, measured in production well TIIK-12, except at 1200 m depth, where the highest temperature is measured in weIllHK-9 (Figure 22b).
A TEMPERATURE CROSS- SECTION
0r-------~-------, HK-l 1 THK-8-7-~-9-3
-200 ~ . *.: -------. .~
-400
-600
o~ - 800
-1000
- 1200
- 1400
-1600 •
-18000C-~2~OO~-4~O~O~~6~O~O-L~80~O~7'O~O~O~'""2'OO
SCALE 1 :250
27
B TEMPERATURE CROSS-SECTION 11
- 1000 . ._-----1200
- 1400
-1600
- 1800 ~HS~8706JF / rn ~~~~_oe15 T
- 2000 0 200 400 600 800 1000 , 200
SCALE 1:277
F1GURE 19: Temperature cross-sections I and IT ~ JHD HSp 8706 JF ~ 91.10.0816 T
A TEt'FERATLRE AT lee"" CE:PTH B TEJ1PERATURE AT 1613 m DEPTH
FIGURE 20: Three-dimensional temperature models at 100 and 150 m depth
28
A TEt'FERATLRE AT .we m C€PTH B TEMPERATURE AT c.ee m DEPTH
FIGURE 21: Three-dimensional temperature models at 400 and 600 m depth
r;-r::J JHD HSI:> 8706 JF ~ 91.10.0817T
lHK-12
lJiI:-lIil
A TEt1"ERATLRE AT see m CEPTH B TEMPERATURE AT 1200 m CEPTH
FIGURE 22: Three-dimensional temperature models at 800 and 1200 m depth
29
4. RESULTS AND CONCLUSIONS
The main task of this work was to estimate the initial and present temperature distribution in the Selfoss geothermal field with emphasis on the gradual cooling observed in the field during the past 40 years of exploitation. From the analysis and interpretation of temperature measurements the results can be summarized as follows:
1. The average initial temperature in the Selfoss geothermal area could be estimated successfully.
2. Two geothennal systems are present. The upper system is above 1000 m depth with a temperature range of 8O-96'C. The lower system is below 1200 m depth with temperatures between 130 and 15O"C.
3. The present temperature distribution in the field was compared with the initial temperature distribution.
4. The rate of cooling at different levels during the last 40 years of exploitation was estimated.
5. Maps of the temperature distribution and cooling effects were constructed at lOO, 150, 400, 600, 800 and 1200 m depths.
6. Temperature cross-sections and three-dimensional temperature models were constructed.
7. The lowest temperatures are observed in the eastern part of the field, at Thorleifskot. The gradual cooling there is more than 500C The cold water front has proceeded in a westerly direction and has now reached production wells THK-13 and 10 in the central part of the field with a cooling effect of 100C The highest temperatures are still measured in the northwestern part of the field, in well THK-12. The temperature distribution in the southwestern part is different and cooling has not been observed there. This conclusion is based both on temperature measurements in wellTIIK- l 1 and chemical analysis of water samples.
8. The main reason for the cooling is a cold water intrusion taking place in the upper geothennal system at two levels, in the depth interval 100-400 m with the strongest influence at 150 m depth, and below 500 m depth with internal flow down to 1000 m depth. The flow direction is from east to west and the cold water is flowing through sedimentary layers. No temperature changes were observed in the lower geothennal system below 1200 m depth where temperatures range between 130 and 1500C.
Final recommendation: In order to mine out more hot water from the Selfoss geothennal area in the future, it is necessary to drill below 1200 m depth to reach the lower geothennal system. Probably the best location for such a new well is in the northwestern part of the field at the fann Laugardaelir.
30
ACKNOWLEOOEMENTS
The author wishes to extend his thanks and appreciation to organizers of the UNU Geothermal Training Programme, especially to Dr. Ingvar Birgir Fridleifsson, Orlrustofnun - the National Energy Authority of Iceland, and the Government of Iceland for giving him the opportunity to participate in the 1991 geothermai course.
Special acknowledgement is due to Dr. Valgardur Stefansson, my advisor, for his patient supervision during aU stages of preparation of this report and for the wealth of ideas about well logging and reservoir engineering he offered to me during the geothennal course.
I am very grateful to Dr. Hclga Tulinius and Dr. Hja1ti Fraozson for their assistance during my work on this report. Further thanks go to Ludvik S. Georgsson for guidance during the training course and to him and Marcia Kjartansson for carefully editing this report.
Also many thanks go to all the lecturers, especially to the staff of the Department of reservoir engineering for their valuable training during the course and to all the staff of Orkustofnun who hclped mc during my stay in Iceland.
31
REFERENCES
Bodvarsson, G., 1951: Report on the HengiU Thermal Area. J. Engin. Ass. Iceland, 36, (in Icelandic with English summary), 1-48.
ea"law, H.S., and Iaeger, I.C., 1950: Conduction of heat in solids. Clarendon Press, Oxford, 386 pp.
Hersir, G., and Flavenz, a.G., 1982: Head-on resistivity profiling at Selfoss. Orkustofnun, report OS·82067/IHD-13B (in Icelandic), 29 pp.
Tomasson, I., 1967: On the origin of sedimentary water beneath Westmann Islands; Iokull 17, 300-311.
Tomasson, J., 1980: Selfoss geothermal area S-Iceland. The using of chlorine as an indicator of an inflow of cold groundwater into the geothennal reservoir. Proceedings of 3rd International Symposium on Water-Rock Interaction, Edmonton, Canada, July 1980, 107-109.
Tomasson, I., and Halldor.son, G.K., 1981: The cooling of the Selfoss geothermal area, S -Iceland. Geothermal Resources Council, Transactions vol. 5, 209-212.