Embed Size (px)
Citation preview

Tilburg University
Response bias in international marketing research
de Jong, M.G.
Publication date:2006
Document VersionPublisher's PDF, also known as Version of record
Link to publication in Tilburg University Research Portal
Citation for published version (APA):de Jong, M. G. (2006). Response bias in international marketing research. CentER, Center for EconomicResearch.
General rightsCopyright and moral rights for the publications made accessible in the public portal are retained by the authors and/or other copyright ownersand it is a condition of accessing publications that users recognise and abide by the legal requirements associated with these rights.
• Users may download and print one copy of any publication from the public portal for the purpose of private study or research. • You may not further distribute the material or use it for any profit-making activity or commercial gain • You may freely distribute the URL identifying the publication in the public portal
Take down policyIf you believe that this document breaches copyright please contact us providing details, and we will remove access to the work immediatelyand investigate your claim.
Download date: 02. Feb. 2022

Response Bias in International Marketing Research


Response Bias in International
Marketing Research
Proefschrift
ter verkrijging van de graad van doctor aan de Universiteit
van Tilburg, op gezag van de rector magnificus, prof. F.A.
van der Duyn Schouten, in het openbaar te verdedigen ten
overstaan van een door het college voor promoties
aangewezen commissie in de aula van de Universiteit op
maandag 30 oktober 2006 om 16.15 door
Martijn Gijsbert de Jong
geboren op 14 mei 1980 te Dordrecht

Promotor:
Prof. dr. ir. J.E.B.M. Steenkamp

Promotie commissie:
Prof. dr. T.M.M. Verhallen Prof. dr. ir. J.E.B.M. Steenkamp Prof. dr. F.G.M. Pieters Prof. dr. H. Baumgartner Prof. dr. E.T. Bradlow Prof. dr. P.H.B.F. Franses

Preface
At last the mighty task is done. After the spring of inspiration, the summer of work and the
autumn of completion, I can now take a hibernal rest and survey what has been achieved. In fact,
this thesis is the fruit of the work of many, because you always need friends and helpers to
accomplish your aims. They have led me into the best possible position. The professional course
of a Ph.D. is not an easy one, but with the help of many, my path has been relatively smooth. For
that I am most grateful, as I realize that this is the exception rather than the rule.
Before mentioning all those who have helped me, I have to thank Eric Bradlow from the USA to
sit on the dissertation committee. It is a great honor that such an outstanding scholar in the field
of marketing was willing to read and evaluate my thesis. I am also grateful to the other members
of the committee: Jan-Benedict Steenkamp, Theo Verhallen, Hans Baumgartner, Philip Hans
Franses, and Rik Pieters.
Looking back upon my formative years at the universities of Rotterdam and Tilburg, I want to
thank a number of people. As a student at Erasmus University it was Harry Commandeur and
Philip Hans Franses who were the first to see academic potential in me. They aroused my interest
in academia. So it is not really a coincidence that I returned to my alma mater when I was asked
for the position of assistant professor at the Rotterdam School of Management. As for my time in
Tilburg, I would first and foremost like to express my deepest gratitude to my scientific mentor
Jan-Benedict Steenkamp. When I came to Tilburg four years ago I immediately felt inspired and
motivated to work under his guidance. He supplied me with a most valuable dataset to work with.
Moreover, he has been a veritable mentor under whose guidance I have learnt the tricks of the
scientific trade. He helped me with revisions and strengthened my awareness of the political
process in a high-context environment such as academia. I will never forget the Attic salt with
which he seasoned his lectures, his indefatigable energy, his encyclopaedic knowledge of the
literature, and the speed with which he always read my work. He also made me look into the
mirror, pointed out my weaknesses and strengths, and gave me advice on how to improve myself.
I feel blessed to have been his Ph.D. student. I sincerely hope that we will continue our
collaboration in the future because I am convinced I can still learn a lot from him.

Then I want to mention my co-authors, Hans Baumgartner, Jean-Paul Fox and Bernard
Veldkamp. Hans is a warm-hearted person whose company I have enjoyed. His input has
improved the two papers he co-authored tremendously. I also thank him for his hospitality during
my visit to Penn State last June. I am greatly indebted to Jean-Paul Fox, the co-author on my first
two projects. It goes without saying that his great psychometric and statistical expertise,
combined with the help related to software issues was indispensable. I very much look forward to
working with him in the future. Finally I would like to mention Bernard Veldkamp, the co-author
on my last project. I appreciate his contribution and I hope and expect that our collaboration may
lead to interesting results.
I am grateful to the people at Europanel, for their massive data collection effort. They laid the
foundation for this doctoral thesis. The English biologist Thomas Huxley phrased it quite well:
“what you get out depends on what you put in; and as the grandest mill in the world will not
extract wheat-flower from peascods, so pages of formulae will not get a definite result out of
loose data”. My sincere thanks to Jane Outten from Europanel, the people at MetrixLab & GFK,
and especially Alfred Dijs. Without their contribution this thesis would not have been possible.
I should not forget to pay tribute to the marketing department in Tilburg. It has really been a seat
of learning, an inspiring place to work. I am grateful to all the members of the department, but I
would like to mention a few staff members in particular. I thank Inge Geyskens, who always
listened to me when I was in doubt and gave me sound advice; Els Gijsbrechts, for teaching the
Marketing Research course with me; Vincent Wiegerinck, for the nice discussions on
international marketing topics; Rik Pieters, for participating in the project on taboo consumer
marketing.
Then, of course, there are the Ph.D. students: Ralf van der Lans, Man-Wai Chow, Maciej
Szymanowski, and my buddies Berk Ataman, Rita Coelho do Vale and Robert Rooderkerk. It
was great to work together, to feel the mutual support, to fight the challenges to come up higher.
Social life often suffers during a Ph.D., but fortunately this well-known phenomenon did not
apply to me. I would like to thank all my friends, the people from Peerke Donders, the Roman

Catholic Student Fraternity, the Navigators Student Fraternities, and all the the other people
whom I have not mentioned for playing an important role in my social life these last four years.
Also, I want to express my deepest gratitude to my parents, Annemiek and Martin, and my
identical twin brother, Bas. Their love, continual support and advice have kept me on the right
track.
Finally I want to give thanks to my Creator. He has given me the talents I have been trying to
exploit. Now I can say with all my heart: thank God, the work is done!

Contents
Chapter 1: Introduction I.1 Introduction 1 I.2 International survey-based marketing research 2 I.3 Measurement tradition in marketing 4 I.4 International measurement models 7 I.5 Objectives of the various chapters 10 Chapter 2: Relaxing Measurement Invariance In Cross-National Consumer Research Using a Hierarchical IRT Model II.1 Introduction 14 II.2 Multi-group CFA Model 16
II.3 IRT model 19 II.4 Simulation study 27 II.5 Application to Consumer Susceptibility to Normative Influence 28 II.6 Implications for Cross-National Consumer Research 40 II.7 General Discussion 41 II.8 Appendix A 43 II.9 Appendix B 45 Chapter 3: Using Item Response Theory to Measure Extreme Response Style in Marketing Research: A Global Investigation III.1 Introduction 47 III.2 Measuring ERS 48 III.3 Measuring ERS Using IRT 51 III.4 Simulation Study 56 III.5 Empirical Application 58 III.6 Results 59 III.7 Drivers of ERS 62 III.8 Conclusion 65 III.9 Appendix 67 Chapter 4: The Interplay of Personality and Culture in Shaping Socially Desirable Responding IV.1 Introduction 71 IV.2 Conceptual Framework 73 IV.3 Method 83 IV.4 Results 86 IV.5 Discussion 90 IV.6 Appendix 96

Chapter 5: Construction of Country-Specific, Yet Internationally Comparable Short Form Marketing Scales
V.1 Introduction 98 V.2 Scale Construction in International Marketing Research 99 V.3 A Model for the Construction of Short-Form Marketing Scales 102
V.4 Extension of the Model to Allow for Development of Derived Emic Scales 109 in International Marketing Research
V.5 Empirical Application 111 V.6 Results 113 V.7 General Discussion 122 Chapter 6: Conclusions & Future Research VI.1 Conclusions 124 VI.2 Future Research 127 References 131
Nederlandse samenvatting 144

1
Chapter 1 I.1 Introduction
The saturation of domestic markets in the industrialized parts of the world, combined with
increased competition in home markets from foreign competitors forces many companies to look
for opportunities beyond their national boundaries (Kotabe and Helsen 2004). This trend urges
the need for development of marketing and consumer behavior theories that incorporate
institutional, socio-economic and cultural variables. All too often, it is assumed that models
developed in the U.S. generalize to other parts of the world. The large cultural, economic and
demographic differences between industrialized Western countries and emerging markets make it
less than obvious that established theories are applicable to these markets. Steenkamp (2005)
argues that many theories (and even the most established ones) lack cross-national
generalizability because key country characteristics moderate the structural relationships between
the constructs in marketing theories.
Apart from investigating cultural and socio-economic contingencies, there are many inherently
international issues that need to be studied in much greater detail. For instance, the desirability of
pursuing standardization of the marketing mix and other competitive strategy variables versus
adaptation to individual national markets has been discussed frequently, even though empirical
evidence on the pros and cons remains scarce (Szymanski, Bharadwaj and Varadarajan 1993).
Most large multinational companies such as Mars, Pepsi-Cola, L’Oreal recognize the diversity in
world markets and rely on local consumer knowledge and marketing practices (Usunier and Lee
2005). Yet, many uncertainties remain with respect to the desired degree of standardization of the
strategic resource mix (pattern of resource allocation among advertising, promotion, personal
selling, and other mix variables), and desired degree of standardization of the strategy content
(decisions on product positioning, brand name, appropriate media, content of advertisements,
etc.).
Given these shortcomings in the literature, it is important to expand the intellectual
boundaries. Editors of the top journals in the field concur. Monroe (1993) urges consumer
behavior researchers “to move beyond the relative security of our own backyards and investigate
issues relative to consumption on an international basis.” Winer (1998) submits that more
international marketing studies are needed in the top journals, and Steenkamp (2005) urges
researchers to move out of the ‘U.S. silo’. Due to the ubiquitous Internet and its related

2
developing technologies, the trend towards more global studies should intensify in the years to
come. However, before valid inferences can be drawn from any international research project,
there are several important measurement issues that need to be addressed. In this dissertation, I
focus on measurement issues when data is collected via surveys.
I.2 International survey-based marketing research
Surveys are a crucial source of data in marketing for theory building and answering
managerial questions. According to Rindfleisch et al. (2006), of the 520 empirical articles
published in the Journal of Marketing (JM) and Journal of Marketing Research (JMR) from 1995
to 2005, over 40% (225) employed survey methods. In international settings, surveys are even
more important, as secondary data is seldom satisfactory. Especially in emerging consumer
markets, secondary information often simply does not exist or if it is available it may be hard to
track down.
Scientific marketing research based on surveys can be conceptualized as a process consisting
of four stages (Burgess and Steenkamp 2006). The first stage is theory development, where one
defines the constructs and carefully specifies hypotheses. The second stage is concerned with the
acquisition of data, while in the third stage the data are analyzed. Finally, in the fourth stage,
findings are evaluated and key learnings extracted. My dissertation is mainly concerned with
stages two and three, that is, acquisition and analysis of international survey data.
When acquiring and analyzing international survey data, there are four issues that require
attention: a) choice of countries (based on convenience or based on sound theorizing), b) unit of
observation (individual consumer / manager vs. larger decision units), c) measurement
instruments, and d) proper analysis of the data. For an overview of issues a) and b), I refer the
interested reader to Burgess and Steenkamp (2006). Below, I discuss issues c) and d) and the
shortcomings in the literature.
Measurement instruments
Ever since Ray’s call for a measurement tradition in marketing (Ray 1979), scholars have
devoted considerable attention to developing valid measurement instruments (Bearden and
Netemeyer 1999). Yet, many measurement instruments developed in the U.S. require a high
degree of respondent sophistication and assume that respondents are familiar with Likert rating

3
scales. The established scales are frequently too long and difficult for easy administration in other
countries (Steenkamp 2005). Moreover, the scales may contain items that are inappropriate in
other countries. Finally, the direction of the item (positively worded vs. negatively worded) can
be an issue (Wong, Rindfleisch, and Burroughs 2003). Hence, much work is needed to construct
short and simple scales, scales that possibly use different wording and response formats, tailored
to the local environment.
Data analysis
In international data analysis, a key concept is cross-national measurement invariance.
Loosely speaking, measurement invariance indicates whether items relate to the underlying
constructs in the same way across countries. If psychometric properties of a measurement scale
vary widely across countries, cross-national comparisons based on the scale may be hampered
due to unreliability and lack of validity. Lack of invariance can be due to differences in responses
to individual items, as well to complete sets of measures (Baumgartner and Steenkamp 2006). At
the level of individual items, tests to detect differential item functioning based on the multigroup
confirmatory factor analysis model are well-known in marketing (Steenkamp and Baumgartner
1998). Nonetheless, there are a number of important limitations. First, despite the fact that
researchers use the Likert format for their items, they do not take the ordinal nature of the data
into account in their model. Second, the models cannot make substantive comparisons when there
are no invariant items. When studying many different countries, lack of invariance is the norm,
rather than the exception (Baumgartner 2004). The field needs methods that allow substantive
comparisons between countries despite lack of invariance.
Lack of invariance in the complete set of measures can occur due to cross-national differences
in response styles. A response style is a tendency to utilize the rating scale in a particular way,
relatively independently of specific item content (e.g., Baumgartner and Steenkamp 2001; Fisher
1993; Greenleaf 1992a, 1992b; Johnson 2003; Mick 1996; Rossi et al. 2001). If styles have a
similar impact on all items, tests for differential item functioning are not appropriate: a difference
would be reflected either in the mean or variance of the latent construct.
Cross-national variation in scale usage indicates that the relationship between respondents’
true opinion and the observed score is different across nations. There are different kinds of
response styles in surveys, such as yeah-saying (uncritical agreement with statements), extreme

4
responding (using the ends or midpoint of rating scales often, relatively independently of specific
content), and socially desirable responding (people’s tendency to give answers that make them
look good). Response styles introduce extraneous variation in scale scores, which compromises
validity. Unfortunately, the score-invalidating and relationship obscuring effects of response
styles have been largely ignored in the international (and domestic) marketing literature (see
Baumgartner and Steenkamp 2001). Response style models that have been used to date are
relatively naïve, and much remains unknown about accurate measurement of stylistic responding,
about proper ways to control for response styles, and what factors drive stylistic responding
across individuals and nations.
I.3 Measurement tradition in marketing
This section is a primer on measurement models. IRT models, which are useful to address the
shortcomings of the literature concerning the construction of measurement instruments and data
analysis, are introduced as an improvement over classical test theory (CTT). In general,
marketing and consumer researchers’ concern with the validity and reliability of construct
measurement has greatly increased since the publication of Jacoby’s (1978) review of the early
marketing literature. CTT has become the dominant measurement paradigm in marketing. The
roots of CTT go back to early work by Spearman (1904). The central feature of CTT is the notion
of errors in measurement. Measurement theory is needed because marketing phenomena are often
not directly measurable but must be studied through the measurement of other observable
phenomena. Any measurement theory supposes that the score of a respondent on some
measurement instrument can be predicted by defining respondent characteristics, referred to as
unobservable latent traits.
In the marketing literature, articles by Churchill (1979) on measure development and Peter
(1979, 1981) on reliability and construct validity introduced important CTT concepts as multi-
item measurement, item-total correlations, coefficient alpha, convergent and discriminant
validity, and did much to inspire consumer researchers to pay greater attention to the quality of
construct measurement. The advent and application of structural equation models further
contributed to advanced CTT investigations of construct validity (Bagozzi 1980; Baumgartner
and Homburg 1996; Bagozzi and Yi 1991; Gerbing and Anderson 1988; and Steenkamp and van
Trijp 1991).
5
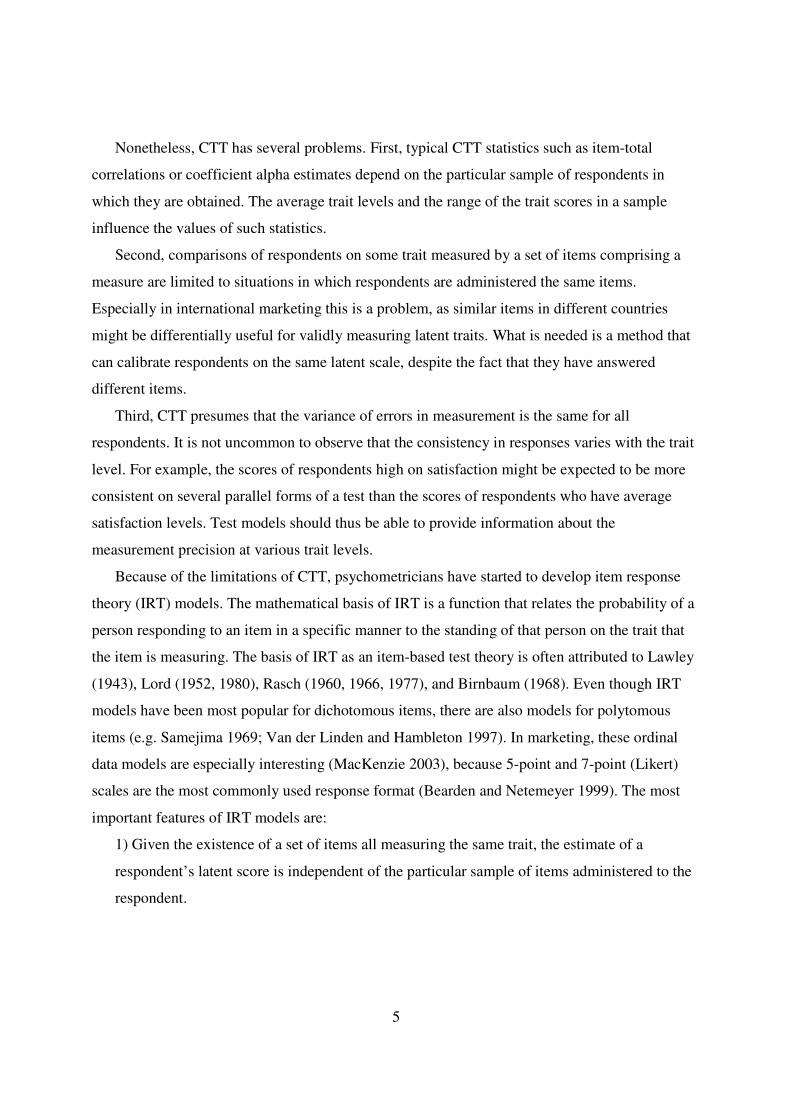
Nonetheless, CTT has several problems. First, typical CTT statistics such as item-total
correlations or coefficient alpha estimates depend on the particular sample of respondents in
which they are obtained. The average trait levels and the range of the trait scores in a sample
influence the values of such statistics.
Second, comparisons of respondents on some trait measured by a set of items comprising a
measure are limited to situations in which respondents are administered the same items.
Especially in international marketing this is a problem, as similar items in different countries
might be differentially useful for validly measuring latent traits. What is needed is a method that
can calibrate respondents on the same latent scale, despite the fact that they have answered
different items.
Third, CTT presumes that the variance of errors in measurement is the same for all
respondents. It is not uncommon to observe that the consistency in responses varies with the trait
level. For example, the scores of respondents high on satisfaction might be expected to be more
consistent on several parallel forms of a test than the scores of respondents who have average
satisfaction levels. Test models should thus be able to provide information about the
measurement precision at various trait levels.
Because of the limitations of CTT, psychometricians have started to develop item response
theory (IRT) models. The mathematical basis of IRT is a function that relates the probability of a
person responding to an item in a specific manner to the standing of that person on the trait that
the item is measuring. The basis of IRT as an item-based test theory is often attributed to Lawley
(1943), Lord (1952, 1980), Rasch (1960, 1966, 1977), and Birnbaum (1968). Even though IRT
models have been most popular for dichotomous items, there are also models for polytomous
items (e.g. Samejima 1969; Van der Linden and Hambleton 1997). In marketing, these ordinal
data models are especially interesting (MacKenzie 2003), because 5-point and 7-point (Likert)
scales are the most commonly used response format (Bearden and Netemeyer 1999). The most
important features of IRT models are:
1) Given the existence of a set of items all measuring the same trait, the estimate of a
respondent’s latent score is independent of the particular sample of items administered to the
respondent.
6
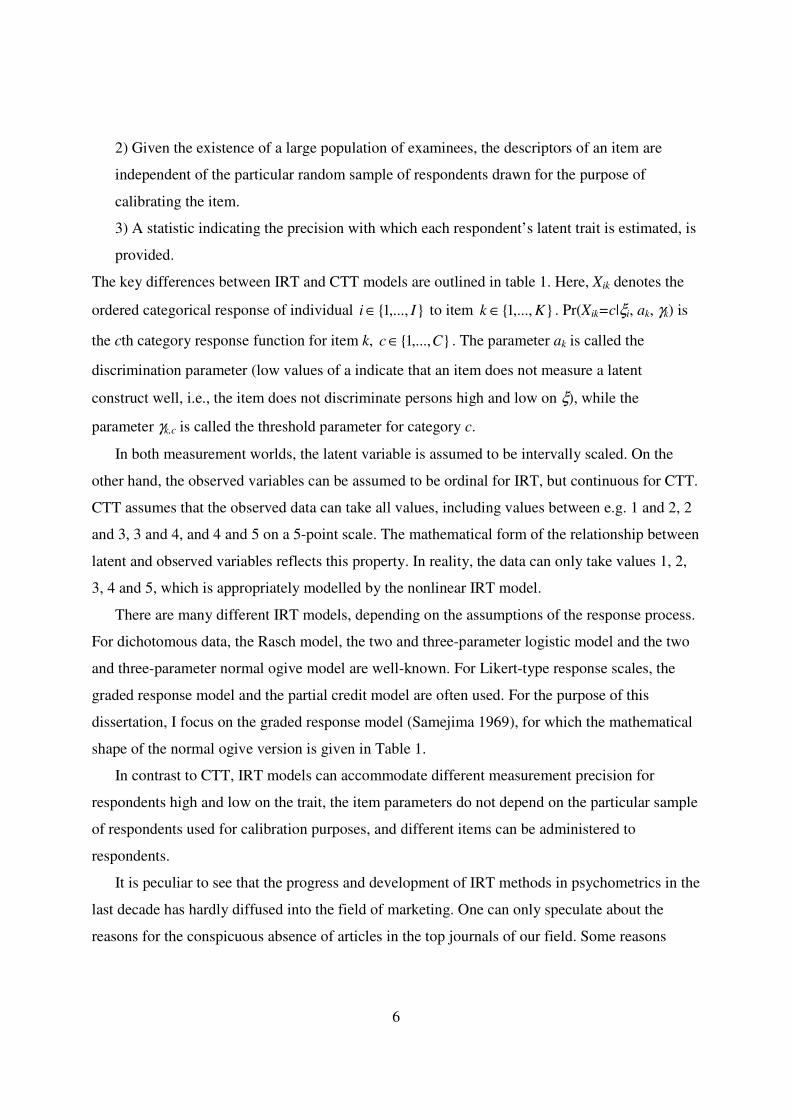
2) Given the existence of a large population of examinees, the descriptors of an item are
independent of the particular random sample of respondents drawn for the purpose of
calibrating the item.
3) A statistic indicating the precision with which each respondent’s latent trait is estimated, is
provided.
The key differences between IRT and CTT models are outlined in table 1. Here, Xik denotes the
ordered categorical response of individual ,...,1 Ii ∈ to item ,...,1 Kk ∈ . Pr(Xik=c|ξi, ak, γk) is
the cth category response function for item k, ,...,1 Cc ∈ . The parameter ak is called the
discrimination parameter (low values of a indicate that an item does not measure a latent
construct well, i.e., the item does not discriminate persons high and low on ξ), while the
parameter γk,c is called the threshold parameter for category c.
In both measurement worlds, the latent variable is assumed to be intervally scaled. On the
other hand, the observed variables can be assumed to be ordinal for IRT, but continuous for CTT.
CTT assumes that the observed data can take all values, including values between e.g. 1 and 2, 2
and 3, 3 and 4, and 4 and 5 on a 5-point scale. The mathematical form of the relationship between
latent and observed variables reflects this property. In reality, the data can only take values 1, 2,
3, 4 and 5, which is appropriately modelled by the nonlinear IRT model.
There are many different IRT models, depending on the assumptions of the response process.
For dichotomous data, the Rasch model, the two and three-parameter logistic model and the two
and three-parameter normal ogive model are well-known. For Likert-type response scales, the
graded response model and the partial credit model are often used. For the purpose of this
dissertation, I focus on the graded response model (Samejima 1969), for which the mathematical
shape of the normal ogive version is given in Table 1.
In contrast to CTT, IRT models can accommodate different measurement precision for
respondents high and low on the trait, the item parameters do not depend on the particular sample
of respondents used for calibration purposes, and different items can be administered to
respondents.
It is peculiar to see that the progress and development of IRT methods in psychometrics in the
last decade has hardly diffused into the field of marketing. One can only speculate about the
reasons for the conspicuous absence of articles in the top journals of our field. Some reasons

7
might be that IRT models are nonlinear in nature and generally more complicated than the CTT
methods. Software is also more readily available for CTT methods.
Table 1
CHARACTERISTICS OF MEASUREMENT MODELS FOR RATING SCALES CTT IRT Characteristics of observed variables Scale property Interval Ordinal Characteristics of latent variables Scale property Interval Interval Mathematical model for relationships Form Linear Non-linear Item Parameters λk ak, γγγγk Equation Xik=λkξi + εi Pr(Xik=c|ξi, ak, γk) =
Φ(akξi -γk,c-1)- Φ(akξi -γk,c), γk,0=-∞ , γk,C=+∞
Model Properties Items Need to be similar Can be different Variance of measurement Similar for all respondents Respondent specific Item parameters Sample dependent Sample independent
I.4 Cross-national measurement models
As I will argue below and demonstrate in the various essays, the field of international marketing
can benefit tremendously from applying so called “hierarchical IRT” models (see for overviews
e.g. Johnson, Sinharay, and Bradlow 2005). Examples of hierarchical IRT models in the
psychometric literature include the hierarchical rater model (Patz et al. 2002), the testlet model
(Bradlow et al. 1999), the related siblings model (Janssen et al. 2000; Sinharay et al. 2003), and
the multilevel IRT model (Fox and Glas 2001; 2003). Especially the work by Fox and associates
is ideally suited to address validity challenges I discussed in section I.2, since the multilevel IRT
model was developed to measure latent constructs when respondents are nested within larger
clusters (e.g. schools or countries). Structural modelling of such hierarchical data is a relatively
recent area of methodological research. Apart from a few IRT-based studies, there are several
SEM-based articles (Ansari et al. 2001; Bauer 2003; Bentler and Liang 2003; Curran 2003; du
Toit and du Toit 2003; Kaplan and Elliot 1997; Lubke and Muthén 2004; Mehta and Neale 2005;
Muthén 1991; 1994; 1997; Rovine and Molenaar 2000). These models often ignore the ordinal
nature of the data (which is problematic in multi-group research; see Lubke and Muthén 2004).
Moreover, it would be useful to have random-effects structures for item parameters. Especially
with more countries / groups, lack of invariance of item parameters is the norm and in such cases

8
the hierarchical SEM models with invariant measurement models cannot be used to draw
conclusions from the data. In this dissertation, a model is presented which recognizes the ordinal
nature of Likert data, and has random-effects structures both for the latent variable, as well as for
all item parameters in the measurement model. To the best of my knowledge, such models do not
exist in the psychometric literature.
Central cross-national measurement model
Let ξij denote a latent trait of respondent i in country j, and let Yijk, k=1,....,K denote the
observed scores on the K items measuring this latent trait. Assume that there are K polytomous
items with C response categories for each item (e.g., for a 5-point Likert scale, the C=5 categories
are “Strongly disagree”, “Disagree”, “Neutral”, “Agree”, and “Strongly agree”). Then the basic
model which will be used throughout the dissertation is given by:
)()(),,|Pr( ,1, ckjijkjckjijkjkjkjijijk aaacY γξγξγξ −Φ−−Φ== − (1)
),0(~, 20 σεεβξ Nijijjij += (2)
),0(~, 200000 τγβ Nuu jjj += (3)
AaAaNaa kkjakjkjkkj ∈∈+= ~,),,0(~,~ 2σηη (4)
Ckjkjkjckjckjckckj kN ,2,1,
2,,,, ),,0(~,~ γγγσυυγγ γ ≤≤≤+= (5)
where A is a bounded interval in ℜ+. The structural part (2)-(3) consists of a random-effects
structure for the latent variable ξij, while the measurement part (1)-(4)-(5) is a graded response
IRT model (Samejima 1969), with random-effects structures for item parameters a and γγγγ. A more
elaborate exposition of the meaning of these item parameters, and the way the model functions
can be found in chapter 2. The structural part (2)-(3) does not include covariates at either the
individual or national-cultural level. When covariates are included, the model becomes more
elaborate with additional equations:
),0(~, 2
110 σεεβββξ NXX ijijKjKjjjjij ++++= (6)
jjSSjj uWW 0001001000 ++++= γγγβ (7)
jjSSjj uWW 1111111101 ++++= γγγβ (8)
KjSKjKSKjKKKj uWW ++++= γγγβ 110 (9)
),0(~],,,[ 110 TNuuu KT
Kjjj + (10)

9
In a figure, the hierarchical latent variable model (1)-(10) looks as follows:
ijξ
Yij1
Yij2
YijK
X1ij
X2ij
XQij
εij
Level 1
W11j
WS1j
u1j
W1Qj
WSQj
uKj
η1j
υ1j
ηKj
υKj
Level 2
1
Q
Q
1
1
K
K
1
In this figure, there are two levels of analysis: the individual level and the country level. At the
individual level, the latent dependent variable ξij is influenced by multiple observed variables X1ij
to XQij (the upper left part of the figure). Note that the level-1 predictors can also be latent (see
Fox and Glas 2003) although this is not pursued here. The latent dependent variable is measured
by K polytomous items (upper right part of the panel). The strength of the relationship between
the latent dependent variable and the observed explanatory variables varies across nations (see
the lower left part of the figure). The black dots indicate that the structural relationships are
influenced by country-level variables, contained in the variables W. The measurement part of the
model is displayed in the upper right part of the model. It should be recognized that the IRT
model is nonlinear in nature, so the arrows emanating from ξij do not indicate linearity. The
relationship between the latent dependent variable and each observed indicator is governed by the
discrimination and threshold parameters. Finally, the lower right part of the figure captures the
fact that the discrimination and threshold parameters of the measurement model also vary across
nations through random-effects structures.
10
In the next section, I describe how each essay contributes to the literature, and how our
hierarchical IRT is applied.
I.5 Objectives of the various chapters
In this section, I shortly discuss the four essays (Chapters 2 to 5) included in the dissertation.
Table 1 provides an overview of the various chapters. Both the statistical model, the substantive
topic, and the type of data are displayed in the table. Double multilevel IRT indicates multilevel
structures for both item parameters as well as the latent variable. Chapter 6 concludes the
dissertation with a summary and suggestions for further research.
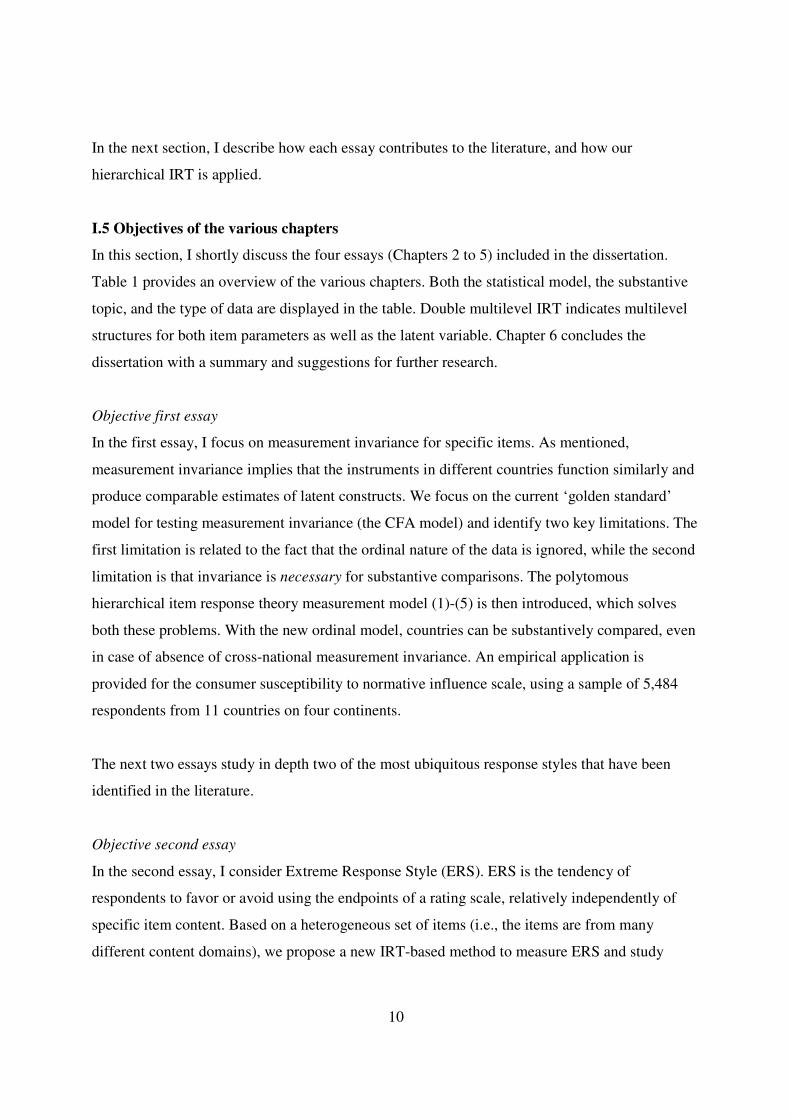
Objective first essay
In the first essay, I focus on measurement invariance for specific items. As mentioned,
measurement invariance implies that the instruments in different countries function similarly and
produce comparable estimates of latent constructs. We focus on the current ‘golden standard’
model for testing measurement invariance (the CFA model) and identify two key limitations. The
first limitation is related to the fact that the ordinal nature of the data is ignored, while the second
limitation is that invariance is necessary for substantive comparisons. The polytomous
hierarchical item response theory measurement model (1)-(5) is then introduced, which solves
both these problems. With the new ordinal model, countries can be substantively compared, even
in case of absence of cross-national measurement invariance. An empirical application is
provided for the consumer susceptibility to normative influence scale, using a sample of 5,484
respondents from 11 countries on four continents.
The next two essays study in depth two of the most ubiquitous response styles that have been
identified in the literature.
Objective second essay
In the second essay, I consider Extreme Response Style (ERS). ERS is the tendency of
respondents to favor or avoid using the endpoints of a rating scale, relatively independently of
specific item content. Based on a heterogeneous set of items (i.e., the items are from many
different content domains), we propose a new IRT-based method to measure ERS and study

11
antecedents of ERS at the individual and national-cultural level. Mathematically, we use a
hierarchical item response theory measurement model (1)-(5) for binary data (C=2), and
simultaneously integrate the measurement model with a structural part, as in (6)-(10). In addition,
we build testlet structures into the IRT models (e.g., Bradlow et al. 1999). The testlet structures
are necessary, because although the set of items used to measure ERS is diffuse in terms of
content, there might be excess dependencies among substantively correlated items. The model is
applied to a large data set involving 12,500 consumers from 26 countries on 4 continents.
Objective third essay
The third essay discusses another response style: socially desirable responding (SDR). SDR is
people’s tendency to give answers that make them look good (Paulhus 1991). A cogent
conceptual model is developed, linking personality and culture to differences in SDR. Both the
main effects of personality and national culture on SDR are considered, as well as the moderating
role of the cultural context in which the respondent lives on the effects of the various personality
factors. The hypotheses are tested using a large data set, involving a random sample of 12,020
respondents in 25 countries in 4 continents. The model (1)-(5) is used to measure the latent
variables cross-nationally. The latent scores are subsequently used in a multilevel model for SDR.
Both the dependent variable and the personality predictors in the multilevel model are latent.
Objective fourth essay
In the final essay, I consider the design of cross-national measurement instruments. The fourth
essay contributes to the marketing literature by developing a procedure that yields fully country-
specific, yet cross-nationally comparable short form marketing scales. The procedure is based on
a combination of a two powerful psychometric tools: the hierarchical item response theory model
(1)-(5) and optimal test design methods (Van der Linden 2005). In the empirical part, our
procedure is applied to the impression management (IM) scale (Paulhus 1984), yielding country-
specific yet cross-nationally comparable short-form scales in 28 countries of the world.

12
Table 2 Chapter overview
Chapter 2 Chapter 3 Chapter 4 Chapter 5 Model Double multilevel IRT Double multilevel IRT,
including testlet structures
Double multilevel IRT Double multilevel IRT combined with test assembly methods
Data format Polytomous Dichotomous Polytomous Polytomous Covariates No Yes, simultaneously
modelled with measurement model
Yes, but not simultaneously modelled with measurement model
No
International topic Relaxing measurement
invariance: applied to SNI scale
Response bias: measuring ERS, and investigating drivers of ERS
Response bias: SDR and drivers of SDR
International scale construction: short-form IM scales
Data 11 countries, 8 items of
the Susceptibility to Normative Influence scale
26 countries, 100 items based on many different Consumer Behavior scales
28 countries, 20 items of the Balanced Inventory of Desirable Responding (BIDR)
28 countries, 10 items of the IM inventory

13
Chapter 2
Relaxing Measurement Invariance In Cross-National Consumer Research Using a Hierarchical IRT Model
Abstract: With the growing interest of consumer researchers to test measures and theories in an international context, the cross-national invariance of instruments designed to measure consumer behavior constructs has become an important issue. Consumer researchers now routinely test for measurement invariance using multigroup confirmatory factor analytic (CFA) techniques before testing their substantive hypotheses in a cross-national context. Yet at least two issues still need to be addressed. First, in these analyses the ordinal nature of the rating scale is ignored, which has recently been shown to have deleterious effects on the validity of cross-national comparisons. Second, when few, if any, items in CFA exhibit metric and scalar invariance across all countries (i.e., when even partial invariance is not supported), comparison of results across countries is difficult, if not impossible. We propose to solve these problems using a hierarchical item response theory measurement model. The model takes differential item functioning, including scale usage differences into account. Countries can be substantively compared, even in case of absence of cross-national measurement invariance. An empirical application is provided for the consumer susceptibility to normative influence scale, using a sample of 5,484 respondents from 11 countries on four continents.
This chapter is based upon Martijn G. de Jong, Jan-Benedict E.M. Steenkamp and Jean-Paul Fox (2007), “Relaxing Measurement Invariance In Cross-National Consumer Research Using a Hierarchical IRT Model,” Journal of Consumer Research, 34 (September), in press. We thank AiMark for the providing the data, and the editor, the associate editor and four anonymous reviewers for valuable comments.

14
II.1 Introduction
Consumer researchers are becoming increasingly interested to test their measures and theories in
an international context (Bagozzi 1994; Durvasula et al. 1993; Wong, Rindfleisch, and Burroughs
2003). It is in this vein that Monroe (1993) urges consumer behavior researchers “to move
beyond the relative security of our own backyards and investigate issues relative to consumption
on an international basis.” Consider the following substantive questions that consumer
researchers may want to address:
- A consumer researcher is interested in testing whether materialism is largely an (“emic”) U.S. construct, or an (“etic”) pan-cultural construct. To address this question, s/he wants to test the nomological relations between this construct and antecedents, consequences, and concurrent constructs as identified in U.S. research (Richins 1994; Richins and Dawson 1992) in other cultures.
- Cultural theory (Schwartz 2006) predicts that in countries high on embeddedness, the subjective norm is more important than a person’s own attitude in shaping consumer behavior while the converse is expected to be true in countries high on autonomy. Is this truly the case? Or are personal opinions the key driver of behavior, across cultures? What are the implications for decision theory and purchase models?
- Ever since Mick’s (1996) seminal article, consumer researchers are well aware of the biasing effects of socially desirable responding in survey research. But is this really a problem around the world? In which countries is this bias strongest, and in which countries can it be ignored?
- There is growing interest in issues related to consumer well-being, as well as a growing realization that transformative consumer research can make a difference around the world (Mick 2005). What are the key drivers of consumer well-being, is their effect moderated by people’s cultural and socioeconomic context, and are there systematic and predictable differences in consumer well-being across countries?
- Novak, Hoffman, and Yung (2000, p. 39) have urged consumer researchers to evaluate “Web sites in terms of the extent to which they deliver these two types [i.e., utilitarian and an emotional] of experience.” Given the global reach of the Internet, and its great influence on consumer behavior, we need to understand these consumption experiences better. Are there universals here? Or is the importance consumers attach to experiential consumption a “luxury” of industrialized countries?
- Brands are important conduits through which cultural meanings are transferred to individuals (McCracken 1986). Three important brand-related meanings are quality, social responsibility, and prestige (Batra et al. 2000; Roth 1995). Does their importance vary across cultures? Cultural theory would alternatively suggest that prestige connotations be more important in countries high on power distance, social image meanings be more important in “feminine” countries, and quality associations be more important in individualistic countries.
- Researchers have noted the construct of guanxi plays an important role in social relations in China (Steenkamp 2005). Is this construct unique to China, or does it play a similar role in other collectivistic countries, and perhaps even individualistic countries? How can we integrate such constructs in our theories of consumer behavior?

15
All these issues have in common that they involve data collection in multiple countries, which
requires that the measurement instruments are cross-nationally invariant (Durvasula et al. 1993;
Netemeyer, Durvasula, and Lichtenstein 1991; Steenkamp and Baumgartner 1998). Measurement
invariance refers to “whether or not, under different conditions of observing and studying
phenomena, measurement operations yield measures of the same attribute” (Horn and McArdle
1992, 117). The generally accepted view is that if evidence supporting a measure’s invariance is
lacking, conclusions based on a research instrument are at best ambiguous and at worst erroneous
(Horn 1991). The multigroup confirmatory factor analysis model (CFA) is the dominant approach
to investigate cross-national measurement invariance, both in consumer research (Steenkamp and
Baumgartner 1998) and other social sciences (Byrne, Shavelson, and Muthén 1989; Vandenberg
and Lance 2000).
Despite the advances in cross-national invariance testing using multigroup CFA, two key
issues remain unresolved. First, consumer researchers often use five and seven point ordinal
Likert items to measure latent constructs and the number of scale points may affect reliability and
validity (Weathers, Sharma, and Niedrich 2005). However, the multigroup CFA model
completely ignores the ordinal nature of the Likert rating scales, which may lead to invalid
conclusions regarding measurement invariance (Lubke and Muthén 2004). Measurement
invariance may be either over- or understated, thus threatening the validity of cross-national
comparisons in consumer research. These results provide further evidence that ordinal data
modeling should receive more attention in consumer research (MacKenzie 2003).
Second, the multigroup CFA model requires at least partial invariance, in that at least two
items exhibit invariance across all countries to make valid cross-country comparisons
(Steenkamp and Baumgartner 1998). It is not at all guaranteed that at least two items are
invariant, and this constraint becomes ever more problematic to fulfill the larger the number of
countries in one’s study (Baumgartner 2004).
The purpose of the present paper is to introduce a new cross-national measurement model that
addresses both limitations of multiple-group CFA. The model is based on item response theory
(IRT; Lord and Novick 1968; Samejima 1969). Our model recognizes the ordinal nature of the
rating scale, incorporates scale usage, and allows for fully non-invariant item parameters across
countries. Although our model allows assessment of measurement invariance for diagnostic
purposes, measurement invariance is not needed to make meaningful cross-national comparisons.

16
The remainder of the chapter is as follows. First, we review the cross-national measurement
invariance literature based on CFA. Next, we introduce our IRT model. Subsequently, we
conduct a simulation study to assess the ability of the model to recover its parameter estimates as
well country means and variances. Then, we provide an empirical application of our model,
involving an important consumer behavior construct, viz., consumer susceptibility to normative
influence (SNI) (Bearden, Netemeyer, and Teel 1989), using samples from 11 countries on four
continents. We compare the results with the results obtained with multigroup CFA and show that
the latter leads to erroneous substantive conclusions. Finally, we present conclusions, limitations,
and issues for future research.
II.2 MULTIGROUP CFA MODEL
In the CFA model, the relationship between an observed variable and a latent construct is
modeled as (Steenkamp and Baumgartner 1998):1 g
ikg
igk
gk
gikx δξλτ ++= (1)
where gikx is the observed response to item k (k=1,…,K) for respondent i in country g (with
i=1,…,Ng and g=1,…,G) , gkλ is the slope (or “factor loading”) of the regression of g
ikx on the
value of latent construct for respondent i in country g, giξ , and g
kτ indicates the expected value of
gikx when g
iξ =0. The model can also be written as xig = τg + Λgξi
g + δig , where xi
g is a K×1 vector
of observed variables in country g, δig is a K×1 vector of errors of measurement, τg is a K×1
vector of item intercepts, and Λg is a K×1 vector of factor loadings. Assuming that the
measurement errors have zero means, the expectation of xig can be written as E(xi
g) = τg + Λgκg,
where κg is the latent mean of the construct. The variance-covariance matrix among the observed
variables xig can be expressed as V(xi
g) = Σg = ΛgΦgΛg’ + Θg . In this formula, Φg is the variance
of the latent construct and Θg is the (usually diagonal) matrix of measurement error variances.
To identify the multiple-group CFA model, two constraints are necessary (Steenkamp and
Baumgartner 1998). First, it is necessary to assign a unit of measurement to the latent construct.
1 For comparability with the IRT specification, we assume a single construct. Consistent with usual applications of the multigroup CFA model, and without loss of generality, we assume that the number of items is equal across countries. See Baumgartner and Steenkamp (1998) for an extension of the multigroup CFA model that accommodates varying numbers of items across countries.

17
Although there are various ways to do this, the most common approach is to constrain the
factor loading of one item (referred to as the marker item) to unity in all countries. Only items
that have the same factor loading across countries (i.e., are metrically invariant) may be selected
as marker item. Second, the origin of the scale needs to be identified. Usually, researchers fix the
intercept of a latent variable’s marker item to zero in each country, so that the mean of the latent
variable is equated to the mean of its marker variable. Alternatively, researchers can fix the latent
mean at zero in one country and constrain one intercept per factor to be invariant across
countries. This item should have invariant factor loadings across countries, which can be checked
using empirical criteria such as modification indices and expected parameter changes.
Levels of Invariance
Several tests of cross-national measurement invariance are performed as a prerequisite to
conducting comparisons across countries. These tests are necessary in CFA because valid cross-
country comparisons require that the scale of the latent variable be the same across countries.
Steenkamp and Baumgartner (1998) recommend the use of hierarchical nested models in which
the fit statistics of an unconstrained invariance model are examined and compared with the fit
statistics of a constrained invariance model by means of a chi-square difference test, which is a
likelihood ratio test. Apart from standard chi-square difference tests, the use of fit indexes such as
CFI, TLI, and RMSEA is recommended. The type of invariance in CFA-based models that is
required generally depends on the goals of the study (Steenkamp and Baumgartner 1998).
Configural invariance is necessary when the goal is to explore the basic structure of the construct
across cultures. Configural invariance is supported if the specified model fits the data well, and
all factor loadings are significantly and substantially different from zero.
Metric invariance provides a stronger test of invariance by introducing the concept of equal
metrics or scale intervals across countries. Since the factor loadings carry the information about
how changes in latent scores relate to changes in observed scores, metric invariance can be tested
by constraining the loadings to be the same across countries. Metric invariance (equality of factor
loadings) of at least two items is required to compare structural relationships between constructs
(Byrne et al. 1989; Steenkamp and Baumgartner 1998). Although one formally only needs one
invariant item, an additional invariant item is necessary because of exact identification in case of
a single invariant item (any change of metric in the factor loading can be compensated for by

18
change in the metric of the latent construct). To test the item’s invariance, an overidentified
model is necessary with another invariant item.
Consumer researchers are often interested in comparing the means on the construct across
countries. In order for such comparisons to be meaningful, scalar invariance (equality of
intercepts) of the items is required (Meredith 1993). Scalar invariance addresses the question
whether there is consistency between cross-national differences in latent means and cross-
national differences in observed means. Even if an item measures the latent variable with
equivalent metrics in different countries (metric invariance), scores on that item can still be
systematically upward or downward biased. Meredith (1995) refers to this as additive bias.
Comparisons of country means based on such additively biased items is meaningless unless this
bias is removed from the data (Meredith 1993). Scalar invariance of at least two items that also
exhibit metric invariance is necessary to conduct valid cross-national comparisons in construct
means (Steenkamp and Baumgartner 1998), for the same reason as for metric invariance.
Limitations of CFA
The multigroup CFA framework has several important limitations. First, testing for partial
invariance is generally an exploratory post-hoc method, subject to capitalization on chance.
MacCallum, Roznowski, and Necowitz (1992) recommend that the number of model
modifications should be kept low and only those respecifications that correct for relatively severe
problems of model fit should be introduced. In addition, if there are few invariant items, the usual
tests for differential item functioning may identify an invariant item as being noninvariant due to
the fact that the model also tries to fit the other noninvariant items (Holland and Wainer 1993).
Second, to make substantive comparisons, at least two items should exhibit invariance across
countries. This requirement is independent of scale length. But when the measurement instrument
consists of only few items, or when the number of countries increases, this requirement is likely
to be problematic (Baumgartner 2004). When measurement invariance is not satisfied, subgroups
of countries have to be found that are measurement invariant (Welkenhuysen-Gijbels, Billiet, and
Cambré 2003). However, researchers usually want to compare all countries.
Third, multigroup CFA does not recognize the ordinal nature of the rating scale. Recent
simulation studies have shown that ignoring the ordinal nature of the data is problematic in multi-
group research (Lubke and Muthén 2004). The CFA methodology assumes that the observed data
is multivariate normally distributed, and therefore, tests of measurement invariance focus on the

19
regression intercepts gkτ , and factor loadings g
kλ . However, the set of parameters required to
achieve measurement invariance across countries is different for ordinal data. Although there are
multiple ways to conceptualize ordinal data, a common data generating mechanism starts with an
unobserved continuous outcome, and states that a response category is chosen above a lower
category if the continuous latent variable exceeds a certain threshold. These thresholds are not
modeled in CFA. As a result, measurement invariance tests based on the CFA methodology can
indicate that measurement invariance is satisfied, when it is not, and vice versa, complicating
cross-national comparisons of the latent construct (Lubke and Muthén 2004). However, these
thresholds can be modeled by IRT models for polytomous (ordinal) data.
II.3 IRT MODEL
Below, we describe the IRT approach. We start with an overview of the general aspects of
IRT for polytomous data. Although IRT models have been popular for dichotomous items,
Samejima (1969, 1972) extended IRT models to polytomous items with multiple ordered
response categories. Next, we discuss the traditional multigroup IRT model and how the different
countries can be linked together so that the latent variable is measured on the same scale across
countries. Like CFA, previous multigroup IRT models require certain levels of invariance to
allow for valid country comparisons (May 2005; Meade and Lautenschlager 2004).
Subsequently, our new IRT model is introduced. Our model takes not only mean differences
into account (like Holland and Wainer 1993) but also scale-usage differences. Moreover, our
model does not require cross-national measurement invariance for valid country comparisons.
Nevertheless, invariance tests may be useful for diagnostic purposes, e.g., to better understand
response behavior in different countries (cf. Wong et al. 2003). Hence, we conclude this section
with a discussion on invariance tests in the context of our IRT model.
IRT for ordinal response data
IRT models posit a reflective (cf. Jarvis, MacKenzie, and Podsakoff 2003), nonlinear
relationship between an underlying latent construct and the observed score at the item level.
Despite many advantages over the classical test theory paradigm, IRT models have been
conspicuously absent from the marketing literature (see Balasubramanian and Kamakura 1989,
Singh, Howell, and Rhoads 1990, Bechtel 1985 for exceptions).
IRT has mainly been used in marketing for adaptive surveys, i.e., surveys in which questions
are adapted based on an individual’s previous responses (see Balasubramanian and Kamakura

20
1989 for an example of the tailored interview process). IRT models for ordinal data are
conceptually somewhat similar to ordinal/limited dependent data models in the econometrics
literature (Franses and Paap 2001; Greene 2003; Maddala 1983). However, in IRT models, there
are multiple ordinal items that reflect a latent construct, while for the ordinal data models in
econometrics, there is usually a single ordinal variable.
The item response function (IRF) is the nonlinear monotonic function that accounts for the
relationship between a respondent’s value for latent variable giξ and the probability of a
particular response on an item. Local independence is assumed, i.e., there is no relationship
between the respondent’s item responses given giξ . Polytomous IRT models deal with responses
to items measured on C ordered response categories. For example, the 5-point Likert item
commonly used in marketing research has C=5 ordered response options, such as “Strongly
disagree”, “Disagree”, “Neither agree nor disagree”, “Agree”, “Strongly Agree”. In a cross-
national setting with G countries, the graded response model (GRM) for country g is given by:
gck
gck
gck
gi
gk
gck
gi
gk
gck
gck
gk
gi
gik
IRFIRF
aaacxP
,1,
,1,1,, )()(),,,|(
−=
−Φ−−Φ==
−
−− γξγξγγξ (2)
where Φ(.) is the standard normal cumulative distribution function. This model specifies the
conditional probability of a person i in country g, responding in a category c (c=1,…,C) for item
k, as the probability of responding above c-1, minus the probability of responding above c. The
parameter gka is called the discrimination parameter for item k in country g, and is conceptually
similar to the factor loading gkλ in the CFA setting, in that it represents the strength of the
relationship between the latent variable and item responses (Reise, Widaman, and Pugh 1993).
Useful items have a large discrimination parameter.
The thresholds gck ,γ are measured on the same scale as g
iξ and determine the difficulty of
responding above a certain response category c. The threshold gck ,γ is defined as the value on the
giξ scale so that the probability of responding above a value c is 0.5, for c=1,…,C-1. In (2), one
can put ∞=−∞= gCk
gk ,0, , γγ , so that only the thresholds for the categories 1 through C-1 need to
be considered. For illustration, we draw the IRFs for an item k on a 5-point Likert scale in
country g with 3,1,1,3,1 4321 ==−=−== gk
gk
gk
gk
gka γγγγ in figure 1.

21
FIGURE 1 ILLUSTRATIVE ITEM RESPONSE FUNCTIONS
The IRF curves display the probability of responding above a certain rating scale point as a
function of a person’s position on the underlying latent construct. Only four curves are shown, as
by definition, the probability of responding above c=5 is 0. For instance, IRF2 graphs the
probability of responding above c=2 for varying levels of giξ . Suppose a respondent has 2g
iξ = − ,
then s/he has a probability of 0.85 of responding above c=1, a probability of 0.15 of scoring
above c=2, and a probability of almost 0 to respond above c=3,4,5. Thus, c=2 is the most likely
outcome.
The IRFs, displayed in figure 1, can be used to compute the probability of a category
response by equation (2). The category response functions (CRF) for the item with the item
parameters given above are displayed in figure 2. Note that the values for γ correspond to the
intersection of two successive CRFs. For instance, for 31 −== gk
gi γξ , the CRFs for categories 1
and 2 intersect. Further, it can be seen that a respondent with 2giξ = − has a probability of 0.15 to
respond c=1, a probability of 0.69 to respond c=2, a probability of 0.15 to answer c=3, a
probability of 0.01 to respond c=4, and a probability of 0 to respond c=5. Across all categories,
the response probabilities within respondents sum to 1.
22
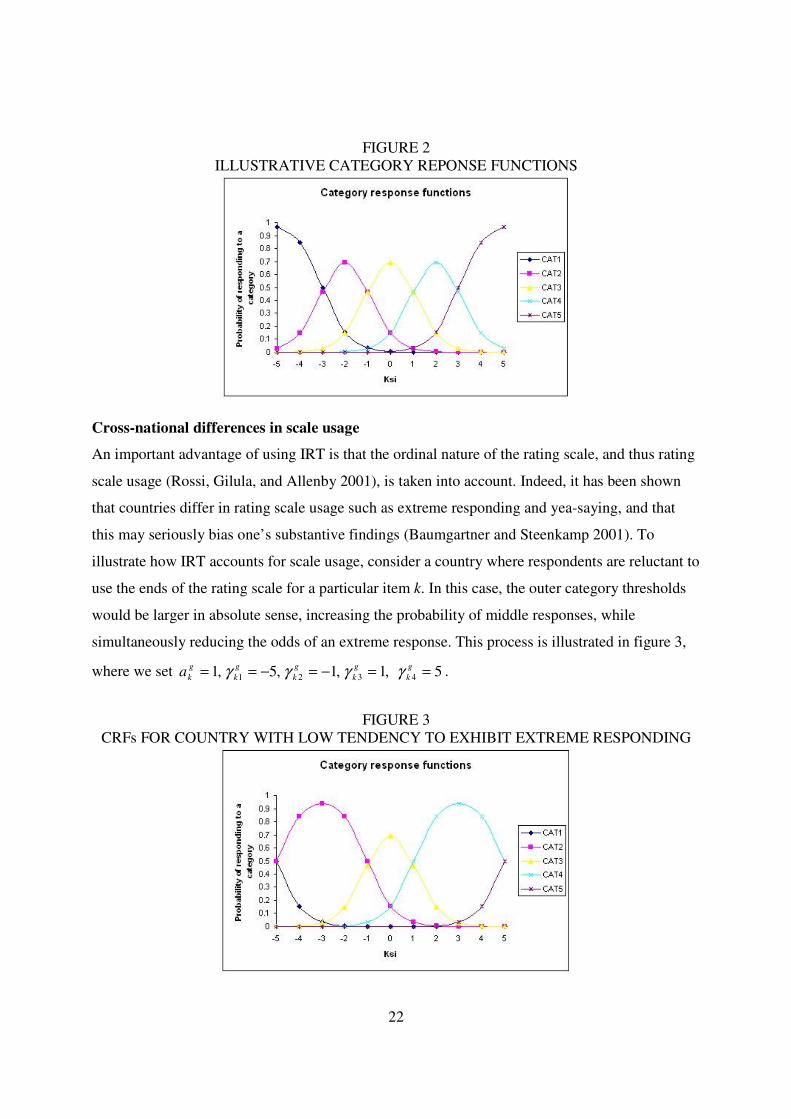
FIGURE 2 ILLUSTRATIVE CATEGORY REPONSE FUNCTIONS
Cross-national differences in scale usage
An important advantage of using IRT is that the ordinal nature of the rating scale, and thus rating
scale usage (Rossi, Gilula, and Allenby 2001), is taken into account. Indeed, it has been shown
that countries differ in rating scale usage such as extreme responding and yea-saying, and that
this may seriously bias one’s substantive findings (Baumgartner and Steenkamp 2001). To
illustrate how IRT accounts for scale usage, consider a country where respondents are reluctant to
use the ends of the rating scale for a particular item k. In this case, the outer category thresholds
would be larger in absolute sense, increasing the probability of middle responses, while
simultaneously reducing the odds of an extreme response. This process is illustrated in figure 3,
where we set 5,1,1,5,1 4321 ==−=−== gk
gk
gk
gk
gka γγγγ .
FIGURE 3
CRFs FOR COUNTRY WITH LOW TENDENCY TO EXHIBIT EXTREME RESPONDING

23
Comparing figures 2 and 3, it can be seen that, for the same values of giξ , the probability of
responding in categories 2 or 4 becomes larger, while the odds of responding in categories 1 and
5 are very small. So, although the latent score is the same, scale usage in a country on item k
determines the response on the rating scale. Analogously, if a country is high on yea-saying on a
particular item, the thresholds for categories 4 and 5 become smaller.2
Identification and linking groups
As in the CFA models, two issues need to be addressed. First, the IRT model needs
identification restrictions, since the latent variable has no definite origin. Second, we specified a
separate IRT model for each country g, without linking the G models. To make meaningful
substantive comparisons across countries, the IRT models should be linked to ensure that the
numerical values for the latent variable across countries are on the same measurement scale. If
the scores on the latent variables are not on the same scale, differences between countries in mean
levels or in structural relations of the construct with other constructs might be spurious.
To scale the latent variable, single-group IRT models usually specify a distribution for the
latent variable with mean zero and variance one. It is also possible to use item parameter
restrictions to fix the scale of the latent variable. In cross-national settings, mere standardization
in each country without linking the countries renders item parameters incomparable across
groups. An approach that has been commonly used in previous research is fixing the mean to zero
and variance to one in the reference group, freely estimating the mean in the other groups, while
fixing the variance in the other groups to some value determined by a trial and error analysis
(Reise et al. 1993). Thus, the variance of the latent variable is not estimated freely across groups.
If no further restrictions are employed, and all items are estimated freely across countries, the
model is identified, but the metric for ξ is not common across countries. Therefore, additional
restrictions are necessary to link the groups. Multigroup IRT models to date impose invariance
restrictions on the item parameters (May 2005; Meade and Lautenschlager 2004; Reise et al.
1993), to make the scale common across countries. A minimum identifying constraint is that for
at least one anchor item, the item parameters are invariant across countries. In that case,
calibrating the rest of the items together with the anchor item results in a common scale for ξ
2 We note that the bias should not be completely uniform across items (cf. Thissen, Steinberg, and Gerrard 1986). Recent evidence indeed shows that the bias is different for different items (De Jong et al. 2007).

24
across countries. Note that this still requires an item that is known (or assumed) to be fully
invariant across countries.
Hierarchical IRT
We propose a new approach to identify and link groups. We first model differential item
functioning, including scale usage differences across countries using a random-effects ANOVA
formulation.3 We model random item parameter variation as:
( )2, , , ,, ~ 0, for 1, , 1
k
g g gk c k c k c k ce e N c Cγγ γ σ= + = − , g
Ckgk 1,1, −≤≤ γγ (3)
],0(),,0(~, 2 AaNrraa gka
gk
gkk
gk k
∈+= σ (4)
Equation (3) implies that each scale threshold gck ,γ for a particular item k in country g is modeled
as an overall mean threshold ck ,γ , plus a country-specific deviation gcke , . Analogously, equation
(4) posits that the discrimination parameter gka is the sum of an overall mean discrimination
parameter and country-specific deviation (and the discrimination parameter should be positive,
and in a bounded interval; A is a positive number). The variances of the threshold and
discrimination parameters are allowed to vary across items. In our model, there is no longer a
need to classify items as being invariant or non-invariant.
When calibrating the item parameters, it is important to model the heterogeneity in the latent
variable. Thus, a hierarchical structure is imposed on giξ by letting:
),0(~, 2g
gi
gi
ggi N συυξξ += (5)
),(~ 2τξξ Ng (6)
In other words, the position on the latent scale for respondent i in country g is sampled from the
country average gξ with variance 2gσ . The country average is drawn from a distribution with
average ξ and variance τ2. This random-effects approach for the latent variable is consistent with
recent work on multilevel latent variable modeling in psychometrics (Fox and Glas 2001; 2003).
When the random-effects structure for item parameters is combined with the random-effects
structure for the latent variable, there is an identification problem. Each country mean can be
shifted by changing the country mean, gξ , as well as by uniformly shifting the country-specific
3 Random-effects IRT specifications for binary response data that allow for random item variation were proposed by Janssen et al. (2000). However, in their article, the grouping was based on items, rather than on countries. In addition, the data in our setting is polytomous.

25
threshold values, kgck ∀,γ . We fix the mean of country g, by restricting the country-specific
threshold parameters in such a way that a common shift of these threshold values is not possible.
This can be done by setting 03, =k
gkγ . Since this restriction is applied in each country, the mean
of the metric of the latent variable is identified via restrictions on the country-specific threshold
parameters.
Analogously, the country variances can be shifted both by 2gσ , as well as by uniform changes
in the discrimination parameters (that is, setting kdaa gk
gnewk ∀×=, ). To fix the country-specific
variances, we need to impose a restriction that a common shift of country-specific discrimination
parameters is not possible, which can be done by imposing that across items, the product of the
discrimination parameters equals one in each country g ( 1=∏k
gka ∀g). Hence, both the mean
and variance of the latent variable in each country is fixed, and the scale remains common due to
the simultaneous calibration of the multilevel structures for item parameters and latent variable.
The hierarchical Bayesian framework allows for borrowing of strength across countries.
Previous multigroup CFA research models country means/variances, factor loadings, and item
intercepts as separate parameters, without borrowing strength across countries. The same holds
for previous multigroup IRT research (i.e., discrimination, threshold, country mean and variance
are modeled as separate parameters). By borrowing strength, we can place less restrictive
assumptions on measurement invariance, while retaining the possibility to let the various
parameters fluctuate across countries. In table 1, we present an overview table to contrast our
specification with previous multigroup IRT and CFA models.
Table 1 OVERVIEW OF MULTIGROUP LATENT VARIABLE MODELS
Latent variable heterogeneity (separate country means and variances)
Random effects structure for item parameters
Invariance requirements on items
Previous multigroup IRT approaches
Yes (separate means and variances)
No Yes
Multigroup CFA approach
Yes (separate means and variances)
No Yes
This chapter Yes (random-effects structure)
Yes No

26
IRT estimation
Both marginal maximum likelihood techniques and Bayesian techniques have been used in
previous multigroup IRT research (e.g. Bolt et al. 2004; May 2005; Meade and Lautenschlager
2004; Reise et al. 1993; Thissen, Steinberg, and Wainer 1988; 1993). We use Bayesian
techniques to estimate the model parameters. The Bayesian approach requires the specification of
a full probability model. To obtain draws from the posterior distribution, we use a data-
augmented Gibbs sampler (Tanner and Wong 1987) with a Metropolis-Hastings step for the
threshold parameters. Estimation details, including the priors are described in Appendix A.
IRT-based invariance testing
Although our hierarchical IRT model does not require invariance across countries to make
substantive comparisons, we describe the various levels of invariance that can be imposed on the
IRT model below. These tests of invariance would mainly serve as a diagnostic tool, e.g., to see
whether or not items are culturally biased, or to investigate other aspects of either the
measurement or the structural model (e.g., Raju, Byrne, and Laffitte 2002; Reise et al. 1993;
Wong et al. 2003). Previous research has only considered invariance of the discrimination
parameters (7) and the threshold parameters (8), and not the invariance of the latent variable
variance because it could not be freely estimated (see Bolt et al. 2004; Meade and Lautenschlager
2004; Reise et al. 1993). Our model also allows tests of factor variance invariance, i.e., invariance
of the latent variable variance across countries. Full item parameter invariance is satisfied if for
all items k: Gkkk aaa ===
21 (7)
GkCkCkC
Gkkk
12
11
1
121
11
−−− ===
===
γγγ
γγγ
(8)
We assess item parameter invariance via Bayes factors (Kass and Raftery 1995; Newton and
Raftery 1994). The proposed model, M1, with varying item parameters is compared to a model,
M2, with fixed item parameters across countries. The Bayes factor is the ratio of the two marginal
likelihoods, the marginal likelihood of the data under model M1 and M2. Large values of the
Bayes factor BF12 indicate a preference for model M1. The Bayes factors are computed via
importance sampling (Newton and Raftery 1994). Bayesian inferences regarding the variances of
the item parameters are based on their marginal posterior distributions. Factor variance invariance

27
is tested, using a Bayesian parallel to Bartlett’s test of equal variances, while means can be
compared using a Bayesian ANOVA. We refer to appendix B for more details.
II.4 SIMULATION STUDY
The purpose of the simulation study was to examine: 1) whether the country-specific
discrimination and threshold parameters can be recovered, and 2) whether the country-specific
latent means and variances can be recovered, under 3) the condition that no measurement
invariance constraints are imposed on the model. For this purpose, we generate a dataset with no
cross-nationally invariant items. That is, there is variation in the values of the item parameters for
each item across countries. The multigroup CFA approach would not be feasible in this case,
because metric invariance is not satisfied for any item. In addition, mean comparisons would not
be possible due to differences in scale usage for all items. However, as shown below, the IRT
model does allow researchers to conduct substantive cross-national comparisons, even though
measurement invariance is not fulfilled, because all respondents in all countries are calibrated on
the same latent scale.
Data was generated according to the random effects specifications in (3) to (6) with 10
countries, 1,000 respondents per country. There are 10 items, and each item is measured on a 4-
point Likert scale. In the simulation design, both the discrimination parameters and the threshold
parameters are generated so that they vary randomly across nations. For the threshold parameters,
the standard deviations range from 0.45 to 0.65 across items k, while for the discrimination
parameters, standard deviations range from 0.15 to 0.40 across items k.
For the item parameters, we present scatter plots of estimated vs. true parameters in figure 3.
The true values are accurately recovered by the model. This applies to both the discrimination
parameters, and the threshold parameters. Regressing the estimated discrimination parameters on
the true discrimination parameters results in a regression slope of 0.97, where the 95%
confidence interval includes 1, and an R2 of 0.91. Similarly, a regression of estimated threshold
parameters on true threshold parameters yields a regression slope of 0.99, with a 95% confidence
interval that includes 1, and an R2 of 0.99.
In table 2, we present the true versus the estimated country means and variances. As can be
seen, parameter recovery is accurate. On average, estimated country means differ only 1.33%
from the true country means, while the difference in the country latent score variances is 5.68%
due to sampling error. Thus, the simulation study revealed that our model was able to accurately

28
recover country-specific means, variances, discrimination, and threshold parameters, although
there was not a single invariant item.
Table 2 TRUE AND ESTIMATED COUNTRY MEANS AND VARIANCES
Country mean Country variance True value Estimated value True value Estimated value
Country 1 -0.299 -0.323 0.332 0.314 Country 2 2.399 2.274 0.645 0.510 Country 3 0.154 0.161 1.212 1.230 Country 4 -0.823 -0.800 0.889 0.870 Country 5 -0.273 -0.241 0.461 0.484 Country 6 -0.121 -0.131 0.593 0.598 Country 7 0.271 0.276 0.466 0.461 Country 8 -0.862 -0.812 1.467 1.234 Country 9 0.321 0.303 1.381 1.329 Country 10 1.688 1.607 1.910 1.626
FIGURE 4
ESTIMATED VS. TRUE ITEM PARAMETERS
II.5 APPLICATION TO CONSUMER SUSCEPTIBILITY TO NORMATIVE
INFLUENCE
Consumer Susceptibility to Normative Influence
We apply our model to real cross-national data on consumers’ susceptibility to normative
influence. Consumers differ in the degree to which they are influenced in their attitudes and
behavior by the norms of the social system, i.e., in their susceptibility to normative influence
(SNI). The consumer behavior literature recognizes that individuals’ behavior cannot be fully

29
understood unless consideration is given to the effect of a person’s SNI on development of
attitudes, aspirations, and behavior (Bearden et al. 1989). SNI has been linked to various aspects
of consumer behavior such as attitudes toward brands (Batra et al. 2000), advertising
(Mangleburg and Bristol 1998), and consumption alternatives resulting from globalization
(Alden, Steenkamp, and Batra 2006), consumer confidence (Bearden, Netemeyer, and Teel
1990), protective self-presentation efforts (Wooten and Reed 2004), purchase of new products
(Steenkamp and Gielens 2003), and consumer boycotts (Sen, Gürhan-Canli, and Morwitz 2001),
among others. Consumers high on SNI tend to be lower on self-esteem, and higher on motivation
to comply with the expectations of others, interpersonal orientation, and attention to social
comparison information (Bearden et al. 1989, 1990). Most SNI research has been carried out in
the U.S., despite the obvious importance of normative influences in other, e.g., collectivistic
cultures (Kagitcibasi 1997).
Consumers in some countries may be on average higher on SNI than consumers in other
countries, due to systematic differences in the national cultural environment. Culture is a powerful
force shaping people's perceptions, dispositions, and behaviors (Triandis 1989) and is reflected in
“persistent preferences for specific social processes over others” (Tse et al. 1988, p. 82). We expect
that national-cultural individualism is especially important for understanding cross-national
differences in SNI. National-cultural individualism pertains to the degree to which people in a
country prefer to act as individuals rather than as members of a group. Collectivistic cultures are
conformity oriented, and show a higher degree of group behavior and concern to promote their
continued existence.
The conformity pressure and the close-knit social structure will also result in less divergence in
attitudes compared to individualistic countries because divergence in attitudes is less valued in
collectivistic cultures (Kagitcibasi 1997). In individualistic societies, the social fabric and group
norms are much looser. People tend not to follow social norms but rather make decisions and initiate
behaviors independently of others (Roth 1995). A child already learns very early to think of itself as
"I" instead of as part of "we" while the converse holds for collectivistic societies (Hofstede 2001).
Thus, consumer cultural theory suggests that consumers living in individualistic countries 1)
are on average lower on SNI and 2) exhibit more divergence in their SNI attitudes compared to
consumers living in collectivistic countries.

30
Method
The data collection was part of a large global study on consumer attitudes. Data collection was
carried out by two global marketing research agencies, GfK and Taylor Nelson Sofres. The total
sample for the present application comprises 5,484 respondents in 11 countries, from four
continents, viz., Brazil, China, France, Japan, the Netherlands, Poland, Russia, Spain, Taiwan,
Thailand, and the U.S. The number of respondents per country varies between 396 (Taiwan,
Russia) and 546 (Spain). Given the importance of the U.S., the marketing research agencies
decided to put an additional effort in sampling respondents from the U.S. Therefore, the number
of respondents for the U.S. is 1,181. The samples in each country were drawn so as to be broadly
representative of the total population in terms of region, age, education and gender.
For the U.S., France, Spain, Japan, and the Netherlands, a web survey was used in which
respondents in script panels of GfK and Taylor Nelson Sofres were invited to participate in the
project by an e-mail in the local language. The e-mail contained a short description, a hyperlink
to go to the survey, and an estimate of the time needed to complete the survey. At the end of the
fieldwork period, respondents were paid by the local subsidiary of the global marketing research
agencies.
For China and Russia, Internet surveys were administered using mall intercepts. For the mall
intercepts, the first step was to select multiple regions/locations for the fieldwork. Next, a space
was rented which had an Internet connection for 2-5 PCs or laptops (e.g., Internet cafes,
subsidiaries of offices, test halls for product tests) and offered the possibility to ‘intercept’
appropriate shoppers/respondents walking in the street using street recruiters.
Finally, in Brazil, Taiwan, and Thailand, a hard-copy survey instrument was used, which was
also administered in mall intercepts. The hard-copy tool was designed so that the layout was
exactly the same as in the Internet survey. The staff for the hard-copy mall intercepts generally
consisted of a field supervisor, responsible for answering respondents’ questions and monitoring
the whole fieldwork, a logical controller, responsible for logical control and sampling quotas, and
3-4 street recruiters.
SNI was measured using the 8-item scale developed by Bearden et al. (1989). This
unidimensional scale has been extensively validated, and is the most frequently used instrument
to measure SNI. The items are listed in table 3. The SNI items were translated into all local
languages by professional agencies. Next, the translated items were backtranslated into English,

31
using native speakers from the local countries. In each survey, modifications were made based on
discussions between the backtranslators, one of the authors, and the headquarters of the
marketing research agencies to maintain consistency in changes across all countries. All items
were measured on a 5-point Likert scale.
We randomly dispersed the items throughout the questionnaire. There is a debate in the
literature whether items pertaining to the same construct should be randomized in the
questionnaire or grouped together (Bradlow and Fitzsimons 2001). The idea behind
randomization is to hide the purpose of the instrument from the respondent, thus reducing
response biases such as a desire to look good to others (e.g., evaluation apprehension) and to
oneself (cognitive consistency and ego defense mechanisms). But randomization may also reduce
reliability (Bradlow and Fitzsimons 2001). However, low reliability was not an issue in our study
as in all countries, the reliability of SNI exceeded the .70 cutoff.
We used Bayesian routines programmed in Fortran for the IRT model. The Bayesian routines
are linked to S-Plus®.4
Table 3 SNI ITEMS
Item Description Item 1 If I want to be like someone, I often try to buy the same brands that they buy. Item 2 It is important that others like the products and brands I buy. Item 3 I rarely purchase the latest fashion styles until I am sure my friends approve of them. Item 4 I often identify with other people by purchasing the same products and brands they
purchase. Item 5 When buying products, I generally purchase those brands that I think others will
approve of. Item 6 I like to know what brands and products make good impressions on others. Item 7 If other people can see me using a product, I often purchase the brand they expect me
to buy. Item 8 I achieve a sense of belonging by purchasing the same products and brands that
others purchase.
IRT results
We estimate our hierarchical IRT model using MCMC techniques. Convergence of the chains
is checked using the CODA software (Best, Cowles, and Vines 1995), which contains multiple
standard convergence diagnostics. Multiple chains for different starting values were run, and
4 The software to estimate this model can be obtained from the authors. Other researchers can easily estimate their own models by adapting the number of items and countries. The number of countries groups matters for the choice of a fixed vs. random effects approach.

32
convergence occurred quickly for most parameters. We ran multiple chains for different starting
values. The first 10,000 iterations are discarded, and 30,000 posterior draws are subsequently
used to estimate the model parameters. We present the results of the model, and in the next
section we consider a number of invariance tests for diagnostic purposes.
Table 4 presents the estimation results for the discrimination parameters. The items generally
discriminate well for each country, given the posterior distribution of the latent variable. Table 4
further shows that there are substantial cross-national differences in the discimination power of
any specific item.
On average, item 3 has a lower discrimination parameter than the other items, indicating that
this item measures the SNI construct somewhat less well than the other items. Interestingly, it is
the only item that refers to a specific consumption domain (fashion styles). From a scale
reliability point of view (although not necessarily from a content/predictive validity standpoint),
items 5, 7 and 8 are on average the best items. These results are quite consistent across countries.
Thus, if a researcher wants to use a maximally reliable short-form of SNI because 8 items is too
much (cf. Burisch 1984), items 5, 7, and 8 would be prime candidates.5
Next, we turn to the threshold parameters. Since the items are measured on a 5-point scale,
there are 4 thresholds per item. Thus, each country has 4×8 = 32 threshold parameters, so in total,
there are 352 threshold parameters. As was the case for the discrimination parameters, there is
substantial cross-national variation. For illustrative purposes, we plot the posterior means of the
threshold parameters for item 6 in figure 5.
To illustrate the effect of the threshold parameters on the probability of responding to a
certain Likert response category, we plot the CRFs for item 8 for Thailand and Russia in figure 6.
Comparing Thailand and Russia, we see that for equal true scores, the probability of responding
in categories 1 and 5 (i.e., “Strongly disagree” and “Strongly agree”) is much smaller in Thailand
than in Russia. Consider for instance a respondent with a moderately low latent SNI score of ξ=-
1. In Thailand, this respondent has a probability of 0.24 to choose the response category 1, while
in Russia, this probability is 0.66. Thus, for this item, there is a difference of 0.42 in the
probability between Russian and Thai respondents in checking response category 1 on the 5-point
scale, even though they hold the same underlying true opinion! On the other hand, Thai
5 For the IRT model, it doesn’t matter whether items 5, 7, and 8 are invariant. For CFA, we would need two items in the short scale to be invariant.
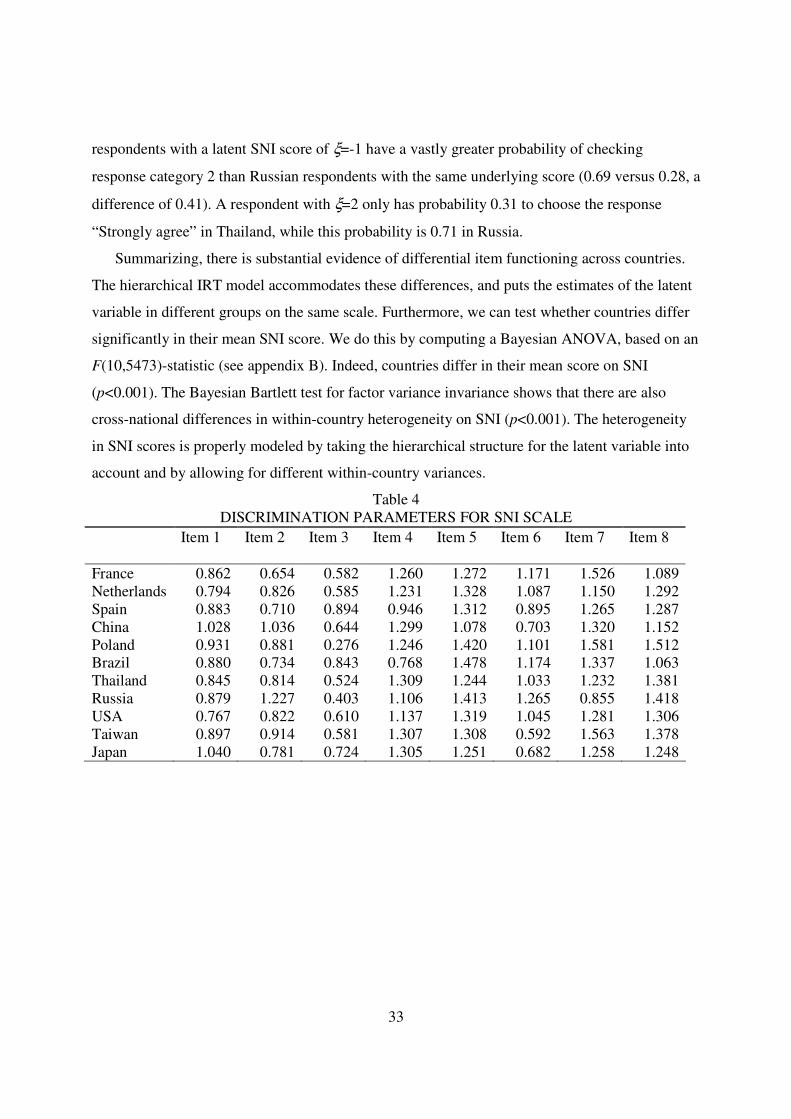
33
respondents with a latent SNI score of ξ=-1 have a vastly greater probability of checking
response category 2 than Russian respondents with the same underlying score (0.69 versus 0.28, a
difference of 0.41). A respondent with ξ=2 only has probability 0.31 to choose the response
“Strongly agree” in Thailand, while this probability is 0.71 in Russia.
Summarizing, there is substantial evidence of differential item functioning across countries.
The hierarchical IRT model accommodates these differences, and puts the estimates of the latent
variable in different groups on the same scale. Furthermore, we can test whether countries differ
significantly in their mean SNI score. We do this by computing a Bayesian ANOVA, based on an
F(10,5473)-statistic (see appendix B). Indeed, countries differ in their mean score on SNI
(p<0.001). The Bayesian Bartlett test for factor variance invariance shows that there are also
cross-national differences in within-country heterogeneity on SNI (p<0.001). The heterogeneity
in SNI scores is properly modeled by taking the hierarchical structure for the latent variable into
account and by allowing for different within-country variances.
Table 4 DISCRIMINATION PARAMETERS FOR SNI SCALE
Item 1 Item 2 Item 3 Item 4 Item 5 Item 6 Item 7 Item 8
France 0.862 0.654 0.582 1.260 1.272 1.171 1.526 1.089 Netherlands 0.794 0.826 0.585 1.231 1.328 1.087 1.150 1.292 Spain 0.883 0.710 0.894 0.946 1.312 0.895 1.265 1.287 China 1.028 1.036 0.644 1.299 1.078 0.703 1.320 1.152 Poland 0.931 0.881 0.276 1.246 1.420 1.101 1.581 1.512 Brazil 0.880 0.734 0.843 0.768 1.478 1.174 1.337 1.063 Thailand 0.845 0.814 0.524 1.309 1.244 1.033 1.232 1.381 Russia 0.879 1.227 0.403 1.106 1.413 1.265 0.855 1.418 USA 0.767 0.822 0.610 1.137 1.319 1.045 1.281 1.306 Taiwan 0.897 0.914 0.581 1.307 1.308 0.592 1.563 1.378 Japan 1.040 0.781 0.724 1.305 1.251 0.682 1.258 1.248

34
FIGURE 5 CROSS-NATIONAL VARIATION OF POSTERIOR MEAN THRESHOLD PARAMETERS
FOR SNI ITEM 6
-2.5
-2
-1.5
-1
-0.5
0
0.5
1
1.5
2
2.5
1 2 3 4
threshold
gam
ma
FIGURE 6 CRFS FOR ITEM 8

35
IRT-based invariance tests
Although our model does not require invariance of parameters across countries for valid cross-
national comparisons, invariance tests are of interest for diagnostic purposes, i.e., to better
understand response behavior for specific items and countries (e.g., Raju et al. 2002; Reise et al.
1993; Wong et al. 2003). We test the plausibility of several competing models using marginal
log-likelihoods and Bayes factors (Kass and Raftery 1995). Three models are considered. The
first model (M1) has invariant discrimination and threshold parameters, i.e. kgk aa = ∀g, and
kcgkc γγ = , c=1,…,C-1 ∀g. The second model (M2) relaxes all invariance constraints on the
threshold parameters γγγγ (thus, only the discrimination parameters a are kept invariant across
countries), and the third model (M3), which is the most flexible one and for which the results are
reported above, relaxes all invariance constraints (both on a and γγγγ). The marginal log-likelihoods
and Bayes factors (assuming P(M1)=P(M2)=P(M3)) of the different models vs. model M3 all

36
indicate that the posterior probability of M3 given the data (Berger and Delampady 1987) is
much higher than the probability of models M1 and M2. Relaxing the invariance constraints on the
discrimination parameters and on the threshold parameters yield a large improvement in fit.
The model comparison results are consistent with the earlier observation that there is
substantial variation in the discrimination and threshold parameters. This indicates that a
particular item does not perform equally well in different countries (i.e., does not discriminate
equally well between respondents in different countries), and that there are substantial cross-
national differences in response behavior on the 5-point rating scale.
CFA results
We estimated a one-factor model for the 11 countries, using LISREL. The configural
invariance model specifies the same pattern of factor loadings across countries, and serves as a
baseline model. We choose item 2 as the marker item (based on modification indices, this choice
seemed best).6 The fit of the configural invariance model is good (see table 5). Although the χ2
was significant –which is not unexpected given the large sample size - other indicators exceeded
conventional cutoff levels (Byrne, 1998): χ2(220)=914.4 (p<0.001), RMSEA=0.0791, CFI =
0.973, TLI=0.962. The within-country completely standardized loadings are relatively high. Of
the 11x8=88 factor loadings, 38 standardized loadings exceed 0.6, and 49 loadings exceed 0.5.
Based on these results, we conclude that the SNI scale exhibits configural invariance.
In the next step, we test for full metric invariance by constraining all factor loadings to be
equal across countries. The fit of this model deteriorates substantially (∆χ2(70)=343.4, p<0.001).
RMSEA and TLI, which both take fit and model parsimony into account deteriorate. In a recent
extensive simulation study, Cheung and Rensvold (2002) found that ∆CFI is a particularly robust
statistic for testing multigroup invariance constraints and reported that “a value of ∆CFI smaller
than or equal to -.01 indicates that the null hypothesis of invariance should not be rejected”
(Cheung and Rensvold 2002, p. 251). Since in our application, ∆CFI decreased by 0.019, we
conclude that full metric invariance is not supported.
Examination of the modification indices (MIs) revealed that the deterioration in fit was
largely due to a lack of invariance of four factor loadings, viz., the loadings of items 3 and 8 in
Spain (MI=20.8, MI=31.2), and factor loadings for item 6 in Taiwan and China (MI=57.7,

37
MI=29.9). Item 2 displayed small (and non-significant) modification indices, so our choice of this
marker item is justified. Freeing the loadings with high modification indices in those countries
resulted in acceptable model fit. Although the change in chi-square is still significant
(∆χ2(66)=186.4, p<0.001) RMSEA, and TLI improve compared to the configural invariance
model, while the deterioration of CFA is below the 0.01 threshold. Thus, partial metric invariance
is satisfied.
Next we tested scalar invariance for those factor loadings that are metrically invariant for the
country in question (Steenkamp and Baumgartner 1998). Model fit deteriorated dramatically
compared to the partial metric invariance model (∆χ2(66) =1052.9, p<0.001; ∆RMSEA = 0.0262;
∆CFI=-0.068; ∆TLI=-0.048). There are numerous large MIs for the item intercepts. We plot the
largest MIs in figure 7.
Table 5 MULTI-COUNTRY CFA MODEL COMPARISONS FOR SNI SCALE
χ2 Df RMSEA CFI TLI Configural invariance 914.4 220 0.0791 0.952 0.933 Metric invariance 1257.8 290 0.0820 0.933 0.929 Final partial metric invariance 1100.8 286 0.0748 0.943 0.939 Scalar invariance 2153.7 352 0.101 0.875 0.891 Final partial scalar invariance 1279.8 322 0.0767 0.934 0.936 Factor variance invariance 1369.1 332 0.0784 0.928 0.933 Partial factor variance invariance 1289.5 327 0.0762 0.933 0.937
6 In multigroup CFA, one does not know a priori which item can be used as marker item. The usual procedure is to select one item, impose full metric invariance and examine the modification indices. If another item has smaller modification indices, the model is re-estimated using this item as marker item (Steenkamp and Baumgartner 1998).

38
Figure 7 LACK OF SCALAR INVARIANCE OF THE SNI SCALE: MODIFICATION INDICES PER
COUNTRY
Relaxing these invariance constraints on the item intercepts improves model fit substantially
compared to the full scalar invariance model (∆χ2(30)=873.9, p<0.001). However, the increase
compared to the partial metric invariance model remains significant (∆χ2(36)=179.0, p<0.001),
and more importantly, ∆CFI exceeds the –0.01 threshold. Thus, even partial scalar invariance is
not supported. In any case, no items remain that are scalar invariant across all countries.
Therefore, within the CFA framework, no means analysis can be undertaken for all countries in
the study.
Finally, we tested factor variance invariance (which requires (partial) metric invariance but
not scalar invariance; Steenkamp and Baumgartner 1998). Full factor variance invariance is not
satisfied (∆χ2(10)=89.3, p<0.001). When we release the constraints on France, Spain, China,
Russia, and Japan, we obtain a satisfactory model (∆χ2(5)=9.7, p>0.05). Table 6 presents the
factor variances.
Modification indices
0
10
20
30
40
50
60
70
80
Country
MI v
alue
US
Net
herla
nds
Rus
sia
Chi
na
Taiw
an
Bra
zil
Tha
iland
Spa
in
Pol
and
Fra
nce
Japa
n
i2
i1
i4i3
i6i7
i1
i6i4
i2
i7
i1 i8i3
i4
i1i2
i4i3i2
i1i4
i6
i3
i5, i7
i2i8
i3
i6i2
i4i7 i8
Modification indices
0
10
20
30
40
50
60
70
80
Country
MI v
alue
US
Net
herla
nds
Rus
sia
Chi
na
Taiw
an
Bra
zil
Tha
iland
Spa
in
Pol
and
Fra
nce
Japa
n
i2
i1
i4i3
i6i7
i1
i6i4
i2
i7
i1 i8i3
i4
i1i2
i4i3i2
i1i4
i6
i3
i5, i7
i2i8
i3
i6i2
i4i7 i8
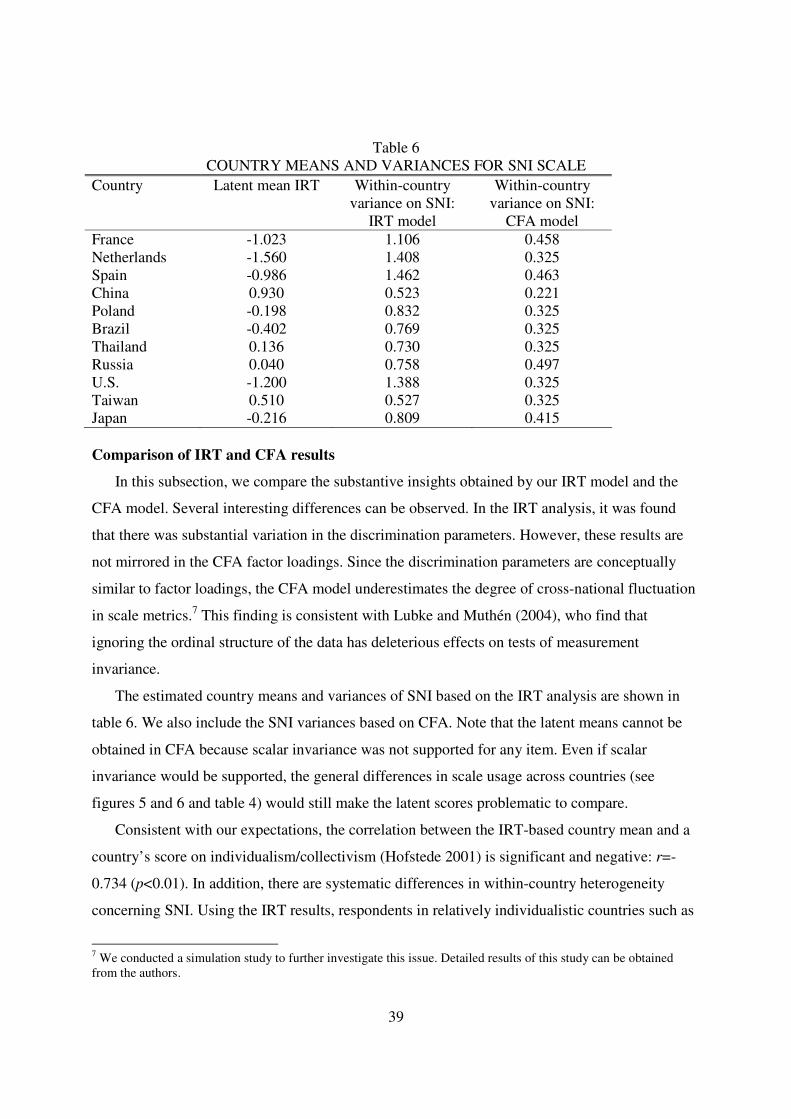
39
Table 6 COUNTRY MEANS AND VARIANCES FOR SNI SCALE
Country Latent mean IRT Within-country variance on SNI:
IRT model
Within-country variance on SNI:
CFA model France -1.023 1.106 0.458 Netherlands -1.560 1.408 0.325 Spain -0.986 1.462 0.463 China 0.930 0.523 0.221 Poland -0.198 0.832 0.325 Brazil -0.402 0.769 0.325 Thailand 0.136 0.730 0.325 Russia 0.040 0.758 0.497 U.S. -1.200 1.388 0.325 Taiwan 0.510 0.527 0.325 Japan -0.216 0.809 0.415 Comparison of IRT and CFA results
In this subsection, we compare the substantive insights obtained by our IRT model and the
CFA model. Several interesting differences can be observed. In the IRT analysis, it was found
that there was substantial variation in the discrimination parameters. However, these results are
not mirrored in the CFA factor loadings. Since the discrimination parameters are conceptually
similar to factor loadings, the CFA model underestimates the degree of cross-national fluctuation
in scale metrics.7 This finding is consistent with Lubke and Muthén (2004), who find that
ignoring the ordinal structure of the data has deleterious effects on tests of measurement
invariance.
The estimated country means and variances of SNI based on the IRT analysis are shown in
table 6. We also include the SNI variances based on CFA. Note that the latent means cannot be
obtained in CFA because scalar invariance was not supported for any item. Even if scalar
invariance would be supported, the general differences in scale usage across countries (see
figures 5 and 6 and table 4) would still make the latent scores problematic to compare.
Consistent with our expectations, the correlation between the IRT-based country mean and a
country’s score on individualism/collectivism (Hofstede 2001) is significant and negative: r=-
0.734 (p<0.01). In addition, there are systematic differences in within-country heterogeneity
concerning SNI. Using the IRT results, respondents in relatively individualistic countries such as
7 We conducted a simulation study to further investigate this issue. Detailed results of this study can be obtained from the authors.

40
the U.S. exhibit a higher divergence in their susceptibility to normative influence than
respondents in relatively collectivistic countries such as China and Taiwan. As predicted, the
correlation between the IRT-based country variance in SNI and national-cultural
individualism/collectivism is significant and positive: r=0.740 (p<0.01). On the other hand, the
correlation between national-cultural individualism/collectivism and the CFA-based latent
variable variances is insignificant (r=0.02, p>0.5), a result that lacks face validity in the light of
theory.
II.6 IMPLICATIONS FOR CROSS-NATIONAL CONSUMER RESEARCH
We showed that CFA may produce misleading results, that the IRT model appropriately models
the ordinal nature of the data, and that measurement invariance restrictions are no longer
necessary with the IRT specification. So what are the implications for consumer researchers?
First, we advise researchers to be prudent in relying on multigroup CFA:
i) It may produce invalid results due to the ordinal nature of the data;
ii) It runs into problems when the number of groups is large, or more generally, when
there are no measurement invariant items;
iii) It can only compare subgroups of countries when invariance is not satisfied, while the
IRT model allows a comparison of all countries.
Each of these issues associated with multigroup CFA hinders consumer researchers in deriving
substantively meaningful conclusions from cross-national consumer behavior studies.
Many consumer researchers are interested in conducting cross-national mean comparisons
and/or comparing structural relationships across countries. How should consumer researchers
integrate our approach with their substantive interests? If the goal is to conduct mean
comparisons, the IRT model can be used straightaway, since the model provides latent factor
scores that are all on the same scale across countries. As we discussed, a Bayesian ANOVA test
can be performed to test for mean differences.
If the goal is to compare structural relationships, the optimal way is to model all structural
relationships and the IRT measurement part simultaneously. However, such models do not yet
exist in either marketing and/or psychometrics because of data limitations and high complexity.
As a “second best” option, researchers might use a two-step approach, similar in spirit to
Anderson and Gerbing (1988). Such an analysis would require that in a first step, the latent
construct scores are estimated. In the second step, these latent scores are used in

41
regression/ANOVA type of techniques to estimate the consumer researcher’s substantive
hypotheses. Even though simultaneous modeling of measurement and structural model is
preferable, the two-step procedure is consistent with the widespread practice in both cross-
sectional and experimental research in the social sciences to examine first measurement quality of
constructs, and thereafter use construct scores (factor scores or summated scores) in
regression/ANOVA models (see also Jöreskog 2000, who advocates a similar procedure to deal
with interactions and non-linear effects in LISREL models).
II.7 GENERAL DISCUSSION
The dominant logic in consumer behavior research has been that constructs should display certain
levels of measurement invariance in order to make valid substantive cross-national comparisons.
Indeed, it has been argued that if measurement invariance across countries is lacking, conclusions
based on that scale are at best ambiguous and at worst erroneous (Horn 1991). Heeding these
recommendations, numerous articles have tested for measurement invariance of constructs, using
the multigroup CFA model (e.g., Durvasula et al. 1993; Netemeyer et al. 1991; Steenkamp and
Baumgartner 1998; Wong et al. 2003; see Vandenberg and Lance 2000 for an overview of other
social sciences). If invariance constraints are not (partially) fulfilled, cross-national comparisons
cannot be made. For example, in our application, latent means could not be compared as even
partial scalar invariance was not achieved. However, claims of the necessity of certain levels of
measurement invariance for particular research objectives are mainly the result of the particular
methodology (multigroup CFA) that is used.
In this chapter we present a model that addresses these problems. Our hierarchical IRT model
allows consumer researchers to compare countries substantively despite lack of invariance for
any of the items. Moreover, because the ordinal nature of the data is recognized, cross-national
differences in scale usage are also accommodated. We found strong noninvariance of scale
metrics and of scale usage across countries for SNI. Current CFA-based methodologies are not
well suited to account for differences in scale usage because they ignore the ordinal nature of the
data (Lubke and Muthén 2004).
Our approach is not limited to studies with many countries. A fixed-effects specification
rather than a random-effects specification can be used in studies involving few countries. The
estimation procedure would change: the fixed-effects model can be estimated by using

42
noninformative reference priors for the discrimination and threshold parameters in the MCMC
procedure. Also, the hierarchical structure for the latent variable can be relaxed in such cases.
There are many issues for further research. Understanding the sources of cross-national
differences in discrimination and scale use, as revealed in the discrimination and threshold
parameters, is an important topic in its own right. Which cultural processes give rise to cross-
national differences in these parameters? The CFA study by Wong et al. (2003) provides an
interesting example how studying cross-national differences in response behavior increases our
understanding of other cultures. Statistically, covariates that explain variation in item parameters
across countries can be incorporated in the IRT measurement model, but more theory and larger
datasets are necessary to study relationships between culture and response behavior.
Future work can also focus on extending the current modeling framework in other ways. In
consumer research, there is a growing interest in formative measurement models (Jarvis,
MacKenzie, and Podsakoff 2003). Future research might extend IRT models – which specify a
reflective relation between indicator and construct – to the formative context. In addition, it
would be desirable to integrate the IRT measurement model with a hierarchical structural latent
variable model that also contains latent predictors. Some recent work has started to address this
issue (see Fox and Glas 2003; Fox 2005a), but these models cannot yet accommodate varying
item parameters across countries in the measurement models.
Although using the same response format for any specific item across countries is common
practice in cross-national consumer research, perhaps it is preferable to use different response
formats for any specific item across countries. Like other IRT models (and CFA models), our
model allows the scale format to be different for different items, but does not allow a different
format across countries for the same item. Future research might extend our model to
accommodate such differences in response format across countries for similar items, while still
arriving at latent scores that are comparable across countries.
Although many important issues remain for future research, to the best of our knowledge,
this is the first piece of research in the social sciences that relaxes all invariance requirements
across groups, while retaining the possibility to make substantive comparisons. We hope that our
research contributes to stimulating consumer behavior researchers to pay more attention to cross-
national measurement issues, and thus further advances the rigor of cross-national consumer
research.

43
II.8 APPENDIX A: MCMC ALGORITHM
We use Bayesian inference for the IRT model, in which we specify the posterior distribution of all model parameters. For our hierarchical IRT model, the full posterior is given by:
2 2 2 2
2 2
2 2
2 2 2 2
( , , , , , , | )
( | , , ) ( | , ) ( | )
( | , ) ( | , )
( ) ( ) ( ) ( ) ( ) ( )
k k
k k
a g
g g g g g g gik i k k i g
g i k
g gk k k k a
g k
g a k kg k
f x
f x a f f
f f a a
f f f f f a f
γ
γ
γ
σ σ σ τ
ξ ξ ξ σ ξ τ
σ σ
σ σ σ τ
∝
×
×
∏ ∏ ∏
∏ ∏
∏ ∏
ξ γξ γξ γξ γ
γγγγ
γ γγ γγ γγ γ
γγγγ
a
We use data augmentation (Tanner and Wong 1987) to facilitate estimation. A Metropolis-Hastings step is used to sample the threshold parameters, for which the full conditional distribution is complex. The Gibbs sampler consists of the following steps: 1) Sample from | , , ,g g g g g
ik ik i k kZ X aξ γγγγ , for k=1,…,K, i=1,…, Ng, and g=1,…, G.
Given the variables , , , and g g g gik i k kX aξ γγγγ the variables g
ikZ are independent and normally
distributed: ( ) ( ), 1 ,| , , , ~ ,1g g g g g g g g g gik ik i k k k i k c ik k cZ X a N a I Zξ ξ γ γ− < <γγγγ if cX g
ik = .
2) Sample from 2| , , , gg g g g
i ik kZ aξ ξ σ , for i=1,…, Ng, and g=1,…, G.
The full conditional distribution is a product of two normal distributions, and from standard properties it follows that:
2
2 1
2 2 2 2
1 1
/1
| , , , ~ ,( ) ( )
g
g
g g
Kg g gk ik
g g g g ki i K K
g gk k
k k
a ZN
a a
ξ σξ ξ σ
σ σ=
− −
= =
+ + +
Z a .
3) Sample from 2| , , ,k
g g gk k k aa a σ Zξξξξ , g=1,…,G, k=1,…,K.
The prior is ( )2~ ,k
gk k aa N a σ . Therefore, the full posterior is normal, with
( ) ( )
2
2 1
2 22 2
1 1
1| , , , ~ ,
g
k
k g g
k k
Ng g
i ik k ag g g ik k k a N N
g gi a i a
i i
Z aa a N
ξ σσ
ξ σ ξ σ
=
− −
= =
+
+ +
Zξξξξ )0( >g
kaI .
For identification, it is imposed that ∏=
=K
k
gka
1
1
4) Sample from 2| , , , ,k
g g g gk k k ik ika Z Xκσ γ γγ γγ γγ γ , g=1,…,G, k=1,…,K, and c=1,…,C-1.
The full conditional posterior of the threshold parameters is proportional to:
2, , 1
|
( | , , ) ( | , )g gkik ik
g g g g g g gik i k k k kk x k x
i g
P Z a f γγ γ ξ σ−
> >∏ γ γ γγ γ γγ γ γγ γ γ

44
A Metropolis-Hastings algorithm is used to simulate a realization from this posterior distribution. In the m-th iteration of the MCMC chain we draw a candidate ,*g
k from (Fox 2005a):
( ) ( ),* , 1 2 ,* ,* , 1, , , 1 , , 1~ ,g g m g g g m
k c k c MH k c k c k cN Iγ γ σ γ γ γ− −− +< < for c=1,…,C-1,
where 2MHσ is a tuning parameter to adjust the accept/reject rate of the algorithm. The
Metropolis-Hastings acceptance probability is then given by: ,* 2,* , 1 ,* 2
, 1 , 1 2 ,* , 1 2|
( | , )Pr( | , , ) ( | , )min ,1
Pr( | , , ) ( | , ) ( | , )k
k
gg g g g g g m gk kik ik i k k k k MH
g g g g g m g m g g mi g ik ik i k k k k k k MH
fX x a fX x a f f
γ
γ
σξ σξ σ σ
−
− − −
=
= ∏
γ γγ γγ γγ γγ γ γγ γ γγ γ γγ γ γγ γ γ γ γγ γ γ γ γγ γ γ γ γγ γ γ γ γ
The first two parts of this expression represent the contribution from the likelihood, the second
part comes from the proposal distributions. For identification, we set =
=K
k
gk
13 0γ .
5) Sample from 2| ,k
gk k aa a σ , and 2| ,
k
gk k γσ γ γγ γγ γγ γ , for k=1,…,K.
The full conditionals are normal: 2
2
1
1| , ~ , k
k
Gg g
k k kg
NG G
γγ
σσ
=
γ γ γγ γ γγ γ γγ γ γ ,
)0(,1
~,|2
1
2 >
=k
aG
g
gka
gkk aI
Ga
GNaa
σσ .
6) Sample from 2 2| , , | ,k k
g ga k k k ka a γσ σ γ γγ γγ γγ γ for k=1,…,K, and 2 2| , , |g
g g giσ ξ ξ τ ξ .
For each variance parameter an inverse gamma prior is specified with parameters g1 and g2. As a result, each full conditional has an inverse gamma distribution with shape parameter
1/ 2 ,G g+ ( ) 1-1 / 2C G g+ for each of the K items, 1/ 2gN g+ , and 1/ 2G g+ , respectively, and scale parameter
( )2
21
/ 2G
gk k
g
g a a=
+ − , ( )1 2
21 1
/ 2C G
gkc kc
c g
g γ γ−
= =
+ − , ( )2
21
/ 2gN
g gi
i
g ξ ξ=
+ − , ( )2
21
/ 2G
g
g
g ξ=
+
respectively. Noninformative proper priors were specified with 1 2 1g g= = .
7) Sample from 2 2| ,ggξ σ τ for 1, , .g G= The prior is ),(~ 2τξξ Ng , so that
./
1,
/
//~,,| 2222
2|
2
22
++
+−−
τστσ
τξσξστξξ
gggg
gi gg
i
gg
NNN
8) Sample from 2| ,gξ ξ τ . With a noninformative prior, we have
( )2 1 1 2| , ~ ,g gg
N G Gξ ξ τ ξ τ− − .

45
II.9 APPENDIX B: BAYESIAN TESTS
In order to test factor variance invariance, consider G-1 linearly independent contrasts 2 2log logg g Gσ σ∆ = − . Then, the hypothesis 0 = 0 corresponds with equal factor variances across
groups. The density function ( )p x is a monotonic decreasing function of a function 0Q which
is asymptotically distributed as 21, as G gNχ − → ∞ (see Box and Tiao 1973). Hence, for large
samples, the vector 0 = 0 is included in the highest posterior density (HPD) region of 1 α− if and only if:
( ) ( ) 2 00 1lim
1gGN
QP p p P
Aχ −→∞
> = < + x x x <1-α
where:
( )
( )
2 20
1
1 1
1
log log
13 1
G
g gg
G
gg
Q N s s
A N NG
=
− −
=
= − −
= − −
and 2 2 and gs s are the mean sum of squares in group g and the overall mean sum of squares,
respectively. Ng is the sample size in country g, and N = ΣNg. The MCMC algorithm can be used to compute the right-hand side of Equation (10) (see Fox 2005b). It follows that the hypothesis of equal variances across countries is rejected when
2 01 1
1G
QP
Aχ α− < > − +
.
For latent means, we can consider G-1 linear contrasts g G
g ξ ξ∆ = − . Then, it holds that ( )p x
is a monotonic decreasing function of a function 0Q which is asymptotically distributed as F(G-1, N-G) as gN → ∞ . For large samples, the vector 0 = 0 is included in the highest posterior
density (HPD) region of 1 α− if and only if:
( ) ( )2
0 ( 1, ) 2
( )lim
( 1)g
gg
gG N GN
NP p p P F
G s
ξ ξ− −→∞
− > = < −
x x x∆ ∆∆ ∆∆ ∆∆ ∆ <1-α
where 1 g
gg
NN
ξ ξ= . Again the hypothesis of equal means across countries is rejected when
2
( 1, ) 2
( )1
( 1)
gg
gG N G
NP F
G s
ξ ξα− −
− < > − −
.

46
Chapter 3
Using Item Response Theory to Measure Extreme Response Style in Marketing Research: A Global Investigation
Abstract:
Extreme Response Style (ERS) is an important threat to the validity of survey-based marketing research. In this chapter, we present a new, IRT-based model for measuring ERS. This model contributes to the ERS literature in three ways. First, our method improves upon existing procedures by allowing different items to be differentially useful for measuring ERS and by accommodating the possibility that an item’s usefulness may differ across groups (e.g., countries). Second, our method relaxes the requirement that the items in an ERS measure be uncorrelated. This allows marketing researchers to construct an ERS measure based on substantively correlated items and eliminates the need for a dedicated ERS scale. Third, our model integrates an advanced IRT measurement model with a structural hierarchical model for studying antecedents of ERS. We simultaneously estimate a person’s ERS score and individual- and group-level (country) drivers of ERS, thus providing insights into the determinants of this important response style across people and countries. Through simulations we show that the new method improves upon traditional procedures. We further apply our model to a large data set involving 12,500 consumers from 26 countries on 4 continents. The findings show that our model extensions are necessary to adequately model the data. Finally, we report substantive results about the effects of socio-demographic and national-cultural variables on ERS. This chapter is based upon Martijn G. de Jong, Jan-Benedict E.M. Steenkamp, Jean-Paul Fox and Hans Baumgartner (2007), “Using Item Response Theory to Measure Extreme Response Style in Marketing Research: A Global Investigation,” Journal of Marketing Research, forthcoming. We thank AiMark for the providing the data, the three editors, and anonymous reviewers for valuable comments.

47
III.1 INTRODUCTION
Valid measurement is a cornerstone of marketing as a science. Although the measurement of
marketing constructs has greatly improved in recent years, systematic error is often neglected.
However, it is well-known that responses to questionnaires are often influenced by content-
irrelevant factors called response styles (Baumgartner and Steenkamp 2001). A response style
can be defined as a tendency to respond systematically to questionnaire items on some basis other
than what the items were specifically designed to measure (Paulhus 1991).
In this chapter, we focus on Extreme Response Style (ERS), one of the most pervasive and
frequently studied response styles in the social sciences (see, e.g., Baumgartner and Steenkamp
2001; Greenleaf 1992b; Johnson 2003; Paulhus 1991). ERS is the tendency of respondents to
favor or avoid using the endpoints of a rating scale, relatively independently of specific item
content. Although the literature on ERS is extensive, the phenomenon has received relatively
little attention in marketing journals (see Greenleaf (1992a) and Baumgartner and Steenkamp
(2001) for two exceptions). This is surprising since ERS has biasing effects on both the mean
level of responses and the correlation between marketing constructs (Baumgartner and
Steenkamp 2001; Greenleaf 1992a; Rossi, Gilula, and Allenby 2001). Furthermore, in cross-
national marketing research, country-specific variations in ERS may easily be misinterpreted as
substantive differences in the marketing constructs examined, which could have adverse effects
on the decisions made by international marketers (Kumar 2000). Thus, ERS is an important threat
to the validity of both domestic and cross-national survey-based marketing research.
The present research contributes to the ERS literature in three ways. First, we propose a new,
item response theory (IRT)-based method for measuring ERS. This method improves upon
existing procedures (Greenleaf 1992b; Baumgartner and Steenkamp 2001) by allowing different
items to be differentially useful for measuring ERS and by accommodating the possibility that an
item’s usefulness may differ across groups (e.g., countries).
Second, our method relaxes the requirement that the items in an ERS measure should be
(marginally) uncorrelated (Greenleaf 1992b). This allows marketing researchers to construct an
ERS measure based on substantively correlated items and eliminates the need for a dedicated
ERS scale. Through simulations we show that the new method improves upon traditional
procedures, and a detailed analysis of a large-scale data set indicates that the modifications are
necessary to adequately model the data.

48
Third, our model integrates the advanced IRT measurement model with a structural
hierarchical model for studying the antecedents of ERS. We simultaneously estimate a person’s
ERS score and individual- and group-level (country) drivers of ERS, thus providing insights into
the determinants of this important response style across people and countries. Specifically, we
study both socio-demographic and national-cultural determinants of ERS using a dataset
involving 12,500 consumers from 26 countries in 4 continents.
III.2 MEASURING ERS
The observed score on any marketing scale X can be partitioned into three components:
Xi = Ti +Si +Ei (1)
where Ti is the latent true score of respondent i, Si is systematic error, and Ei is random error. One
of the most important causes of systematic error is ERS (Greenleaf 1992b). In order to purge ERS
from construct measurements, marketing researchers have proposed partialing systematic
influences due to ERS from scale scores, using a three-step procedure: (1) construct an estimate
of a person’s ERS score based on a set of items; (2) regress observed scores for other scales on
ERS; and (3) use the purified scale scores in further analyses (Baumgartner and Steenkamp 2001;
Podsakoff et al. 2003).
An estimate of a person’s latent ERS score is typically constructed by summing the number
of extreme responses that a respondent endorses across a set of items (Steenkamp and
Baumgartner 2001). For example, with a 5-point Likert scale an ERS measure corresponds to the
number of questionnaire statements with which a respondent ‘strongly agrees’ or ‘strongly
disagrees’ (Greenleaf 1992b). We can display this as:
= =
=∨=
∧==
K
k
K
kikQQi EXTRIERS
ikik1 1
51 (2)
where EXTRik= 51 =∨= ikik QQI is an indicator variable that takes on the value 1 when an extreme
response option is used by respondent i on the Likert scale for question k (Qik) and 0 otherwise,
iERS∧
represents an estimate of the person’s latent ERS score, and K equals the number of items.
Equation (2) specifies that at the observed level of individual items, ERS is measured on a
dichotomous scale. We will retain this basic operationalization of ERS measurement in our
proposed IRT-based model because of the following reasons. First, this specification is
commonly used in the marketing literature and in other social sciences (Bachman and O’Malley
1984; Baumgartner and Steenkamp 2001; Chen et al. 1995; Greenleaf 1992b; Grim and Church

49
1999; Hui and Triandis 1989; Johnson et al. 2005; Marín et al. 1992). Second, it is an obvious
and intuitive operationalization of extreme responding for the 5- or 7-point scales most
commonly used in marketing survey research (cf. Bearden and Netemeyer 1999). In fact, scaling
experts sometimes operationally define ERS in this way. For example, Paulhus (1991, p. 49)
says that ERS is the “tendency to use the extreme choices on a rating scale (e.g., 1s and 7s on a
seven-point scale).” Third, the dichotomization minimizes confounding ERS with acquiescence
responding (ARS). ARS is often operationalized as follows:
=
==
∧+×=
K
kQQi
ikikIIARS
145 )2( (3)
As disacquiescence is much less common than acquiescence (Baumgartner and Steenkamp
2001), this implies that an absolute deviation measure of ERS (e.g., by coding a response of 2 or
4 on a 5-point scale as 1, and a response of 1 or 5 as 2) will overlap substantially with ARS. This
will be much less the case for a dichotomous ERS measure. In fact, this is a major reason why
researchers have used the dichotomous measure.
Limitations of traditional approaches to ERS measurement8
Two approaches for measuring ERS can be distinguished, based on which items are included
in equation (2): (1) the use of dedicated ERS instruments, and (2) the use of ad hoc measures of
ERS based on items intended to assess substantive constructs.
Dedicated ERS instruments. Survey researchers sometimes use a separate set of items that
were specifically designed to measure ERS. Although seemingly attractive at first sight, this
approach has some significant disadvantages. First, few dedicated ERS scales exist (Greenleaf
1992b is a notable exception). Second, adding non-substantive items to a survey is costly, both in
terms of money and respondent fatigue. It is often difficult to get marketers to pay for additional
survey items that will be used solely for estimating stylistic responding. Using items that are
already included in the survey can lower the cost and time involved. Third, if the ERS properties
of dedicated ERS scale items vary across subgroups (which will probably be the norm), it may be
futile for researchers to try to assemble a set of items that will work equally well across cultural
and linguistic subgroups. This issue is particularly problematic in international marketing
research. Fourth, using proven items from existing substantive scales is advantageous in cross-
8 We thank an anonymous reviewer for suggesting a number of arguments in this section.

50
linguistic research because these are exactly the kinds of items that have been thoroughly tested
in many languages, using procedures such as back-translation.
Ad hoc ERS items based on substantive scales. For all these reasons, it is common to use
items that were originally designed to measure substantive constructs as indicators of ERS (e.g.,
Baumgartner and Steenkamp 2001; Greenleaf 1992a; Van Herk, Poortinga, and Verhallen 2004).
If such ad hoc ERS scales are used to partial stylistic variance from substantive scales, it is
critical that there is no item overlap between the ERS measure and the substantive scales that are
to be purged of systematic error variance (Baumgartner and Steenkamp 2001).
However, even if item overlap is avoided, the traditional method still has serious limitations.
First, as noted by Greenleaf (1992b), items in an ERS measure should have low average inter-
item correlations for substantive reasons (in order to avoid confounding of style and content).
However, when ad hoc measures of ERS are constructed based on substantive scales, items from
the same scale will be correlated and in fact should be correlated (Bearden and Netemeyer 1999).
The traditional ERS formula (2) ignores this dependence structure.
Second, ERS is best understood as an interaction of personal dispositions and item
characteristics (Podsakoff et al. 2003). Respondents differ in their tendency to go to the extremes
of the rating scale, and items elicit ERS to differing degrees. Equation (2) does not allow for this,
as it does not separate item and person effects and assigns equal weights to all items.
Third, the usefulness of an item for measuring ERS may vary across countries/linguistic
subgroups. Cross-national differences in the ERS properties of items may arise because of
differences in item semantics and cultural meaning (Podsakoff et al. 2003). Proportions of
extreme responses are likely to differ across nations/subgroups, and ERS measures based on
different items would be incomparable across countries.
Finally, when survey researchers want to examine individual and national drivers of ERS, it is
important to integrate the measurement model for ERS with a structural hierarchical latent
variable model and estimate all parameters simultaneously, in order to avoid bias in parameter
estimates (Ansari, Jedidi, and Jagpal 2000; Fox and Glas 2001).9
What is needed is a model that adjusts for differences in item characteristics across items and
subgroups, accounts for substantive correlations among items from the same scale, and allows the
9 Note that these last three limitations also hold for the dedicated ERS measure.

51
researcher to simultaneously study the antecedents of ERS. Such a model is proposed in the next
section.
III.3 MEASURING ERS USING IRT
The basic IRT model
To address the limitations of the existing operationalization of ERS, we propose to use a
binary item response theory (IRT) measurement model (Lord and Novick 1968). Binary IRT
models are a powerful approach for relating multiple dichotomous observed variables to an
underlying continuous latent trait (Lord and Novick 1968; Hambleton and Swaminathan 1985).
We assume that a continuous, stable latent ERS trait underlies a person’s observed extreme
response pattern (Baumgartner and Steenkamp 2001; Greenleaf 1992b), that is, the dichotomous
pattern of zeros and ones contained in EXTRi=(EXTRi1,…, EXTRiK)'. We follow previous
research in assuming that the observed indicators of ERS are measured on a dichotomous scale
because the reasons supporting this practice in the context of the traditional ERS measurement
apply equally well to the IRT model.10 However, we adopt a radically different approach for
modeling the relationship between the latent ERS construct and its observed indicators.
IRT models have a cross-classified character with separate item and person characteristics.
This makes IRT very suited to separating the influence of items (how easily does item k elicit
ERS) and persons (what is the latent ERS score of person i) with respect to an observed extreme
response EXTRik. Note that, except for Greenleaf (1992b), researchers have typically assumed
that each item is equally useful for measuring ERS. However, it is likely that items differ in their
tendency to elicit extreme responses (Bradlow and Zaslavsky 1999; Podsakoff et al. 2003).
One of the most frequently used IRT models is the two-parameter normal ogive model (Lord
and Novick 1968). For this model, the probability of an extreme response for respondent i on
Likert item k (i.e., ‘strongly disagree’ or ‘strongly agree’ so that EXTRik=1) is driven by the
respondent’s latent ERS value, random error, and item characteristics (such as specific item
content and semantics). Mathematically, the two-parameter normal ogive is formulated as:
))((),,|1(P kikkkiik bERSabaERSEXTR −Φ== (4)
10 Although for ordinal data, a graded response IRT model (Samejima 1969) is a higher information method of measuring item characteristics, a graded IRT model is not suited to measure ERS. This is because the latent trait in the graded IRT model would capture a general method factor (cf. Podsakoff et al. 2003), rather than ERS. The threshold parameters in a graded IRT model would not reflect item’s ERS properties.

52
where ak is the discrimination parameter for item k, bk is the “difficulty” or threshold parameter
for item k, and Φ(.) is the standard normal cumulative distribution function. The function
Φ(ak(ERSi - bk)) is known as the item characteristic curve (ICC).
The difficulty parameter bk, which is measured on the same scale as ERSi, indicates how
likely it is that an item k will elicit an extreme response. Items with a very negative bk parameter
elicit an extreme response very easily, while items with a very positive bk parameter do not
readily evoke an extreme response. Technically, bk is defined such that a respondent i with ERSi
= bk has a probability 0.5 of making an extreme response on item k.
The discrimination parameter ak determines whether an item discriminates well between
people high and low on ERS. It is conceptually similar to a factor loading in confirmatory factor
analysis, as it represents the relationship between the latent ERS score and observed item
responses. Items with an ak value close to zero are not useful for measuring ERS. Note that ak
assesses an item’s effectiveness as an indicator of ERS, not its substantive validity. For a high
value of ak, an extreme response provides strong evidence that the ERSi value is above bk.
New IRT model for measuring ERS
The standard IRT model in equation (4) addresses one of the limitations of the traditional
measure of ERS by clearly separating item (ak, bk) and person (ERSi) effects and allowing items
to be differentially useful for measuring ERS (i.e., some items discriminate better between people
relatively low and high on ERS, and discrimination depends on the item’s difficulty). However,
the model does not address the remaining three limitations of the traditional ERS measure. We
therefore extend the standard IRT model and include three novel features in our approach. First,
we adapt testlet IRT models, which were originally developed by Bradlow and colleagues (e.g.,
Bradlow, Wainer, and Wang 1999) for a different purpose, to accommodate substantive
correlations among blocks of items that measure the same underlying substantive construct.
Second, we allow for non-invariant ERS properties across groups of respondents such as
different countries, by using a varying item parameter model (i.e., item parameter values for each
item are allowed to differ across countries). This provides a unique contribution to multigroup
IRT research. To date, all cross-group IRT models have required measurement-invariant anchor
items to make the scale of the latent variable common across groups (e.g., Holland and Wainer
1993; May 2005; Reise et al. 1993). In other words, the item parameters need to be the same in
all countries for these anchor items in order to identify the model. Apart from the difficulties of

53
testing for invariance, there may not be invariant items when many groups are considered. In
such cases, existing multigroup IRT models cannot be applied. In our model, there is no longer a
need to classify items as invariant or noninvariant.
Finally, we integrate the advanced IRT measurement model with a structural multilevel
model, which allows us to study the antecedents of ERS. Previously, researchers have only
considered structural multilevel models in connection with the basic IRT model assuming
invariant item parameters across groups (Fox and Glas 2001). We extend the basic measurement
model using testlets and varying item parameters, and subsequently integrate this model with a
structural multilevel model for ERS.
Testlet structures
Conditional independence is an important assumption in IRT models. It means that for a
given respondent, there is no relationship between the respondent’s extreme responses to any pair
of Likert items given the latent ERS score. When the ERS measure contains blocks of items that
are correlated for substantive reasons (because they measure the same substantive construct), the
estimates of the latent ERS score and item parameters will be biased due to the dependence
structure between items from the same multi-item scale.
We draw on the educational measurement literature and extend the basic IRT model by
incorporating “testlet” effects (Bradlow, Wainer, and Wang 1999). In a series of papers, Bradlow
and his colleagues have shown the biasing effects of testlet structures on IRT person and item
parameters (Bradlow, Wainer, and Wang 1999; Wang, Bradlow, and Wainer 2002; Wainer,
Bradlow, and Du 2000). In the present context, each testlet is a multi-item scale, and there are as
many testlets as there are multi-item scales. The common content among the items in the multi-
item scale is due to the fact that the items measure the same latent marketing construct.
Mathematically, the normal ogive model (4) is adapted as follows:
))((),,,|1(P ,, kriikkkriiik bERSabaERSEXTRkk
−−Φ== ψψ (5)
where rk indicates the testlet of item k. We assume that there are R testlets in total so that rk∈1,
2,…, r,…,R, and that testlet r contains Nr items. In equation (5), kri ,ψ is a person-specific testlet
effect, which is independent of ERSi and the item parameters. It is formulated as a deviation from
a person’s average ERS value. The parameter kri ,ψ allows respondents to have a higher ( 0, <
kriψ )
or lower ( 0, >kriψ ) probability of giving an extreme response to item k due to the particular

54
testlet rk (i.e., depending on which substantive construct the item measures). Following Wang,
Bradlow, and Wainer (2002), we assume the prior specification ),0(~ 2,
krkNri ψσψ . That is, we
allow for testlet-specific variance parameters.
Cross-nationally varying item parameters
Measuring ERS in different countries (or different linguistic subgroups) poses additional
difficulties, as the item parameters are likely to be non-invariant across countries. The model
needs to be able to adjust item characteristics for each item across countries. To accommodate
this, we extend recent psychometric models and propose a random-effects ANOVA structure for
the item parameters. Indexing country by j, j=1,…,J, we use an independent prior specification
for akj and bkj, that is, ),~(~ 2akkj aNa σ , ),
~(~ 2
bkkj bNb σ , and a multivariate prior for ka~ and kb~ :
)~(),(,~~~~
~2~~~
~~2~
~
~AaINN
b
ak
bba
baa
b
a
k
kk ∈Σ=
= ξµ
σσσσ
µµ
ξ (6)
with A being a bounded interval in ℜ+, I(.) an indicator function, 0,0)log( ~~ ==ba µµ ,
),(~ 0 SnWInv −Σ , n0=2, and S=diag(100,100). In other words, the discrimination and difficulty
parameters in a particular country j are draws from independent normal distributions with means
of ka~ , and kb~ , and the discrimination parameter should be positive. At level 2, we allow these
parameters to be correlated with covariance ba~~σ . The prior for the variance-covariance matrix is
assumed to be a noninformative Inverse-Wishart distribution. Random-effects specifications for
item parameters were previously considered by Janssen et al. (2000), although in their article the
grouping was based on items, rather than on countries as in our setting. Also, independent rather
than multivariate priors were used. We combine the random-effects specifications for item
parameters with a random-effects structure for ERS (cf. Fox and Glas 2001).
Summarizing, the IRT measurement model for ERS is given by:
))((),,,|1( ,, kjrijijkjkjkjrijijijk bERSabaERSEXTRPkk
−−Φ== ψψ (7)
),~(~ 2akkj aNa σ (8)
),~
(~ 2bkkj bNb σ (9)
)~(),(~~]~,~[ ~ AaINba kkT
kk ∈Σ= ξµξ (10)
),0(~ 2,
krkNrij ψσψ (11)
),(~ 20 σβ jij NERS (12)

55
),(~ 000 TNj γβ (13) where ERSij denotes the latent ERS score for respondent i in country j (i =1,…, nj, j=1,…, J).
The random-effects specifications for ERS and the item parameters yield an identification
problem. Restrictions are necessary that fix the mean and variance of the ERS scale in each
country. Each latent ERS country mean can be shifted by changing β0j, as well as by uniformly
shifting the country-specific difficulty values bkj. To solve this problem, the latent ERS mean of
country j is fixed by restricting the country-specific difficulty parameters in such a way that a
common shift of country-specific difficulty values is not possible. This can be done by setting
0kjk
b = ∀j (Albert 1992). Since this restriction is applied in each country, the mean of the
metric of the latent variable is identified via restrictions on the country-specific difficulty
parameters. Analogously, the country variances can be shifted by uniform changes in the
discrimination parameters. To fix the country variances, we need to impose a restriction such that
a common shift of the country-specific discrimination parameters is not possible, which can be
done by specifying that, across items, the product of the discrimination parameters equals one in
each country j ( 1kjk
a =∏ ∀j; see Albert 1992). 11 Hence, the mean and variance of the latent ERS
variable in each country is fixed, and the scale remains common due to the simultaneous
calibration of the multilevel structures for item parameters and the latent variable. The model
allows respondents to be calibrated on the same latent ERS scale even when all items display
differential item functioning across groups.
The hierarchical Bayesian framework allows for borrowing of strength across countries.
Previous multigroup IRT research models country means and variances, as well as item
parameters, as separate parameters, without borrowing strength across countries. By borrowing
strength, we can place less restrictive assumptions on measurement invariance, while retaining
the possibility to let the various parameters fluctuate across countries.
Structural multilevel latent variable model
Apart from considering the ERS value as a bias estimate, survey researchers are also
interested in understanding what drives the variation in ERS across individuals and nations (e.g.,
Baumgartner and Steenkamp 2001; Greenleaf 1992a, 1992b; Rossi, Gilula and Allenby 2001). To
11 The estimated a parameters have a product of one because they affect the probability of extreme responding in a multiplicative way, while the estimated b parameters sum to zero because their effect is additive (see equation (4)).

56
examine individual and national drivers of ERS, the multilevel model of ERS with testlets can be
further extended. We specify:
ijQijQjijjjij XXERS ηβββ ++++= 110 (14)
qjSqjqSqjqqqj uWW ++++= γγγβ 110 (15)
where X1ij to XQij are individual-level covariates, W1qj to WSqj are country-level variables, and ηij
and uj are level 1 and level 2 error terms, respectively, with ηij ~ N(0,σ2) and uj=(u0j, …, uQj)' ~
NQ+1(0, T). Note that the ERSij term is unobserved and estimated by the IRT model.
Estimation
Equations (7) to (11), (14), and (15) combined yield a complex multilevel IRT structure.
MCMC methods are used to simultaneously estimate all parameters, avoiding the evaluation of
high-dimensional integrals. The MCMC algorithm uses data augmentation in order to draw
samples from the conditional distributions of the parameters (Tanner and Wong 1987). The full
conditionals of all parameters can be specified in closed form, and a Gibbs sampler is used to
estimate the parameters. Each iteration of the Gibbs sampler consists of sequentially sampling
from the full conditional distributions associated with the unknown parameters. See the appendix
for more details.
III.4 SIMULATION STUDY
Purpose
In the simulation study, we compare the performance of our proposed IRT model to the
traditional ERS operationalization. We evaluate the traditional model given by equation (2) and
our IRT model with regard to their ability to recover true latent ERS values, when there are (a)
substantively correlated blocks of items and (b) within- and across-country differential item
functioning (DIF). In addition, we investigate whether the item parameters of the IRT model can
be recovered accurately and whether our IRT model is prone to indicate spurious differences
between items and countries when none is present.
Design
It is assumed that there are 20 countries, with 300 respondents per country. Fifty items are
used to construct the ERS measure, based on five 10-item “substantive” scales. Thus, there are
five testlets. We consider three different testlet specifications and two specifications about
differential item functioning (DIF) for a total of 6 different conditions.

57
Respondent-specific testlet parameters were chosen so as to reflect either no, moderately
strong, or relatively strong dependencies between the items within a testlet (i.e.,
)5.0,0(~);25.0,0(~;0 ,,, NN rijrijrij ψψψ = − in combination with ERSij~N(0,1)).
For the item parameters, we consider two specifications. As a baseline model, we assume no
DIF, that is, identical item parameters across items and countries (akj=1, bkj=0 ∀k, j). This
specification is useful for investigating whether the IRT model might spuriously indicate
variation in item parameters across countries when there is actually no variation. The alternative
model allows for DIF, that is, different item parameters within and across countries:
)3.0,~
(~),2.0,~(~ 22kkjkkj bNbaNa , ),1.0,1(~~ 2Nak )1.0,5.0(~
~ 2Nbk . These values reflect
realistic heterogeneity in item functioning as will be shown in our illustration using real data.
Observed, binary extreme response patterns EXTR are generated from our parameter
specifications. We use a root mean squared error (RMSE) loss function as our measure of
accuracy, in which the deviation between the true and estimated latent ERS score is squared and
summed across individuals. To compare the IRT model and the traditional ERS
operationalization, we scale the observed sum score variable so that it has the same mean and
variance as the estimated ERS scores from the IRT model.12 As a result, we can compare the
parameter estimates of the IRT model and the model based on (2).
Results
For estimation of the parameters of interest, 30,000 iterations from the Gibbs sampler were
used, after discarding the first 10,000 iterations. The RMSE values for the traditional
operationalization of ERS and for the IRT model are shown in Table 1.
12 According to Lord (1980), the IRT latent score and the true score are “the same thing expressed on different scales of measurement” (p. 46).

58
Table 1 RECOVERY OF TRUE ERS VALUES
No testlet dependence Moderately strong testlet dependence
Stronger testlet dependence
No DIF Traditional method: RMSE=29.0
IRT method: RMSE=21.1
Traditional method: RMSE=34.9
IRT method: RMSE=22.8
Traditional method: RMSE=38.5
IRT method: RMSE=24.3
DIF
Traditional method:
RMSE=35.0
IRT method: RMSE=25.1
Traditional method:
RMSE=37.7
IRT method: RMSE=26.0
Traditional method:
RMSE=40.5
IRT method: RMSE=26.6
The message from Table 1 is clear: As the dependencies among the items from the same scale
get stronger and DIF increases, the performance of the traditional model deteriorates
significantly. In contrast, the latent ERS scores can be recovered much more accurately under the
IRT model. As may be expected, RMSE increases somewhat when model complexity increases
(i.e., when testlets and DIF are present), but the IRT model generally performs well and
outperforms the traditional model in each condition.
Furthermore, the simulation shows that the item parameters of the IRT model are estimated
accurately in every condition (they are not shown because there are no equivalent parameters for
the traditional ERS measure). The correlation between the estimated and true IRT discrimination
parameters is 0.97 (p<0.01), and the corresponding correlation for the difficulty parameter is 0.99
(p<0.01). Finally, there is not much variation in the item parameter estimates across countries
when there is no true variation across countries (i.e., akj=1 and bkj=0 ∀kj). Within and across-
country averages for the discrimination parameters vary between 0.97 and 1.04, while for the
difficulty parameters, the averages vary between –0.04 and 0.05. Thus, the complex IRT model is
not prone to indicate spurious differences between items and countries.
III.5 EMPIRICAL APPLICATION
In this section we present an empirical application to illustrate the IRT model. We estimate the
model in a cross-national setting, assess the necessity of allowing for differential item functioning
and testlet effects, conduct item parameter validation tests, and investigate individual and cultural
drivers of ERS.

59
The data collection was part of a large multi-national study. Two global marketing research
agencies, GfK and Taylor Nelson Sofres, collected the data in 26 countries on four continents
(see Table 4 for the countries). The sample in each country was drawn so as to be broadly
representative of the total population in terms of region, age, education, and gender. For countries
with high Internet penetration, a Web survey was used. In countries with low Internet penetration,
data were collected by mall intercepts in multiple regions/locations. The number of respondents
per country varies between 355 (U.K.) and 640 (Germany). Given the importance of the U.S., the
marketing research agencies wanted to have a larger sample for that country (1,181 respondents).
The total number of respondents is 12,506.
The questionnaire was developed in English and then translated into all local languages by
professional agencies, using back-translation. To assess ERS, we used a heterogeneous set of 19
multi-item scales as well as 2 single items. The total number of items was 100. For all constructs,
5-point Likert items were used, and the items for each construct were randomly dispersed
throughout the questionnaire.13 Information was collected on age (measured in years), gender (1
for women, 0 for men), and education. In the analyses, a within-country median split for
education was used.
III.6 RESULTS
Model selection
Based on equations (7) to (13), which summarize the full testlet multilevel IRT specification
with cross-nationally varying item parameters, we calibrate four nested IRT models.14 The first
model (M1) has cross-nationally invariant item parameters and no testlet structure (i.e., akj=ak and
bkj=bk , ∀j, and ψij,r=0, ∀ij, r). The second model (M2) has item parameters that vary across
countries and no testlet structure. In other words, equations (8)-(10) are specified for the item
parameters, but ψij,r=0, ∀ij, r. The third model (M3) has cross-nationally invariant item
parameters and a testlet structure (i.e., akj=ak and bkj=bk, ∀j, and equation (11) for the testlets).
13 There is a debate in the literature on whether items pertaining to the same construct should be randomized in the questionnaire or grouped together (Bradlow and Fitzsimons 2001). The idea behind randomization is to hide the purpose of the instrument from the respondent, thus reducing response biases such as the desire to look good to others (e.g., evaluation apprehension) or to oneself (e.g., cognitive consistency and ego defense mechanisms). However, randomization may also reduce reliability (Bradlow and Fitzsimons 2001). 14 Prior to conducting these analyses, we estimated a model with a dummy variable Vj in equation (13), i.e. β0j ~ N(γ00+γ01Vj, T) , where Vj indicates whether the survey in a given country was a hard-copy (Vj=1) or internet version (Vj=0). The parameter γ01 was not significantly related to ERS in any hierarchical model.

60
Finally, the fourth model (M4) has both cross-nationally varying item parameters (i.e., equations
(8)-(10) for the item parameters and equation (11) for the testlet structure).
To assess which model provides the best fit, we compute the marginal log-likelihood value
via importance sampling (Newton and Raftery 1994), log p(EXTR), for each ERS measurement
model, where EXTR contains the binary coded extreme responses for all items and all
respondents. Based on the marginal log-likelihood value, the Bayes factor BF21 for different
models M2 and M1 can be computed as exp[log p(EXTR | M2) - log p(EXTR | M1)]. Large values
for BF21 provide evidence in favor of model M2. We present the marginal log-likelihoods and the
Bayes factors of the model with testlets and varying item parameters versus the other models in
Table 2. It is apparent that incorporating the testlet structure and allowing the IRT item
parameters to vary across countries both lead to a substantial improvement in model fit.
Table 2 MARGINAL LOG-LIKELIHOOD VALUES AND BAYES FACTORS
FOR DIFFERENT IRT MODELS Model Marginal LL Bayes Factor
M1: Invariant item parameters and no testlets -461,384 BF41=Exp(40,859) M2: Varying item parameters and no testlets -449,088 BF42=Exp(28,563) M3: Invariant item parameters and testlets -432,861 BF43=Exp(12,336) M4: Varying item parameters and testlets -420,525 -
Item parameter variation
The standard ERS measure assumes that each item contributes equally to the overall ERS
score, that is, that each item provides an equally good “test” for the ERS value. Both within and
across countries, items should function the same. However, this assumption is seriously violated.
For illustrative purposes, we plot the average posterior estimated values of the discrimination and
difficulty parameters (i.e., akj and bkj) for all items in China, Germany, and the U.S. in Figure 1.
There is considerable variation in both discrimination and difficulty across items, and these
results are also obtained for other countries. The notion that items differ in their sensitivity to
ERS is a general phenomenon, not restricted to specific cultures only.
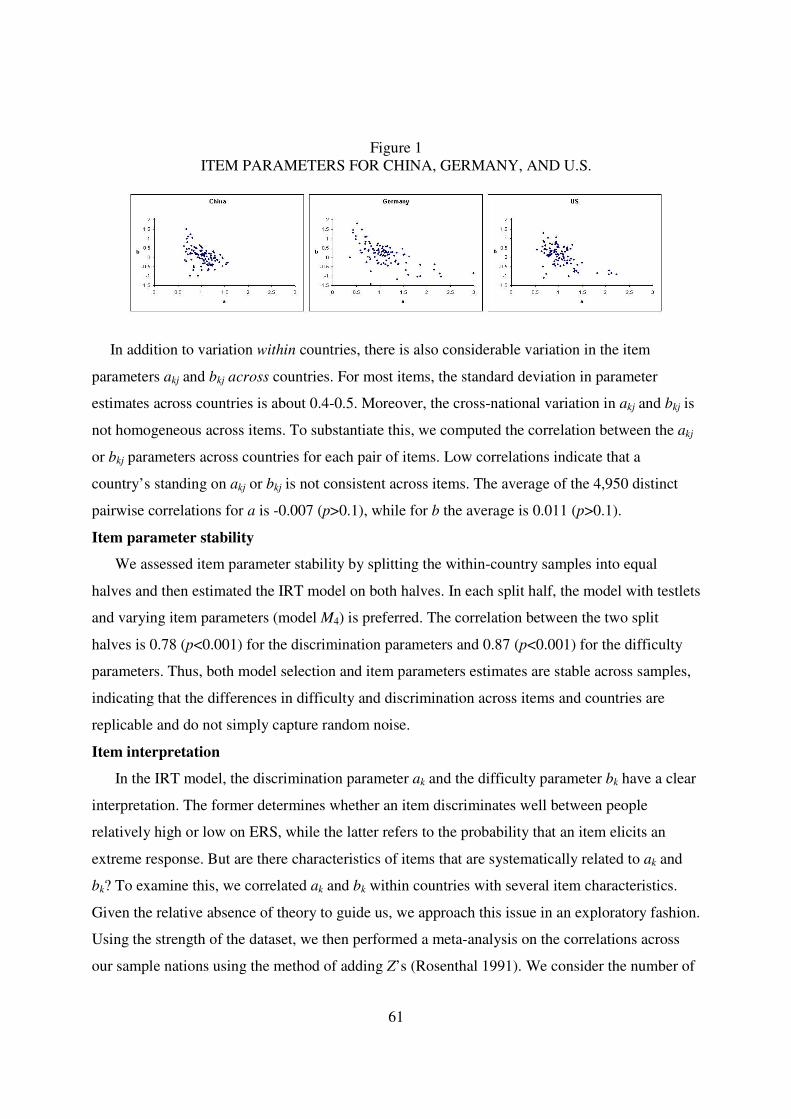
61
Figure 1 ITEM PARAMETERS FOR CHINA, GERMANY, AND U.S.
In addition to variation within countries, there is also considerable variation in the item
parameters akj and bkj across countries. For most items, the standard deviation in parameter
estimates across countries is about 0.4-0.5. Moreover, the cross-national variation in akj and bkj is
not homogeneous across items. To substantiate this, we computed the correlation between the akj
or bkj parameters across countries for each pair of items. Low correlations indicate that a
country’s standing on akj or bkj is not consistent across items. The average of the 4,950 distinct
pairwise correlations for a is -0.007 (p>0.1), while for b the average is 0.011 (p>0.1).
Item parameter stability
We assessed item parameter stability by splitting the within-country samples into equal
halves and then estimated the IRT model on both halves. In each split half, the model with testlets
and varying item parameters (model M4) is preferred. The correlation between the two split
halves is 0.78 (p<0.001) for the discrimination parameters and 0.87 (p<0.001) for the difficulty
parameters. Thus, both model selection and item parameters estimates are stable across samples,
indicating that the differences in difficulty and discrimination across items and countries are
replicable and do not simply capture random noise.
Item interpretation
In the IRT model, the discrimination parameter ak and the difficulty parameter bk have a clear
interpretation. The former determines whether an item discriminates well between people
relatively high or low on ERS, while the latter refers to the probability that an item elicits an
extreme response. But are there characteristics of items that are systematically related to ak and
bk? To examine this, we correlated ak and bk within countries with several item characteristics.
Given the relative absence of theory to guide us, we approach this issue in an exploratory fashion.
Using the strength of the dataset, we then performed a meta-analysis on the correlations across
our sample nations using the method of adding Z’s (Rosenthal 1991). We consider the number of

62
words in an item (Wang, Bradlow, and Wainer 2004), the number of characters in the item (we
excluded the Asian languages because sentence structures are different), the way the item is
worded, either positively or negatively (Wong, Rindfleisch, and Burroughs 2003), and an item’s
deviation from the midpoint of the scale (Baumgartner and Steenkamp 2001).
We find that the difficulty parameter is negatively correlated with the item’s absolute
deviation from the midpoint (r = -0.730, p<0.001). This result has face validity because when the
absolute deviation from the scale midpoint is large, the item has elicited many extreme responses
so that the difficulty parameter should be negative. More words (r = -0.276, p<0.001) and more
characters (r = -0.295, p<0.001) are also negatively associated with the difficulty parameter.
We further find that items that discriminate better between people who are relatively high or
low on ERS deviate more strongly from the midpoint of the scale (r = 0.180, p<0.001), are longer
(r = 0.436, p<0.001), contain more characters (r = 0.441, p<0.001) and are worded positively (r =
-0.117, p<0.001).
III.7 DRIVERS OF ERS
Socio-demographic variables
Previous research has investigated whether extreme responding is related to characteristics of
individuals. The socio-demographic variables age, gender, and education have attracted the most
attention (Greenleaf 1992a; 1992b; Marín, Gamba and Marín 1992). We also include these three
socio-demographics in our model. The results of prior research have not been very consistent and
we use the improved measurement of ERS and the large multi-national data set to investigate
whether the socio-demographic variables studied are reliably related to ERS.
Cultural drivers of ERS
ERS may not only differ systematically between individuals, but also between countries
(Baumgartner and Steenkamp 2001; Chen, Lee and Stevenson 1995; Grimm and Church 1999;
Johnson et al. 2005). There is clear evidence of variation in ERS scores across countries in our
study as shown in Table 3, which reports the average ERS value in each country as a deviation
from the grand ERS mean. What gives rise to these cross-national differences? We propose that a
country’s culture is a major driver of country differences in ERS.

63
Table 3 MEAN ERS SCORE FOR SAMPLE COUNTRIES
Thailand -0.759 Slovakia -0.113 Germany 0.148 Taiwan -0.656 Poland -0.105 Italy 0.172 China -0.393 US -0.061 Austria 0.183
Czech Republic -0.214 Denmark 0.064 Belgium 0.192 Brazil -0.178 Hungary 0.075 France 0.217
UK -0.147 Norway 0.076 Romania 0.315 Japan -0.125 Portugal 0.121 Argentina 0.343
Ireland -0.123 Switzerland 0.141 Russia 0.758 Netherlands -0.117 Spain 0.146
To investigate the effect of culture on ERS, we employ Hofstede’s (2001) framework of
cultural dimensions. Desire for uniqueness and independence are core elements of cultural
individualism (Oyserman, Coon, and Kemmelmeier 2002). In individualistic societies, a person’s
attitudes are regulated largely by individual preferences, and the expression of unique opinions is
valued (Chen et al. 1995). An individual’s identity is clearly distinct from that of other people
(Hofstede 2001). In contrast, in collectivistic societies attitudes are relatively more heavily
influenced by society’s preferences. These cultures are characterized by an interdependent self-
concept and encourage modesty and harmony (Triandis 1989). We therefore expect a positive
relationship between a country’s degree of individualism and ERS.
At the individual level, studies in psychology have repeatedly shown that extreme responding
is positively related to intolerance of ambiguity, rigidity and need for certainty (see Baumgartner
and Steenkamp 2001 for a review). Hofstede (2001) argues that differences in intolerance of
ambiguity are also a cultural characteristic (termed uncertainty avoidance). Uncertainty
avoidance measures the degree to which societies are made nervous and feel threatened by
uncertain, risky, ambiguous, or undefined situations. To avoid such situations, they tend to adopt
rigid attitudes and rules. Thus, we expect a positive relationship between uncertainty avoidance
and ERS.
Cultural masculinity/femininity is defined as the degree to which a society is characterized by
assertiveness versus nurturance (Hofstede 2001). Masculine societies place great emphasis on
achievement and ambition, and encourage assertiveness and decisive/daring behavior, which
should lead to a tendency to select the strongest available choices on Likert rating scales.
Feminine societies value social harmony, gentleness, and modesty, which implies that ERS
should be less common.
64
For completeness, we also include power distance in the model, although we do not have
strong a priori expectations concerning its effect on ERS. Johnson et al. (2005) theorized that it is
positively related to ERS, as high power distance societies demand decisiveness and definiteness
in communications by superiors, while subordinates should respond modestly, if not
deferentially. But this implies that the effect depends on a person’s position in the social
hierarchy, and hence, in general a null effect seems more likely.
In sum, we hypothesize that ERS will be higher in countries whose culture is characterized by
higher levels of individualism, uncertainty avoidance, and masculinity. No relationship is
predicted for power distance.
Results
In the simultaneous estimation of the measurement (equations 7 to 11) and structural
model (equations 14 and 15), we first considered the necessity of including random coefficients
for the level-1 predictors. Raudenbush and Bryk (2002) recommend constraining slope
coefficients that do not display random variation across countries to be fixed for increased
parameter stability and efficiency. We found significant variation across countries for gender and
education, but not for age. Hence, we constrained the coefficients for age to be fixed while the
slopes for the other two variables were specified as random. The results for this model are given
in Table 4.
The socio-demographic variables explain about 2 percent of the level-1 variance. Women
tend to score higher on ERS than men (γ03=0.0324), and both younger and older individuals are
more prone to respond extremely (γ01= -0.1463, γ02=0.1278). For education, no cross-nationally
generalizable effect was found, although there was significant random variation across countries.
Culture plays an important role in explaining cross-national differences in ERS. The four
culture dimensions explained 59 percent of the between-country variance in ERS. As
hypothesized, ERS is positively related to national-cultural individualism (γ05= 0.0037),
uncertainty avoidance (γ06=0.0051), and masculinity (γ07=0.0029). As expected, ERS is not
related to power distance. Recently, Johnson et al. (2005) also investigated the relationship
between Hofstede’s dimensions and extreme responding across 19 nations. They found no
statistically significant effects in their initial analysis using the original Hofstede scores. This
suggests that the proposed methodology can help reveal drivers of ERS that cannot be observed
with other ERS measures.

65
Table 4 MULTILEVEL STRUCTURAL IRT MODEL WITH COVARIATES
Coefficient Standard Deviation γ00 (Constant) -1.2411a 0.0554 Socio-demographic variables γ01(Age) -0.1463a 0.0469 γ02 (Age*Age) 0.1278a 0.0411 γ03 (Gender (1=female; 0=male) 0.0324a 0.0093 γ04 (Education) 0.0010 0.0103 National-Cultural variables γ05 (Individualism) 0.0037a 0.0021 γ06 (Uncertainty avoidance) 0.0052a 0.0020 γ07 (Maculinity) 0.0030a 0.0017 γ08 (Power distance) -0.0024 0.0558 Variance parameter σ2 (level 1 variance) 0.5661a 0.0084 a Indicates that the 95% posterior probability interval excludes zero.
III.8 CONCLUSIONS
In the introduction, we identified several contributions this research makes to the study of
ERS. We structure our conclusions around these contributions. First, our new, IRT-based method
improves upon the traditional ERS method by allowing different items to be differentially useful
for measuring ERS and by accommodating the possibility that an item’s usefulness may differ
across groups (e.g., countries). Our simulations show that ignoring differential item functioning
within and across countries leads to seriously biased results, while our large-scale empirical study
provides strong evidence that survey items do not provide equally useful information about ERS,
either within or across countries. People differ in their tendency to use the extremes of the rating
scale, and items also differ in the extent to which they elicit extreme responses, both nationally
and cross-nationally. The cross-classified character of IRT, that is, disjunct item and person
parameters, is well suited to capture this interactive phenomenon, whereas the use of simple sum
scores (Equation (2)) is rendered problematic by our findings. The results provide support for the
notion that stylistic responding is best understood as an interaction of personal dispositions and
item characteristics (Podsakoff et al. 2003). A unique feature of our model is that each item is
allowed to function differently across countries. Thus, measurement invariance for item
parameters is relaxed.

66
Second, unlike the traditional model, our model allows researchers to purge item scores of
ERS even when they only have correlated items measuring substantive constructs. In a simulation
study, we showed that ignoring the correlation between items biases the traditional ERS estimate,
whereas the inclusion of testlets effectively controls for this problem.
Third, our model integrates the advanced IRT measurement model with a structural
hierarchical model for studying the antecedents of ERS. Applying this integrated IRT-
hierarchical model to a large data set involving 12,500 consumers from 26 countries, we find that
the socio-demographic variables studied have a minor influence on ERS, but that culture exerts a
strong and predictable effect on ERS. Implications for international marketing are evident,
because ERS differences might bias comparisons between countries.
There are several promising avenues for future research. First, most research on individual-
level drivers of ERS has examined socio-demographics. Results are often inconsistent and effect
sizes small. Future research could examine more fundamental characteristics of individuals such
as personality factors or value priorities. In addition, our model assumes that the items in each
survey are the same. However, it often happens that there are both common and country-specific
items (e.g., May 2005). Our model could be extended to accommodate such situations. Another
interesting option is to include ‘No Answer’ options in the survey. It may sometimes be more
valid to allow NA answers, rather than forcing respondents to provide an answer on the rating
scale. Future research may integrate our ERS model with response models that have been
developed for such situations (cf. Bradlow and Zaslavsky 1999). Finally, the highest-information
measurement method for ordinal data is the graded-response (ordinal) IRT model. However, for
such a model to accurately identify ERS and ERS properties of items it should include all
relevant response styles. Future research could work on the specification and interpretation of
such generalized response models. Although many issues remain for further research, we hope
this research stimulates marketing researchers to pay more careful attention to the issue of ERS in
both domestic and international survey research.

67
III.9 APPENDIX
This section presents the full MCMC algorithm for the multilevel testlet IRT model with varying item parameters. The model without covariates is a special case of the model that is developed here. Let the observed data be (EXTR, X, W) measuring the item responses EXTR for the latent trait ERS, X the individual-level explanatory variables, and W the country-level variables. The Gibbs sampler draws stepwise from the full conditional distributions. The first step is to augment the observed data with latent data Z. By defining a continuous latent variable Z that underlies the dichotomous responses contained in EXTR, it is easier to sample from the conditional distributions of the parameters of interest. Data augmentation has been widely applied. To identify the model, we use the restriction 1, and 0,kj kjkk
a b= =∏ in each country j.
1) Sample from ],,,,|[ , krijkjkjijijkijk baERSEXTRZ ψ , for 1, , , 1, , , and 1, , .jk K i n j J= = =
Given the parameters krijkjkjij baERS ,,,, ψ the variables Zijk are independent and normally
distributed, that is,
=−−=−− 1 if 0by left truncated)1,((
0 if 0by right truncated)1,((
~,,,,|
,
,
,
ijkkjrijijkj
ijkkjrijijkj
rijkjkjijijkijk
EXTRbERSaN
EXTRbERSaN
baERSEXTRZ
k
k
k
ψψ
ψ
2) Sample from 2| , , , , , ,ij ij jERS σ a b EXTRΖ ψ βΖ ψ βΖ ψ βΖ ψ β for 1, , , 1, , .ji n j J= = … This full
conditional distribution is a product of two normal distributions and from standard properties of normal distributions it follows that
2,
2 1
2 2 2 2
1 1
( )1
| , , , , , ~ ,1 1
k
K
kj ijk kj kj ij r ij jk
ij ij j K K
kj kjk k
a Z b aERS N
a a
ψ σσ
σ σ=
= =
+ + + + +
XZ a b
ββββψ βψ βψ βψ β
3) Sample from 2
, | , , ,rij r ij ψψ σ Z a b , for 1, , , 1, ,ji n j J= … = … and 1, ,r R= where R is the
total number of testlets. Consider testlet r of size Nr, and let rk denote the testlet of item k. If Nr=1 then , 0ij rψ = for all i and j. The full conditional distribution for ,ij rψ is normal with parameters
( )( )
( )
: 2, 2 2
:
2, 2 2
:
| , , ,1
1| , , , ,
1
k
r
r
k
r
r
k
kj kj ij kj ijkk r r
ij r ijkj
k r r
ij r ijkj
k r r
a a ERS b ZE
a
Vara
ψψ
ψψ
ψ σσ
ψ σσ
=
=
=
− −=
+
=+
Z a b
Z a b
4) Sampling [ | , , , ]kj k ERSξ ξ ψ Σξ ξ ψ Σξ ξ ψ Σξ ξ ψ Σ Consider the augmented likelihood. Then,

68
( )( )
( )
*
2
2
*
1
11 1
, [ , ]
0~ , ,
0
| , , , ~ , ( )
.
kj j kj kj j j
k akj k
bk
kj k kj j kj kj
tkj j kj k
tj j
aN N
b
N I a A
σσ
−
−− −
= + = −
=
∈
= +
= +
Z H H ERS
Z ERS
H Z
H H
ξ εξ εξ εξ ε
ξ ξ Ψξ ξ Ψξ ξ Ψξ ξ Ψ
ξ ξ Ψ Ωµ Ωξ ξ Ψ Ωµ Ωξ ξ Ψ Ωµ Ωξ ξ Ψ Ωµ Ω
µ Ψ ξµ Ψ ξµ Ψ ξµ Ψ ξ
Ω ΨΩ ΨΩ ΨΩ Ψ
1
5) Sample from [ | , , , ]k k
a bξ ξ Σξ ξ Σξ ξ Σξ ξ Σ .
Given the prior ( ) ( )2 2
2 2~ , , A ,k a a abk
bk ab b
aN N I a
b ξ
µ σ σµ σ σ
= ∈
µ Σµ Σµ Σµ Σ
we have that
( ) ( )1 1
1 1 1
, ~ , Ak k k k k k
k k
k
N I a
ξ− −
− − −
∈
= +
= +
ξ ξ Σ Ξ ζ Ξξ ξ Σ Ξ ζ Ξξ ξ Σ Ξ ζ Ξξ ξ Σ Ξ ζ Ξ
ζ Λ ξ Σ µζ Λ ξ Σ µζ Λ ξ Σ µζ Λ ξ Σ µ
Ξ Λ ΣΞ Λ ΣΞ Λ ΣΞ Λ Σ
where
/
/
J
kjj
k J
kjj
a J
b J
=
ξξξξ
6) Sample from ][],
~,|[],~,|[ 222
rbbaa ba ψσσσ . For each variance parameter an inverse gamma
prior is specified with parameters g1 and g2. As a result, the full conditionals are inverse gamma distributions with shape parameters 1/ 2KJ g+ , 1/ 2KJ g+ , and 1/ 2N g+ , respectively, and scale
parameters ( )2
21 1
/ 2,J K
kj kj k
g a a= =
+ − ( )2
21 1
/ 2, J K
kj kj k
g b b= =
+ − = =
+J
j
n
irij
i
kg
1 1
2,2 2
1 ψ respectively.
In this paper, a noninformative proper prior was specified with 1 2 1g g= = . 7) The conditional distribution of the covariance matrix ΣΣΣΣ has an inverse-Wishart distribution,
1
01
| ~ , ( )( ) .K
tk k
k
Inv W K n ξ ξµ µ−
=
− + + Σ ξ ξ − ξ −Σ ξ ξ − ξ −Σ ξ ξ − ξ −Σ ξ ξ − ξ −
S We used S=diag(100,100), n0=2.
8) Sample from 2| , , ,j j σ ERS Tβ γβ γβ γβ γ , for 1, , .j J= Define ( )1 , , , ,
jj j ij n j=X X X X , with
( )'
0= , ...,ij ij QijX XX . So, Xj is of dimension nj×(Q+1). The Level 2 explanatory variables for goup
j are stored in jW . This matrix is the direct product of ( )0 , ,qj SqjW W and a Q+1 identity matrix.
The prior of the random regression coefficients at Level 1 is ( )~ , .j jN W Tβ γβ γβ γβ γ Then, the full
conditional posterior of j is given by,

69
( ) ( ) ( )( )1 12 1 1 1 1 1 1ˆ| , , , ~ ,j j j j j j jNσ− −− − − − − −+ + +ERS T T T W Tβ γ ϒ ϒ β γ ϒβ γ ϒ ϒ β γ ϒβ γ ϒ ϒ β γ ϒβ γ ϒ ϒ β γ ϒ
where ( ) 1ˆ
j j j j j
−′ ′= X X X ERSββββ and ( ) 1
2j j jσ
−′= X Xϒϒϒϒ . In case of fixed Level 1 regression
coefficients, a noninformative prior is used and the resulting conditional distribution is also
normal with mean ( ) ( )1
ˆF F F F R Rβ
−′ ′= −X X X ERS X ββββ and variance ( ) 1
2F Fσ
−′X X , where
and F RX X are the explanatory variables related to the fixed and random regression coefficents, respectively. 9) Sample from [ ]| ,Tγ βγ βγ βγ β . The full conditional for the Level 2 regression coefficients γγγγ with a noninformative prior equals
1 1
' 1 ' 1 ' 1
1 1 1
| , ~ ,J J J
j j j j j jj j j
N− −
− − −
= = =
W T W W T W WT T
10) Sample from 2 | ,σ ERS ββββ . A prior for the variance is specified in the form of an inverse
gamma distribution with shape and scale parameters g1 and g2, respectively. It follows that
( )221 2| , ~ / 2 ,
2 j j jj
NIG N g gσ
+ − +
ERS ERS Xβ ββ ββ ββ β .
A noninformative but proper prior is specified with 1 2 1g g= = . 11) Sample from [ ]| ,T . An inverse Wishart distribution with small degrees of freedom, but
greater than the dimension of j , n0 and unity matrix S0 can be used to specify a diffuse proper prior for T. It follows that
( )( )1
'
0 0| , ~ , j j j jj
Inv W J n S−
− + − − +
W W T .

70
Chapter 4
The Interplay of Personality and Culture in Shaping Socially Desirable Responding
Abstract:
This paper investigates the role of personality and culture in influencing socially desirable responding (i.e., the tendency of respondents to give answers that make them look good), which is an important threat to the validity of survey-based research. We develop a conceptual framework that considers the effects of personality (the Big Five dimensions of personality), culture (Hofstede’s dimensions of cultural variation), and certain interactions on respondents’ disposition to engage in socially desirable responding. The hypotheses are tested using a large data set involving a random sample of over 12,000 respondents in 25 countries on 4 continents, and the analysis is based on a recently developed multilevel item response theory-based scaling technique that estimates latent scores for all constructs on a cross-nationally common scale. The findings support most of the proposed hypotheses and provide evidence for the cross-national generalizability of the personality and national-cultural drivers of socially desirable responding. This chapter is based upon a paper with the same title authored by Jan-Benedict E.M. Steenkamp, Martijn G. de Jong and Hans Baumgartner, and is presently under review. We thank AiMark for providing the data. Order of authorship is arbitrary, all authors contributed equally.

71
IV.1 INTRODUCTION
Surveys play a crucial role in marketing research. For example, of the 520 empirical articles that
appeared in the Journal of Marketing and Journal of Marketing Research in the last decade (1995-
2005), 43 percent employed surveys (Rindfleisch et al. 2006). Unfortunately, survey data are
often contaminated by socially desirable responding (SDR), that is, people’s tendency to give
answers that make them look good (Paulhus 1991). This introduces extraneous variation in scale
scores, which compromises the validity of the marketing survey data. The role of SDR in biasing
scores on substantive scales and in attenuating, inflating, or moderating relations between
substantive constructs is well established in marketing and other social sciences (Ballard, Crino,
and Rubenfeld 1988; Fisher 1993; Ganster, Hennessey, and Luthans 1983; Jo, Nelson, and
Kiecker 1997; Mick 1996; Podsakoff et al. 2003; Zerbe and Paulhus 1987).
In marketing, SDR has sometimes been associated with “dark side” topics such as materialism
(Mick 1996), compulsive buying (Mick 1996), and consumption of taboo products (McGraw and
Tetlock 2005). However, it is generally acknowledged that SDR is also operant in “mainstream”
areas important to marketers (Netemeyer, Bearden, and Sharma 2003), such as brand familiarity
and brand liking (Rindfleisch and Inman 1998), consumption motivations (Fisher 1993),
consumer innovativeness (Goldsmith 1987), satisfaction (Sabourin et al. 1989), and value
priorities (Fisher and Katz 2000). SDR has also been found to bias managerial decision making
(Chung and Monroe 2003) and performance evaluations (Bearden, Manning, and Tian 2004).
Thus, it is not surprising that SDR has been identified as “one of the most pervasive response
biases” in survey data (Mick 1996, p. 106).
SDR research has primarily addressed two issues. A first stream of research has focused on
reducing the biasing influence of SDR, either prior to or during data collection and/or in data
analysis (Fisher 1993; Fox 2005c; Nederhof 1985; Jo 2000; Podsakoff et al. 2003). A second
stream of research has investigated SDR as an important construct in its own right. For example,
researchers have tried to answer such questions as what intra- and interpersonal goals are served
by engaging in SDR, what types of respondents are most prone to distort their responses in
surveys, and what situational influences give rise to overly positive self-descriptions (Lalwani et
al. 2006; Bearden, Manning, and Tan 2004). Our study belongs to this second stream of research.
Although past research has established systematic relationships between certain personality
and socio-demographic characteristics of respondents and SDR (Mick 1996; Ones, Viswesvaran,

72
and Reiss 1996; Ones and Viswesvaran 1998; Paulhus 2002), important issues remain to be
addressed in order to more fully explore the antecedents of SDR and to better understand the
implications of SDR for the validity of marketing research efforts involving survey data,
especially in international settings. The following areas are of particular interest.
First, we have only limited knowledge of the links between cultural orientation and SDR. The
only dimensions of cultural variation for which data are available are individualism/collectivism
and power distance (Heine and Lehman 1995; Lalwani et al. 2006; Triandis et al. 2001; Van
Hemert et al. 2002), and generally the findings have not been very consistent across studies.
Furthermore, previous research has examined personality and culture in isolation, even though
theorists have acknowledged that personality and culture interact in shaping people’s responses
to the environment (McCrae 2000). More generally, it has been repeatedly observed that a fuller
understanding of individual dispositions such as SDR requires the investigation of both micro-
individual and macro-cultural antecedents (Erbring and Young 1979), and the simultaneous
investigation of individual-level variables and culture seems necessary to identify whether the
individual-level effects of personality on SDR are systematically and predictably moderated by
the cultural context in which respondents live.
Second, most of the research that has sought to investigate the personality and socio-
demographic correlates of SDR has been conducted with samples of respondents from the U.S.
Furthermore, in studies in which the relationship between SDR and different cultural orientations
is investigated, it is not uncommon for researchers to recruit participants (usually students) from
different cultural groups that reside in the U.S. (e.g., Lalwani et al. 2006). It would be preferable
if the cultural determinants of SDR were studied in a truly international context.
Third, cross-national research introduces a host of measurement challenges (Van de Vijver
and Leung 1997). Unfortunately, in cross-cultural SDR research, scale usage differences by
respondents from different countries and other possible sources of lack of measurement
invariance are usually not accounted for, which renders conclusions from such research
problematic (Steenkamp and Baumgartner 1998).
The present chapter sets out to address these limitations. More specifically, our contribution
is threefold. First, we develop a conceptual model that specifies the main effects of personality
and national culture on SDR and, most importantly, considers the moderating role of the cultural
context in which a respondent lives on the effects of the various personality factors. Second, the
73
hypotheses are tested using a large data set involving a random sample of over 12,000
respondents in 25 countries on 4 continents. This dataset provides a unique basis for deriving
empirical generalizations concerning the main and interaction effects of personality and culture
on SDR. Third, we use a recently developed scaling technique that is well-suited to analyzing
data from a large number of countries (DeJong, Steenkamp, and Fox 2007). The traditional multi-
group confirmatory factor analysis methodology is ill-equipped to satisfy minimum invariance
constraints in such research settings (Baumgartner 2004). The new item response theory-based
technique estimates latent scores for all constructs on a cross-nationally common scale, and hence
holds great promise for conducting marketing research in many different nations or
subcultures/subgroups within one country.
In the following sections, we first introduce our conceptual framework and develop our
research hypotheses. Next, we discuss the data set, the measures, and the mathematical model.
Finally, we present the results and end with a discussion and some future research suggestions.
IV.2 CONCEPTUAL FRAMEWORK
Socially desirable responding
Socially desirable responding (SDR) can be defined as “the tendency for people to present
themselves favorably according to current cultural norms when answering survey questions”
(Mick 1996, p. 106). SDR may be either a response set or a response style (Mick 1996). In the
former sense, it refers to a transitory reaction to a situational contingency such as time pressure or
expected public disclosure of answers. One frequently used method to prevent SDR as a response
set has been to assure respondents of their anonymity. Here we focus on SDR as a response style.
Mick (1996) argues that SDR as a response style exists when individuals consistently engage in
SDR across time, situations, and measurement instruments. It is a stable individual characteristic
and making assurances of anonymity helps little if at all (Mick 1996).
Some researchers have treated SDR as a unidimensional construct (e.g., Crowne and Marlowe
1960; see Paulhus 1991 for a comprehensive overview). Others, notably Paulhus (1984; 1991),
have argued that SDR consists of two (positively correlated) factors, namely, impression
management (respondents’ conscious tendency to present themselves in the most positive
manner) and self-deceptive enhancement (people’s unconscious tendency to provide inflated self-
reports). Although several studies have shown differential relationships between the two
components of SDR and a variety of other constructs and behaviors (e.g., Bearden, Manning, and

74
Tian 2004; Furnham, Petrides, and Spencer-Bowdage 2002; Lalwani et al. 2006; Mick 1996; see
also Paulhus 2002), impression management and self-deceptive enhancement are sometimes
fairly highly correlated (e.g., between .40 and .70; see Ones et al. 1996), and the pattern of
correlations with other constructs has often been similar across the two SDR dimensions,
especially with regard to their relationship with the Big Five dimensions of personality (Barrick
and Mount 1996; Ones et al. 1996). For this reason, we will primarily focus on the antecedents
of SDR as a whole, although we will briefly consider the separate effects on impression
management and self-deceptive enhancement in the results section.
In developing our hypotheses, we follow Koestler's (1967, p. 56) dictum that “No man is an
island – he is ... a Janus-faced entity who, looking inward sees himself as a self-contained unique
whole, looking outward as a dependent part.” A person's dispositions and behaviors are affected by
his or her own makeup as well as by the norms and beliefs of the cultural environment (Triandis
1989). We propose and test a framework (see Figure 1) in which respondents’ tendencies to provide
socially desirable responses are hypothesized to be affected by their personality (as well as socio-
demographics), the culture in which they live, and the interplay between personality and culture.
Figure 1 Conceptual Framework
Personality
• Openness
• Conscientiousness
• Extraversion
• Agreeableness
• Neuroticism
National culture
• Power distance
• Individualism
• Uncertainty avoidance
• Masculinity
SociallyDesirableResponding
Socio-demographics• Age• Gender• Education• Social Class• Household size• Urbanization

75
The Role of Personality
Personality traits are “relatively enduring styles of thinking, feeling, and acting” (McCrae and
Costa 1997, p. 509), representing basic human ways of experiencing and reacting to the world.
The most influential conceptualization of personality is the Big Five factor model, which
distinguishes between five fundamental personality traits, namely, extraversion, neuroticism (or
its opposite, emotional stability), agreeableness, conscientiousness, and openness to experience
(Digman 1990; John 1990). The Big Five structure has been replicated in a wide variety of
populations (e.g., men and women, older and younger adults, different ethnic groups), in scores
of countries on five continents, and in a host of language families (ranging from various branches
of the Indo-European family to Hamito-Semitic, Malayo-Polynesian, Uralic, Bantu, and Sino-
Tibetan varieties) that together include the native tongues of most of the world’s population
(McCrae, Terracciano, et al. 2005). The Big Five personality factors have also begun to attract
attention in marketing, especially in the context of services (Brown et al. 2002; Mowen and
Spears 1999).
Ones, Viswesvaran, and Reiss (1996) conducted a comprehensive meta-analysis of the
relationship between social desirability and the Big Five dimensions of personality, in which they
cumulated between 126 (for openness to experience) and 467 (for neuroticism) separate
correlations involving between 39,314 and 143,794 respondents. They found estimated
population correlations (corrected for unreliability in both measures) of -.37, .20, .14, .06, and .00
with neuroticism, conscientiousness, agreeableness, extraversion, and openness to experience
(except for the last, all were significant).15
Although these findings provide strong empirical evidence concerning the effect of personality
on SDR, Ones et al. did not discuss the theoretical rationale underlying these effects because their
focus was on the criterion-related validity of personality measures for predicting job
performance.
15 Significant correlations between the Big Five personality factors and SDR may be interpreted as evidence that either personality factors affects SDR or that the measurement of personality factors is contaminated by SDR (suggesting reverse causality). If the latter interpretation is correct, correlations between SDR and the Big Five dimensions as rated by others and SDR should be negligible. Importantly, Ones, Viswesvaran, and Reiss (1996) found that this is not the case. They reported that the correlations between the SDR score provided by the focal person and others’ ratings of the Big Five factors of personality of the focal person are similar in magnitude to the correlations between SDR scores and own ratings on the Big Five factors. Further, Ellingson, Smith, and Sackett (2001) found that social desirability does not alter the Big Five factor structure, which also argues against reverse causality.

76
Thus, one goal of the present research is to explicate the conceptual reasons for expecting
certain relationships between the Big Five dimensions and SDR. In addition, most of the prior
evidence concerning the link between personality and SDR comes from studies conducted with
U.S. respondents. Even from an empirical perspective, there is thus some need to investigate the
generalizability of previous findings in a global context. Finally, in contrast to previous research,
we estimate the effect of each personality factor while controlling for the effect of the other
personality factors (as well as for consumer demographics). It is well-known that bivariate
correlational tests can lead to erroneous conclusions.
Individuals high on neuroticism tend to be anxious, fearful, self-pitying, insecure and low in
self-esteem. Those low on this trait (i.e., emotionally stable people) are calm, relaxed, even-
tempered, and unflappable. Neurotic individuals have been found to have a higher level of
disclosure, even when it is inappropriate, due to maladaptive behavior patterns (Nelson-Jones and
Coxhead 1980). This suggests that neurotics will be less concerned with upholding their public
image by means of active response distortion. Furthermore, the lower self-esteem characteristic
of neurotics implies that they are less likely to engage in self-deceptive enhancement. The
findings of Mick (1996) in the context of research on materialism are consistent with the
predicted negative correlation between neuroticism and SDR.
People high on conscientiousness tend to be cautious and high on social conformity and
socially prescribed impulse control (Hogan and Ones 1997). According to socio-analytic theory
(Hogan 1983), conscientious individuals are consciously or unconsciously motivated by social
acceptance. They are skilled in social performance and attentive to processes that will support
getting ahead and being socially accepted. Hogan and Ones (1997, pp. 865-866) theorized that a
conscientious person “thinks about the question, considers the impression he or she would make
with a particular response, and endorses the item to convey the desired image.” Therefore,
conscientiousness is expected to be positively associated with SDR.
Individuals who score high on agreeableness tend to be compliant and cooperative, and have a
strong desire for harmonious interpersonal relationships. They are characterized by a
motivational system that fosters a craving for intimacy, union, and solidarity with the groups to
which they belong. Because agreeable people are especially motivated to maintain positive
relations with other people, they are likely to make themselves look good in the eyes of others.
Hence, we expect a positive relation between agreeableness and SDR.

77
Extraverts tend to be dominant and sociable, and they enjoy being with other people. Various
personality theorists have argued that, in order to present themselves favorably, extraverts tend to
conform to social standards, while introverts are nonconformists (Watson and Clark 1997).
Extraverts achieve adaptation to the environment through social interaction and interpersonal
relationships (Watson and Clark 1997), which suggests a positive relationship between
extraversion and SDR. The empirical evidence for this hypothesis is somewhat equivocal,
although overall Ones et al. (1996) report a small but reliable positive correlation between
extraversion and SDR.
Finally, openness to experience is associated with tolerance of ambiguity, risk taking,
autonomy of thought and action, receptivity to new ideas and novel situations, and a preference
for complexity. All this implies a negative relation with SDR. However, the empirical evidence
does not support this expectation. The estimated correlation in the meta-analysis of Ones et al.
(1996) was .00, with a 90 percent confidence interval ranging from -.02 to .02. One possible
explanation might be that openness to experience is the only Big Five factor that is related to
cognitive ability and intellect (McCrae and Costa 1997). If, as argued by Stricker (1969), the
ability to accurately assess the desirability of items and to respond in accordance with prescribed
roles is one of the key abilities of test-wise individuals, and test-wiseness is positively correlated
with SDR, then this would lead to a countervailing positive influence of openness to experience
on SDR, resulting in an overall null effect of this personality dimension. We refrain from making
a prediction and will investigate the relationship between openness to experience and SDR
empirically.
In sum, we hypothesize:
H1: SDR is negatively associated with (a) neuroticism, but positively related to (b)
conscientiousness, (c) agreeableness, and possibly (d) extraversion.
The Role of National Culture
As noted by Mick (1996), cultural norms are important determinants of SDR. Culture influences
SDR in two ways. First, culture has direct effects on SDR (Triandis and Suh 2002; Van Hemert et
al. 2002). Respondents in some countries may on average be higher in SDR than respondents in
other countries, due to systematic differences in the cultural environment. Second, culture moderates
the relation between personality and SDR. In this paper, the moderating role of culture is most

78
relevant, but we first develop the direct effects of culture to set the stage for our moderating
hypotheses.
A country's culture is reflected in “general tendencies of persistent preference for particular
states of affairs over others, persistent preferences for specific social processes over others, and
general rules for selective attention, interpretation of environmental cues, and responses” (Tse et al.
1988, p. 82). Theorists such as Hofstede (2001) and Triandis (Triandis and Suh 2002) emphasize
that culture is shared between members of a society. We will use Hofstede’s (2001) well-known
dimensions of national culture – individualism/collectivism, uncertainty avoidance, power
distance, and masculinity/femininity – to examine the role of culture in encouraging people to
provide socially desirable responses.
Individualism/collectivism pertains to the degree to which people in a country prefer to act as
individuals rather than as members of a group. People in individualistic societies are emotionally
detached from in-groups (other than their immediate family) and place their personal goals,
motivations, and desires ahead of those of the in-group (Kagitcibasi 1997). Individualists tend to
make decisions and initiate behaviors relatively independently of others and have a greater ability
to withstand social pressure (Markus and Kitayama 1991). In contrast, collectivistic cultures are
conformity oriented, and show a higher degree of group behavior and concern for promoting the
group’s continued existence. This suggests that in collectivistic societies, there will be a greater
tendency for people to present themselves in a favorable light in order to meet interpersonal goals
(Triandis 1995; Triandis and Suh 2002; Van Hemert et al. 2002). Thus, we expect that SDR will
be higher in countries whose national culture is characterized by lower levels of individualism
(or, conversely, higher levels of collectivism).
Uncertainty avoidance measures the degree to which societies tend to feel threatened by
uncertain, risky, ambiguous or undefined situations, and the extent to which they try to avoid
such situations by adopting strict codes of behavior. Individuals in high uncertainty-avoidance
cultures will be more focused on risk avoidance and reduction, including social risk. Providing
answers that are socially desirable is one way of reducing social risk. Therefore, uncertainty
avoidance should be positively associated with socially desirable responding.
In high power distance cultures, the unequal distribution of power, roles, and resources is
seen as legitimate. Institutions are likely to have a centralized structure, emphasize the chain of
authority, assign well-defined roles in a hierarchical structure, and demand compliance in the

79
service of goals set at the top. The hierarchical relations are characterized by a strong degree of
dependence and a desire for conformity. People are less inclined to show their true feelings, and
it is important to make a good impression (Hofstede 2001). Hence, we expect that SDR will be
higher in high power distance cultures.
In masculine cultures, the dominant values are ego enhancement, achievement and success,
while the dominant values in feminine cultures are quality of life, equality, and caring for the
weak (Hofstede 2001). At first sight, it might appear that SDR will be higher in feminine cultures
because of their ‘softer’ orientation toward people. However, this ignores the fact that socially
desirable responding serves an important ego-enhancing purpose in groups and societies (Paulhus
1984; Furnham, Petrides, and Spencer-Bowdage 2002). By providing “overly positive self-
descriptions” (Paulhus 2002, p. 50), a person can enhance his or her stature in society. Moreover,
cultural masculinity is related to Inglehart and Baker’s (2000) survival values (Hofstede 2001, p.
266). Survival values express an orientation toward low tolerance of deviating opinions and low
appreciation of imaginative, out-of-the-box thinking (Inglehart and Baker 2000), both of which
are negatively associated with SDR. Thus, we expect SDR to be more pronounced in masculine
cultures.
In summary, we hypothesize the following relationships between Hofstede’s dimensions of
cultural variation and SDR:
H2: SDR will be higher in countries whose national culture is characterized by (a) lower
levels of individualism but higher levels of (b) uncertainty avoidance, (c) power
distance, and (d) masculinity.
Although a few studies have examined the effect of culture on SDR, past research provides
equivocal evidence concerning H2. Individualism has attracted the most attention, which is not
surprising given its pivotal role in cultural studies (Oyserman, Coon, and Kemmelmeier 2002).
Van Hemert et al. (2002) found a significant negative bivariate correlation between a country’s
national-cultural individualism and its score on the Lie scale of the Eysenck Personality
Inventory (a surrogate for SDR). Also, a significant positive bivariate correlation was found with
power distance, although the authors did not offer a theoretical rationale for these effects.
Lalwani, Shavitt, and Johnson (2006) measured cultural orientation at the individual level and
found that individualism was positively related to the self-deceptive enhancement component of

80
SDR and collectivism was positively related to impression management (especially the horizontal
forms of individualism and collectivism). However, Heine and Lehman (1995) found no
differences between (collectivistic) Japanese exchange students and (individualistic) European-
Canadians on either self-deceptive enhancement or impression management, while Triandis et al.
(2001) found evidence of greater tendencies toward deception among collectivistic samples in
business negotiation scenarios. Finally, Church (2000) reviewed several studies suggesting that
collectivistic societies are higher on SDR. One possible explanation for these inconsistencies is
that SDR may be a joint function of personality and culture so that both have to be considered in
interaction. The theoretical evidence in favor of this possibility is considered next.
Interactions between Personality and Culture
The shared cultural priorities in society help to shape the social and economic reward
contingencies to which people must adapt in the institutions in which they spend most of their
time (families, schools, businesses, etc.) in order to function smoothly and effectively (Smith and
Schwartz 1997). Triandis and Suh (2002) theorize that behavior is a function of not only culture
and personality but also their interaction. McCrae (2000) similarly argues that “personality and
culture are relatively independent forces that interact to shape people’s lives” (p. 14, emphasis
added), and notes that “culture affects ... the expression of personality” (p. 21; see also Church
2000, p. 663).
Individuals may thus experience compatibilities and conflicts between their own personality
makeup and national-cultural priorities. These positive or negative social reinforcement
mechanisms – which operate between the two types of constructs – give rise to interactions
between individual-level and national-cultural variables. More specifically, personality traits that
are congruent with national-cultural priorities will be encouraged, while the expression of
personality traits that are incongruent with national priorities are discouraged (Triandis 1989).
We posit five interactions involving the moderating influence of culture on the relationship
between personality and SDR, based on the relative congruence or incongruence between a
specific personality factor and a particular national-cultural dimension.
Neuroticism. People high on neuroticism are anxious, nervous, and tense. Hofstede (2001)
characterizes countries high on uncertainty avoidance as anxious cultures and describes their

81
citizens as “fidgety.” Prior research clearly shows that country-level neuroticism scores correlate
substantially with various measures of anxiety and Hofstede’s uncertainty avoidance index (see
Lynn and Martin, 1995, and the research reviewed in Hofstede, 2001, Chapter 4). Due to the
mechanism of characteristic adaptation (McCrae 2000), we can expect that high national-cultural
uncertainty avoidance reinforces the effect of high individual-level neuroticism on SDR.
H3: The negative effect of neuroticism on SDR will be stronger when national-cultural
uncertainty avoidance is higher.
Conscientiousness. There is also a basic congruence between conscientiousness and
uncertainty avoidance. The conventional, thorough, organized, and cautious thinking that
characterizes individuals high on conscientiousness (Hogan and Ones 1997) is more valued in
high uncertainty avoidance cultures, which shun unpredictable and ambiguous situations while
valuing clarity and structure (Hofstede 2001). Further, conscientiousness reflects tendencies
toward rule compliance and obedience (Noller, Law, and Comrey 1987), and rule orientation is a
key aspect of the operational definition of uncertainty avoidance (Hofstede 2001). Since
uncertainty avoidance is thus conducive to the expression of conscientiousness, we predict that it
will strengthen the effect of conscientiousness on SDR.
H4: The positive effect of conscientiousness on SDR will be stronger when
national-cultural uncertainty avoidance is higher.
Agreeableness. People high on agreeableness tend to be modest and cooperative. They are
more concerned about the welfare of others, are more strongly motivated to maintain positive
relations with others, and have a strong desire for harmonious interpersonal relationships
(Graziano and Tobin 2002). This personality factor is therefore highly compatible with the focus
of national-cultural collectivism on interdependence, relationships, harmony, humility,
moderation, and conformity (Triandis 1989; Markus and Kitayama 1991). The converse is true
for societies high on individualism, which emphasize independence, ability to withstand social
pressure, and uniqueness. Furthermore, in individualist cultures, confrontations are much more
accepted (Kagitcibasi 1997). Thus, it is reasonable to expect that individualism/collectivism will
moderate the effect of agreeableness on SDR.

82
H5: The positive effect of agreeableness on SDR will be stronger when national-cultural
individualism is lower or collectivism is higher.
Extraversion. Peabody (1999) argues that the Big Five factor of extraversion is closely related
to an assertive-unassertive dimension, which he links to masculinity-femininity. Hofstede (2001)
has referred to the masculinity-femininity dimension as a contrast between assertiveness and
modesty, and some of the traits often associated with extraversion (e.g., dominance,
competitiveness, a desire to boost one’s ego; see De Raad 2000) are clearly congruent with
values associated with national-cultural masculinity (Hofstede 2001). This suggests that the
positive effect of extraversion on SDR will be strengthened by a masculine cultural environment.
In addition, extraverts like to be the center of attention in social situations, are forceful, enjoy
controlling and/or influencing others, and are willing to work hard to pursue their life goals
(Watson and Clark 1997). Since in high power distance cultures, people are highly motivated by
social status and prestige (Roth 1995), this cultural orientation is thus congruent with
extraversion. We therefore predict that the effect of extraversion will be reinforced by the cultural
dimension of power distance. Combining both hypotheses, we specify the following:
H6: The positive effect of extraversion on SDR will be stronger when (a) national-cultural
masculinity and (b) national-cultural power distance are higher.
Sociodemographics
Although they are not of primary theoretical interest in this research, several important
sociodemographics are included in our model for control purposes. Some researchers (e.g., Fisher
1993; King and Bruner 2000) have hypothesized that SDR might systematically vary across
sociodemographic groups in society, but few, if any, generalizable results have emerged. This
may be partly due to the fact that most research has used fairly homogeneous populations
(university students). Ones and Viswesvaran (1998) conducted a meta-analysis of the effects of
gender and age on social desirability (based on 66 and 19 studies, respectively) and found that
men and older people scored higher on social desirability scales, although the effects sizes were
small. Paulhus (1991) reported that men rated higher on self-deceptive enhancement, but women
had higher scores on impression management. There is also some evidence that respondents from
lower social classes are higher in social desirability (Ross and Mirowsy 1984). In addition, SDR

83
has been hypothesized to be positively associated with education (which should increase “test
smartness”), although Ones, Viswesvaran, and Reiss (1996) actually found the opposite.
Given the dearth of theory to guide us, we refrain from developing formal hypotheses. Instead,
we will use the richness of our data set to examine the effect of several sociodemographics in an
exploratory fashion. This serves two purposes. First, it allows us to assess whether any cross-
nationally generalizable effects can be found. These findings are of practical relevance as
sociodemographics are readily available in marketing research. Second, controlling for these
variables removes extraneous variance from the data and hence provides for a more precise test
of our hypotheses.
IV.3 METHOD
Data collection
Two global marketing research agencies, GfK and Taylor Nelson Sofres, collected the data in
25 countries around the world: Argentina, Austria, Belgium, Brazil, China, Czech Republic,
Denmark, France, Germany, Hungary, Ireland, Italy, the Netherlands, Norway, Poland, Portugal,
Romania, Russia, Spain, Switzerland, Taiwan, Thailand, Ukraine, UK, and the U.S. The sample
in each country was drawn so as to be broadly representative of the total population in terms of
region, age, education, and gender.
For countries with a high penetration of the Internet, a web survey was used. In some countries
with a lower Internet penetration, we used mall intercepts. For the mall intercepts, the first step
was to select multiple regions/locations for the fieldwork. Next, a space was rented which had an
Internet connection for 2-5 PCs or laptops (e.g., Internet cafes, subsidiaries of offices, test halls
for product tests) and which offered the possibility to ‘intercept’ appropriate
shoppers/respondents walking in the street using street recruiters. Finally, in some countries a
hard-copy survey instrument was used, which was also administered through mall intercepts. The
hard-copy tool was designed so that the layout was exactly the same as in the Internet survey.
The number of respondents per country varied between 355 (U.K.) and 640 (Germany), but in
the U.S. the sample was considerably larger (1,181). Given the importance of the U.S., the
marketing research agencies wanted to have a larger sample for that country. The total number of
respondents is 12,022.

84
Measures
The questionnaire was developed in English and then translated into all local languages by
professional agencies. Next, the translated surveys were backtranslated into English, using native
speakers from the local countries. In each survey, modifications were made based on discussions
between the backtranslators, one of the authors, and the headquarters of the marketing research
agencies to maintain consistency across all countries.
SDR was measured using a subset of 20 items (10 impression management items and 10 self-
deceptive enhancement items) of the 40-item Balanced Inventory of Desirable Responding
(Paulhus 1991). Item selection was based on the magnitude of factor loadings, but potentially
offensive and/or in appropriate items were omitted (e.g., “I never read sexy books or magazines”
or “I am not a safe driver when I exceed the speed limit”) and an effort was made to retain the
balanced structure of the scale. Thus, we selected five positively and five negatively worded
items per SDR dimension. The market research agencies considered the full 40-item scale too
long and too costly to administer. Moreover, shorter scales decrease response fatigue, reduce
boredom, and increase cooperation (Burisch 1984). The average reliability across countries was
0.72, with a standard deviation of 0.05.
The Big Five factors were measured with 6 items each, based on Benet-Martínez and John
(1998). For each factor, we selected three highly loading positively and negatively worded items.
The average reliability was 0.66. Both the SDR and Big Five items were measured on five-point
Likert scales (1 = strongly disagree, 5 = strongly agree). Following Stöber, Dette, and Musch
(2002), continuous scoring was used for the SDR scale.
We also collected data on gender (coded 1 for women and 0 for men), age (in years),
education (no formal education, education up to age 12, 14, 16, 18, higher education, university),
social class (lower class, working class, lower-middle class, middle class, upper-middle class,
upper class), and household size. Ratings of each country on the four dimensions of national
culture were taken from Hofstede (2001).
Analytical Procedure
Received wisdom holds that before mean differences across countries and relations between
constructs can be examined in cross-national research, one must first establish that the measurement
instruments are cross-nationally comparable (Steenkamp and Baumgartner 1998). The multi-group
confirmatory factor analytic procedure is the standard method for assessing the cross-national

85
invariance of measurement instruments. Unfortunately, when the number of countries is large, even
partial measurement invariance is unlikely to be fulfilled, which renders the multi-group CFA
procedure problematic (Baumgartner 2004; Lubke and Muthén 2004). We use a new procedure
based on item response theory, which relaxes the condition of measurement invariance and
accommodates scale usage differences across countries (see De Jong, Steenkamp, and Fox 2007).
This procedure calibrates all latent scores for the constructs of interest on the same scale. Thus,
the scores are cross-nationally comparable even when there are differences in scale usage and
measurement invariance does not hold. See the Appendix for details on this measurement
procedure.
We use the latent scores in a multilevel model for SDR. Our conceptual framework of the
drivers of SDR involves variables at two levels of aggregation: the individual and the country
level. The levels are hierarchical in that respondents are nested within countries. Multilevel
modeling (Hox 2002; Raudenbush and Bryk 2002) has been specifically developed to deal with
nested data. It enables the simultaneous estimation of relationships of constructs at two (or more)
levels. It borrows strength from all the data in each of the countries, and makes it possible to
estimate cross-level effects, thus enabling us to test hypotheses about the moderating effect of
culture on the relationship between personality and SDR. More specifically, the level-1
(individual-level) and level-2 (country-level) models for testing the hypotheses are formulated as
follows:
Level-1:
(1) SDRij = β0j + β1jNij + β2jCij + β3j Aij + β4jEij + β5jOij + β6jGENDERij + β7jAGEij +
β8jEDUCij+ β9jSocClassij + β10jHHSizeij + rij
Level-2:
(2) β0j = γ00 + γ01 INDj + γ02 UAj + γ03 PDj + γ04 MASj + u0j
(3) β1j = γ10 + γ11 UAj + u1j
(4) β2j = γ20 + γ21 UAj + u2j
(5) β3j = γ30 + γ31 INDj + u3j
(6) β4j = γ40 + γ41 MASj + γ42 PDj + u4j
(7) βqj = γq0 + uqj for q = 5, …, 10

86
where i denotes individuals (i = 1,…, 12,022) and j countries (j = 1,..., 25); SDR refers to a
person’s latent score on socially desirable responding; N, C, A, E, and O indicate a person’s latent
score on neuroticism, conscientiousness, agreeableness, extraversion, and openness to
experience, respectively; GENDER, AGE, EDUC, SocClass, and HHSize represent the
sociodemographics gender, age, level of education, social class, and household size,
respectively; and IND, UA, PD, and MAS are national-cultural individualism, uncertainty
avoidance, power distance, and masculinity, respectively.
The individual-level error term rij is assumed to be normally distributed with zero mean and
variance σ2. The random effects uqj (q = 0, .., 10) are multivariate normally distributed over
countries, each with an expected value of zero, var(uqj) = τqq, and cov(uqj, uq′j) = τqq′ (q, q′ = 0, ..,
10). All level-1 coefficients are specified as random coefficients; that is, their effect is allowed to
vary across countries. The multilevel model was estimated using HLM 5 (Raudenbush, Bryk, and
Congdon 2000), using the latent scores for SDR and the five personality factors obtained from the
hierarchical IRT measurement model.
IV.4 RESULTS
Two sets of results will be presented in this section. First, we will report the tests of the
proposed hypotheses and the estimated effects of the demographics on SDR. Second, we will
briefly describe the findings when the two dimensions of SDR (impression management and self-
deceptive enhancement) are analyzed separately.
The effects of personality and culture on SDR
Before going into the specific hypothesized effects we estimate an unconditional random
intercept model, that is, a model with a random intercept and without individual-level or country-
level covariates. The intraclass correlation is 15.1%, indicating that a reasonably high portion of
variation in SDR is associated with differences between countries. When we add the Big-5
personality variables with random-effects specifications for the slope coefficients, 22.8% of the
variation in SDR at level-1 is explained. Next, the socio-demographic variables are introduced in
the model. These variables explain an additional 2.4% of the variance.
Finally, we include the cultural variables in the equations for the intercept and slope
coefficients, and specify fixed effects for slope coefficients that do not display significant variation
across countries (Raudenbush and Bryk 2002). Our cultural variables explain 26.1% of the
variation at level 2. The estimates of the individual-level effects, the national cultural effects, and

87
the cross-level interactions are reported in Table 1. Note that we report unstandardized
coefficients. In multilevel analyses, standardized coefficients are not used as the variance is
partitioned across different levels.
Table 1 ESTIMATION RESULTS
Independent variables Hypothe-
sized effect Unstand.
coefficient t-value P
Intercept (γ00) 0.5873 28.00 <.01 Main effects of Personality
Neuroticism (γ10) - -0.0745 -14.87 <.01 Conscientiousness (γ20) + 0.1326 22.60 <.01 Agreeableness (γ30) + 0.1125 12.91 <.01 Extraversion (γ40) + 0.0003 0.06 n.s. Openness (γ50) 0.0138 2.39 <.05
Main effects of National-cultural Dimensions
Individualism (γ01) - -0.0037 -3.56 <.01 Uncertainty avoidance (γ02) + 0.0013 1.62 <.10 Power distance (γ03) + 0.0020 2.09 <.05 Masculinity (γ04) + 0.0020 3.32 <.01
Cross-level interactions
Neuroticism × Uncertainty Avoidance (γ11) - -0.0001 -0.20 n.s. Conscientiousness × Uncertainty Avoidance (γ21) + 0.0006 2.91 <.01 Agreeableness × Individualism (γ31) - -0.0010 -2.61 <.01 Extraversion × Masculinity (γ41) + 0.0004 3.05 <.01 Extraversion × Power Distance (γ42) + 0.0007 3.62 <.01
Sociodemographics
Age (γ60) 0.0031 11.11 <.01 Gender (γ70) (1=women; 0=men) 0.0049 0.97 n.s. Education (γ80) 0.0043 1.58 n.s. Social Class (γ90) -0.0046 -2.51 <.01 Household Size (γ10,0) 0.0019 1.28 n.s.
Explained variance
Individual-level 25.2% Country-level 26.1%
a p-values are for one-sided tests when a hypothesis was stated. b n.s. = not significant (p > .10)

88
The role of personality. As hypothesized in H1a, H1b and H1c, neuroticism had a highly
significant negative effect (γ10 = -.0745, p < .01), and conscientiousness and agreeableness had
highly significant positive effects (γ20 = .1326, p < .01, and γ30 = .1125, p < .01, respectively), on
SDR. SDR was also positively affected by openness to experience (γ50 = .0138, p < .05), although
the magnitude of this effects was much smaller than that for the other significant personality
variables. Contrary to prediction, but not completely unexpectedly (see H1d), extraversion was
not significantly related to SDR (γ40 = .0003, n.s.). Overall, we find strong support for the cross-
national generalizability of relationships between personality and SDR for three of the five Big-
Five dimensions (conscientiousness, agreeableness, and neuroticism, in decreasing order of
magnitude).
The role of national culture. Consistent with H2a, we found that the degree of individualism
of a nation-culture had a negative effect on the extent of socially desirable responding (γ01 = -
.0037, p < .01). H2b proposed that national-cultural uncertainty avoidance would have a positive
effect on SDR. Support was found for this hypothesis, although the effect was a bit weaker than
for the other dimensions (γ02 = .0013, p<0.10). The main effect of national-cultural power
distance was positive and significant (γ03 = .0020, p < .05), which supports H2c. Finally, as
expected (H2d), SDR was higher in countries characterized by higher national-cultural
masculinity (γ04 = .0020, p < .01).
Interactions between personality and culture. Our framework also posits an important role of
national culture in moderating the effect of personality on SDR. H3 proposed that uncertainty
avoidance would strengthen the negative effect of neuroticism on SDR. However, no support
was found for this hypothesis (γ11 = -.0001, n.s.). As hypothesized in H4, the effect of
conscientiousness was stronger in cultures high on uncertainty avoidance (γ21 = .0006, p < .01).
Also as expected (H5), the positive effect of agreeableness on SDR was weaker when national-
cultural individualism was higher (γ11 = -.0010, p < .01). Finally, in support of H6a and H6b, the
effect of extraversion on SDR was stronger when national-cultural masculinity and national-
cultural power distance were higher (γ41 = .0004, p < .01, and γ42 = .0007, p < .01, respectively).
In summary, four of five hypotheses about the interactive effects of personality and culture were
supported.

89
Sociodemographics. Two main effects of the sociodemographics were strongly supported.
Specifically, older respondents were found to be much more likely to engage in socially desirable
responding than younger respondents (γ70 = .0031, p < .01). In addition, there was evidence that
individuals from lower social strata of society have a greater tendency to distort their answers in a
socially desirable direction (γ90 = -.0046, p < .01).
IM and SDE as separate dimensions of SDR
As mentioned earlier, Paulhus (1984; 1991) distinguished between two components of SDR,
namely, impression management and self-deceptive enhancement. Our hypotheses were
developed for the overarching SDR construct rather than for the specific dimensions. Combining
impression management and self-deceptive enhancement also leads to more reliable SDR scores,
which capture the entire domain rather than only one component. This procedure is also
consistent with other work that focuses on SDR per se, which often uses the major alternative to
the Paulhus scale, the Marlowe-Crowne scale. The latter scale loads on both the impression
management and self-deception factors (Paulhus 1984).
However, as a robustness check, and to examine whether major new insights emerge when
the two components of SDR are considered separately, we estimated equations (1) – (7) using
respondents’ scores on impression management (IM) and self-deceptive enhancement (SDE) as
criterion variables. The results were highly stable across the two dimensions of SDR, although
the p-values were sometimes lower. This is not unexpected, given the lower reliabilities for the
two subscales. The correlation between the (unstandardized) path coefficients for SDR
(combined scale) and IM was .992, while the correlation between the coefficients for SDR and
SDE was .978. The correlation between the coefficients for IM and SDE was .953. Finally, the
correlation between the latent IM and SDE scores was 0.316.
However, there were two notable exceptions to the general stability of the results across the
two SDR operationalizations. First, extraversion had a significantly positive effect on SDE (γE,SDE
= .0225, p < .01), while the effect on IM was significantly negative (γE,IM = -.0252, p < .01).
This finding is partly consistent with prior research showing that extraversion is primarily related
to SDE (e.g., Barrick and Mount 1996; Pauls and Stemmler 2003).
Second, while the effect of gender on overall SDR was not significant, we did find significant
but opposing effects for the two SDR components. A cross-nationally generalizable finding is
that, on average, men are higher than women on self-deceptive enhancement (γGend,SDE= -.0133, p

90
< .01), while women are higher on impression management (γGend,IM = .0385, p < .01). These
results are consistent with earlier work reporting significant gender differences in the tendency to
exhibit IM and SDE response styles (Paulhus 1991).
IV.5 DISCUSSION
In this paper, we examined the antecedents of SDR, one of the most important response
biases in marketing surveys, in a truly global setting. We proposed and tested a framework (see
Figure 1) in which respondents’ tendency to provide socially desirable responses was hypothesized
to be affected by their personality and sociodemographics, the culture in which they live, as well
as the interplay between personality and culture. Drawing on insights from personality research
and culture theory, specific hypotheses were developed to operationalize this framework. The
hypotheses were tested across 25 countries, using large representative samples of consumers, thus
allowing for a strong test of the empirical generalizability of our findings in an international
context. In general, our findings supported the proposed hypotheses.
People’s tendency to provide socially desirable answers was systematically affected by their
personal makeup. SDR increased with conscientiousness and agreeableness, and decreased with
neuroticism. Openness to experience also had a small positive effect on SDR, but the effect of
extraversion was nonsignificant. In addition, national-cultural dimensions played a prominent
role. Respondents in individualistic countries were less likely to engage in socially desirable
responding, while respondents in high power distance, uncertainty avoiding, and masculine
countries tended to exhibit a greater degree of socially desirable responding.
Most importantly, a nation’s culture systematically moderated the effects of the personality
dimensions on SDR. The positive effect of conscientiousness on SDR was stronger in countries
high on uncertainty avoidance, whereas an individualistic cultural environment reduced the
positive effect of agreeableness on SDR (or conversely, collectivism strengthened the effect of
agreeableness on SDR). Although the main effect of extraversion on SDR was nonsignificant,
this personality factor was involved in two significant interactions with national-cultural power
distance and masculinity. Both dimensions of cultural variation enhanced the effect of
extraversion on SDR. Overall, the moderating role of culture is clearly illustrated by our finding
that the effect on SDR of three of the five personality factors depended on the national-cultural
context in which a person lives.

91
We also found several interesting effects for the sociodemographics. SDR was lower among
younger people and among persons from higher social classes. Furthermore, although SDR did
not differ by gender, men were higher on self-deceptive enhancement, while women were higher
on impression management. The other sociodemographics did not exert a cross-culturally
generalizable effect on SDR in our study.
Two hypotheses were not supported. First, the effect of extraversion was completely
moderated by the country context, in the sense that the predicted main effect of extraversion was
not significant, even though the interactions of extraversion with masculinity and power distance
were (i.e., extraversion had a more positive effect on SDR in masculine and high power distance
cultures, as predicted). Our follow-up analyses showed that extraversion had a significant
positive effect on self-deceptive enhancement and a significant negative effect on impression
management. This result is partially consistent with recent theorizing by Paulhus (2002) and
empirical evidence by Pauls and Stemmler (2003) that SDE is indicative of (unconscious)
egoistic bias, which is related to extraversion.
Second, no support was found for the interaction between neuroticism and uncertainty
avoidance. Although neuroticism had a strong negative influence on SDR, this effect was not
moderated by a culture’s degree of uncertainty avoidance, even though neuroticism at the
individual level and uncertainty avoidance at the cultural level are strongly linked. Uncertainty
avoidance basically reflects anxiety about unstructured situations and a preference for rules and
structures that ensure that such situations do not arise. It is possible that uncertainty avoidant
cultures do not reinforce neurotic tendencies of lack of concern for one’s public image and lower
self-esteem in general but instead encourage caution and compliance with rules, as expressed in
H4 and confirmed by the significant interaction of conscientiousness and uncertainty avoidance.
In sum, the results provide broad support for our conceptualization and the relevance of the
different types of variables included in the proposed framework for understanding the construct
of SDR. Multiple personality dimensions as well as sociodemographics exerted significant effects
on SDR. The findings of the present study also underline the important role of national-cultural
variables in explaining systematic differences in SDR between countries. In particular, our results
suggest that it is important to consider the joint effect of personality and culture on SDR since
culture moderated the effects of personality on SDR. This shows that combining variables from
the macro-level of national cultures and the micro-level of individuals’ personality in an
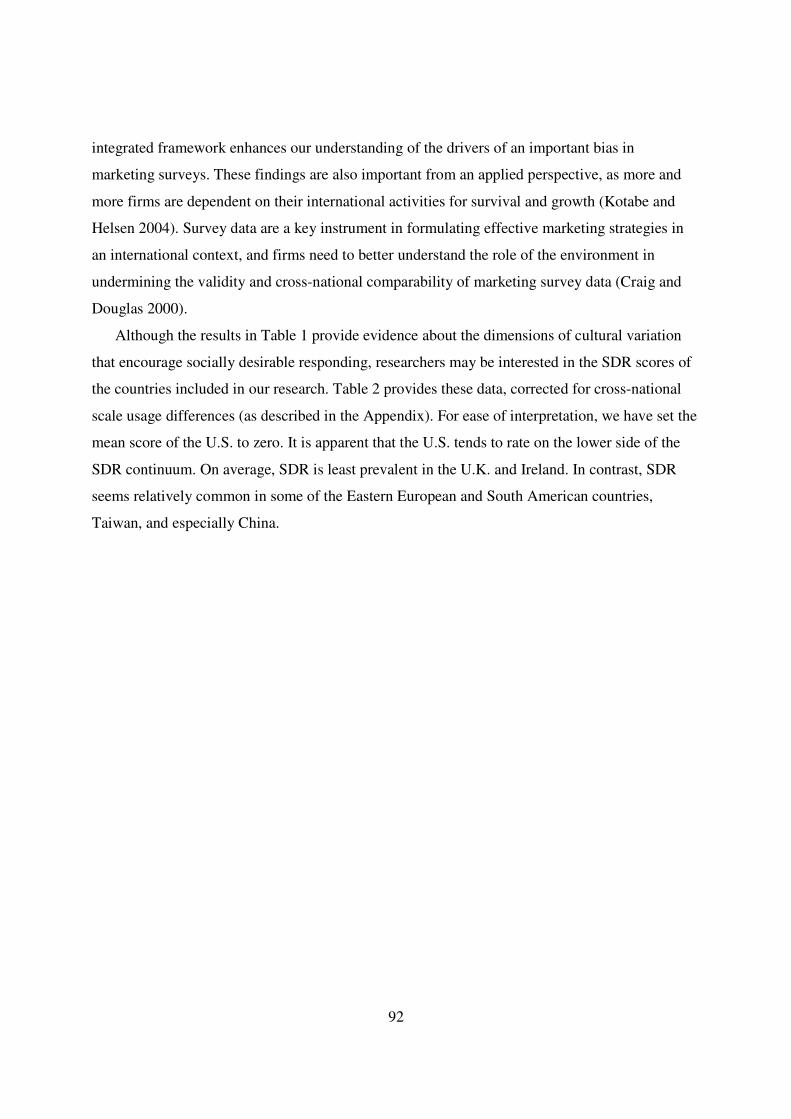
92
integrated framework enhances our understanding of the drivers of an important bias in
marketing surveys. These findings are also important from an applied perspective, as more and
more firms are dependent on their international activities for survival and growth (Kotabe and
Helsen 2004). Survey data are a key instrument in formulating effective marketing strategies in
an international context, and firms need to better understand the role of the environment in
undermining the validity and cross-national comparability of marketing survey data (Craig and
Douglas 2000).
Although the results in Table 1 provide evidence about the dimensions of cultural variation
that encourage socially desirable responding, researchers may be interested in the SDR scores of
the countries included in our research. Table 2 provides these data, corrected for cross-national
scale usage differences (as described in the Appendix). For ease of interpretation, we have set the
mean score of the U.S. to zero. It is apparent that the U.S. tends to rate on the lower side of the
SDR continuum. On average, SDR is least prevalent in the U.K. and Ireland. In contrast, SDR
seems relatively common in some of the Eastern European and South American countries,
Taiwan, and especially China.

93
Table 2 Country Scores on SDR
Country
SDR
UK -.188 Ireland -.181 Germany -.111 Switzerland -.107 Thailand -.099 Denmark -.058 Austria -.049 Norway -.035 Belgium -.022 France -.010 USA .000 Netherlands .001 Czech Rep. .022 Russia .022 Spain .079 Portugal .080 Italy .090 Ukraine .117 Brazil .132 Argentina .179 Romania .184 Hungary .188 Taiwan .198 Poland .226 China .295
Future research
Future research could go in several directions. Our framework should be tested in other
countries as well. Most notably, African countries were missing in our study. Our conceptual
model may be extended by introducing subculture dimensions. A subculture preserves the
important patterns of the national culture, but also develops its own unique patterns of
dispositions and behavior through a specific set of shared norms and beliefs.
Our work shows that SDR is a stable characteristic of people, related to basic personality
traits as well as age and one’s social standing in society, and the culture in which one lives. As
such, it cannot be expected that socially desirable responding can be completely eliminated from
marketing surveys (Mick 1996). However, marketing researchers can do at least two things to

94
reduce its biasing influence. First, any stable characteristic of people may be more or less
activated in specific situations. How can we minimize the expression of SDR in marketing
surveys? In the literature, researchers have suggested methods such as indirect questioning
(Fisher 1993), the randomized response technique (Fox 2005c), and assuring respondents
anonymity (Mick 1996). More research is needed to assess the effectiveness of these
recommendations in the U.S. and elsewhere (e.g., is assurance of anonymity equally effective in
individualistic and collectivistic cultures?). New methodological developments in the randomized
response technique proposed in the educational area look especially interesting for marketing
research. For example, Fox (2005c) has developed a randomized response model that guarantees
anonymity at the item-level through randomization, but by using multiple intercorrelated items
one can make individual-level inferences at the construct level. Future research could also
examine other ways to reduce the expression of SDR in marketing surveys. For example, does the
extent of socially desirable responding differ between telephone, mail, Internet, and face-to-face
surveys?
A second way in which marketing researchers can reduce the biasing influence of socially
desirable responding is to control for this bias after the data have been collected. This requires
two things, both of which offer avenues for future research. First, an SDR measurement
instrument could be included in the survey. All too often, this is not done, even in academic
research. For example, only 12 percent of the scales included in the seminal Handbook of
Marketing Scales (Bearden and Netemeyer 1999) report evidence on social desirability. It is safe
to assume that this percentage will be even lower in applied marketing research. A review of two
decades of published marketing research reveals that SDR has been consistently neglected in
scale construction, evaluation, and implementation (King and Bruner 2000). We believe a major
reason is that SDR scales are too long. Consider Paulhus’ (1991) Balanced Inventory of Desriable
Responding, arguably the standard for measuring SDR. Even our subset of 20 items is too long
for most marketing research applications. Adding non-substantive items to a survey is costly,
both in terms of money and respondent fatigue. It is often difficult to get marketers to pay for so
many additional survey items which will be used “solely” for estimating socially desirable
response tendencies. Research is therefore needed to develop and rigorously validate short forms
of the Paulhus scale. Recent work by Bearden, Manning, and Tian (2004), who developed a 9-

95
item short-form for measuring SDR in business contexts, is an important step in the right
direction.
If an SDR scale is included in the survey, the next issue is how to control for SDR in one’s
analyses. A common way to do this is to correlate the substantive constructs with SDR, and the
researcher hopes that the resulting correlations will be small (King and Bruner 2000). However,
this procedure may seriously underestimate the biasing influence of SDR since it fails to
distinguish between SDR bias at the measurement level from SDR bias at the construct level, and
it ignores measurement error in SDR and the substantive constructs involved (Podsakoff et al.
2003). Future research should simultaneously estimate the structural relations among the
substantive constructs and the measurement model, where each item is modeled as a function of a
substantive construct and SDR. Resultant construct scores and relations among substantive
constructs are corrected for the biasing influence of SDR. In sum, although important issues
remain for future research, we hope that researchers will take our lead and make SDR the
substantive focus of some of their substantive and methodological work.

96
IV.6 APPENDIX
A suitable IRT model for ordinal 5-point Likert data of the kind used in our survey is the graded response model (Samejima 1969). If we index countries by j, j=1,…,J , and denote by l
ijkx the observed response on item k of construct l for respondent i in country j, a hierarchical IRT measurement model can be formulated as:
)()(),,,|( ,1,1,,l
ckjlij
lkj
lckj
lij
lkj
lckj
lckj
lkj
lij
lijk aaacxP γξγξγγξ −Φ−−Φ== −− (A1)
CcNee llckj
lckj
lck
lckj k
,,1for ),0(~, )(2,,,, =+= γσγγ , l
Ckjlkj 1,1, −≤≤ γγ (A2)
2( ), ~ (0, )k
l l l l lkj k kj kj aa a r r N σ= + (A3)
),0(~, )(2 lj
lij
lij
lj
lij N συυξξ += (A4)
),(~ )(2 lllj N τξξ (A5)
where Φ(.) is the standard normal cumulative distribution function. Equation (1) specifies the conditional probability of a person i in country j, responding in a category c (c=1,…,C) on item k of construct l, as the probability of responding above c-1, minus the probability of responding above c. The parameter l
kja is called the discrimination parameter for item k of construct l in country j, and is conceptually similar to a factor loading in CFA settings. The scale thresholds
lckj ,γ are measured on the same scale as l
ijξ and determine the difficulty of responding above a
certain response category c. The threshold lckj ,γ is defined as the value on the l
ijξ scale so that the probability of responding above a value c is .5, for c=1,…,C-1. In (A2), one can put
∞=−∞= lCkj
lkj ,0, , γγ , so that only the thresholds for the categories 1 through C-1 need to be
considered. Equation (A2) indicates that each scale threshold l
ckj ,γ for a particular item k in country j is
modeled as an overall mean threshold lck ,γ , plus a country-specific deviation l
ckje , . Thus, scale usage differences across countries are accommodated. Analogously, equation (A3) posits that the discrimination parameter l
kja is the sum of an overall mean discrimination parameter and country-specific deviation.
Equations (A4) and (A5) model the country heterogeneity of the latent variable with random-effects structures. In other words, the position on the latent scale for respondent i in country j on construct l is sampled from the country average l
jξ with variance )(2 ljσ . The country average is
drawn from a distribution with average ξl and variance τ2(l). Estimation of the hierarchical IRT model is demanding because of the large number of
parameters and model complexity. Using data augmentation, an 8-step Gibbs sampler with a Metropolis-Hastings step for the order-constrained thresholds can be constructed, with item parameter restrictions in each country to identify the model. We refer to De Jong, Steenkamp, and Fox (2007) for further details.

97
Chapter 5
Construction of Country-Specific, Yet Internationally Comparable Short Form Marketing Scales
Abstract: The increasing trend toward the globalization of business implies that the world is rapidly becoming an interdependent marketing system, providing a compelling reason for developing global theories and for studying associated methodological challenges. Cross-national research presents researchers with a host of methodological challenges that hamper validity. An issue that has received only limited attention to date has to do with designing cross-national measurement instruments. We develop a procedure that yields fully country-specific, yet cross-nationally comparable short form marketing scales. The procedure is based on a combination of a two powerful psychometric tools: a hierarchical item response theory model and optimal test design methods. In the empirical part, our procedure is applied to the impression management (IM) scale, yielding country-specific yet cross-nationally comparable short-form scales in 28 countries of the world.
This chapter is based upon a paper with the same title authored by Martijn G. de Jong, Jan-Benedict E.M. Steenkamp and Bernard Veldkamp. We thank AiMark for providing the data.

98
V.1 INTRODUCTION
It has been recognized that consumer behavior and marketing theories are frequently
dependent on socioeconomic, institutional and cultural contexts (Maheswaran and Shavitt 2000).
The increasing trend toward the globalization of business implies that the world is rapidly
becoming an interdependent marketing system, providing a compelling reason for developing
global theories and for studying associated methodological challenges (Winer 1998). Indeed,
various researchers have called for “exploration of cross-cultural dynamics” (Bagozzi 1994), or
have pressed for a need to “move out of the U.S. silo and conduct more research on an
international basis” (Steenkamp 2005).
Many current theoretical frameworks remain to be validated across cultures. One important
force that stymies the comparison of findings across countries is methodological in nature. Cross-
national research presents researchers with a host of methodological challenges that hamper
validity, such as response styles, measurement invariance, and wording issues (Baumgartner and
Steenkamp 2001; De Jong, Steenkamp, and Fox 2007; Durvasula et al. 1993; Van de Vijver and
Leung 1997; Wong et al. 2003). An additional research challenge that has received only limited
attention to date has to do with designing cross-national measurement instruments (Steenkamp
2005).
Many of the popular marketing and consumer behavior scales included in the Handbook of
Marketing Scales (Bearden and Netemeyer 1999) consist of too many items for effective
administration, especially in non-student settings and in applied marketing research (cf. Richins
2004). Several authors have also noted that many established measurement instruments are
simply too long to be useful in international marketing research (Steenkamp 2005, Tellis, Yin and
Bell 2005).
Apart from scale length, it is not known whether the psychometric properties of the items
remain invariant across nations. It might well be that items suited to measure a construct in a
particular country such as the U.S. are not suited in other countries with different cultural norms.
Culture is an important force affecting behaviors, perceptions and cognitions (Markus and
Kitayama 1991), and measurement properties of items may be influenced by cultural factors.
Ideally, researchers would use country-specific short forms, consisting of good items in each
country. That is, items would be different across countries, whilst retaining the important feature
of cross-national comparability. Unfortunately, methodological limitations have prevented the

99
realization of this ideal state of affairs. The current chapter contributes to the marketing literature
by developing a procedure that yields fully country-specific, yet cross-nationally comparable
short form marketing scales. The procedure is based on a combination of two powerful
psychometric tools: hierarchical item response theory (HIRT; De Jong, Steenkamp and Fox
2007) and optimal test design methods (OTD; Van der Linden 2005). HIRT models have only
been recently introduced in marketing, while OTD methods have not been used in marketing. The
unique merger of these tools lies at the heart of our proposed methodology.
The set-up of this chapter is as follows. First, we briefly discuss key differences between item
response theory and classical test design. Next, short-form scale construction is discussed using
OTD and it is shown how this can be applied in international contexts. In the empirical part, our
procedure is applied to the impression management (IM) scale (Paulhus 1984), yielding country-
specific yet cross-nationally comparable short-form scales in 28 countries of the world.
V.2 SCALE CONSTRUCTION IN INTERNATIONAL MARKETING RESEARCH
Emic versus etic
Two measurement schools can be distinguished in international marketing research, viz., the
‘emic’ school and the ‘etic’ school (Craig and Douglas 2001, Kumar 2000). Emic researchers
reject the notion of cross-national measurement. They argue that marketing phenomena are
specific to each culture. They favor within-culture approaches, i.e., separately studying
phenomena in each culture. For measure construction, this implies that one develops a unique
scale in each country, at the expense of cross-national comparability. The emic researcher cannot
compare respondents in different countries because the scales are completely country-specific. As
there are 200 countries in the world, and even more cultures, this means that scale development
effort is humongous and since results are country-specific and not comparable across countries,
empirical generalizations are problematic, if not impossible. This poses a serious challenge to
marketing as academic discipline. Apart from using the scientific method, marketing’s claim to
be a science is grounded in its ability to develop empirical generalizations (Hanssens, Parsons,
and Schultz 2001). Indeed, “empirical generalizations are the building blocks of science” (Bass
and Wind 1995, p. G1).
Etic researchers usually assume universal applicability of constructs and their measurement
instruments. Theoretical constructs are universal, and cross-nationally validated with the same

100
measurement instrument across countries. In the etic philosophy, cross-national comparisons are
entirely justified and can form the basis for empirical generalizations. Hence, it is not surprising
that the etic perspective is the dominant paradigm in international marketing research. However,
etic studies lead to invalid conclusions if, in fact, items suited to measure a latent construct in one
country, may not necessarily be useful in other countries. It could very well be that idiosyncracies
of a culture dictate that the same construct be measured with different items, which is in line with
the emic school of thought.
Researchers have acknowledged the problems with so-called ‘imposed etic’ scales.
Baumgartner and Steenkamp (1998) propose the use of imaginary indicators and constructs to
accommodate both group-specific and common items in a multi-group confirmatory factor
analysis framework. Comparisons between countries are based on the common items. The
approach proposed by May (2005) uses item response theory, and allows researchers to collect
different items in different countries, as long as there are also common items.
Both the Baumgartner and Steenkamp (1998) and the May (2005) approach to overcome the
imposed etic problem suffer from several limitations. First, in both approaches measurement
invariance must be imposed for the common items. In settings with many countries, as well as in
settings invariance is unlikely to be satisfied for any item (Baumgartner 2004). Moreover,
measurement invariance is also unlikely to be fulfilled for short scales as there are simply fewer
items that might be invariant, while shorter scales are actually preferred in international
marketing research (Tellis, Yin, and Bell 2005).
Second, when working with a short-form scale, neither approach allows the researcher to
select an optimal set of items for each country. To date, international marketing researchers
typically construct a short-form scale on an ad-hoc basis, by selecting items that exhibited high
factor loadings in previous research, conducted in other countries (typically limited to the U.S.).
(e.g., Batra et al. 2000, Ter Hofstede, Steenkamp, and Wedel 1999, Ter Hofstede, Wedel, and
Steenkamp 2002).
We propose a pseudo emic method to international marketing research to address the
limitations of existing approaches to scale construction for international marketing research. We
start from a set of items where at least a set of items overlaps across countries, calibrate a
hierarchical item response theory model, and select ‘optimal’ items in each country, according to
criteria that can be set by the researcher. None of the items need to be invariant across countries.

101
Moreover, no cross-nationally common set of (core) items is required and the country-specific
scales can be of different length. However, we can still make cross-national comparisons. The
method is ‘pseudo emic’: it approximates the emic ‘ideal’ in that sets of items can be completely
different across countries, but does require that we start from a larger pool of common items.
This pool of items may either be developed based on qualitative research, preferably conducted in
multiple countries, and/or may be based on existing marketing scales (Bearden and Netemeyer
1999).
Item response theory versus classical test theory for scale construction
As mentioned, our model is based on item response theory (IRT; Lord and Novick 1968).
Although less well known in marketing than Classical Test Theory (CTT; Churchill 1979;
Nunnally 1978), in psychometrics IRT has largely replaced CTT as the dominant measurement
paradigm. This is due to several important advantages of IRT vis-à-vis CTT. First, CTT uses
inter-item and item-total correlations to assess measurement error. Reliability is assessed using
Cronbach’s alpha, which is a single number that assesses the average measurement precision for
all respondents and scale items. Thus, the measurement error is assumed to be constant over all
attitude levels. In IRT, measurement error is allowed to vary across levels of the underlying
construct.
Second, Cronbach’s alpha is a joint property of all items in the scale and the particular
individuals sampled. In cross-sectional data, individual items cannot be generally indexed by a
reliability measure. When items are added to or dropped from a scale in CTT, the usefulness of
each item to the quality of the scale will change. In IRT, items contribute independently to
measurement precision. When measurement precision is not sufficiently accurate at certain levels
of the construct, items can be added that increase the precision at those levels. A key advantage
of this additive property is that the effect of an item, and its impact on the scale is easily
determined.
Third, estimates of Cronbach's alpha are likely to vary across samples since alpha is a
function of observed variance, which in turn is a function of sample homogeneity (Duhachek,
Coughlan, and Iacobucci 2005). In IRT, the measurement precision of items is theoretically
invariant from sample to sample, because the precision implied by items depends solely on
sample invariant item parameters.

102
Finally, to allow comparisons among respondents, the CTT approach dictates that all
respondents answer all items. IRT has item-free calibration which implies that respondents who
have answered different questions can still be compared, provided that the items have all been
calibrated onto a common scale and are stored in an item bank that contains the item parameters
describing the items. The unique item-free calibration feature of IRT will be of paramount
importance for constructing country-specific scales, whilst retaining comparability.
V.3 A MODEL FOR THE CONSTRUCTION OF SHORT-FORM MARKETING SCALES
In this section, we first discuss the ‘backbone’ of our model, viz., Samejima’s graded
response IRT model. Next, we elaborate on item information functions, which can be derived
from the Samejima model and which form the basis of construction of a short-form versions of
scale, using optimal test design techniques. The model development in this section is for one
country only, and is useful for ‘domestic’ researchers interested in developing short-forms of
marketing scales, e.g., for use in general populations, where respondent participation and costs of
data collection are relevant considerations. Subsequently, in the next section, we extend this
model to the international context, allowing for the construction of derived emic scales that can
be used in cross-national research, yet yielding scores that can be compared across countries.
Samejima’s graded response IRT model
Our point of departure is a set of items, rated on Likert items, arguably the standard scale
format for marketing scales (Bearden and Netemeyer 1999). The most suitable IRT model for
such data is Samejima’s graded response model (Samejima 1969). The graded response model is
an ordinal data model that models the probability that respondent i answers category c on item k,
as a function of an item-specific discrimination parameter ak, thresholds γk, and a latent trait ξi.
Mathematically:
)()(),,,|( ,1,1,, ckikckikckckkiik aaacxP γξγξγγξ −Φ−−Φ== −− (1)
A graph is shown in Figure 1 to illustrate how the model works for a hypothetical 5-point scale
with ak=1, γk1=-3, γk2= -1, γk3=1, γk4=3 (note that γk0=-∞ and γk5=∞).

103
Figure 1 Category response functions
As can be seen, the probability of category one (five) goes down (up) as the latent trait increases,
while the probabilities for the other categories follow a bell shape, with a maximum probability
between two threshold values. The thresholds are measured on the same scale as the latent trait ξ
and determine the intersection points of the category response functions. The discrimination
parameter ak determines the steepness of the curves, that is, the sensitivity to variation around
inflection point (determined by the threshold parameter) of item response curves. Items with a
very low discrimination parameter have category response curves that are almost horizontal
rather than bell-shaped, indicating that the item cannot discriminate among respondents high and
low on the latent trait.
The key advantage of IRT is item-free calibration. Respondents who answer different items
can still be compared and are on the same latent scale when in a previous run, items have been
calibrated jointly. This is in sharp contrast with CTT where the scores of individuals are only
comparable if the same set of items has been answered.
Item information functions
Measurement accuracy in IRT is based on the notion of information. The information
function I(ξ) is the inverse of the asymptotic variance of a maximum likelihood estimator ξ , and
defined as I(ξ)=–E[∂2/∂ξ2lnL(x|ξ)]. Now, the category information function Ikc(ξ) is defined as
(Samejima 1969):
),,,|(
/),,,|(
),,,|(
]/),,,|([)(
1,,
21,,
2
21,,
21,,
−
−
−
−
=∂=∂
−=
∂=∂=
ckckkiik
ickckkiik
ckckkiik
ickckkiikikc acxP
acxP
acxP
acxPI
γγξξγγξ
γγξξγγξ
ξ (2)

104
These functions can be merged to yield the item information function Ik(ξ):
= −
−−
= =∂=∂
===C
c ckckkiik
ickckkiikckckkiik
C
cikcik acxP
acxPacxPII
1 1,,
21,,
1,,1 ),,,|(
]/),,,|([),,,|()()(
γγξξγγξ
γγξξξ (3)
The Scale Information Function (SIF) is simply the sum of the item information functions Ik(ξ). It
is a nonlinear function of the latent variable. As an example, we plot a SIF in Figure 2 for a
hypothetical 2-item scale, where the item parameter specifications are a1=0.9, γ11=-3, γ12= -0.2,
γ13=0.7, γ14=4 and a2=1.5, γ21=-3, γ22= -0.2, γ23=0.7, γ24=4. In practice, the threshold parameters
will also vary from item to item, and the configurations merely serve as an illustration. Also
displayed are the item information functions (IIF), denoted that jointly determine the SIF.
Figure 2 INFORMATION FUNCTIONS
The SIF has various interesting features. First, note that the contribution of each item to the SIF is
additive. In Figure 2, the plot for the total scale information is obtained by simply summing the
two item information functions. The general level of information for the total scale will be higher
than for individual items. When measurement precision is not accurate enough at certain levels of
the latent variable, items can be added with threshold values that equal those levels. This way, the
SIF is increased at those levels. Naturally, the amount of information, and thus the precision,
increases as the number of items to measure ξ increases. A key advantage of the additive property
is that the effect of an item, and its impact on the scale is easily determined.
Second, note that measurement precision of the scale varies along the trait range. In Figure 2,
the scale provides most accurate measurement around trait values that are equal to the thresholds.

105
However, when a respondent is located at the extremes of the ξ distribution, measurement
precision is much less. In IRT, measurement precision is defined locally, that is, measurement
precision is not the same for each level of the latent variable.
Third, it can be seen that the amount of information for a particular item is symmetric around
the maxima attained at the threshold parameters. Items are most informative when the threshold
parameters match a respondent's ξ value. In addition, the maximum value is approximately
proportional to the square of the item discrimination parameter. The larger the value of ak, the
greater the information.
Scale construction using optimal test design
The standard (CTT) way to construct short forms is to select items with the highest factor
loadings (Bollen and Lennox 1991). This way, the loss in internal consistency reliability is
minimized, even though the bandwidth of the construct might be compromised. That is, it could
be that only accurate measurement is provided for certain attitude levels, with low precision at
other levels. IRT is much more advanced in this respect, as both bandwidth and fidelity
(measurement accuracy) can be monitored (Singh 2004). If bandwidth should be maintained,
items should be selected that provide accurate measurement at different grid-points along the
latent scale. On the other hand, when the goal is to maximize precision for particular levels of the
construct, items that are informative at that level should be chosen. In other words, an optimal
short form can be constructed depending on the wishes of the researcher. This is a key advantage
of IRT.
There are many substantive situations in which researchers might be interested to vary
measurement precision across the range of the underlying construct. To illustrate, consider the
construct customer satisfaction. Satisfaction has been linked to key outcome variables like loyalty
and profitability, but the effect is not linear over the range of the construct (Gupta and Zeithaml
2006). Whether the customer is dissatisfied or extremely dissatisfied is managerially not really
relevant. On the other hand, whether a customer is very satisfied or extremely satisfied can have a
large effect on e.g., loyalty. Hence, it is much more important to measure the latent construct of
satisfaction very precisely at high levels of satisfaction than at low levels of satisfaction.
The process of selecting items subject to various constraints with some target information
function for the measure in mind can be formalized to yield a combinatorial optimization

106
problem. In the psychometric literature, test construction using optimization is known as optimal
test design (OTD).
Optimal Test Design
The first step is to specify a target information function (TIF) for the scale. For instance, if the
goal would be to have uniformly good measurement with information level Iunif along the trait
range, then a possible target could be curve 1 in Figure 3.
Figure 3
TARGET INFORMATION FUNCTIONS
If the goal would be only to have accurate measurement for most respondents, assuming a
bell-shaped normal distribution for ξ with mean ξ0, a target could be curve 2. Finally, target 3
would be suited to have high measurement precision at low (ξlo) and high values (ξhi) of the latent
variable. Note that the specification of different shapes of the TIF allows much more flexibility
than in CTT where only Cronbach’s alpha is usually considered. Using IRT, measurement
precision can be specified in a variety of ways, depending on what the researcher wants to
measure.
Next, a distinction is made between two types of test specifications (Van der Linden 1998):
1) Constraints. Constraints require a scale attribute or a function of item attributes to meet an
upper and/or lower limit. They can be formulated as mathematical inequalities.
2) Objectives. Objectives require a scale attribute or function of item attributes to take a
minimum or maximum value. They can be formulated as mathematical functions to be
optimized.
ξ
I(ξ)
1
2
3
ξlo ξhi
Iunif
ξ0 ξ
I(ξ)
1
2
3
ξlo ξhi
Iunif
ξ0 ξ
I(ξ)
1
2
3
ξlo ξhi
Iunif
ξ0
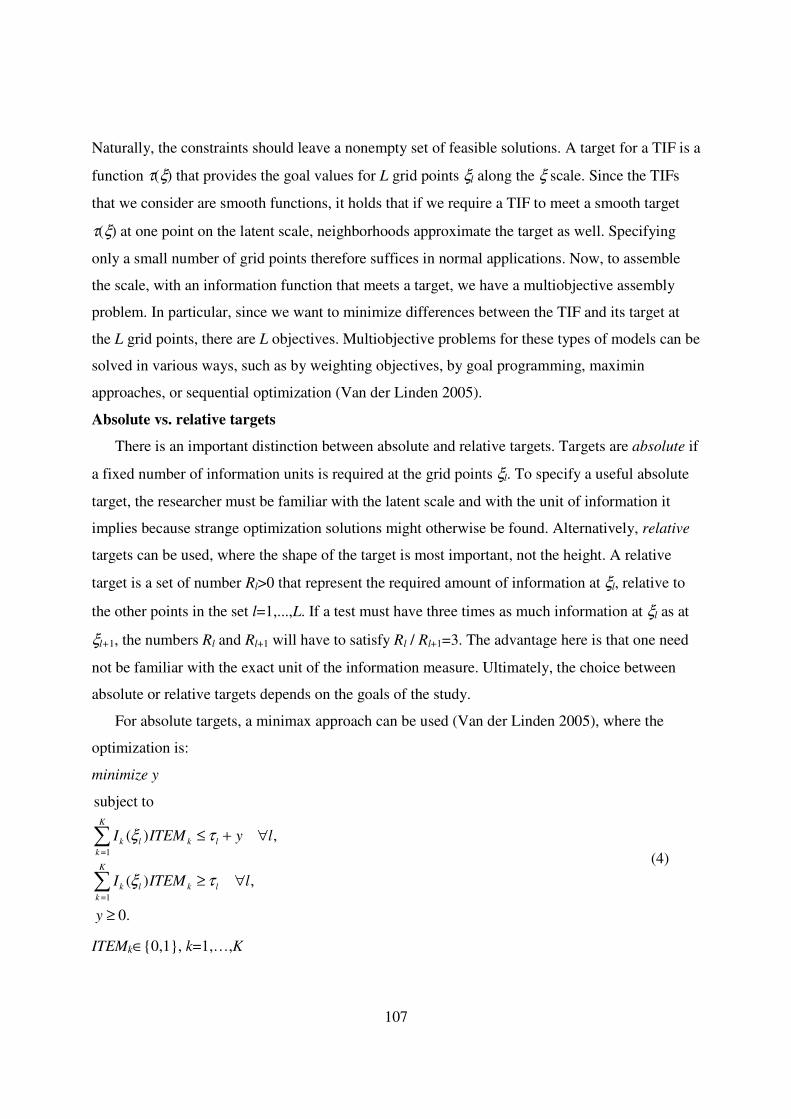
107
Naturally, the constraints should leave a nonempty set of feasible solutions. A target for a TIF is a
function τ(ξ) that provides the goal values for L grid points ξl along the ξ scale. Since the TIFs
that we consider are smooth functions, it holds that if we require a TIF to meet a smooth target
τ(ξ) at one point on the latent scale, neighborhoods approximate the target as well. Specifying
only a small number of grid points therefore suffices in normal applications. Now, to assemble
the scale, with an information function that meets a target, we have a multiobjective assembly
problem. In particular, since we want to minimize differences between the TIF and its target at
the L grid points, there are L objectives. Multiobjective problems for these types of models can be
solved in various ways, such as by weighting objectives, by goal programming, maximin
approaches, or sequential optimization (Van der Linden 2005).
Absolute vs. relative targets
There is an important distinction between absolute and relative targets. Targets are absolute if
a fixed number of information units is required at the grid points ξl. To specify a useful absolute
target, the researcher must be familiar with the latent scale and with the unit of information it
implies because strange optimization solutions might otherwise be found. Alternatively, relative
targets can be used, where the shape of the target is most important, not the height. A relative
target is a set of number Rl>0 that represent the required amount of information at ξl, relative to
the other points in the set l=1,...,L. If a test must have three times as much information at ξl as at
ξl+1, the numbers Rl and Rl+1 will have to satisfy Rl / Rl+1=3. The advantage here is that one need
not be familiar with the exact unit of the information measure. Ultimately, the choice between
absolute or relative targets depends on the goals of the study.
For absolute targets, a minimax approach can be used (Van der Linden 2005), where the
optimization is:
minimize y
=1
=1
subject to
( ) ,
( ) ,
0.
K
k l k lk
K
k l k lk
I ITEM y l
I ITEM l
y
ξ τ
ξ τ
≤ + ∀
≥ ∀
≥
(4)
ITEMk∈0,1, k=1,…,K

108
ITEMk is an indicator (1: item k included in the scale, 0: item not included in the scale). In this
formulation, the TIF is larger than the target values while y is defined as the upperbound to all
positive deviations from these values. Alternatively, if negative deviations from the target are
also deemed undesirable, the second constraint can be replaced by ( )k l k lI ITEM y lξ τ≥ − ∀ .
Note that many additional constraints can be added to the set of constraints. For instance, if we
would require that only items can be selected with maximally 6 words, then we could add the
constraint: ITEMkWk ≤ 6, where Wk denotes the number of words for item k.
For relative targets, the formulation changes. The height of the target is maximized at each
grid point, and at the same time, the relative shapes of the TIF must be maintained, leading to an
additional set of constraints. Because there is no fixed unit, Rl can be set equal to 1, while
adjusting the other values accordingly. If R1=1, we should then have L-1 constraints that require
the TIF at ξl to be Rl times as large as at ξl, resulting in the constraints
1( ) ( )k l k l k kI ITEM R I ITEMξ ξ= for l>1. This leaves only 1 objective, so that the total
optimization problem is
maximize 1( )k kI ITEMξ
subject to
1( ) ( ) 2k l k l k kI ITEM R I ITEM lξ ξ= ∀ ≥ (5)
ITEMk∈0,1, k=1,…,K
Unfortunately, the equality constraints in the first set of constraints may easily yield infeasible
solutions. It is therefore better to use a maximin formulation:
maximize y
=1
subject to
( ) ,
0.
K
k l k lk
I x R y l
y
ξ ≥ ∀
≥
(6)
ITEMk∈0,1, k=1,…,K

109
Here, a new variable y has been substituted for the common factor 1( )k kI ITEMξ . This
variable represents an explicit common lower bound to the relative information
Rl-1
1( )k kI ITEMξ at the points ξl.
V.4 EXTENSION OF THE MODEL TO ALLOW FOR DEVELOPMENT OF DERIVED
EMIC SCALES IN INTERNATIONAL MARKETING RESEARCH
Hierarchical IRT model
Samejima’s GRM can be extended to multi-country settings by imposing a hierarchical
structure on item parameters, and the latent variable. We model random item parameter variation
as (De Jong, Steenkamp, and Fox 2007):
( )2, , , ,, ~ 0, for 1, , 1
k
g g gk c k c k c k ce e N c Cγγ γ σ= + = − , g
Ckgk 1,1, −≤≤ γγ (7)
,),,0(~, 2 AaNrraa gka
gk
gkk
gk k
∈+= σ (8)
where A is a bounded interval in ℜ+. Equation (7) implies that each scale threshold gck ,γ for a
particular item k in country g is modeled as an overall mean threshold ck ,γ , plus a country-
specific deviation gcke , . Analogously, equation (8) posits that the discrimination parameter g
ka is
the sum of an overall mean discrimination parameter and country-specific deviation. Moreover,
the discrimination parameter should be positive. The variances of the threshold and
discrimination parameters are allowed to vary across items.
The heterogeneity in the latent variable is modeled by hierarchical structure for giξ by letting:
),0(~, 2g
gi
gi
ggi N συυξξ += (9)
),(~ 2τξξ Ng (10)
In other words, the position on the latent scale for respondent i in country g is sampled from the
country average gξ with variance 2gσ . The country average is drawn from a distribution with
average ξ and variance τ2.
For identification purposes, we impose that across items, the product of the discrimination
parameters equals one in each country g ( 1=∏k
gka ∀g). Also, for one scale threshold parameter,

110
the thresholds should sum to zero across items in each country g (say 03, =k
gkγ ∀g, if the third
threshold is chosen).
Several important features of this model should be mentioned. First, all respondents can be
calibrated on the same latent scale, even though all items may display lack of invariance. De
Jong, Steenkamp, and Fox (2007) have shown that the requirement of measurement invariance
can be relaxed, so that measurement-invariant anchor items are not necessary.
Second, once the IRT model has been fitted and the item parameters are known, items can be
stored in an item bank. The item bank contains items and their associated calibrated item
parameters. Subsequently items can be selected in the constrained combinatorial optimization
routine to optimize some objective, subject to various constraints, such as scale length, minimum
levels of measurement precision, maximum number of words in an item, etcetera.
Cross-national short forms
The item-free calibration property of IRT models ensures that respondents can answer
different items and still be compared, as long as the items have been calibrated on the same latent
scale. Thus, after the model has been calibrated, and new data is collected for the items that have
been calibrated, respondents who would answer different items can be compared. In the cross-
national setting, the same principle applies. Running the hierarchical IRT model yields item
parameters that can be stored in an item bank. Next, the “optimal” items in each country can be
selected, and when new data is then collected for these “optimal” items, we still retain
comparability across countries, even though the scale length and items in the scale per country
may be different. The four steps are graphically illustrated in Figure 4.

111
Figure 4 Flowchart country-specific scale construction
The procedure starts at T0 by estimating the HIRT model. Next, the optimization routine is run in
each country and the optimal items are selected. Now, the optimal items, and their item
parameters are known, and if at a later point in time (T1) new data is collected, researchers only
have to collect data for these short forms based on “optimal items”. Finally item parameters can
be fixed at their known values and new individuals can be scored.
The choice between absolute vs. relative targets depends on the aims of the researcher. For
instance, if equal measurement precision is required in every country, an absolute target can be
used that specifies some absolute precision that must be reached for each and every country.
Naturally, this choice might imply that we get long scales in particular countries and short scales
in others. On the other hand, if the scale length is fixed to a maximum length, and only the shape
of the TIF is important, relative targets could be used. In the empirical section we compare both
procedures.
V.5 EMPIRICAL APPLICATION
Socially desirable responding
We apply our proposed procedure to the measurement of impression management (IM). IM is
an important component of socially desirable responding (SDR). In marketing, SDR has
sometimes been associated with “dark side” topics, such as materialism (Mick 1996), compulsive
buying (Mick 1996), and consumption of taboo products (McGraw and Tetlock 2005). However,
it is generally acknowledged that SDR is also operant in “mainstream” areas important to
marketers (Netemeyer, Bearden, and Sharma 2003), such as brand familiarity and brand liking
Calibrate HIRT model
Run the combinatorial optimization in each country
Collect data for ‘optimal’ items
Score new individuals
T0
T1
Time
Calibrate HIRT model
Run the combinatorial optimization in each country
Collect data for ‘optimal’ items
Score new individuals
T0
T1
Time

112
(Rindfleisch and Inman 1998), consumption motivations (Fisher 1993), consumer innovativeness
(Goldsmith 1987) and satisfaction (Sabourin et al. 1989), and value priorities (Fisher and Katz
2000). SDR has also been found to bias managerial decision making (Chung and Monroe 2003)
and performance evaluations (Bearden, Manning, and Tian 2004). Thus, it is not surprising that
SDR has been identified as “one of the most pervasive response biases” in survey data (Mick
1996, p. 106).
Measures
The standard scale for measuring SDR is Paulhus’ (1991) 40-item Balanced Inventory of
Desirable Responding. According to Paulhus (1991), SDR consists of two (positively correlated)
factors, namely, IM (respondents’ conscious tendency to present themselves in the most positive
manner) and self-deceptive enhancement (SDE; people’s unconscious tendency to provide
inflated self-reports). The 40-item scale consists of 20 items that tap SDE, and 20 items
measuring IM. In our empirical illustration, we focus on IM, measured using a subset of 10 items
of the Paulhus scale. The items are reported in Table 1.
Table 1 IM scale
Impression management
i1 I sometimes tell lies if I have to. i2 I never cover up my mistakes. i3 I always obey laws, even if I am unlikely to get caught. i4 I have said something bad about a friend behind his or her back. i5 When I hear people talking privately, I avoid listening. i6 I have received too much change from a salesperson without telling him or her. i7 When I was young I sometimes stole things. i8 I have done things that I don't tell other people about. i9 I never take things that don't belong to me. i10 I don't gossip about other people's business.
Item selection was based on the magnitude of factor loadings reported in previous U.S.
studies, subject to two constraints. Consistent with the philosophy of the full Paulhus scale, the
balanced structure of the scale was retained by selecting an equal number of positively and
negatively worded items. Moreover, the market research agencies that collected the data for us
insisted that potentially offensive items (e.g., “I never read sexy books or magazines”) were
omitted. It would have been ideal to administer all 20 items, but the market research agencies
considered the full 20-item scale too long and too costly to administer.

113
A review of two decades of published marketing research reveals that SDR has been
consistently neglected in scale construction, evaluation, and implementation (King and Bruner
2000). A major reason is that the Paulhus scale is too long. Adding non-substantive items to a
survey is costly, both in terms of money and respondent fatigue. It is often difficult to get
marketers to pay for additional survey items that will be used “merely” for estimating socially
desirable response tendencies. There is an urgent need for a short form for especially the
impression management dimension of the Paulhus scale, since this dimension is often used to see
whether SDR biases construct scores (Mick 1996).
Data collection
Two global marketing research agencies collected data on 20 SDR items for 28 countries
around the world: Argentina, Austria, Belgium, Brazil, China (mainland), Czech Republic,
Denmark, France, Germany, Hungary, Ireland, Italy, Japan, the Netherlands, Norway, Poland,
Portugal, Romania, Russia, Slovakia, Spain, Switzerland, Taiwan, Thailand, United Kingdom
and the United States. The samples in each country were drawn so as to be broadly representative
of the total population in terms of region, age, education and gender. Some countries used a web-
survey, others a mall intercept, and other hard-copy surveys.
The number of respondents per country varies between a minimum of 355 (UK) and a
maximum of 1181 (U.S.). The percentage of males and females is balanced, so that distributions
close to 50% of both sexes are obtained. Education and age sampling quotas are also respected,
so that the respondents matched population statistics.
The questionnaire was developed in English and then translated into all local languages by
professional agencies. Next, the translated surveys were backtranslated into English, using native
speakers from the local countries. In each survey, modifications were made based on discussions
between the backtranslators and the headquarters of the marketing research agencies to maintain
consistency in changes across all countries. The SDR items were measured on five-point Likert
scales (1 = strongly disagree, 5 = strongly agree).
V. 6 RESULTS
We follow the flowchart in Figure 4 and start by estimating the HIRT model for IM (step 1).
In Table 2 the posterior means of the discrimination parameters are presented.

114
Table 2 Discrimination parameters IM scale
I1 i2 i3 i4 i5 i6 i7 i8 i9 i10 U.K. 1.204 0.775 1.148 0.912 0.740 1.038 1.356 0.756 1.302 1.065
Germany 1.255 0.562 1.021 1.223 0.798 1.223 1.182 1.067 0.896 1.090 Ireland 1.182 0.741 0.974 1.208 1.026 1.152 1.100 0.653 1.100 1.084 France 0.825 0.861 0.966 1.186 1.114 0.905 1.116 0.813 1.193 1.195 Austria 1.203 0.661 0.999 0.983 0.681 1.338 1.342 1.042 1.045 1.022
Netherlands 1.437 0.767 0.686 1.126 0.779 0.952 1.292 1.166 1.075 1.023 Belgium 1.115 0.590 0.847 1.002 0.910 1.047 1.334 0.946 1.292 1.209
Italy 0.914 0.624 1.134 1.192 1.173 1.493 1.003 0.592 1.123 1.169 Norway 1.013 0.669 0.890 1.035 1.011 1.323 1.147 0.565 1.342 1.438 Slovakia 0.919 0.646 1.104 1.150 1.112 1.201 0.941 1.002 1.092 1.022 Poland 0.558 0.763 0.964 0.974 0.902 1.192 1.549 1.233 1.182 1.073 Sweden 1.355 0.775 0.971 1.041 0.875 1.159 1.083 0.703 1.071 1.204
Denmark 1.669 0.709 0.824 0.963 0.846 0.991 1.363 0.685 1.218 1.183 Hungary 1.366 0.419 0.930 1.872 1.281 0.894 1.525 0.975 1.112 1.126 Romania 0.679 0.643 1.368 1.314 0.700 1.638 1.216 0.858 1.005 1.108
United States 1.355 0.689 0.984 1.040 0.953 1.193 1.230 0.627 1.244 0.982 Argentina 0.892 0.645 1.011 1.237 1.140 1.201 1.408 0.734 0.966 1.062 Portugal 1.205 0.675 0.698 1.378 1.107 1.294 1.348 0.504 1.100 1.258
Switzerland 1.285 0.780 1.072 1.021 0.680 1.159 1.208 1.078 0.897 1.061 Czech. Rep. 0.920 0.643 0.915 1.169 0.965 1.257 1.312 0.821 1.167 1.089
Taiwan 0.649 0.721 0.756 1.166 0.910 1.424 1.496 0.936 1.234 1.154 Russia 0.288 0.730 1.148 1.561 1.119 1.709 1.529 0.652 1.296 1.197
Ukraine 0.458 0.665 1.004 1.586 1.289 1.798 1.479 0.836 0.904 0.858 Brazil 0.295 0.813 1.228 1.239 1.818 1.855 1.129 0.843 0.962 1.313
Thailand 0.891 0.704 0.930 0.974 1.227 1.131 1.342 0.690 1.114 1.291 China 0.370 0.915 1.275 1.175 1.092 1.359 1.355 0.869 1.153 1.046 Spain 1.225 0.718 0.980 0.916 0.881 1.321 1.303 0.914 1.065 0.892 Japan 0.800 0.924 1.037 1.187 0.811 1.241 1.329 1.117 0.832 0.930
There is substantial variation in the discrimination parameters across countries, and there are
no invariant items. In other words, the traditional multi-group CFA model (Steenkamp and
Baumgartner 1998) would not be able to fit this data, as invariant anchor items are required for
identification. More importantly, the variation in discrimination parameters indicates that items
measuring a construct well in one country are not always useful in other countries.16 Consider the
U.S. and China. The estimated discrimination parameter of item i1 from the IM scale (“I
sometimes tell lies if I have to”) has a posterior mean of aUS,1=1.355 in the U.S. and a posterior
mean in China of aCHI,1=0.370. In other words, the item seems suited to measure IM in the U.S.,

115
but the posterior mean in China is too low to make this a useful item. When we take the
thresholds into account this is clearly visible in the item information functions. For the U.S., the
posterior means of the thresholds are: γUS,1=-1.641, γUS,2= 0.127, γUS,3=0.971, γUS,4=2.175, while
in China the posterior values are γCHI,1=-1.058, γCHI,2= 0.360, γCHI,3=1.359, γCHI,4=2.413. Together
with the discrimination parameters this yields the posterior mean category response and
information functions in the U.S. and China in Figures 5 and 6:
Figure 5 IIF FOR ITEM 1 OF IM SCALE
Figure 6
INFORMATION FUNCTIONS IM1
The posterior mean category response functions for China are much flatter than for the US due to
the lower discrimination parameter (see Figure 5). Figure 6 shows that the information is much
16 The threshold parameters are also important when considering the usefulness of items. An item with moderate discrimination parameter may sometimes be better than an item with high discrimination and threshold values that do not match the position of the scale where more accurate measurement is required (see Lord and Novick 1968).

116
higher in the U.S. than in China along the entire trait, and that the measurement precision varies
along the ξ scale.
The 28x10x4=1120 threshold parameters cannot be meaningfully displayed for all other items
and countries. The findings of varying thresholds are robust across items. For illustrative
purposes consider item 10 (“I don't gossip about other people's business”). The threshold
parameters for this item for 28 countries are shown in Figure 7. Concordant with the observation
of fluctuation in discrimination parameters, there is substantial variation in threshold parameters
as well.
Figure 7 THRESHOLD VALUES i20
Deriving short forms
Having calibrated the IRT model, the next step is to apply the optimization routine (step 2 in
Figure 4). Various choices need to be made. First, we must specify whether absolute or relative
targets are used, and second, the shape of the TIF. In the sequel we explore the resulting short
scales under these 2x2=4 specifications.
Scenario 1: uniform TIF, absolute target
In this scenario, we place no restrictions on the number of items that is to be selected, but
instead choose a level of information is in line with the variance of the latent scale and ensures a
feasible optimization solution (in the sense that with a relatively small number of items, it is

117
possible to reach the target). The target information τ is set as τ=5 along the trait range, with
three grid points, located at the mean, one standard deviation below the mean, and one standard
deviation above the mean of the ξ-scale. Next, a 28-fold optimization program is formulated as:
minimize y
subject to
.0
,)(
,)(
1
1
≥
∀≥
∀+≤
=
=
y
lITEMI
lyITEMI
K
kkjlkj
K
kkjlkj
τξ
τξ
(11)
ITEMkj∈0,1, k=1,…,K, j=1,…, 28
We present the selected items in Table 3. It can be seen that there is substantial variation in item
selection across countries. Interestingly, there are no items that are selected in all countries,
which indicates the importance of using items tailored to the local environment, and the lack of
validity of the etic approach to scale construction. No scale construction method to date is able to
calibrate items on the same latent scale if there is no overlap across countries, even though
overlap is the exception rather than the rule when working with many countries.
Another interesting finding is that the number of items differs across countries. In other
words, the measurement precision is reached more easily in some countries than in others. For
example, to obtain the required measurement precision, six items are required in quite a few
countries, while only four items are selected for the U.K. In most countries, five items are
selected, indicating that the item parameters carry similar amounts of information in most
countries. Even though results are quite variable, there are some consistencies as well, and
culture does seem to have an impact on selection. As an example, consider item i2 (“I never
cover up my mistakes”). In European countries, i2 is not often selected, but in collectivistic
countries, such as Taiwan, China, Japan, Thailand it is selected. Apparently, covering up
mistakes is something which is perceived differently in Europe than in Asian countries. Item i9 is
chosen in almost any European country, but not in China, Thailand and Taiwan.
Finally, note that items are also selected with lower discrimination parameters. This is
because the optimization program tries to reach the absolute value as accurately as possible.

118
Moreover, as indicated by Lord and Novick (1968), it is sometimes preferable to use items with
somewhat lower discrimination parameters, because such items provide more information at
points located farther from the threshold values.
Scenario 2: uniform TIF, relative target
For the relative target, the number of scale items will be identical across countries, while
measurement accuracy will differ. We specified that the number of items should be smaller than
five and maximize the information subject to that constraint. In other words, the optimization
formulation is:
maximize y
subject to
.0
5
,)(
1
1
≥
∀≤
∀≥
=
=
y
jITEM
lyITEMI
K
kkj
K
kkjlkj ξ
(12)
ITEMkj∈0,1, k=1,…,K, j=1,…,28.
The resulting scales for IM are listed in Table 4. Several interesting findings emerge. It can be
seen that the selected items frequently correspond to the items with the highest discrimination
parameters in Table 2. In other words, the common practice of picking items with high
discrimination parameters yields quite similar results. We do note that this requires the HIRT
model, because items are not invariant across countries. An additional advantage of using an
optimization program is that constraints on item length, content and wording can be easily
specified.
Item i7 is selected in almost every country, which is consistent with the high discrimination
parameter in most countries. Items i2, i5 and i8 are selected only occasionally. Item i1 is selected
in a substantial number of European countries, but not in Asian countries.
Scenario 3: non-uniform TIF, absolute target
In this setting, we impose a positive linear trend for the target information. For τl we impose:
τl=ζ0 + l×ζ1, and ζ1>0. Specifically, we chose ζ0 =4 and ζ1=1, with l=1,2,3. Thus, measurement

119
precision is more accurate for individuals scoring higher on IM. Theoretically, one could argue
that especially individuals who have tendency to edit their responses in socially approved
directions create problems in surveys. Analogously, respondents who have low IM scores can be
measured a less accurately, since they do not distort their true opinions. The optimization
problem then is similar as in scenario 1 (with a different specification for τl). The selected items
are displayed in the second panel of Table 3. If we compare the results to the specification with a
uniform TIF, it can be seen that the selection of items is very different. Items 1, 2 and 3 are
selected relatively often compared to scenario 1. In addition, the number of items is larger in
many countries because a higher precision is required at the high-end of the latent scale.
Scenario 4: non-uniform TIF, relative target
In this scenario, we use a linear trend, which is absorbed now in the numbers Rl. Rl is set as 0.8, 1
and 1.2 for l=1,2,3. Table 4 lists the items. Under this specification, the IM item selection mirrors
that in scenario 2, apart from a few exceptions. In Germany, the Netherlands, Slovkia,
Switzerland, Denmark and Hungary different items are selected. In this case, all items are
selected with the highest discrimination parameters.
Which of the four different scales should be chosen by researchers? We would advise to use an
absolute target across countries. Using an absolute target ensures that reliable inferences can be
made in every country in the sample and moreover that the precision does not vary across
countries. Even though practitioners frequently want to use the same items across countries, our
results show that some countries require more items in order to measure the latent construct with
acceptable precision. Furthermore, we believe that the non-uniform TIF has benefits over the
uniform TIF, which is more aligned with the CTT paradigm. The non-uniform TIF retains
flexibility, and allows researchers to study in depth the consumer behavior of certain groups of
respondents (say high or low on some trait).
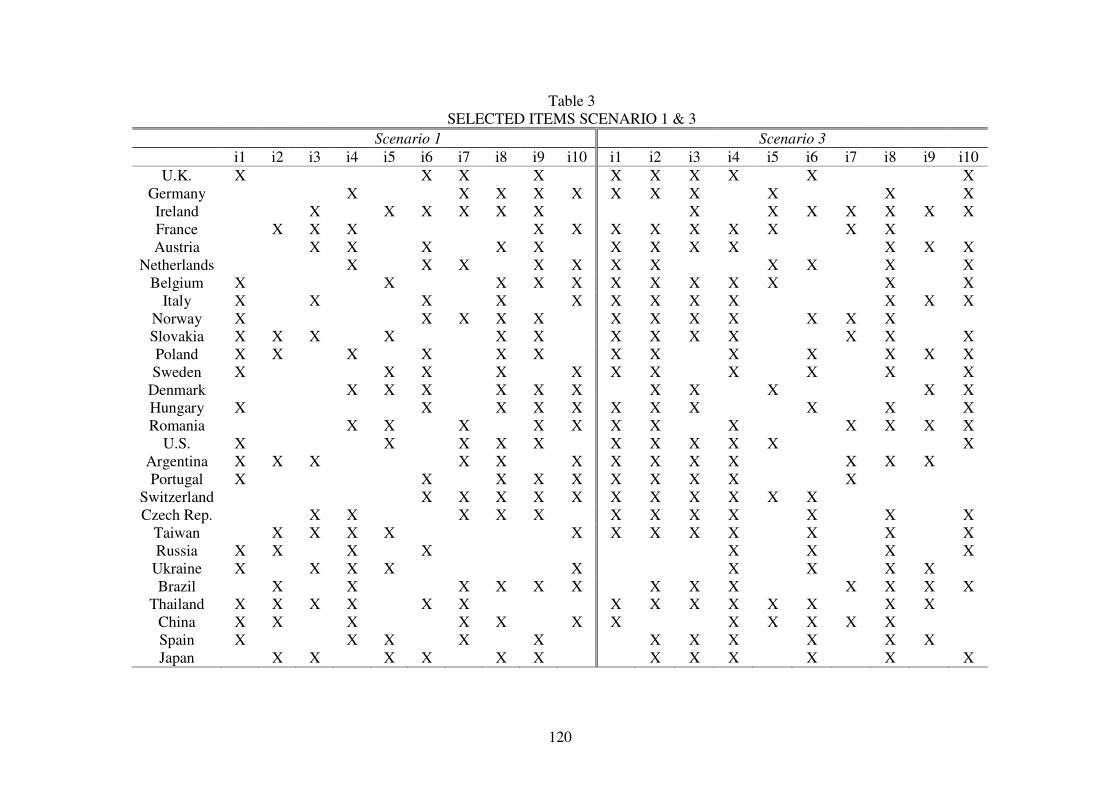
120
Table 3 SELECTED ITEMS SCENARIO 1 & 3
Scenario 1 Scenario 3 i1 i2 i3 i4 i5 i6 i7 i8 i9 i10 i1 i2 i3 i4 i5 i6 i7 i8 i9 i10
U.K. X X X X X X X X X X Germany X X X X X X X X X X X Ireland X X X X X X X X X X X X X France X X X X X X X X X X X X Austria X X X X X X X X X X X X
Netherlands X X X X X X X X X X X Belgium X X X X X X X X X X X X
Italy X X X X X X X X X X X X Norway X X X X X X X X X X X X Slovakia X X X X X X X X X X X X X Poland X X X X X X X X X X X X X Sweden X X X X X X X X X X X
Denmark X X X X X X X X X X X Hungary X X X X X X X X X X X Romania X X X X X X X X X X X X
U.S. X X X X X X X X X X X Argentina X X X X X X X X X X X X X Portugal X X X X X X X X X X
Switzerland X X X X X X X X X X X Czech Rep. X X X X X X X X X X X X
Taiwan X X X X X X X X X X X X Russia X X X X X X X X
Ukraine X X X X X X X X X Brazil X X X X X X X X X X X X X
Thailand X X X X X X X X X X X X X X China X X X X X X X X X X X X Spain X X X X X X X X X X X Japan X X X X X X X X X X X X

121
Table 4
SELECTED ITEMS SCENARIO 2 & 4 Scenario 2 Scenario 4 i1 i2 i3 i4 i5 i6 i7 i8 i9 i10 i1 i2 i3 i4 i5 i6 i7 i8 i9 i10
U.K. X X X X X X X X X X Germany X X X X X X X X X X Ireland X X X X X X X X X X France X X X X X X X X X X Austria X X X X X X X X X X
Netherlands X X X X X X X X X X Belgium X X X X X X X X X X
Italy X X X X X X X X X X Norway X X X X X X X X X X Slovakia X X X X X X X X X X Poland X X X X X X X X X X Sweden X X X X X X X X X X
Denmark X X X X X X X X X X Hungary X X X X X X X X X X Romania X X X X X X X X X X
U.S. X X X X X X X X X X Argentina X X X X X X X X X X Portugal X X X X X X X X X X
Switzerland X X X X X X X X X X Czech Rep. X X X X X X X X X X
Taiwan X X X X X X X X X X Russia X X X X X X X X X X
Ukraine X X X X X X X X X X Brazil X X X X X X X X X X
Thailand X X X X X X X X X X China X X X X X X X X X X Spain X X X X X X X X X X Japan X X X X X X X X X X

122
V.7 GENERAL DISCUSSION
International marketing has become an important domain in marketing science, and the
imperative for cross-national research is all the more compelling given accelerating trends
toward globalization (Winer 1998). Nonetheless, there are many methodological caveats that
researchers need to take into account whenever an international study is undertaken (Van de
Vijver and Leung 1997). In this chapter, we focused on cross-national measure construction.
Even though valid measurement is a cornerstone of marketing as a science, there has been
scant attention for developing scales in cross-national settings. Frequently, some ad-hoc
procedure is followed, where items that perform well in the U.S. are also administered in
other nations.
By combining hierarchical item response theory and optimal test design methods, we
developed a procedure that yields country-specific scales, but at the same time maintains
cross-national comparability. As such, we bridge the gap between emic and etic approaches to
measuring latent phenomena. The procedure is flexible in the sense that the researcher can
specify all kinds of constraints on item content, on scale length, and measurement precision
(Van der Linden 2005). Researchers can either impose that the scale length various across
countries, or impose a fixed precision across countries. Moreover, precision can vary for
respondents high or low on the trait under investigation. This has several key advantages. For
instance, interest often focuses on a specific group such as innovators, people high on
satisfaction, impression managers, or individuals with a very favorable brand attitude.
Especially for these individuals we need accurate measurement precision. In CTT, it is not
possible to develop scales that have a precision which varies across respondents.
In the empirical section, we demonstrated the procedure on the impression management
scale in a truly global setting. The dataset contained 28 countries across 4 continents. We
developed cross-national scales for four different specifications:
i) Relative TIF & uniform precision;
ii) Relative TIF & non-uniform precision (i.e., better measurement for respondents
scoring high on IM);
iii) Absolute TIF & uniform precision;
iv) Absolute TIF & non-uniform precision.
The results indicated that different items were selected in different countries, and that scale
length indeed varied across nations when an absolute target was specified. In other words, an
123
item is differentially useful to measure latent constructs and some countries require more
items than others to obtain a certain acceptable precision for the latent construct. Culture
exerted an influence on item selection. There were differences depending on whether a
uniform target information function, or an increasing information function was specified,
giving better precision at higher levels of IM.
There are several issues for further research. First, we only provided an application for a
single scale. Also, we had only 10 items. Ideally, we would have used all 20 items of the
impression management component of the Paulhus scale. Using a full scale is in the spirit of
derived emic, but this was not possible for practical reasons. However, the procedure that we
built is general and should be applied to many other scales to build a stock of findings that
could be incorporated into scaling handbooks. Item parameter values, as well as country-
specific versions of a scale should be listed in books such as the Handbook of Marketing
Scales (Bearden and Netemeyer 1999). Researchers would then be able to use a scale which
has been emically tailored to the local environment. Currently, the Handbook of Marketing
Scales lists items that have been largely developed in the U.S., but our empirical illustration
showed that not all SDR items are equally useful across the world, and these types of results
are very likely to generalize to other constructs. For instance, Wong et al. (2003) showed that
the materialism scale had problems in Asia, and that it would probably be better if the scale
and item format would be adapted. Another example would be the construct of values. The
Schwartz Value Survey (SVS; Schwartz 1992) is a rigorous instrument to measure values. But
Schwartz and colleagues found that respondents in emerging consumer markets had difficulty
understanding and completing the SVS items (Schwartz, Lehmann and Roccas 1999).
Methodologically, one might include varying response formats for items across countries
by changing the hierarchical structure in the IRT model. This would improve the general
applicability of the procedure. In addition, fully country-specific items could be added to the
set of common items (cf. May 2005). Even though many issues remain to be studied, we hope
that this chapter contributes to better marketing measures in international marketing.

124
Chapter 6 VI.1 Conclusions
Globalization is an important factor in today’s marketplace. Developments accelerating the
trend toward global market convergence include rapidly falling national boundaries, regional
unification, standardization of manufacturing techniques, global investment and production
strategies, expansion of world travel, rapid increase in education and literacy levels, growing
urbanization among developing countries, free flow of information, labor, money, and
technology across borders, increased consumer sophistication and purchasing power,
advances in telecommunication technologies, and the emergence of global media (Alden,
Steenkamp, and Batra 1999; Hassan and Katsanis 1994; Mahajan and Muller 1994). Firms
cannot ignore this trend toward globalization and academic research is needed that focuses on
international marketing phenomena.
In this dissertation, I was concerned with measurement in international marketing surveys.
Surveys are a crucial tool for obtaining managerial insights in international settings due to the
scarcity of secondary data. Nonetheless, there is a host of factors in cross-cultural research
that undermine the validity of survey data. I addressed several validity related issues. The four
essays span three interrelated categories of research in international marketing research: 1)
cross-national measurement invariance / differential item functioning, 2) response styles, and
3) international instrument development. The common measurement methodology throughout
the chapters was the novel hierarchical IRT model with random-effects structures (both for
item parameters and for the structural model). Below, I present the main conclusions of the
various chapters, and end with future research suggestions.
Chapter 2: measurement invariance for specific items
I investigated the view that constructs should display certain levels of measurement
invariance in order to make valid substantive cross-national (or more generally, cross-group)
comparisons. Indeed, it has been argued that if measurement invariance across countries is
lacking, it is not possible to draw conclusions based on the scale (Horn 1991). The multigroup
CFA model has become the ‘golden standard’ to test for measurement invariance of
instruments (e.g., Durvasula et al. 1993; Netemeyer et al. 1991; Steenkamp and Baumgartner
1998; Wong et al. 2003; see Vandenberg and Lance 2000 for an overview of other social
sciences). The CFA model requires certain degrees of invariance depending on the goals of
the study (Steenkamp and Baumgartner 1998). However, I have shown that claims of the
125
necessity of certain levels of measurement invariance for particular research objectives were
mainly the result of the particular CFA methodology that has been used.
I introduced a new hierarchical IRT model that allows marketing researchers to compare
countries substantively despite lack of invariance for any of the items. Moreover, because the
ordinal nature of the data is recognized, cross-national differences in scale usage are also
accommodated. In a simulation study I showed that measurement invariance can be relaxed,
and I provided an empirical application for the consumer susceptibility to normative influence
scale (SNI; Bearden, Netemeyer, and Teel 1989), using samples from 11 countries on four
continents. SNI has been linked to various aspects of consumer behavior such as attitudes
toward brands, advertising, and consumption alternatives resulting from globalization,
consumer confidence, protective self-presentation efforts, purchase of new products, and
consumer boycotts, among others.
I compared the estimation results based on IRT with the results obtained from a
multigroup CFA analysis, and showed that the latter leads to erroneous substantive
conclusions. Based on the IRT model, we found support for our hypothesis that consumers
living in individualistic countries 1) are on average lower on SNI and 2) exhibit more divergence
in their SNI attitudes compared to consumers living in collectivistic countries.
Chapter 3: Extreme Response Style
For ERS, the measurement model was based on a large heterogeneous set of items.
Heterogeneity in content means that the entire set of items on which the response style
measure is based does not refer to a substantively meaningful psychological construct and is
psychologically diffuse. Operationally, heterogeneous items are selected by using items from
a diverse set of scales that have little in common. Nonetheless, the set of items is allowed to
contain multiple items from the same scale. I developed a new advanced hierarchical IRT
measurement model, with testlet structures to deal with excess correlations among items due
to shared substance, and examined the antecedents of this important response styles in a truly
global setting. I found that people differ in their tendency to use the extremes of the rating
scale, and items also differ in the extent to which they elicit extreme responses, both
nationally and cross-nationally. I applied the model to a large data set involving 12,500
consumers from 26 countries, and found that socio-demographic variables had a minor
influence on ERS, but that culture exerted a strong and predictable effect on ERS. Women
tend to score somewhat higher on ERS than men, and both younger and older individuals are

126
more prone to respond extremely. ERS is also positively related to national-cultural
individualism, uncertainty avoidance, and masculinity.
Chapter 4: Socially Desirable Responding
For SDR, I proposed and tested a framework in which people’s tendency to provide
socially desirable responses is hypothesized to be affected by their personality and socio-
demographics, the culture in which they live, as well as the interplay between personality and
culture. The analysis was based on the hierarchical item response theory-based scaling
technique that estimates latent scores for all constructs on a cross-nationally common scale.
People’s tendency to provide socially desirable answers was systematically affected by their
personal makeup. SDR increased with higher openness to experience, conscientiousness, and
agreeableness, while neurotic people exhibited lower SDR. National-cultural dimensions also
played a prominent role. Respondents in countries high on power distance, uncertainty
avoidance, and masculinity tended to exhibit a greater degree of socially desirable responding.
SDR was found to be lower in national cultures emphasizing individualism. Also, a nation’s
culture systematically moderated the effects of the personality dimensions on SDR. The
positive effect of agreeableness on SDR will be stronger when national-cultural collectivism
is higher (individualism is lower), while the effect on conscientiousness was stronger in
countries high on uncertainty avoidance. The effect of extraversion was systematically
moderated by national-cultural power distance masculinity, both of which increased the effect
of extraversion. Finally, the effect of openness to experience on SDR was reduced in
individualistic cultures.
Chapter 5: International scale construction
The last essay was concerned with international measure construction. Current cross-
national measurement approaches most often use the same items in all countries, or at least
require a common set of items (Baumgartner and Steenkamp 1998; May 2005). I developed a
procedure that yields fully country-specific, yet cross-nationally comparable short form
marketing scales. The procedure is based on the juxtaposition of the polytomous hierarchical
IRT model and optimal test design methods. In the optimal test design step, a combinatorial
optimization routine was used to ensure that the scale has a certain, a priori chosen
measurement precision along the entire trait range. The precision can vary for different values
of the latent variable. The scale construction methodology was applied to the Impression
Management scale (Paulhus 1991), in 28 countries. For similar measurement precision in

127
every country, an absolute target was used that specified some absolute precision that had to
be reached for each and every country. As was shown, this choice implies that longer scales
are obtained in particular countries and shorter scales in others. On the other hand, I also
considered a fixed scale length, which implies that measurement precision might vary across
countries.
VI.2 Future research directions
There are many areas in which the present research might be extended. In each of the
chapters, several areas for future research have already been discussed. Based on my own
reading and knowledge of the literature, I see several broad areas for future research.
Model fit for hierarchical IRT
Assessing fit of item response models is not straightforward due to the large number of
possible responses, which makes standard χ2 tests of goodness of fit difficult to apply. Many
different aspects of fit can moreover be assessed, such as unidimensionality, DIF, item fit, and
person fit. For Bayesian IRT models, little attention has been given to assessing fit.
In the essays I discussed the use of Bayes factors to check the plausibility of various
model specifications. A Bayes factor is the ratio of the marginal likelihood under one model
to the marginal likelihood under a second model and it is therefore required that one specifies
alternative models. However, there might be many sources of misfit, both in the measurement
models and in the structural model and it is not feasible to estimate Bayes factors for every
different possible violation. Initial fit analysis might therefore start with residual analysis.
Bayesian residuals can be defined as (using the same notation as in chapter 1)
),,|( )()()()( mkj
mkj
mijijkijk
mijk aYEYr γξ−= , where m denotes the m-th draw in the MCMC algorithm.
These residuals have continuous-valued posterior distributions, and one can check whether
they are normally distributed. A disadvantage is that the Bayesian residuals have different
posterior variances, which makes the residuals difficult to compare. Alternatively, one can
focus on the Bayesian latent residuals defined as εijk=Zijk - akj ξij, where Z is the latent variable.
The latent residuals are easily obtained as a by-product from the MCMC-sampler and are
identically distributed. Yet, even with residual-based tests, the presence of large residuals
does not always lead to identification of the source of the misfit.
In IRT, researchers have proposed the use of Langrange Multiplier (LM) tests (Glas 1998;
1999). The null model is the IRT model, while the alternative model has certain model
128
violations, such as violation of the shape of the item characteristic curves, or violation of local
independence. The LM tests can be computed using the parameter estimates under the null
model. In the Bayesian framework, the LM-based approach can be generalized (Fox and Glas
2005) to yield Bayesian Modification Indices (BMI), even though these BMIs have not yet
been developed for hierarchical IRT models. With Bayesian modification it is possible to test
for various kinds of model violations. Further research in development of BMIs in complex
hierarchical IRT models holds considerable promise for model checking purposes. Naturally,
more detailed analyses using traditional approaches such as Bayes factors or posterior
predictive checks are possible after identifying large BMIs. Posterior predictive checking has
recently been advanced as a viable strategy for Bayesian IRT models (Sinharay 2005;
Sinharay, Johnson and Stern 2006). In a posterior predictive check, a test statistic is defined
and the values of the test statistic for observed and replicated data sets are compared. Sinharay
and colleagues discuss a wide variety of test statistics for IRT models, but more work is
needed to assess how well these statistics work in hierarchical models, and practical
implications of misfit.
Measurement invariance area
In the first essay, I relaxed measurement invariance but considered only a single latent
variable. Researchers are often interested in relating multiple latent variables each measured
by their own scale, so there is a need to develop hierarchical multidimensional latent variable
models with random-effects structures for both the structural part and the measurement part.
Structural modeling of multilevel data is a relatively recent area of scientific research. To
date, there have been some applications of multilevel latent variable models that incorporate
multiple latent variables, although the ordinal nature of the rating scale is often ignored and in
addition, the measurement models are invariant or at least partially invariant across groups /
countries. In this dissertation, models are presented that do recognize the ordinal nature of the
rating scale, and random-effects structures for item parameters are proposed so that the
measurement properties of all items can fluctuate across countries. However, the structural
models are restricted to univariate latent outcomes and manifest predictors. Models are
necessary that can handle multiple latent dependent variables, and latent predictors.
Response styles
In chapters 3 and 4 I focused only on two response styles, ERS and SDR. There are also
other response styles, such as acquiescence, and non-contingent responding (Baumgartner and

129
Steenkamp 2001) that influence the observed scores of items. Acquiescence refers to the
tendency to agree with statements relatively independently of specific item content, while
non-contingent responding refers to the tendency to respond to items carelessly or
nonpurposefully. All response styles jointly influence observed scores, and hence, there is a
need for models that integrate these various response styles into a single model. Baumgartner
and Steenkamp (2001) present a regression-based approach to partial observed scale scores
from all response styles, but this approach has limitations. More specifically, it is assumed
that the styles have the same biasing influence on each item of a scale, the latent nature of the
data is ignored, it is assumed that the styles have the same biasing effect for each individual,
and it is not clear whether the various styles have a linear impact on the observed scores.
Models that address all of these issues are necessary, even though the task seems daunting to
come up with ordinal latent data models that incorporate all styles and simultaneously model
substantive relationships between latent constructs.
Studies that investigate the validity of partialing SDR influences (especially impression
management) from observed scores, as recommended by Paulhus (1991), have produced
mixed effects at best. Many studies find no increase or even a decrease in validity when
correcting for SDR (see e.g. Ellingson, Sackett and Hough 1999; Ellingson, Smith and
Sackett 2001; Ones, Viswesvaran, Reis 1996; Piedmont et al. 2000; Smith and Ellingson
2002). The randomized response techniques seems much more promising (Fox 2005c) to
elicit valid responses in cases where respondents are reluctant to display their true opinions,
even though much research remains to be done for ordinal data. Once accurate ways to
control for SDR have been found, this opens up interesting avenues for research in consumer
behavior. For instance, research could address taboo consumer behavior, where respondents
are often reluctant to disclose their true behaviors or opinions (De Jong, Fox, and Pieters
2006).
International scale construction
In the scale construction procedure we proposed in the fourth essay, we only considered a
single scale (the impression management scale). However, the procedure that we built should
be applied to many other scales to build a stock of findings that could be incorporated into
scaling handbooks. Item parameter values, as well as country-specific versions of a scale
could be listed in books such as the Handbook of Marketing Scales (Bearden and Netemeyer
1999). Researchers would then be able to use a scale which has been emically tailored to the
local environment. Currently, the Handbook of Marketing Scales lists items that have been

130
developed in the U.S., but our analysis showed that not all SDR items are equally useful
across the world, and these types of results are very likely to generalize to other constructs.
For instance, Wong, Rindfleisch and Burroughs. (2003) showed that the materialism scale had
problems in Asia, and that it would probably be better if the scale and item format would be
adapted. Another example would be the construct of values. The Schwartz Value Survey
(SVS; Schwartz 1992) is a rigorous instrument to measure values. But Schwartz and
colleagues developed the Portraits Values Questionnaire because certain types of respondents
in emerging consumer markets had difficulty understanding and completing the SVS. This
was true especially among less educated and older respondents, and respondents living in
rural areas (Schwartz, Lehmann and Roccas 1999).
Methodologically, one might include varying response formats for items across countries
by changing the hierarchical structure in the IRT model. This would improve the general
applicability of the methodology.
Although only some aspects of IRT models were discussed in this dissertation, I
nonetheless hope that item response theory will get the place it deserves in the measurement
toolbox of both domestic and international marketers. In addition, I hope this dissertation has
increased the interest for international marketing, and advanced the rigor of cross-national
research.

131
References
Albert, James H. (1992), “Bayesian Estimation of Normal Ogive Item Response Curves Using Gibbs Sampling,” Journal of Educational Statistics, 17 (Fall), 251-269.
Alden, Dana L. Jan-Benedict E.M. Steenkamp, and Rajeev Batra (2006), (1999), “Brand Positioning Through Advertising in Asia, North America, and Europe: The Role of Global Consumer Culture,” Journal of Marketing, 63 (January), 75-87.
____, ____, ____ (2006) “Consumer Attitudes Toward Marketplace Globalization: Structure, Antecedents, and Consequences,” International Journal of Research in Marketing, 23 (3) (in press).
Anderson, James C. and David W. Gerbing (1988), “Structural Equation Modeling in Practice: A Review and Recommended Two-Step Approach,” Psychological Bulletin, 103 (May), 411-423.
Ansari, Asim, Kamel Jedidi, and Sharan Jagpal (2000), “A Hierarchical Bayesian Methodology for Treating Heterogeneity in Structural Equation Models,” Marketing Science, 19 (Fall), 328-347.
Bachman, Jerald G. and Patrick M. O’Mally (1984), “Yea-saying, Nay-saying, and going to Extremes: Black-White Differences in Response Styles,” Public Opinion Quarterly, 48 (Summer), 491-509.
Bagozzi, Richard P. (1980), Causal Models in Marketing, New York: Wiley. ____ (1994), “ACR Fellow Speech,” in Advances in Consumer Research, eds. Chris T. Allen
and Deborah R. John, Vol. 21, Provo, UT: Association for Consumer Research, 8-11. ____, and Youjae Yi (1988), “On the Evaluation of Structural Equation Models,” Journal of
the Academy of Marketing Science, 16 (Spring), 74-94. Balasubramanian, Siva K. and Wagner A. Kamakura (1989), “Measuring Consumer Attitudes
Toward the Marketplace With Tailored Interviews,” Journal of Marketing Research, 26 (August), 311-326.
Ballard, Rebecca, Michael D. Crino and Stephen Rubenfeld (1988), “Social Desirability Response Bias and the Marlowe-Crowne Social Desirability Scale,” Psychological Reports, 63, 227-237.
Barrick, Murray R. and Michael K. Mount (1996), “Effects of Impression Management and Self-Deception on the Predictive Validity of Personality Constructs,” Journal of Applied Psychology, 81 (3), 261-272.
Bass, Frank M. and Jerry Wind (1995), “Introduction to the Special Issue: Empirical Generalizations in Marketing,” Marketing Science, 14 (3), G1-G5.
Batra, Rajeev, Venkatram Ramaswamy, Dana L. Alden, Jan-Benedict E.M. Steenkamp, and S. Ramachander (2000), “Effects of Brand Local and Nonlocal Origin on Consumer Attitudes in Developing Countries,” Journal of Consumer Psychology, 9, 83-95.
Bauer, D. J. (2003), “Estimating Multilevel Linear Models as Structural Models,” Journal of Educational and Behavioral Statistics, 28, 135–167.
Baumgartner, Hans (2004), “Issues in Assessing Measurement Invariance in Cross-National Research,” presentation at Sheth Foundation/Sudman Symposium on Cross-Cultural Survey Research, University of Illinois.
____ and Christian Homburg (1996), “Applications of Structural Equation Modeling in Marketing and Consumer Research: A Review,” International Journal of Research in Marketing, 13 (2), 139-161.
____ and Jan-Benedict E.M. Steenkamp (1998), “Multi-Group Latent Variable Models for Varying Numbers of Items and Factors With Cross-National and Longitudinal Applications,” Marketing Letters, 9 (1), 21-35.

132
____ and ____ (2001), “Response Styles in Marketing Research: A Cross-National Investigation,” Journal of Marketing Research, 38 (May), 143-156.
____ and ____ (2006), “An Extended Paradigm for Measurement Analysis Applicable to Panel Data,” Journal of Marketing Research, 43 (August), in press.
Bearden, William O., Kenneth C. Manning, and Kelly Tian (2004), “Agents’ Socially Desirable Responding: Scale Development and Validation,” Working paper, Moore School of Business, University of South Carolina.
____, and Richard G. Netemeyer (1999), Handbook of Marketing Scales: Multi-Item Measures for Marketing and Consumer Behavior Research, 2nd ed. Newbury Park, CA: Sage Publications.
____, ____, and Jesse E. Teel (1989), “Measurement of Consumer Susceptibility to Interpersonal Influence,” Journal of Consumer Research, 15 (March), 473-481.
____, ____, ____ (1990), “Further Validation of the Consumer Susceptibility to Interpersonal Influence Scale,” in Advances in Consumer Research, eds. Marvin E. Goldberg, Gerald Gorn, and Richard W. Pollay, Vol. 17, Provo, UT: Association for Consumer Research, 770-776.
Bechtel, Gordon G. (1985), “Generalizing the Rasch Model for Consumer Rating Scales,” Marketing Science, 4 (Winter), 62-73.
Benet-Martínez, Verónica and Oliver P. John (1998), “Los Cinco Grandes Across Cultures and Ethnic Groups: Multitrait Multimethod Analyses of the Big Five in Spanish and English,” Journal of Personality and Social Psychology, 75 (September), 729-750.
Bentler, P. M., & Liang, J. (2003), “Two-level Mean and Covariance Structures: Maximum Likelihood Via an EM Algorithm,” In S. P. Reise & N. Duan (Eds.), Multilevel Modeling: Methodological Advances, Issues, and Applications (pp. 53–70). Hillsdale, NJ: Erlbaum.
Berger, James O. and Mohan Delampady (1987), “Testing Precise Hypotheses,” Statistical Science, 2, 317-352.
Berry, John W. (1969), “On Cross-Cultural Comparability,” International Journal of Psychology, 4, 119-128.
Best, Nicky, Kate Cowles, and Karen Vines, (1995). CODA Convergence diagnosis and output analysis software for Gibbs Sampler output: Version 0.3 [Computer software and manual]. Cambridge, UK: Biostatistics Unit-MRC.
Bijmolt, Tammo H.A., Leo J. Paas and Jeroen K. Vermunt, “Country and Consumer Segmentation: Multi-level Latent Class Analysis of Financial Product Ownership,” International Journal of Research in Marketing, 21, 323-340.
Birnbaum, Allan (1968), “Some Latent Trait Models and Their Use in Inferring an Examinee’s Ability,” in Statistical Theories of Mental Test Scores, Frederic M. Lord and Melvin R. Novick, eds. Reading, MA: Addison-Wesley Publishing Company.
Blickle (1996), “Personality Traits, Learning Strategies, and Performance,” European Journal of Personality, 10 (December), 337-352.
Bolt, Daniel M., Jennifer E. Hare, Jennifer E. Vitale, and Joseph P. Newman (2004), “A Multigroup Item Response Theory Analysis of the Psychopathy Checklist—Revised,” Psychological Assessment, 16 (2), 155-168.
Bollen, Kenneth and Richard Lennox (1991), Conventional Wisdom on Measurement: a Structural Equations Perspective,” Psychological Bulletin, 110 (2), 305-314.
Box, George E.P., and George C. Tiao (1973), Bayesian Inference in Statistical Analysis, Reading, MA: Addison-Wesley.
Bradlow, Eric T., Howard Wainer, and Xiaohui Wang (1999), “A Bayesian Random Effects Model for Testlets,” Psychometrika, 64 (2), 153-168.

133
Bradlow, Eric T., and Gavan J. Fitzsimons (2001), “Subscale Distance and Item Clustering Effects in Self-Administered Surveys: A New Metric,” Journal of Marketing Research, 38 (May), 254-261.
____, Howard Wainer, and Xiaohui Wang (1999), “A Bayesian Random Effects Model for Testlets,” Psychometrika, 64 (2), 153-168.
____, and Alan M. Zaslavsky (1999), “A Hierarchical Latent Variable Model for Ordinal Data From a Customer Satisfaction Survey With ‘No Answer’ Responses,” Journal of the American Statistical Association, 94 (March), 43-52.
Brown, Tom J., John C. Mowen, D. Todd Donavan, and Jane W. Licata, “The Customer Orientation of Service Workers: Personality Trait Effects on Self- and Supervisor Performance Ratings, Journal of Marketing Research, 39 (February), 110-119.
Burgess, Steven M. and Jan-Benedict E.M. Steenkamp (2006), “Innovation Blowback: How Research in Emerging Markets Advances Marketing Science and Practice,” Working Paper, University of Cape Town (South Africa).
Burisch, Matthias (1984), “Approaches to Personality Inventory Construction,” American Psychologist, 39 (March), 214-227.
Byrne, Barbara M., Richard J. Shavelson, and Bengt Muthén (1989), “Testing for the Equivalence of Factor Covariance and Mean Structures: The Issue of Partial Measurement Invariance,” Psychological Bulletin, 105 (3), 456-466.
Chen, Chuansheng, Shin-ying Lee, and Harold W. Stevenson (1995), “Response Style and Cross-Cultural Comparisons of Rating Scales Among East Asian and North American Students,” Psychological Science, 6, 170-175.
Cheung, Gordon W., and Roger B. Rensvold (2002), “Evaluating Goodness-Of-Fit Indexes for Testing Measurement Invariance,” Structural Equation Modeling, 9 (2), 233-255.
Chung, Janne and Gary S. Monroe (2003), “Exploring Social Desirability Bias,” Journal of Business Ethics, 44 (June), 291-302.
Church, A. Timothy (2000), “Culture and Personality: Toward an Integrated Cultural Trait Psychology,” Journal of Personality, 68 (August), 651-703
Churchill, Gilbert A., Jr. (1979), “A Paradigm for Developing Better Measures of Marketing Constructs,” Journal of Marketing Research, 16 (February), 64-73.
Craig, C. Samuel and Susan P. Douglas (2000), International Marketing Research, New York: Wiley, 2nd ed.
Crowne, Douglas P. and David Marlowe (1960), “A New Scale of Social Desirability Independent of Psychopathology,” Journal of Consulting Psychology, 24, 349-354.
Curran, P. J. (2003), “Have multilevel models been structural equation models all along? Multivariate Behavioral Research,” 38, 529–569.
De Jong, Martijn G., Jan-Benedict E.M. Steenkamp, Jean-Paul Fox, and Hans Baumgartner (2007), “Using Item Response Theory to Measure Extreme Response Style in Marketing Research: A Global Investigation,” Journal of Marketing Research, forthcoming.
____, Jan-Benedict E.M. Steenkamp and Jean-Paul Fox (2007), “Relaxing Measurement Invariance in Cross-National Consumer Research Using a Hierarchical IRT Model,” Journal of Consumer Research, 34 (September), in press.
____, Jean-Paul Fox and Rik Pieters (2006), “Randomized Response in Marketing: an Application for Consumption of Vice Products,” Working Paper, Tilburg University.
De Raad, Boele (2000), The Big Five Personality Factors: The Psycholexical Approach to Personality, Göttingen: Hogrefe and Huber.
Digman, John M. (1990), “Personality Structure: Emergence of the Five-Factor Model,” Annual Review of Psychology, 41, 417-440.

134
Duhachek, Adam, Anne T. Coughlan, and Dawn Iacobucci (2005), “Results on the Standard Error of the Coefficient Alpha Index of Reliability,” Marketing Science, 24 (Spring), 294-301.
Durvasula, Srinivas, J. Craig Andrews, Steven Lysonski, and Richard G. Netemeyer (1993), “Assessing the Cross-National Applicability of Consumer Behavior Models: A Model of Attitude toward Advertising in General,” Journal of Consumer Research, 19 (March), 626-636.
du Toit, S., & du Toit, M. (2003). Multilevel structural equation modeling. In J. De Leeuw & I. G. G. Kreft (Eds.), Handbook of Quantitative Multilevel Analysis (pp. 273–321). Boston: Kluwer.
Ellingson, Jill E., Paul R. Sackett and L.M. Hough (1999), “Social Desirability Corrections in Personality Measurement: Issues of Applicant Comparison and Construct Validity,” Journal of Applied Psychology, 84 (2), 155-166.
____, D. Brent Smith and Paul R. Sackett (2001), “Investigating the Influence of Social Desirability on Personality Factor Structure,” Journal of Applied Psychology, 86 (February), 122-133.
____, ____ (2002), “Substance Versus Style: A New Look at Social Desirability in Motivating Contexts,” Journal of Applied Psychology, 87 (2), 211-219.
Erbring, Lutz and Alice A. Young (1979), "Individuals and Social Structure: Contextual Effects as Endogenous Feedback," Sociological Methods and Research, 7 (May), 396-430.
Farley, Frank H. (1966), “Social Desirability, Extraversion, and Neuroticism: A Learning Analysis,” The Journal of Psychology, 64, 113-118.
Fisher, Robert J. (1993), “Social Desirability Bias and the Validity of Indirect Questioning,” Journal of Consumer Research, 20 (September), 303-315.
____ (2000), “The Future of Social-Desirability Bias Research in Marketing,” Psychology & Marketing, 17 (February), 73-77.
____ and Laurette Dubé (2005), “Gender Differences in Responses to Emotional Advertising: A Social Desirability Perspective,” Journal of Consumer Research, 31 (March), 850-858.
____ and James E. Katz (2000), “Social-Desirability Bias and the Validity of Self-Reported Values,” Psychology & Marketing, 17 (February), 105-120.
Fox, Jean-Paul (2005a), “Multilevel IRT Using Dichotomous and Polytomous Items,” British Journal of Mathematical and Statistical Psychology, in press.
____ (2005b), “Multilevel IRT Model Assessment,” in New Developments in Categorical Data Analysis for the Social and Behavioral Sciences, eds. Andries van der Ark, Marcel A. Croon, and Klaas Sijtsma, London, Lawrence Erlbaum Associates Publishers, 227-252.
____ (2005c), “Randomized Item Response Theory Models,” Journal of Educational and Behavioral Statistics, 30 (2), 189-212.
____ and Cees A.W. Glas (2001), “Bayesian Estimation of a Multilevel IRT Model Using Gibbs Sampling,” Psychometrika, 66 (June), 271-288.
____, and ____ (2003), “Bayesian Modeling of Measurement Error in Predictor Variables using Item Response Theory,” Psychometrika, 68 (June), 169-192.
____, and ____ (2005), “Bayesian Modification Indices for IRT Models,” Statistica Neerlandica, 59 (February), 95-106.
Franses, Philip Hans and Richard Paap (2001), Quantitative Models in Marketing Research, Cambridge: Cambridge University Press.
Furnham, Adrian, K.V. Petrides and Sarah Spencer-Bowdage (2002), “The Effects of Different Types of Social Desirability on the Identification of Repressors,” Personality and Individual Differences, 33 (July), 119-130.

135
Ganster, Daniel C., Harry W. Hennessey, and Fred Luthans (1983), “Social Desirability Response Effects: Three Alternative Models,” Academy of Management Journal, 26 (June), 213-331.
Gerbing, David W. and James C. Anderson (1988), “An Updated Paradigm for Scale Development Incorporating Unidimensionality and Its Assessment,” Journal of Marketing Research, 25 (May), 186-192.
Glas, Cees A. W. (1998), “Detection of Differential Item Functioning Using Lagrange Multiplier Tests,” Statistica Sinica, 8 (3), 647-667.
____ (1999), “Modification Indices For the 2-PL and the Nominal Response Model,” Psychometrika, 64 (3), 273-294.
Goldsmith, Ronald E. (1987), “Self-Monitoring and Innovativeness,” Psychological Reports, 60, 1017-1018.
Graziano, William G. and Renée M. Tobin (1997), “Agreeableness: Dimension of Personality or Social Desirability Artifact?” Journal of Personality, 70 (October), 695-727.
Greene, William H. (2003), Econometric analysis. Upper Saddle River, NJ: Prentice Hall. Greenleaf, Eric A. (1992a), “Improving Rating Scale Measures by Detecting and Correcting
Bias Components in Some Response Styles,” Journal of Marketing Research, 29 (May), 176-88.
____ (1992b), “Measuring Extreme Response Style,” Public Opinion Quarterly, 56 (Fall), 328-351.
Grimm, Stephanie D. and A. Timothy Church (1999), “A Cross-Cultural Study of Response Biases in Personality Measures,” Journal of Research in Personality, 33 (4), 415-441.
Gupta, Sunil and Valarie Zeithaml (2006), “Customer Metrics and Their Impact on Financial Performance,” Working Paper, Columbia University.
Hambleton, Ronald K. and Hariharan Swaminathan (1985), Item Response Theory: Principles and Applications. Boston, MA: Kluwer-Nijhoff.
Hamilton, David L. (1968), “Personality Attributes Associated with Extreme Response Style,” Psychological Bulletin, 69, 192-203.
Hanssens, Dominique M., Leonard J. Parsons, and Randall L. Schultz (2001), Market Response Models (2nd ed), Boston: Kluwer Academic Publishers.
Hassan, Salah S., and Lea Prevel Katsanis (1994), “Global Market Segmentation Strategies and Trends, in Globalization of Consumer Markets: Structures and Strategies, Erdener Kaynak and Salah S. Hassan, eds., New York: International Business Press, 47-63.
Heine, S.J. and Lehman (1995), “Social Desirability Among Canadian and Japanese Students,” Journal of Social Psychology, 135, 777-779.
Hofstede, Geert (2001), Cultures Consequences: Comparing Values, Behaviors, Institutions, and Organizations Across Nations, 2nd ed., Thousand Oaks, CA: Sage.
Hogan, R. (1983), “A Socioanalytic Theory of Personality,” in M.M. Page (ed.), 1982 Nebraska Symposium on Motivation (pp. 55-89). Lincoln: University of Nebraska Press.
Hogan, Joyce and Deniz S. Ones (1997), “Conscientiousness and Integrity at Work,” in R. Hogan, J. Johnson and S. Briggs (Eds.), Handbook of Personality Psychology (pp. 767-793). San Diego, CA: Academic Press.
Holland, Paul W., and Howard Wainer (1993), Differential Item Functioning. Hillsdale, NJ: Lawrence Erlbaum.
Holtgraves, Thomas (2004), “Social Desirability and Self-Reports: Testing Models of Socially Desirable Responding,” Personality and Social Psychology Bulletin, 30 (February), 161-172.
Horn, John L. (1991), “Comments on ‘Issues in Factorial Invariance,’” in Best Methods for the Analysis of Change, eds. Linda M. Collins and John L. Horn, Washington, DC: American Psychological Association, 114-125.

136
____, and J. Jack McArdle (1992), “A Practical and Theoretical Guide to Measurement Invariance in Aging Research,” Experimental Aging Research, 18 (Fall-Winter), 117-144.
Hox, Joop (2002), Multilevel Analysis, Mahwah, NJ: Lawrence Erlbaum. Hui, Harry C. and Harry C. Triandis (1989), “Effects of Culture and Response Format on
Extreme Response Style,” Journal of Cross-Cultural Psychology, 20, 296-309. Inglehart, Ronald and Wayne E. Baker (2000), “Modernization, Cultural Change and the
Persistence of Traditional Values,” American Sociological Review, 65 (February), 19-51. Jacoby, Jacob (1978), “Consumer Research: A State of the Art Review,” Journal of
Marketing, 42 (April), 87-96. Janssen, Rianne, Francis Tuerlinckx, Michel Meulders, and Paul de Boeck (2000), “A
Hierarchical IRT model for Criterion-Referenced Measurement,” Journal of Educational and Behavioral Statistics, 25 (Fall), 285-306.
Jarvis, Cheryl, Scott B. MacKenzie, and Philip M. Podsakoff (2003), “A Critical Review of Construct Indicators and Measurement Model Misspecification in Marketing and Consumer Research,” Journal of Consumer Research, 30 (September), 199-218.
Jo, Myung-Soo (2000), “Controlling Social-Desirability Bias via Method Factors of Direct and Indirect Questioning in Structural Equation Models,” Psychology & Marketing, 17 (February), 137-148.
____, James E. Nelson, and Pamela Kiecker (1997), “A Model for Controlling Social Desirability Bias by Direct and Indirect Questioning,” Marketing Letters, 8 (October), 429-437.
John, Oliver P. (1990), “The 'Big Five' Factor Taxonomy: Dimensions of Personality in the Natural Language and in Questionnaires,” in Handbook of Personality: Theory and Research, Lawrence A. Pervin, ed. New York: The Guilford Press, 66-100.
Johnson, Matthew, Sandip Sinharay, and Eric T. Bradlow (2005), "Hierarchical IRT Models," to appear in Handbook of Statistics, Vol 27 (Psychometrics), C. R. Rao and S. Sinharay (Eds).
Johnson, Timothy, Patrick Kulesa, Young Ik Cho, and Sharon Shavitt (2005), “The Relation Between Culture and Response Styles,” Journal of Cross-Cultural Psychology, 36 (March), 264-277.
Johnson, Timothy R. (2003), “On the Use of Heterogeneous Thresholds Ordinal Regression Models To Account for Individual Differences in Extreme Response Style,” Psychometrika, 68 (4), 563-583.
Jöreskog, Karl G. (2000), “Latent Variable Scores and Their Uses,” working paper, Chicago, IL: Scientific Software International.
Kagitcibasi, Cigdem (1997), “Individualism and Collectivism,” in Handbook of Cross-Cultural Psychology, Volume 3: Social Behavior and Applications, eds. John W. Berry, Marshall H. Segall, and Cigdem Kagitcibasi, Boston, MA: Allyn and Bacon, 2nd edition, 1-49.
Kaplan, David and P.R. Elliot (1997), “A Didactic Example of Multilevel Structural Equation Modeling Applicable to the Study of Organizations,” Structural Equation Modeling, 4, 1–24.
Kass, Robert E. and Adrian E. Raftery (1995), “Bayes Factors,” Journal of the American Statistical Association, 90 (June), 773-795.
King, Maryon F. and Gordon C. Bruner (2000), “Social Desirability Bias: A Neglected Aspect of Validity Testing,” Psychology & Marketing, 17 (February), 79-103.
Koestler, A. (1967), “The Ghost in the Machine,” New York: Macmillan. Kotabe, Masaaki, and Kristiaan Helsen (2004), Global Marketing Management, 3rd ed.,
Hoboken, NJ: Wiley. Kumar, V. (2000), International Marketing Research. Upper Saddle River, NJ: Prentice Hall.

137
Lalwani, Ashok K., Sharon Shavitt, and Timothy Johnson (2006), “What Is the Relation Between Cultural Orientation and Socially Desirable Responding,” Journal of Personality and Social Psychology, (in press).
Lawley D.N. (1943), “On Problems Connected with Item Selection and Test Construction,” Proceedings of the Royal Society of Edinburgh, (A23), 273-287.
Lord, Frederic M. (1952), “A Theory of Test Scores,” Psychometric Monograph (No. 7). Lord, Frederic M. (1980), Applications of Item Response Theory to Practical Testing
Problems, Hillsdale, NJ: Lawrence Erlbaum. Lord, Frederic M. and Melvin R. Novick (1968), Statistical Theories of Mental Test Scores,
Reading, MA: Addison-Wesley Publishing Company. Lubke, Gitta H. and Bengt O. Muthén (2004), “Applying Multigroup Confirmatory Factor
Models for Continuous Outcomes to Likert Scale Data Complicates Meaningful Group Comparisons,” Structural Equation Modeling, 11 (4), 514-534.
Lynn, Richard and Terence Martin (1995), “National Differences for Thirty-seven Nations in Extraversion, Neuroticism, Psychoticism, and Economic, Demographic, and Other Correlates,” Personality and Individual Differences, 19 (3), 403-406.
MacCallum, Robert C., Mary Roznowski, and Lawrence B. Necowitz (1992), “Model Modifications in Covariance Structure Analysis: The Problem of Capitalization on Chance,” Psychological Bulletin, 111 (3), 490-504.
MacKenzie, Scott B. (2003), “The Dangers of Poor Construct Conceptualization,” Journal of the Academy of Marketing Science, 31 (Summer), 323-326.
Maddala, G.S. (1983), Limited-Dependent and Qualitative Variables in Econometrics. Cambridge: Cambridge University Press.
Mahajan, Vijay, and Eitan Muller (1994), “Innovation Diffusion in a Borderless Global Market: Will the 1992 Unification of the European Community Accelerate the Diffusion of New Ideas, Products and Technologies?” Technological Forecasting and Social Change, 45, 221-235.
Maheswaran, Durairaj and Sharon Shavitt (2000), “Issues and New Directions in Global Consumer Psychology,” Journal of Consumer Psychology, 9(2), 59-66.
Mangleburg, Tamara F., and Terry Bristol (1998), “Socialization and Adolescents’ Skepticism Toward Advertising,” Journal of Advertising, 27 (Fall), 11-21.
Marín, Gerardo, Raymond J. Gamba, and Barbara V. Marín (1992), “Extreme Response Style and Acquiescence Among Hispanics,” Journal of Cross-Cultural Psychology, 23 (December), 498-509.
Markus, Hazel R. and Shinobu Kitayama (1991), “Culture and the Self: Implications for Cognition, Emotion, and Motivation,’ Psychological Review, 98 (2), 224-253.
May, Henry (2005), “A Multilevel Bayesian IRT Method for Scaling Socioeconomic Status in International Studies of Education,” Journal of Educational and Behavioral Statistics, in press.
McCracken, Grant (1986), “Culture and Consumption: A Theoretical Account of the Structure and Movement of the Cultural Meaning of Consumer Goods,” Journal of Consumer Research, 13 (June), 71-84.
McCrae, Robert R. (2000), “Trait Psychology and Culture: Exploring Intercultural Comparisons,” Journal of Personality, 69 (December), 819-846.
____ and Paul T. Costa (1997), “Conceptions and Correlates of Openness to Experience,” in R. Hogan, J. Johnson and S. Briggs (Eds.), Handbook of Personality Psychology (pp. 767-793). San Diego, CA: Academic Press.
____, Antonio Terracciano, et al. (2005), “Universal Features of Personality Traits From the Observer’s Perspective: Data From 50 Cultures,” Journal of Personality and Social Psychology,” 88 (3), 547-561.

138
McGraw, A. Peter and Philip E. Tetlock (2005), “Taboo Trade-Offs, Relational Framing, and the Acceptability of Exchanges,” Journal of Consumer Psychology, 15 (1), 2-15.
Meade, Adam W. and Gary J. Lautenschlager (2004), “A Comparison of Item Response Theory and Confirmatory Factor Analytic Methodologies for Establishing Measurement Equivalence/Invariance,” Organizational Research Methods, 7 (October), 361-388.
Mehta, Paras D. and Michael C. Neale (2005), “People are Variables Too: Multilevel Structural Equations Modeling,” Psychological Methods, 10 (3), 259-284.
Meredith, William (1993), “Measurement Invariance, Factor Analysis, and Factorial Invariance,” Psychometrika, 58 (December), 525-543.
____ (1995), “Two Wrongs May Not Make a Right,” Multivariate Behavioral Research, 30 (1), 89-94.
Mick, David G. (1996), “Are Studies of Dark Side Variables Confounded by Socially Desirable Responding? The Case of Materialism,” Journal of Consumer Research, 23 (September), 106-119.
____ (2005), “Meaning and Mattering Through Transformative Consumer Research,” Presidential Address at the Conference of the Association for Consumer Research.
Monroe, Kent B. (1993), Editorial. Journal of Consumer Research, 19 (March). Mowen, John C. and Nancy Spears (1999), “Understanding Compulsive Buying Among
College Students: A Hierarchical Approach,” Journal of Consumer Psychology, 8 (4), 407-430.
Muthén, Bengt O. (1991), “Multilevel Factor Analysis of Class and Student Achievement components,” Journal of Educational Measurement, 28, 338–354.
____ (1994), “Multilevel Covariance Structure Analysis,” Sociological Methods & Research, 22, 376–398.
____ (1997), “Latent variable modeling with longitudinal and multilevel data,” In A. Raftery (Ed.), Sociological methodology (pp. 453–480). Boston: Blackwell Publishers.
Nelson-Jones, Richard and Peter Coxhead (1980), “Neuroticism, Social Desirability and Anticipations and Attributions Affecting Self-Disclosure,” British Journal of Medical Psychology, 53, 169-180.
Netemeyer, Richard G., William O. Bearden, and Subhash Sharma (2003), Scaling Procedures: Issues and Applications, Thousand Oaks, CA: Sage.
____, Srinivas Durvasula, and Donald R. Lichtenstein (1991), “A Cross-National Assessment of the Reliability and Validity of the CETSCALE,” Journal of Marketing Research, 28 (August), 320-327.
Newton, Michael E. and Adrian E. Raftery (1994), “Approximate Bayesian Inference with the Weighted Likelihood Bootstrap,” Journal of the Royal Statistical Society B, 56 (1), 3-48.
Noller, Patricia, Henry Law, and Andrew L. Comrey (1987), “Cattell, Comrey, and Eysenck personality Factors Compared: More Evidence for the Five Robust Factors?” Journal of Personality and Social Psychology, 53 (October), 775-782.
Novak, Thomas P., Donna L. Hoffman, and Yiu-Fai Yung (2000), “Measuring the Customer Experience in Online Environments: A Structural Modeling Approach,” Marketing Science, 19 (Winter), 22-42.
Nunnally J.C. (1978), Psychometric Theory (2nd ed), New York: McGraw-Hill. Ones, Deniz S., Chockalingam Viswesvaran, and Angelika D. Reiss (1996), “Role of Social
Desirability in Personality Testing for Personnel Selection: The Red Herring,” Journal of Applied Psychology, 81 (December), 660-679.
____ and ____ (1998), “The Effects of Social Desirability and Faking on Personality and Integrity Assessment for Personnel Selection,” Human Performance, 11 (2/3), 245-269.

139
Oyserman, Daphna, Heather M. Coon, and Markus Kemmelmeier (2002), “Rethinking Individualism and Collectivism: Evaluation of Theoretical Assumptions and Meta-Analyses,” Psychological Bulletin, 128 (January), 3-72.
Patz, Richard J., Brian W. Junker, Matthew S. Johnson and L.T. Mariano (2002), “The Hierarchical Rater Model for Rated Test Items,” Journal of Educational and Behavioral Statistics, 27(4), 341-384.
Paulhus, Delroy L. (1984), “Two-Component Models of Socially Desirable Responding,” Journal of Personality and Social Psychology, 46 (3), 598-609.
____ (1991), “Measurement and Control of Response Bias,” in Measures of Personality and Social Psychological Attitudes, John P. Robinson, Phillip R. Shaver, and Lawrence S. Wright, eds., San Diego, CA: Academic Press, 17-59.
____ (2002), “Socially Desirable Responding: The Evolution of a Construct,” in The Role of Constructs in Psychological and Educational Measurement, H.I. Braun, D.N. Jackson, and D.E. Wiley, eds., Mahwah, NJ: Erlbaum, 49-69.
Pauls, Cornelia A. and Gerhard Stemmler (2003), “Substance and Bias in Social Desirability Responding,” Personality and Individual Differences, 35, 263-275.
Peabody, Dean (1999), “Nationality Characteristics: Dimensions for Comparison,” in Personality and Person Perception across Cultures, Yueh-Ting Lee, Clark R. McCauley, and Juris G. Draguns, eds., Mahwah, NJ: Erlbaum, 65-84.
Peter, J. Paul (1979), “Reliability: A Review of Psychometric Basics and Recent Marketing Practices,” Journal of Marketing Research, 16 (February), 6-17.
____ (1981), “Construct Validity: A Review of Basic Issues and Marketing Practices,” Journal of Marketing Research, 18 (May), 133-145.
Piedmont, Ralph L., Robert R. McCrae, Rainer Riemann and Alois Angleitner (2000), “On the Invalidity of Validity Scales: Evidence from Self-reports and Observer Ratings in Volunteer Samples,” Journal of Personality and Social Psychology, 78 (March), 582-593.
Podsakoff, Philip M., Scott B. MacKenzie, Jeong-Yeon Lee, and Nathan P. Podsakoff (2003), “Common Method Biases in Behavioral Research: A Critical Review of the Literature and Recommended Remedies,” Journal of Applied Psychology, 88 (October), 879-903.
Raju, Nambury S., Barbara M. Byrne, and Larry J. Laffitte (2002), “Measurement Equivalence: A Comparison of Methods Based on Confirmatory Factor Analysis and Item Response Theory,” Journal of Applied Psychology, 87 (3), 517-529.
Rasch, Georg (1960), Probabilistic Models for Some Intelligence and Attainment Tests. Copenhagen: The Danish Institute for Educational Research.
____ (1966), “An Individualistic Approach to Item Analysis,” In P.F. Lazarsfeld and N.W. Henry (Eds.), Readings in Mathematical Social Science (pp. 89-107). Cambridge: MIT Press.
____ (1977). On Specific Objectivity: An attempt at formalizing the request for generality and validity of scientific statements. Danish Yearbook of Philosophy, 14, 58-94.
Raudenbush, Stephen W. and Anthony S. Bryk (2002), Hierarchical Linear Models: Applications and Data Analysis Methods. Newbury Park, CA: Sage.
____, ____, and Richard Congdon (2000), HLM 5: Hierarchical Linear and Nonlinear Modeling, Lincolnwood, IL: Scientific Software International.
Ray, Michael L. (1979), “The Critical Need for a Marketing Measurement Tradition: A Proposal,” in: O.C. Ferrell, Stephen W. Brown, and Charles W. Lamb, Jr. (eds.), Conceptual and Theoretical Developments in Marketing, Chicago, IL: American Marketing Association, 34-48.
Reise, Steven P., Keith F. Widaman, and Robin H. Pugh (1993), “Confirmatory Factor Analysis and Item Response Theory: Two Approaches for Exploring Measurement Invariance,” Psychological Bulletin, 114 (3), 552-566.

140
Richins, Marsha L. (1994), “Special Possessions and the Expression of Material Values,” Journal of Consumer Research, 21 (December), 522-533.
____ (2004), “The Material Values Scale: A Re-inquiry into Its Measurement Properties and the Development of a Short Form,” Journal of Consumer Research, 31 (June), 209-219, 2004.
____ and Scott Dawson (1992), "A Consumer Values Orientation for Materialism and Its Measurement: Measure Development and Validation," Journal of Consumer Research, 19 (December), 303-316.
Rindfleisch, Aric and J. Jeffrey Inman (1998), “Explaining the Familiarity-Liking Relationship: Mere Exposure, Information Availability, or Social Desirability,” Marketing Letters, 9 (February), 5-20.
____, Alan J. Malter, Shankar Ganesan, and Christine Moorman (2006), “Cross-Sectional Versus Longitudinal Survey Research: Concepts, Findings, and Guidelines,” working paper, University of Wisconsin-Madison.
Rosenthal, Robert (1991), Meta-Analytic Procedures for Social Research, Newbury Park, CA: Sage.
Ross, C.E. and J. Mirowsky (1984), “Socially-Desirable Response and Acquiescence in a Cross-Cultural Survey of Mental Health,” Journal of Health and social Behavior, 25, 189-197.
Rossi, Peter E., Zvi Gilula, and Greg M. Allenby (2001), “Overcoming Scale Usage Heterogeneity: A Bayesian Hierarchical Approach,” Journal of the American Statistical Association, 96 (March), 20-31.
Roth, Martin S. (1995), “The Effects of Culture and Socioeconomics on the Performance of Global Brand Image Strategies,” Journal of Marketing Research, 32 (May), 163-175.
Rovine, Michael J. and Peter C. Molenaar (2000), “A Structural Modeling Approach to a Multilevel Random Coefficients Model. Multivariate Behavioral Research, 35, 51–88.
Sabourin, S., N. LaFeiriere, F. Sicuro, J.C. Coallier, L.G. Cournoyer and P. Gendreau (1989), “Social Desirability, Psychological Distress and Consumer satisfaction with Mental Health treatment,” Journal of Counseling Psychology, 36, 352-356.
Samejima, Fumiko (1969), “Estimation of Latent Ability Using a Response Pattern of Graded Scores,” Psychometrika Monograph Supplement, 17, 1-100.
____ (1972), “A General Model for Free Response Data,” Psychometrika Monograph Supplement, 18, 1-68.
Schwartz, Shalom H. (1992), “Universals in the Content and Structure of Values: Theoretical Advances and Empirical Tests in 20 Countries,” in Advances in Experimental Social Psychology, Zanna, M. (ed.), Vol 25, Orlando, FL: Academic Press, 1-65.
____ (1994), “Beyond Individualism/Collectivism: New Cultural Dimensions of Values,” in Individualism and Collectivism: Theory, Method, and Applications, U. Kim et al., eds. Thousand Oaks, CA: Sage Publications, 85-119.
____ (2006), “Cultural Dimensions of Values: Toward an Understanding of National Differences,” Applied Psychology: An International Review, in press.
____, A. Lehmann, and S. Roccas (1999), in J. Adamopoulos and Y. Kashima (Eds.), Social Psychology and Cultural Context, Multimethod Probes of Basic Human Values, Newbury Park, California: Sage Publications, 107-123.
Sen, Sankar, Zeynep Gürhan-Canli, and Vicki G. Morwitz (2001), “Withholding Consumption: A Social Dilemma Perspective on Consumer Boycotts,” Journal of Consumer Research, 28 (December), 399-417.
Singh, Jagdip (2004), “Tackling measurement problems with Item Response Theory - Principles, characteristics, and assessment, with an illustrative example,” Journal of Business Research, 57 (February), 184-208.

141
____, Roy D. Howell, and Gary K. Rhoads (1990), “Adaptive Designs for Likert-Type Data: An Approach for Implementing Marketing Surveys,” Journal of Marketing Research, 27 (August), 304-321.
Sinharay, Sandip (2005), “Assessing Fit of Unidimensional Item Response Theory Models Using a Bayesian Approach,” Journal of Educational Measurement, 42 (Winter), 375-394.
____, Matthew S. Johnson, and Hal S. Stern (2006), “Posterior Predictive Assessment of Item Response Theory Models,” Applied Psychological Measurement, 30 (July), 298-321.
____, ____, and D. Williamson (2003), “Calibrating Item Families and Summarizing the Results Using Family Expected Response Function,” Journal of Educational and Behavioral Statistics, 28, 295-313.
Smith, Peter B. and Shalom H. Schwartz (1997), “Values,” in Handbook of Cross-Cultural Psychology, Volume 3: Social Behavior and Applications, 2d ed., John W. Berry, Marshall H. Segall, and Cigdem Kagitcibasi, eds. Boston, MA: Allyn and Bacon, 77-118.
Spearman, C. (1904), “The Proof and Measurement of Association Between Two Things,” American Journal of Psychology, 15, 72-101.
Steenkamp, Jan-Benedict E.M. (2005), “Moving Out of the U.S. Silo: A Call to Arms for Conducting International Marketing Research,” Journal of Marketing, 69 (October), 6-8.
____ and Hans Baumgartner (1998), “Assessing Measurement Invariance in Cross-National Consumer Research,” Journal of Consumer Research, 25 (June), 78-90.
____ and Katrijn Gielens (2003), “Consumer and Market Drivers of the Trial Rate of New Consumer Products,” Journal of Consumer Research, 30 (December), 368-384.
____ and Hans C.M. van Trijp (1991), “The Use of LISREL in Validating Marketing Constructs,” International Journal of Research in Marketing, 8 (4), 283-299.
Stöber, Joachim, Dorothea E. Dette, and Jochen Musch (2002), “Comparing Continuous and Dichotomous Scoring of the Balanced Inventory of Desirable Responding,” Journal of Personality Assessment, 78 (2), 370-389.
Stricker, Lawrence J. (1969), “Test Wiseness on Personality Scales,” Journal of Applied Psychology, 53 (June), 1-18.
Sudman, Seymour, Norman M. Bradburn and Norbert Schwarz (1996), Thinking About Answers: The Application of Cognitive Processes to Survey Methodologies. San Francisco: Jossey-Bass.
Szymanski, David M., Sundar G. Bharadwaj, and P. Rajan Varadarajan (1993), “Standardization vs. Adaptation of International Marketing Strategy – An Empirical Investigation,” Journal of Marketing, 57 (October), 1-17.
Tanner, Martin A. and Wing Hung Wong (1987), “The Calculation of Posterior Distributions by Data Augmentation,” Journal of the American Statistical Association, 82 (June), 528-550.
Tellis, Gerard J, Eden Yin and Simon Bell (2005), “Global Consumer Innovativeness: Country Differences and Individual Commonalities,” Working Paper, University of Southern California.
Ter Hofstede, Frenkel, Jan-Benedict E.M. Steenkamp, and Michel Wedel (1999), “International Market Segmentation Based on Consumer-Product Relations,” Journal of Marketing Research, 36 (February), 1-17.
____, Michel Wedel, and Jan-Benedict E.M. Steenkamp (2002), “Identifying Spatial Segments in International Markets,” Marketing Science, 21 (2), 160-177.
Thissen, David, Lynne Steinberg, and Meg Gerrard (1986), “Beyond Group Mean Differences: The Concept of Item Bias,” Psychological Bulletin, 99 (1), 118-128.

142
____, ____, and Howard Wainer (1988), “Use of Item Response Theory in the Study of Group Differences in Trace Lines,” in Test Validity, eds. Howard Wainer and Henry I. Braun, Hillsdale, NJ: Lawrence Erlbaum, 147-169.
____, ____, and ____ (1993), “Detection of Differential Item Functioning Using the Parameters of Item Response Models,” in Differential Item Functioning, eds. Paul W. Holland and Howard Wainer, Hillsdale, NJ: Lawrence Erlbaum, 67-113.
Triandis, Harry C. (1989), “The Self and Social Behavior in Differing Cultural Contexts,” Psychological Review, 96 (July), 506-520.
____ (1995), Individualism & Collectivism. Boulder: Westview Press. ____ (and 16 others) (2001), “Culture and Deception in Business Negotiations: A Multilevel
Analysis,” International Journal of Cross-Cultural Management, 1, 73-90. ____ and Eunkook M. Suh (2002), “Cultural Influences on Personality,” Annual Review of
Psychology, 53, 133-160. Tse, David K., Kam-hon Lee, Ilan Vertinsky, and Donald A. Wehrung (1988), “Does Culture
Matter? A Cross-Cultural Study of Executives' Choice, Decisiveness, and Risk Adjustment in International Marketing,” Journal of Marketing, 52 (October), 81-95.
Usunier, Jean-Claude and Julie Anne Lee (2005), Marketing Across Cultures, Harlow: Prentice Hall.
Vandenberg, Robert J., and Charles E. Lance (2000), “A Review and Synthesis of the Measurement Invariance Literature: Suggestions, Practices, and Recommendations for Organizational Research,” Organizational Research Methods, 3 (1), 4-70.
Van de Vijver, Fons and Kwok Leung (1997), “Methods of Data Analysis and Comparative Research,” in Handbook of Cross-Cultural Psychology, Vol. 1, Theory and Methods, ed. John W. Berry, Ype H. Poortinga, and Janak Pandey, Boston: Allyn & Bacon, 257-300.
Van der Linden, Wim J. (1998), “Optimal Assembly of Psychological and Educational Tests,” Applied Psychological Measurement, 22 (September), 195-211.
____ (2005). Linear Models For Optimal Test Design. New York: Springer-Verlag. ____ and Ronald K. Hambleton (1997), Handbook of Modern Item Response Theory, New
York: Springer. Van Hemert, Dianne A., Fons J.R. Van de Vijver, Ype H. Poortinga, and James Georgas
(2002), “Structural and Functional Equivalence of the Eysenck Personality Questionnaire Within and Between Countries,” Personality and Individual Differences, 33 (December), 1229-1249.
Van Herk, Hester, Ype H Poortinga, and Theo M.M. Verhallen (2004), “Response Styles in Rating Scales: Evidence of Method Bias in Data From Six EU Countries,” Journal of Cross-Cultural Psychology, 35 (May), 346-360.
Wainer, Howard, Eric T. Bradlow, and Z. Du (2000), “Testlet Response Theory: An Analog for the 3-PL Useful in Testlet-Based Adaptive Testing,” in: Computerized Adaptive Testing, Theory and Practice, W.J. van der Linden, C.A.W. Glas (eds.), Boston, MA: Kluwer-Nijhof, 245-270.
Wang, Xiaohui, Eric T. Bradlow, and Howard Wainer (2002), “A General Bayesian Model for Testlets: Theory and Applications,” Applied Psychological Measurement, 26 (March), 109-128.
____, ____, ____, (2004), User's Guide for SCORIGHT (Version 3.0): A computer program for scoring tests built of testlets including a module for covariate analysis. ETS Technical Report RR-04-49. Princeton, NJ: Educational Testing Service.
Watson, David and Lee A. Clark (1997), “Extraversion and Its Positive Emotional Core,” in R. Hogan, J. Johnson and S. Briggs (Eds.), Handbook of Personality Psychology (pp. 767-793). San Diego, CA: Academic Press.

143
Weathers, Danny, Subhash Sharma, and Ronald W. Niedrich (2005), “The Impact of The Number of Scale Points, Dispositional Factors, and the Status Quo Decision Heuristic on Scale Reliability and Response Accuracy,” Journal of Business Research, 58 (11), 1516-1524.
Welkenhuysen-Gybels, Jerry, Jaak Billiet, and Bart Cambré (2003), “Adjustment for Acquiescence in the Assessment of the Construct Equivalence of Likert-type Score Items,” Journal of Cross-Cultural Psychology, 34 (November), 702-722.
Winer, Russel S. (1998), “From the Editor,” Journal of Marketing Research, 35 (February), iii-iv.
Wong, Nancy, Aric Rindfleisch, and James E. Burroughs (2003), “Do Reverse-Worded Items Confound Measures in Cross-Cultural Consumer Research? The Case of the Material Values Scale,” Journal of Consumer Research, 30 (June), 72-91.
Wooten, David B. and Americus Reed (2004), “Playing it Safe: Susceptibility to Normative Influence and Protective Self-Presentation,” Journal of Consumer Research, 31 (December), 551-556.
Zerbe, Wilfred J. and Delroy L. Paulhus (1987), “Socially Desirable Responding in Organizational Behavior: A Reconception,” Academy of Management Review, 12 (April), 250-264.

144
Nederlandse Samenvatting Globalisering is een belangrijke factor in hedendaagse afzetmarkten. Verzadigde thuismarkten
en concurrentie van buitenlandse firma’s die toetreden tot lokale markten zorgen ervoor dat
vele bedrijven verder kijken dan de eigen landsgrenzen. Succesvolle internationale
marketingstrategieën vereisen een gefundeerde analyse van consumentengedrag in de
verschillende landen en van de toepasbaarheid van (Amerikaanse) marketingtheorieën. Grote
culturele, institutionele en socio-economische verschillen dragen er toe bij dat bestaande
theorieën niet zonder meer kunnen worden overgedragen naar alle markten.
Wegens beperkte beschikbaarheid van secundaire databronnen, is crossnationaal
marketing- en consumentengedragonderzoek veelal gebaseerd op enquêtes die worden
afgenomen in meerdere landen. Beantwoording van specifieke onderzoeksvragen geschiedt
aan de hand van een stapsgewijs proces. In de eerste fase wordt een theoretisch kader
ontwikkeld, waarin de relevante constructen en concepten worden gedefinieerd en relaties en
hypothesen worden opgesteld. Vervolgens vindt dataverzameling plaats, waarna in de derde
stap de data wordt geanalyseerd. Ten slotte kunnen conclusies worden geëxtraheerd uit de
analyses.
In deze dissertatie staat vooral de verzameling en analyse van crossnationale enquêtedata
centraal. Specifiek gaat het om het opstellen van geschikte, landspecifieke meetinstrumenten
om latente marketingconcepten (bijvoorbeeld tevredenheid, loyaliteit, vertrouwen,
innovativiteit, etc.) accuraat te kwantificeren. Een tweede doel is het bestuderen van de
vergelijkbaarheid of meetinvariantie van data uit verschillende landen. Meetinvariantie
impliceert dat geobserveerde antwoorden op items in een enquête in alle landen op dezelfde
manier met t latente construct samenhangen en dat er dus betekenisvolle vergelijkingen
gemaakt kunnen worden tussen landen.
Een gebrek aan meetinvariantie kan zich voordoen voor specifieke items, als ook uniform
voor een complete set van items (een verschil in responsstijlen, waarbij de responsstijl
specifieke items overstijgt). In dit proefschrift worden methoden ontwikkeld waarbij het
mogelijk is om bij een gebrek aan meetinvariantie toch crossnationale vergelijkbaarheid te
bewerkstelligen.
Meetinvariantie voor specifieke items (Hoofdstuk 2)
De dominante logica in de sociale en economische wetenschap is dat meetinstrumenten een
zekere mate van invariantie moeten vertonen om landen op een valide manier te kunnen

145
vergelijken. Het multigroep confirmatief factor-analytisch model (CFA-model) is de ‘gouden’
standaard om te testen of een meetinstrument dat in meerdere landen is afgenomen invariant
is. Om uitspraken te doen vereist het multigroep CFA-model een zekere mate van invariantie
die afhankelijk is van het doel van de studie. In het algemeen moeten ten minste twee items
invariant zijn voor crossnationale vergelijkbaarheid van de scores op de latente constructen.
In hoofdstuk 2 heb ik een hiërarchisch IRT-model geïntroduceerd dat
marketingonderzoekers in staat stelt om vergelijkingen te maken tussen landen zonder dat
enig item uit de enquête invariant hoeft te zijn. Hoewel het verband tussen items en het latente
construct mag verschillen per land, geldt wel de eis dat er geen verschil in responsstijl is die
exact hetzelfde is voor alle items. De ordinale aard van de data die via Likert-schaal zijn
verkregen, wordt eveneens meegenomen in het model. In een simulatie toonden we aan dat de
eis van meetinvariantie voor twee items kan worden losgelaten. Ik heb dit tevens geïllustreerd
aan de hand van een empirische toepassing die betrekking had op een instrument dat de
ontvankelijkheid van een consument voor normatieve invloed meet. Normatieve invloed is
een belangrijk aspect binnen de marketing. Het is in verband gebracht met bijvoorbeeld
attitudes ten aanzien van merken, receptiviteit voor advertenties, consumentenvertrouwen,
aankoop van nieuwe producten etc.
In elf landen − verdeeld over vier continenten − hebben respondenten de vragen
beantwoord die bij dit meetinstrument horen. Ik heb de resultaten van het multigroep CFA-
model vergeleken met de resultaten op basis van het hiërarchisch IRT-model, en hieruit bleek
dat het CFA-model onjuiste conclusies opleverde. Gebaseerd op het IRT-model vond ik dat,
in overeenstemming met mijn hypothese, consumenten in individualistische landen lager
scoren op ontvankelijkheid voor normatieve invloed dan consumenten in collectivistische
landen. Bovendien bleek dat er meer divergentie in attitudes was in individualistische landen.
Extremen-responsstijl (Hoofdstuk 3)
In de dissertatie zijn twee responsstijlen in enquêtes besproken. Een eerste stijl is de
zogenaamde ‘extremen-responsstijl’ (ERS), waarbij een respondent veel de uiterste opties van
een Likert-schaal gebruikt (uiterste opties zouden kunnen zijn: ‘helemaal niet mee eens, en
‘helemaal mee eens’), relatief onafhankelijk van het onderwerp waarover hij/zij wordt
ondervraagd.
Voor ERS heb ik een nieuw hiërarchisch IRT-model ontwikkeld om te kwantificeren in
hoeverre mensen de uiterste opties van de antwoordschaal gebruiken. Dit model veronderstelt
een set van items die heterogeen is, in de zin dat er tal van verschillende onderwerpen worden

146
aangekaart die niet veel met elkaar te maken hebben. Als respondenten op vele items die
onderling erg verschillend zijn telkens een extreem antwoord geven, dan is het zeer
waarschijnlijk dat iemand geneigd is de extremen op te zoeken. In het ontwikkelde
meetmodel wordt het echter toegestaan dat de set van items ook uitspraken bevat die wel met
elkaar samenhangen. Ook is onderzocht in hoeverre ERS varieert voor verschillende landen.
De schattingsresultaten gaven aan dat consumenten inderdaad verschillen in ERS, maar ook
dat niet ieder item even sterk wordt beïnvloed door ERS. Met andere woorden, in sommige
gevallen kunnen substantieve overwegingen de overhand hebben, terwijl bij andere, meer
ambigue stellingen de responsstijl kan domineren. Deze effecten zijn landspecifiek: in
bepaalde landen gebruiken consumenten de uiteinden van een antwoordschaal significant
minder dan in andere landen, en in hoeverre items worden beïnvloed door ERS hangt af van
het specifieke land. Het model is toegepast op een grote dataset van 26 landen, met in totaal
12.500 respondenten. Individuele verschillen in ERS kunnen in beperkte mate worden
verklaard uit sociodemografische kenmerken, en cultuur had een sterk en voorspelbaar effect
op de geneigdheid tot ERS. Vrouwen scoren wat hoger op ERS dan mannen, en zowel jonge
als oude consumenten zijn meer geneigd de extremen te gebruiken. Op cultuurniveau is ERS
significant positief gerelateerd aan individualisme, vermijding van onzekerheid, en
masculiniteit.
Sociaal wenselijk antwoordgedrag (Hoofdstuk 4)
Een tweede responsstijl die ik heb besproken is ‘sociaal wenselijk antwoordgedrag’ (SWA).
In deze dissertatie is een conceptueel raamwerk ontwikkeld waarin de geneigdheid tot sociaal
wenselijk antwoordgedrag wordt beïnvloed door persoonlijkheid, door sociodemografische
factoren, door cultuur, en door de interactie van persoonlijkheid en cultuur. De analyse is
gebaseerd op het hiërarchisch IRT-model dat de latente scores op elk van de
persoonlijkheidsconstructen, en het SWA-construct op een gemeenschappelijke schaal schat.
De tendens tot SWA is sterker als consumenten ouder zijn, tot lagere sociale klassen behoren,
als ze open, gewetensvol/nauwgezet en vriendelijk zijn, en lager indien men neurotisch is.
Respondenten in landen waar veel hiërarchie is, waar onzekerheid vermeden dient te worden,
en waar veel masculiniteit is, waren eveneens meer geneigd tot SWA. In individualistische
landen doet SWA zich minder voor. Verder waren er interacties tussen cultuur en
persoonlijkheid. Het positieve effect van vriendelijkheid op SWA wordt versterkt in
collectivistische landen, terwijl het positieve effect van een gewetensvolle/nauwgezette

147
houding op SDR sterker is in onzekerheidsmijdende landen. Het effect van extraversie op
SDR werd significant versterkt in hiërarchische en in masculiene culturen.
Internationale schaalconstructie (Hoofdstuk 5)
In het laatste hoofdstuk stond de constructie van landspecifieke meetinstrumenten centraal. In
de literatuur worden vaak exact dezelfde items in elk land gebruikt, en meetmodellen vereisen
ten minste dat er een gezamenlijke set van items is om uitspraken te kunnen doen over een
latent construct en om landen te vergelijken. In hoofdstuk 5 ontwikkel ik een procedure met
als unieke eigenschap dat er volledig landspecifieke maar toch crossnationaal vergelijkbare
korte meetinstrumenten uit voortvloeien. De procedure is gebaseerd op de juxtapositie van
een ordinaal IRT-model en optimale testconstructie-technieken uit de psychometrie. In de
optimale testconstructiestap wordt er een combinatorisch optimalisatieprobleem opgelost
zodat het meetinstrument een zekere a priori gekozen meetprecisie oplevert die kan
verschillen per respondent. De methodologie wordt geïllustreerd aan de hand van een schaal
die de neiging tot impressie management meet. De schaal wordt zowel ingekort als
landspecifiek gemaakt. Het is mogelijk om een vaste precisie op te leggen, waardoor de
meetinstrumenten per land niet hetzelfde aantal items hoeven te bevatten, als ook om een vast
aantal items op te leggen, waardoor de precisie kan verschillen per land. Dit levert
verschillende schalen op.