Embed Size (px)
Citation preview

Tilburg University
Rugby versus soccer in South Africa
Malda, M.; van de Vijver, F.J.R.; Temane, Q.M.
Published in:Intelligence
Document version:Publisher's PDF, also known as Version of record
Publication date:2010
Link to publication
Citation for published version (APA):Malda, M., van de Vijver, F. J. R., & Temane, Q. M. (2010). Rugby versus soccer in South Africa: Contentfamiliarity contributes to cross-cultural differences in cognitive test scores. Intelligence, 38(6), 582-595.
General rightsCopyright and moral rights for the publications made accessible in the public portal are retained by the authors and/or other copyright ownersand it is a condition of accessing publications that users recognise and abide by the legal requirements associated with these rights.
- Users may download and print one copy of any publication from the public portal for the purpose of private study or research - You may not further distribute the material or use it for any profit-making activity or commercial gain - You may freely distribute the URL identifying the publication in the public portal
Take down policyIf you believe that this document breaches copyright, please contact us providing details, and we will remove access to the work immediatelyand investigate your claim.
Download date: 29. Mar. 2020

Intelligence xxx (2010) xxx–xxx
INTELL-00598; No of Pages 14
Contents lists available at ScienceDirect
Intelligence
Rugby versus Soccer in South Africa: Content familiarity contributes tocross-cultural differences in cognitive test scores☆
Maike Malda a,⁎, Fons J.R. van de Vijver a,b, Q. Michael Temane b
a Tilburg University, the Netherlandsb North-West University, South Africa
a r t i c l e i n f o
☆ We thank Ansie Kitching and Dipuo for their helpOur gratitude goes to Abegale, Andrea, Anita, CorleKefilwe, Keitumetse, Kelebogile, Liesl, Lorato, MaMaryke, Masego, Myrtle, Segametsi, Sharlott, Suritaand Vidette for administering the cognitive tests to thlike to thank the principals and teachers of the participinterest and enthusiasm in our study. Last but noparticipating children.⁎ Corresponding author. Department of Psychology,
box 90153, 5000 LE Tilburg, the Netherlands. Tel.: +3E-mail address: [email protected] (M. Mald
0160-2896/$ – see front matter © 2010 Elsevier Inc.doi:10.1016/j.intell.2010.07.004
Please cite this article as: Malda, M., etcultural differences in cognitive test score
a b s t r a c t
Article history:Received 16 July 2009Received in revised form 24 July 2010Accepted 28 July 2010Available online xxxx
In this study, cross-cultural differences in cognitive test scores are hypothesized to depend on atest's cultural complexity (Cultural Complexity Hypothesis: CCH), here conceptualized as itscontent familiarity, rather than on its cognitive complexity (Spearman's Hypothesis: SH). Thecontent familiarity of tests assessing short-term memory, attention, working memory, andfigural and verbal fluid reasoning, was manipulated by constructing test versions with an itemcontent derived from either Afrikaans or Tswana culture in South Africa. Both test versionswere administered to children of both cultures. The sample consisted of 161 urban Afrikaans,181 urban, and 159 rural Tswana children (Mage=9.37 years). Children generally performedbest on the test version that was designed for their own group, particularly on the cognitivelyand culturally complex working memory and figural fluid reasoning tests. This relationbetween content familiarity and cognitive test performance supports CCH and disconfirms SH.
© 2010 Elsevier Inc. All rights reserved.
Keywords:CognitionCultureSpearman's HypothesisContent familiarityValiditySouth Africa
Cross-cultural differences in cognitive test scores are notwell understood (Fagan & Holland, 2002, 2007, 2009; Helms-Lorenz, Van de Vijver, & Poortinga, 2003; Sternberg et al.,2002). Where do they come from and why are they larger forsome tests than for others? Spearman's Hypothesis (SH)relates these cross-cultural differences to the cognitivecomplexity of tests; differences are larger for tests with ahigher cognitive complexity (Jensen, 1985, 1998). SH attri-butes this pattern to cross-cultural differences in the under-lying general cognitive ability on which tests with a higher
during the pilot study.ne, Hester, Ina-Mari,rguerite, Marichelle,, Tsholofelo, Victoria,e children. We wouldating schools for theirt least, we thank all
Tilburg University, PO1 0 13 4662526.a).
All rights reserved.
al., Rugby versus Socces, Intelligence (2010), d
cognitive complexity more strongly rely. However, scoredifferences between cultures can also be caused by test bias orby cultural differences in valued and therefore trainedstrategies to solve certain cognitive tasks (Bridgeman &Buttram, 1975; Montie & Fagan, 1988). In line with the optionof test bias, Helms-Lorenz et al. (2003) state that a test'scognitive complexity could be confounded with its culturalcomplexity (which can cause test bias) and the latter maylargely explain cross-cultural score differences. A test'scultural complexity refers to the extent to which specificcultural knowledge is required to perform well on this test,such as declarative (factual) knowledge and proceduralknowledge (i.e., knowledge on cultural practices, such assports or celebrations) that is shared in a particular culture.The extent to which test content (e.g., concepts, drawings) ismore familiar to one of several compared cultural groups is areflection of cultural complexity. In order to disentangle theinfluence of cultural and cognitive complexity on testperformance, the present study examines the effect of contentfamiliarity on the performance on tests of different cognitivecomplexity. More specifically, we address the role of contentfamiliarity in tests measuring (the cognitively complex ability
r in South Africa: Content familiarity contributes to cross-oi:10.1016/j.intell.2010.07.004

2 M. Malda et al. / Intelligence xxx (2010) xxx–xxx
of) fluid reasoning and tests measuring (the less complex,though related abilities of) short-termmemory, attention, andworking memory (Carroll, 1993; McGrew, 2005). For each ofthese tests, two test versions were developed in which thecontent familiarity of the items was maximized for eitherAfrikaans or Tswana school-age children in South Africa. Bothversions were administered to children of both groups.
1. Cultural complexity
Successful performance on a test with a high culturalcomplexity requires specific cultural knowledge (Helms-Lorenzet al., 2003). This knowledge is stored in a semantic network inmemory, which can be viewed as a system of nodes (culturalelements)with links (associations)between them. Thisnetworkis comparable to the system of cognitive elements required forcognitive skill acquisition (see Anderson, 1982). For peoplewhoare familiar with the culture in which a test is developed, thissemantic network has a well defined structure of strong andweak links, which means that relevant associations are readilymade between the content of the test and their knowledge. Thisnetwork facilitates the successful completion of the test. Peoplefrom a different culture do not have this well developedsemantic network associated with the content of this particulartest, because they may not know the cultural elements or theirassociations; as a consequence, they have difficulty to performwell. The level of cultural complexity of a test then refers to theextent to which an elaborate and automated semantic networkof cultural information is required to perform well. Culturalcomplexity is conceptualized in the present study as the extentto which test content is more familiar to one of the comparedgroups.
2. Cognitive abilities in the present study
Short-term memory is described as “the ability to appre-hendandmaintain awareness of elements of information in theimmediate situation” (McGrew, 2005, p. 153). Controlledattention is defined as “the capacity to maintain and holdrelevant information in the face of interference or distraction”(Swanson, 2008, p. 582). Working memory is “a system for thesimultaneous processing and storage of information” (Ober-erauer, Süß, Schulze,Wilhelm, &Wittmann, 2000, p. 1018). Theassignment of attention to the contents of short-termmemorycreates working memory (Schweizer & Moosbrugger, 2004;Swanson, 2008). Fluid reasoning is defined as “the use ofdeliberate and controlledmental operations to solve novel, ‘on-the-spot’ problems (i.e., tasks that cannot be performedautomatically)” (McGrew, 2005, p. 151).
Some researchers state that short-term memory andworkingmemory cannot be differentiated in children (Hutton& Towse, 2001); however, others have shown that they arealready distinguishable from six years of age (Gathercole,Pickering, Ambridge, & Wearing, 2004; Swanson, 2008).Working memory capacity and fluid reasoning are stronglyrelated (Süß, Oberauer,Wittmann,Wilhelm, & Schulze, 2002),though distinguishable (Ackerman, Beier, & Boyle, 2005).Conway, Cowan, Bunting, Therriault, and Minkoff (2002)indicated that rather complex tasks such as working memorytasks do not rely on automated routines, similar to fluidreasoning tasks.Workingmemory and reasoning tasks share a
Please cite this article as: Malda, M., et al., Rugby versus Soccecultural differences in cognitive test scores, Intelligence (2010), d
demand for controlled attention. Both working memory andattention play a role in fluid reasoning (Unsworth & Engle,2005); they have a direct relationship with fluid reasoningand the relation between attention and fluid reasoning ismediated by working memory as well (Schweizer & Moos-brugger, 2004). The cognitive structure underlying fluidreasoning abilities that is compatible with these findings isshown in Fig. 1. Short-term memory and attention have bothdirect and indirect relations with fluid reasoning. Workingmemory plays a mediating role. Going from left to right inFig. 1, the abilities become cognitively more complex.
3. Cognitive versus cultural complexity
Relatively small cross-cultural differences have beenfound in attention and short-termmemory, larger differencesin working memory, and the largest differences have beenreported in fluid reasoning. How can this patterning beexplained? One explanation, known as Spearman's Hypoth-esis (SH), holds that tasks with a higher cognitive complexityshow larger cross-cultural score differences, mainly becauseof assumed cross-cultural differences in the underlyinggeneral cognitive ability on which such tasks strongly rely(Jensen, 1985, 1998). Fluid reasoning tasks produce thelargest cross-cultural differences because of their largecognitive complexity when compared to attention, short-term memory, and working memory tasks (Carroll, 1993).Jensen has conducted many studies that supported SH,ranging from batteries of reaction time tasks in whichcognitive complexity was varied by increasing the numberof response alternatives (Jensen, 1993) to broad cognitivebatteries involving a range of cognitive abilities (reviews canbe found in Jensen, 1985, 1998). Both Spearman and Jensenfocused on IQ differences between Blacks and Whites in theUnited States; other researchers, testing SH among othergroups in other contexts, using various cognitive tests, alsofound support for the hypothesis (e.g., Hartmann, Kruuse, &Nyborg, 2007; Lynn & Owen, 1994; Rushton, 2002; TeNijenhuis, Evers, & Mur, 2000; Te Nijenhuis, Tolboom, Resing,& Bleichrodt, 2004; Te Nijenhuis & Van der Flier, 1997, 2003,2004, 2005).
SH has met with both statistical and conceptual criticism.The adequacy of widely employed statistical procedures totest the hypothesis has been questioned. Multigroup confir-matory factor analysis has been proposed as a statisticallymore rigorous procedure for testing SH than Jensen's methodof correlated vectors; a re-analysis of two data sets that weresupportive of SH when analyzed by Jensen's method failed tomeet basic requirements of cross-cultural comparability in amultigroup confirmatory factor analysis (see Dolan, Roorda, &Wicherts, 2004). Also, Wicherts and Dolan (2010) found thatthe allegedly small cultural bias reported by Te Nijenhuis et al.(2004) appeared to be more substantial when re-analyzingtheir data by including a test for the equality of measurementintercepts over groups. In a similar vein,Wicherts and Johnson(2009) provided statistical arguments against the proceduresused by Rushton (2002; see also Rushton, Bons, Vernon, &Cvorovic, 2007) to draw conclusions about the nature of groupdifferences in cognitive abilities in terms of SH and theheritability of these differences.
r in South Africa: Content familiarity contributes to cross-oi:10.1016/j.intell.2010.07.004

Attention
Figural
Verbal
.24
.26
.29
.33
.33
.57
.42
.35
Error
Error
Error
Error
fluid reasoning
Fluid reasoning
fluid reasoning
Short-term memory
Working memory
Fig. 1. Cognitive structure (hypothesized and confirmed). Note: all depicted parameter estimates are significant, pb .01.
Table 1Expected score pattern for hypotheses.
Hypothesis Test version Expected score pattern
Group
1 (CCH) Afrikaans-culture Afrikaans≥Rural TswanaTswana-culture Rural Tswana≥Afrikaans
2 (SH) Afrikaans-culture One group≥other groupsTswana-culture The same group≥other groups
3 Afrikaans-culture Urban Tswana in between othergroups
Tswana-culture Urban Tswana in between othergroups
3M. Malda et al. / Intelligence xxx (2010) xxx–xxx
There are substantive reasons to doubt the importance ofcognitive complexity in explaining cross-cultural scoredifferences. Hunt and Carlson (2007) as well as Wicherts,Dolan, Carlson, and Van der Maas (2010) mentionedenvironmental aspects as possible sources of group differ-ences in cognitive test scores. The related concepts ofaffluence and socioeconomic status are suggested to contrib-ute to these score differences (Van de Vijver, 1997). Also, thecontent of a test or the medium in which a test isadministered has been shown to determine how well achild performs. Serpell (1979) tested the perceptual skills ofBritish and Zambian children by administering similar tasksin different media. British children performed better on paperand pencil tasks whereas the Zambian children performedbetter on wire-modelling tasks. Carraher, Carraher, andSchliemann (1985) found that Brazilian school-going chil-dren performed better on arithmetic tasks when they werepresented in the form of a problem (as in an everyday marketsituation) than when they were presented as numericalcalculations (as in school). Fagan and Holland (2002, 2007,2009) have shown thatmajority andminority adults in the USobtained similar scores on cognitive tasks when they wereequally exposed to the information required to successfullycomplete the tasks.
The explanation of cross-cultural score differences that wetest in the current study holds that cognitive complexity isusually confounded with cultural complexity, and that thelatter is the actual factor explaining most of the cross-culturalscore differences (Helms-Lorenz et al., 2003). We label thisexplanation the Cultural Complexity Hypothesis (CCH). Themodel holds that cross-cultural score differences increasewith the cultural complexity of the stimulus content (i.e.,content familiarity). Cultural complexity can vary both acrosstests that measure different skills and across tests thatmeasure a single skill using stimuli that differ in familiarity.To startwith the former, tests that address simple informationprocessing usually show less cultural complexity than testsaddressing complex information processing (Helms-Lorenz et
Please cite this article as: Malda, M., et al., Rugby versus Soccecultural differences in cognitive test scores, Intelligence (2010), d
al., 2003; Vock & Holling, 2008; cf. however Jensen, 1993, andTe Nijenhuis & Van der Flier, 2003). The former tests,measuring abilities such as attention and short-termmemory,do not employ complex cultural information and hence, theyare not very sensitive to group (and individual) differences inaccess to cultural information. Cross-cultural differences onthese tests are expected to be small. The differences are largeron more complex processes, such as working memory, andwill be largest on the most complex tests, such as fluidreasoning tests, which often require extensive culturalinformation to solve them. SH would predict the sameincrease in cross-cultural differences across these differenttypes of tests, but due to an increase in cognitive rather thancultural complexity; hence, the common confounding of thesetwo types of complexity. Therefore, the present studyexamines cross-cultural differences also across tests thatmeasure the same skill using stimuli of different familiarity,as explained in the next section.
4. Present study and hypotheses
A test was constructed for each of the abilities displayed inFig. 1. There were two versions of each test. One versioncontained items with a relatively higher content familiarity
r in South Africa: Content familiarity contributes to cross-oi:10.1016/j.intell.2010.07.004

Table 2Sample size for each group and test version.
Group Test version
Afrikaans-culture Tswana-culture
Total Female Male Grade 3 Grade 4 Total Female Male Grade 3 Grade 4
Afrikaans 80 39 41 40 40 81 41 40 41 40Urban Tswana 91 38 53 44 47 90 46 44 44 46Rural Tswana 82 39 43 42 40 77 42 35 41 36
4 M. Malda et al. / Intelligence xxx (2010) xxx–xxx
for the Afrikaans than for the Tswana children, labeled theAfrikaans-culture test version. The other contained itemswith a relatively higher content familiarity for the Tswanathan for the Afrikaans children, labeled the Tswana-culturetest version. The study involved both urban and rural Tswanachildren, who differed in their exposure to Afrikaans culture(with urban children being more exposed than ruralchildren) and to more traditional Tswana culture (withrural children being more exposed than urban children).
According to CCH, differences in test scores between theAfrikaans and Tswana children are due to differences in thecontent familiarity of the tests; CCH predicts that one groupscores at least as high as the other group(s) on the testversion developed for its own culture.1 According to SH,differences between the Afrikaans and Tswana children aredue to differences in the underlying cognitive abilities thatare required to successfully complete the tests; SH predictsthat one group scores consistently higher than the other(s)on both test versions (apart from random fluctuations).Generally, we expect the score differences to be largestbetween the Afrikaans and the rural Tswana group. Based onthese two different lines of reasoning, two contradictinghypotheses can be formulated of which we expect to confirmthe first (CCH) and disconfirm the second (SH; see alsoTable 1 for an overview of the expected score patterns):
1. CCH: Afrikaans children score at least as high as ruralTswana children on the Afrikaans-culture test version andrural Tswana children score at least as high as Afrikaanschildren on the Tswana-culture test version (differencesbetween groups are smallest for short-term memory andattention, larger for working memory, and largest for fluidreasoning).
2. SH: One particular cultural group scores at least as high asthe other group(s) on both the Afrikaans-culture and theTswana-culture test version (differences between groupsare smallest for short-term memory and attention, largerfor working memory, and largest for fluid reasoning).
The urban Tswana children are exposed to aspects of bothcultures and are therefore expected to score in between the
1 The three groups included in the present study are characterized bylarge differences in SES and related environmental conditions, with theAfrikaans group living in the most advantaged environment. As aconsequence, it is very likely that the Afrikaans group obtains higher overallscores than the other groups. Our hypotheses do not mention theseconditions and resultant score differences, because we statistically correctfor a presumably large part of these differences in our hypotheses tests bystandardizing for SES.
Please cite this article as: Malda, M., et al., Rugby versus Soccecultural differences in cognitive test scores, Intelligence (2010), d
Afrikaans and rural Tswana group on both test versions. Thisscore pattern would be in line with both CCH and SH:
3. Urban Tswana children score in between Afrikaans andrural Tswana children on both the Afrikaans-culture andthe Tswana-culture test version.
5. Method
5.1. Participants
The sample consisted of 501 South African primary schoolchildren (245 girls, 256 boys) from grades 3 and 4, with anaverage age of 9.37 years (SD=1.05). One hundred sixty-onewere white urban Afrikaans children from two primary schoolsin the town of Potchefstroom, North-West Province; 181 wereblack urban Tswana children from two primary schools inIkageng, a township near Potchefstroom; 159 were black ruralTswana children from three primary schools in Ramatlabama, arural setting 15 kilometres outside of the city of Mafikeng,North-West Province. The three groups differed in culture(Afrikaans-culture versus Tswana-culture), language (Afrikaanslanguage versus Setswana language, the language of theTswana), socioeconomic status (the Afrikaans group was ofhigher socioeconomic status than the two Tswana groups) andlocality of residence (urban versus rural). The latter distinction,however, was not as large as the terms urban and ruralmightsuggest; it was merely a relative distinction in that thechildren from Potchefstroom (“Afrikaans”) and Ikageng(“urban Tswana”) lived in amore urban areawhen comparedto the more rural area of Ramatlabama (“rural Tswana”).However, we did not observe substantial differences in thequality of education unlike in many studies describing urban–rural distinctions. The main implication of our relative urban–rural distinction was a difference in the exposure to Afrikaans'culture; the urban Tswana group was more exposed to theAfrikaans way of life than the rural Tswana group.
Most of the houses of Afrikaans children were made ofbricks and had tiled roofs, while most houses of the Tswanachildren had walls of either corrugated iron or bricks and roofsof corrugated iron. Eighty-one percent of Afrikaans childrenhad their own roomasopposed to31% of the urbanTswana and40% of the rural Tswana children. Afrikaans children had 2.36cars per family on average, whereas 35% of the urban Tswanafamilies and 50% of the rural Tswana families had a car.
5.2. Instruments
Five cognitive testswere constructed: a short-termmemorytest, an attention test, a working memory test, a figural fluid
r in South Africa: Content familiarity contributes to cross-oi:10.1016/j.intell.2010.07.004

Table 3Means and standard deviations for scores on Raven's Standard ProgressiveMatrices.
Group Children selected for
Afrikaans-cultureversion
Tswana-cultureversion
M SD M SD
Afrikaans 23.75 5.07 23.75 4.83Urban Tswana 14.75 5.31 13.00 4.78Rural Tswana 12.71 4.94 12.90 4.99
5M. Malda et al. / Intelligence xxx (2010) xxx–xxx
reasoning test, and a verbalfluid reasoning test. Therewere twocultural versions of each test, based on the relative familiarity ofitem content: an Afrikaans-culture and a Tswana-cultureversion. The two test versions were developed in a three-month pilot phase. We visited children's homes and schools,and spoke to parents, teachers, and specialists (e.g., a childpsychologist, speech therapist) to obtain information regardingwords, objects, customs and practices that were familiar to theAfrikaans and Tswana children, respectively. Pilot testing tookplace at three schools and involved 50 children. An iterativeprocedure was applied of translating the test instructions intothe local languages, administering the instruments to a smallnumber of children, and adapting the content and/or instruc-tions if necessary, until the instruments were deemedappropriate. The instructions and items of both test versionswere developed in English and then translated into theAfrikaans and the Setswana language. Afrikaans children didall tests (so, both the tests with a more Afrikaans and the testswith a more Tswana content) in the Afrikaans language;Tswana children did both types of tests in the Setswanalanguage. The short-term memory test, attention test, andworking memory test had a discontinuation rule: these testswere stopped after the child failed three consecutive items. Thefigural and verbal fluid reasoning tests did not have adiscontinuation rule.
5.2.1. Short-term memory testThis individually administered test consisted of 24 items
and required the child to repeat word sequences, varyingfrom two to nine words, read out loud by the test examiner.Both the Afrikaans-culture and Tswana-culture test versionused meaningful words with a higher familiarity for theAfrikaans and Tswana children, respectively. Examples ofwords used in the Afrikaans-culture test version are “com-puter”, “camera” and “shower”, and examples of the Tswana-culture test version are “tuckshop” (a small food shop that iscommon in the Tswana community), “soccer”, and “braids”.
5.2.2. Attention testThe child's task in the individually administered attention
test was to count the number of times he/she heard a pre-specified groupofwords in the sequence ofwords readout loudby the test examiner. The test consisted of 24 items. TheAfrikaans-culture version targeted groups of two electricalappliances followedbyonepiece of clothing (e.g., Heater–Iron–Trousers); the Tswana-culture version aimed at groups of twofamily members followed by one animal (e.g., Aunt–Son–Dog).
5.2.3. Working memory testThis individually administered test is inspired by the
Working Memory Test Battery for Children (Pickering &Gathercole, 2001). The first 3 items of our instrument requiredthe child to judge whether a statement was true or false. Thefollowing 18 items required the child to judge whether astatement was true or false and remember this while listeningto statements that followed. After the test examiner finishedreading all statements in a single item, the child was asked tosay for each of them whether it was true or false, in the sameorder as the examiner read them. The statements increased innumber (from two to seven) aswell as complexity. A statementof the lowest complexity consisted of one single sentence (e.g.,
Please cite this article as: Malda, M., et al., Rugby versus Soccecultural differences in cognitive test scores, Intelligence (2010), d
A fridge is cold); a statementof a higher complexity consisted oftwo combined sentences (e.g., A fridge is cold and a kettle coolswater); a statement with the highest complexity containedthree combined sentences (e.g., A fridge is cold and a kettlecools water and a library has books).
The Afrikaans-culture and Tswana-culture versions con-sisted of meaningful true/false statements, reflecting familiarinformation for the Afrikaans and Tswana children respec-tively, such as “An alarm can make noise” for the Afrikaans-culture test version and “A soccer team has 11 players” for theTswana-culture test version (soccer is the most popular sportamong the Tswana children whereas rugby is most popularamong the Afrikaans).
5.2.4. Figural fluid reasoning testThis individually administered test is based on the subtest
Situations of the Snijders-Oomen Non-Verbal Intelligence Test,Revised (Snijders, Tellegen, & Laros, 1989) and relies on thesame principle as Raven's Standard Progressive Matrices(Raven, Raven, & Court, 1998). The child was shown a drawingwith a missing part and had to choose from various answeroptions which piece best completed the drawing. The Afri-kaans-culture and Tswana-culture versions consisted of 18items and contained drawings of situations (at home, in school,on the streets) that were highly familiar to the Afrikaans andTswana children, respectively. For example, for the Afrikaans-culture test version, a drawing of a swimming pool wasincluded, and the Tswana-culture test version contained adrawingof a specific cookingprocedure (twowomenpreparingporridge in a three-legged pot). The first seven items had onemissing part, the next seven items had two, and the last fouritems had three missing parts.
5.2.5. Verbal fluid reasoning testThis collectively administered test consisted of 19 items.
The child had to choose one word that did not go togetherwith the other three (for the first 16 items) or the other two(for the last 3 items). Both the Afrikaans-culture (e.g., rugby–swimming–cricket–tennis) and Tswana-culture version (e.g.,grass–fire–three-legged pot–wooden spoon) contained itemsthat were presumed to be highly familiar for the Afrikaansand Tswana children, respectively. The test examiner read thewords out loud and the children could read along and circletheir answer on an answer sheet.
5.2.6. Raven's Standard Progressive MatricesThe test (Raven et al., 1998) measures figural fluid
reasoning and requires the child to complete a (meaningless)
r in South Africa: Content familiarity contributes to cross-oi:10.1016/j.intell.2010.07.004
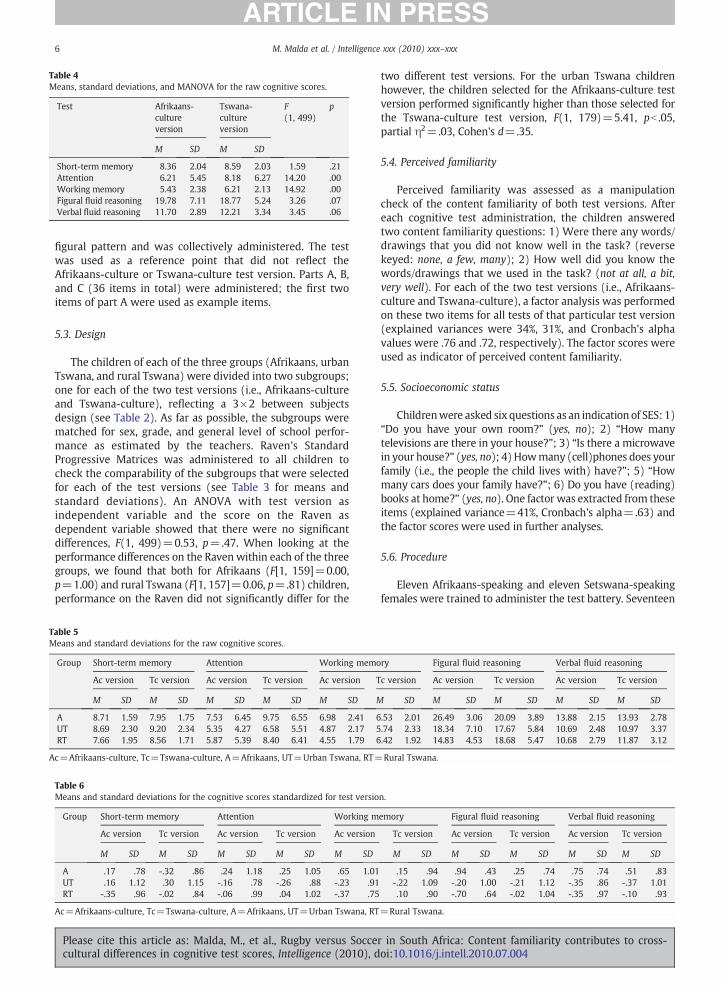
Table 4Means, standard deviations, and MANOVA for the raw cognitive scores.
Test Afrikaans-cultureversion
Tswana-cultureversion
F(1, 499)
p
M SD M SD
Short-term memory 8.36 2.04 8.59 2.03 1.59 .21Attention 6.21 5.45 8.18 6.27 14.20 .00Working memory 5.43 2.38 6.21 2.13 14.92 .00Figural fluid reasoning 19.78 7.11 18.77 5.24 3.26 .07Verbal fluid reasoning 11.70 2.89 12.21 3.34 3.45 .06
TM
A
6 M. Malda et al. / Intelligence xxx (2010) xxx–xxx
figural pattern and was collectively administered. The testwas used as a reference point that did not reflect theAfrikaans-culture or Tswana-culture test version. Parts A, B,and C (36 items in total) were administered; the first twoitems of part A were used as example items.
5.3. Design
The children of each of the three groups (Afrikaans, urbanTswana, and rural Tswana) were divided into two subgroups;one for each of the two test versions (i.e., Afrikaans-cultureand Tswana-culture), reflecting a 3×2 between subjectsdesign (see Table 2). As far as possible, the subgroups werematched for sex, grade, and general level of school perfor-mance as estimated by the teachers. Raven's StandardProgressive Matrices was administered to all children tocheck the comparability of the subgroups that were selectedfor each of the test versions (see Table 3 for means andstandard deviations). An ANOVA with test version asindependent variable and the score on the Raven asdependent variable showed that there were no significantdifferences, F(1, 499)=0.53, p=.47. When looking at theperformance differences on the Raven within each of the threegroups, we found that both for Afrikaans (F[1, 159]=0.00,p=1.00) and rural Tswana (F[1, 157]=0.06, p=.81) children,performance on the Raven did not significantly differ for the
Table 6Means and standard deviations for the cognitive scores standardized for test versio
Group Short-term memory Attention Working m
Ac version Tc version Ac version Tc version Ac version
M SD M SD M SD M SD M SD
A .17 .78 -.32 .86 .24 1.18 .25 1.05 .65 1.01UT .16 1.12 .30 1.15 -.16 .78 -.26 .88 -.23 .91RT -.35 .96 -.02 .84 -.06 .99 .04 1.02 -.37 .75
Ac=Afrikaans-culture, Tc=Tswana-culture, A=Afrikaans, UT=Urban Tswana, RT
able 5eans and standard deviations for the raw cognitive scores.
Group Short-term memory Attention Working memo
Ac version Tc version Ac version Tc version Ac version T
M SD M SD M SD M SD M SD M
A 8.71 1.59 7.95 1.75 7.53 6.45 9.75 6.55 6.98 2.41 6UT 8.69 2.30 9.20 2.34 5.35 4.27 6.58 5.51 4.87 2.17 5RT 7.66 1.95 8.56 1.71 5.87 5.39 8.40 6.41 4.55 1.79 6
c=Afrikaans-culture, Tc=Tswana-culture, A=Afrikaans, UT=Urban Tswana, RT=
Please cite this article as: Malda, M., et al., Rugby versus Soccecultural differences in cognitive test scores, Intelligence (2010), d
two different test versions. For the urban Tswana childrenhowever, the children selected for the Afrikaans-culture testversion performed significantly higher than those selected forthe Tswana-culture test version, F(1, 179)=5.41, pb .05,partial η2=.03, Cohen's d=.35.
5.4. Perceived familiarity
Perceived familiarity was assessed as a manipulationcheck of the content familiarity of both test versions. Aftereach cognitive test administration, the children answeredtwo content familiarity questions: 1) Were there any words/drawings that you did not know well in the task? (reversekeyed: none, a few, many); 2) How well did you know thewords/drawings that we used in the task? (not at all, a bit,very well). For each of the two test versions (i.e., Afrikaans-culture and Tswana-culture), a factor analysis was performedon these two items for all tests of that particular test version(explained variances were 34%, 31%, and Cronbach's alphavalues were .76 and .72, respectively). The factor scores wereused as indicator of perceived content familiarity.
5.5. Socioeconomic status
Childrenwere asked six questions as an indication of SES: 1)“Do you have your own room?” (yes, no); 2) “How manytelevisions are there in your house?”; 3) “Is there a microwavein your house?” (yes, no); 4) Howmany (cell)phones does yourfamily (i.e., the people the child lives with) have?”; 5) “Howmany cars does your family have?”; 6) Do you have (reading)books at home?” (yes, no). One factor was extracted from theseitems (explained variance=41%, Cronbach's alpha=.63) andthe factor scores were used in further analyses.
5.6. Procedure
Eleven Afrikaans-speaking and eleven Setswana-speakingfemales were trained to administer the test battery. Seventeen
n.
emory Figural fluid reasoning Verbal fluid reasoning
Tc version Ac version Tc version Ac version Tc version
M SD M SD M SD M SD M SD
.15 .94 .94 .43 .25 .74 .75 .74 .51 .83-.22 1.09 -.20 1.00 -.21 1.12 -.35 .86 -.37 1.01.10 .90 -.70 .64 -.02 1.04 -.35 .97 -.10 .93
=Rural Tswana.
ry Figural fluid reasoning Verbal fluid reasoning
c version Ac version Tc version Ac version Tc version
SD M SD M SD M SD M SD
.53 2.01 26.49 3.06 20.09 3.89 13.88 2.15 13.93 2.78
.74 2.33 18.34 7.10 17.67 5.84 10.69 2.48 10.97 3.37
.42 1.92 14.83 4.53 18.68 5.47 10.68 2.79 11.87 3.12
Rural Tswana.
r in South Africa: Content familiarity contributes to cross-oi:10.1016/j.intell.2010.07.004
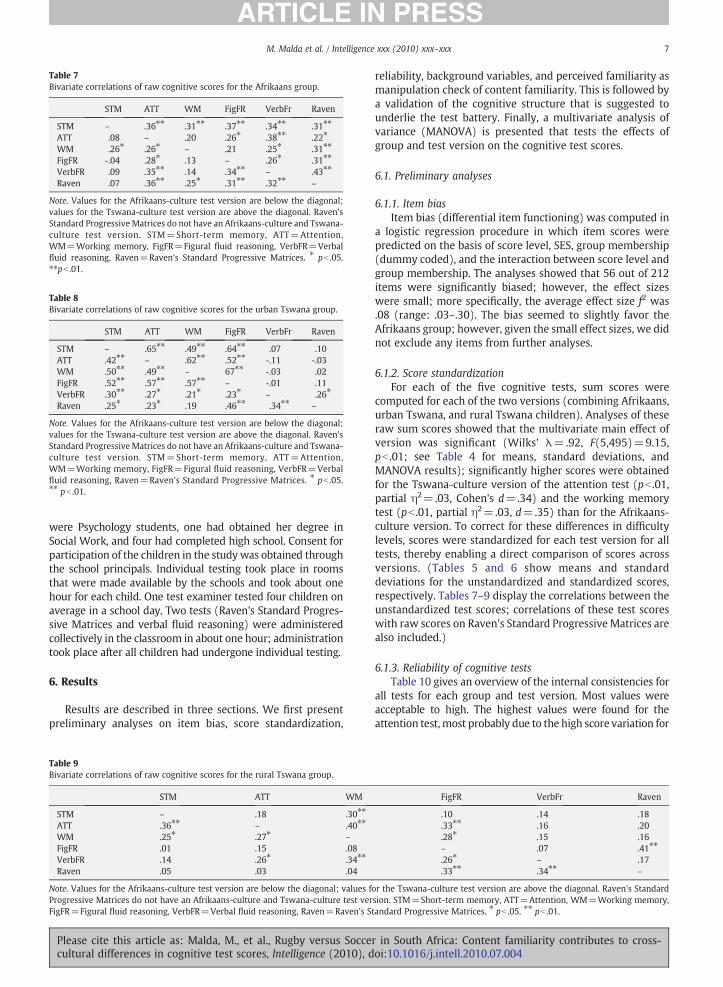
Table 7Bivariate correlations of raw cognitive scores for the Afrikaans group.
STM ATT WM FigFR VerbFr Raven
STM – .36⁎⁎ .31⁎⁎ .37⁎⁎ .34⁎⁎ .31⁎⁎
ATT .08 – .20 .26⁎ .38⁎⁎ .22⁎
WM .26⁎ .26⁎ – .21 .25⁎ .31⁎⁎
FigFR -.04 .28⁎ .13 – .26⁎ .31⁎⁎
VerbFR .09 .35⁎⁎ .14 .34⁎⁎ – .43⁎⁎
Raven .07 .36⁎⁎ .25⁎ .31⁎⁎ .32⁎⁎ –
Note. Values for the Afrikaans-culture test version are below the diagonal;values for the Tswana-culture test version are above the diagonal. Raven'sStandard Progressive Matrices do not have an Afrikaans-culture and Tswana-culture test version. STM=Short-term memory, ATT=Attention,WM=Working memory, FigFR=Figural fluid reasoning, VerbFR=Verbalfluid reasoning, Raven=Raven's Standard Progressive Matrices. ⁎ pb .05.⁎⁎pb .01.
Table 8Bivariate correlations of raw cognitive scores for the urban Tswana group.
STM ATT WM FigFR VerbFr Raven
STM – .65⁎⁎ .49⁎⁎ .64⁎⁎ .07 .10ATT .42⁎⁎ – .62⁎⁎ .52⁎⁎ -.11 -.03WM .50⁎⁎ .49⁎⁎ – 67⁎⁎ -.03 .02FigFR .52⁎⁎ .57⁎⁎ .57⁎⁎ – -.01 .11VerbFR .30⁎⁎ .27⁎ .21⁎ .23⁎ – .26⁎
Raven .25⁎ .23⁎ .19 .46⁎⁎ .34⁎⁎ –
Note. Values for the Afrikaans-culture test version are below the diagonal;values for the Tswana-culture test version are above the diagonal. Raven'sStandard Progressive Matrices do not have an Afrikaans-culture and Tswana-culture test version. STM=Short-term memory, ATT=Attention,WM=Working memory, FigFR=Figural fluid reasoning, VerbFR=Verbalfluid reasoning, Raven=Raven's Standard Progressive Matrices. ⁎ pb .05.⁎⁎ pb .01.
7M. Malda et al. / Intelligence xxx (2010) xxx–xxx
were Psychology students, one had obtained her degree inSocial Work, and four had completed high school. Consent forparticipation of the children in the studywas obtained throughthe school principals. Individual testing took place in roomsthat were made available by the schools and took about onehour for each child. One test examiner tested four children onaverage in a school day. Two tests (Raven's Standard Progres-sive Matrices and verbal fluid reasoning) were administeredcollectively in the classroom in about one hour; administrationtook place after all children had undergone individual testing.
6. Results
Results are described in three sections. We first presentpreliminary analyses on item bias, score standardization,
Table 9Bivariate correlations of raw cognitive scores for the rural Tswana group.
STM ATT WM
STM – .18 .30⁎⁎
ATT .36⁎⁎ – .40⁎⁎
WM .25⁎ .27⁎ –
FigFR .01 .15 .08VerbFR .14 .26⁎ .34⁎⁎
Raven .05 .03 .04
Note. Values for the Afrikaans-culture test version are below the diagonal; values fProgressive Matrices do not have an Afrikaans-culture and Tswana-culture test verFigFR=Figural fluid reasoning, VerbFR=Verbal fluid reasoning, Raven=Raven's S
Please cite this article as: Malda, M., et al., Rugby versus Soccecultural differences in cognitive test scores, Intelligence (2010), d
reliability, background variables, and perceived familiarity asmanipulation check of content familiarity. This is followed bya validation of the cognitive structure that is suggested tounderlie the test battery. Finally, a multivariate analysis ofvariance (MANOVA) is presented that tests the effects ofgroup and test version on the cognitive test scores.
6.1. Preliminary analyses
6.1.1. Item biasItem bias (differential item functioning) was computed in
a logistic regression procedure in which item scores werepredicted on the basis of score level, SES, group membership(dummy coded), and the interaction between score level andgroup membership. The analyses showed that 56 out of 212items were significantly biased; however, the effect sizeswere small; more specifically, the average effect size f2 was.08 (range: .03–.30). The bias seemed to slightly favor theAfrikaans group; however, given the small effect sizes, we didnot exclude any items from further analyses.
6.1.2. Score standardizationFor each of the five cognitive tests, sum scores were
computed for each of the two versions (combining Afrikaans,urban Tswana, and rural Tswana children). Analyses of theseraw sum scores showed that the multivariate main effect ofversion was significant (Wilks' λ=.92, F(5,495)=9.15,pb .01; see Table 4 for means, standard deviations, andMANOVA results); significantly higher scores were obtainedfor the Tswana-culture version of the attention test (pb .01,partial η2=.03, Cohen's d=.34) and the working memorytest (pb .01, partial η2=.03, d=.35) than for the Afrikaans-culture version. To correct for these differences in difficultylevels, scores were standardized for each test version for alltests, thereby enabling a direct comparison of scores acrossversions. (Tables 5 and 6 show means and standarddeviations for the unstandardized and standardized scores,respectively. Tables 7–9 display the correlations between theunstandardized test scores; correlations of these test scoreswith raw scores on Raven's Standard Progressive Matrices arealso included.)
6.1.3. Reliability of cognitive testsTable 10 gives an overview of the internal consistencies for
all tests for each group and test version. Most values wereacceptable to high. The highest values were found for theattention test,most probably due to the high score variation for
FigFR VerbFr Raven
.10 .14 .18
.33⁎⁎ .16 .20
.28⁎ .15 .16– .07 .41⁎⁎
.26⁎ – .17
.33⁎⁎ .34⁎⁎ –
or the Tswana-culture test version are above the diagonal. Raven's Standardsion. STM=Short-term memory, ATT=Attention, WM=Working memory,tandard Progressive Matrices. ⁎ pb .05. ⁎⁎ pb .01.
r in South Africa: Content familiarity contributes to cross-oi:10.1016/j.intell.2010.07.004

Table 10Internal consistencies of all cognitive tests for each group.
Group
Test andversion
Overallgroup
Afrikaans UrbanTswana
RuralTswana
Δc
Short-term memorya
Afrikaans-culture .75 .60 .79 .78 .30**Tswana-culture .74 .62 .81 .67 .32**
Attentiona
Afrikaans-culture .94 .95 .94 .93 .16Tswana-culture .93 .95 .93 .91 .27**
Working memorya
Afrikaans-culture .78 .79 .78 .57 .33**Tswana-culture .75 .75 .77 .71 .11
Figural fluid reasoningb
Afrikaans-culture .89 .58 .89 .69 .61**Tswana-culture .77 .60 .81 .80 .34**
Verbal fluid reasoningb
Afrikaans-culture .61 .38 .46 .58 .18*Tswana-culture .70 .63 .71 .66 .11
aValues are split-half reliabilities corrected for test length with theSpearman-Brown formula. bValues are Cronbach's alpha values. cΔ givesthe average effect size of the three comparisons of the differences in alphavalues between the three groups (interpretable as Cohen's d); the asterisksrefer to the significance of Hakstian and Whalen's (1976) M statistic thattests differences of the alpha values in the three groups. ⁎ pb .05. ⁎⁎ pb .01.
Table 12Means, standard deviations, and MANOVA for grade.
Test Grade 3 Grade 4 F(1, 499)
p partial η2 d
M SD M SD
Short-termmemory
-.18 1.01 .18 .96 16.29 .00 .03 .36
Attention -.14 .99 .14 .99 10.50 .00 .02 .29Workingmemory
-.19 .96 .20 1.00 19.92 .00 .04 .40
Figural fluidreasoning
-.17 1.01 .17 .96 14.44 .00 .03 .34
Verbal fluidreasoning
-.13 .97 .13 1.01 9.05 .00 .02 .27
8 M. Malda et al. / Intelligence xxx (2010) xxx–xxx
this test; the lowest valueswere found for theAfrikaans-culturetest versionof theverbalfluid reasoning test, showing less scorevariation. Significances between the reliabilities of the tests forthe three cultural groups (Hakstian &Whalen, 1976) and theireffect sizes (Liu & Weng, 2009) were computed. Seven out often comparisons showed a significant difference. The averageabsolute difference between any two coefficients was .10(range: .01, .31); the average effect size (interpretable asCohen's d) was .27 (range: .03 to .92), which points to a smalleffect size. It was concluded that although most tests yieldedsignificant differences, the differences were not consequential.
6.1.4. Sex, grade, and socioeconomic statusIn aMANOVAwith sex as independent variable and the sum
score of each test (standardized for test version) as dependentvariables,we founda significantmain effect of sexon short-termmemory and verbal fluid reasoning (see Table 11). Girls scoredhigher on these tests than boys. A MANOVA with grade asindependent variable showed significantmain effects for all testscores (see Table 12). The socioeconomic level of the Afrikaanschildren was significantly higher than that of both Setswana-
Table 11Means, standard deviations, and MANOVA for sex.
Test Female Male F(1, 499)
p partial η2 d
M SD M SD
Short-termmemory
.10 1.00 -.09 .99 4.56 .03 .01 .19
Attention .05 1.05 -.05 .94 1.39 .24 .00 .00Workingmemory
.07 1.07 -.07 .93 2.45 .12 .00 .00
Figural fluidreasoning
-.00 1.08 .00 .92 .00 .98 .00 .00
Verbal fluidreasoning
1.06 .98 -.10 1.00 5.49 .02 .01 .21
Table 13Bivariate correlations of standardized cognitive scores, socioeconomic status,and perceived familiarity.
Test Socioeconomic status Perceived familiarity
Short-term memory .01 .17**Attention .16** .24**Working memory .24** .28**Figural fluid reasoning .32** .40**Verbal fluid reasoning .35** .29**
⁎⁎ pb .01.
Please cite this article as: Malda, M., et al., Rugby versuscultural differences in cognitive test scores, Intelligence (20
Socce10), d
speaking groups, F(2, 498)=244.04, pb .01, partial η2=.50(posthocanalyseswithBonferroni criterion). Cohen'sdwas2.14for the comparison between the Afrikaans and urban Tswanagroup and 2.06 for the Afrikaans and rural Tswana group. SEScorrelated significantly with the sum score of each test(standardized for test version), except for short-term memory(see Table 13).
6.1.5. Manipulation checksPerceived familiaritywas assessed as amanipulation check
of the content familiarity of both test versions. The goal was toestablish whether the perceived familiarity was higher for theversion of the own group than for the other version and toestablish whether the perceived familiarity of a group's owntest version was higher than the other groups' perceivedfamiliarity of this same version. For each group, an ANOVAwas performed with test version (two levels: Afrikaans-culture and Tswana-culture) as independent variable and thescore on the familiarity questions (factor score) as dependentvariable. For the Afrikaans group, the perceived familiarity ofthe Afrikaans-culture version was significantly higher thanthat of the Tswana-culture version, F(1, 159)=35.89, pb .01,partial η2=.18, d=.95. For the urban Tswana group, therewere no significant differences in perceived familiaritybetween the test versions, F(1, 179)=1.05, p=.31, partialη2=.01. The rural Tswana group perceived the Tswana testversion as more familiar than the Afrikaans-culture version,F(1, 157)=9.71, pb .01, partial η2=.06, d=.49.
Subsequently, for each test version, an ANOVA wasperformed with group (three levels: Afrikaans, urban Tswana,and rural Tswana) as independent variable and the score on thefamiliarity questions (factor score) as dependent variable.Familiarity scores of the Afrikaans group were significantlyhigher than those of both Setswana-speaking groups on theAfrikaans-culture test version, F(2, 250)=97.03, pb .01, partial
r in South Africa: Content familiarity contributes to cross-oi:10.1016/j.intell.2010.07.004
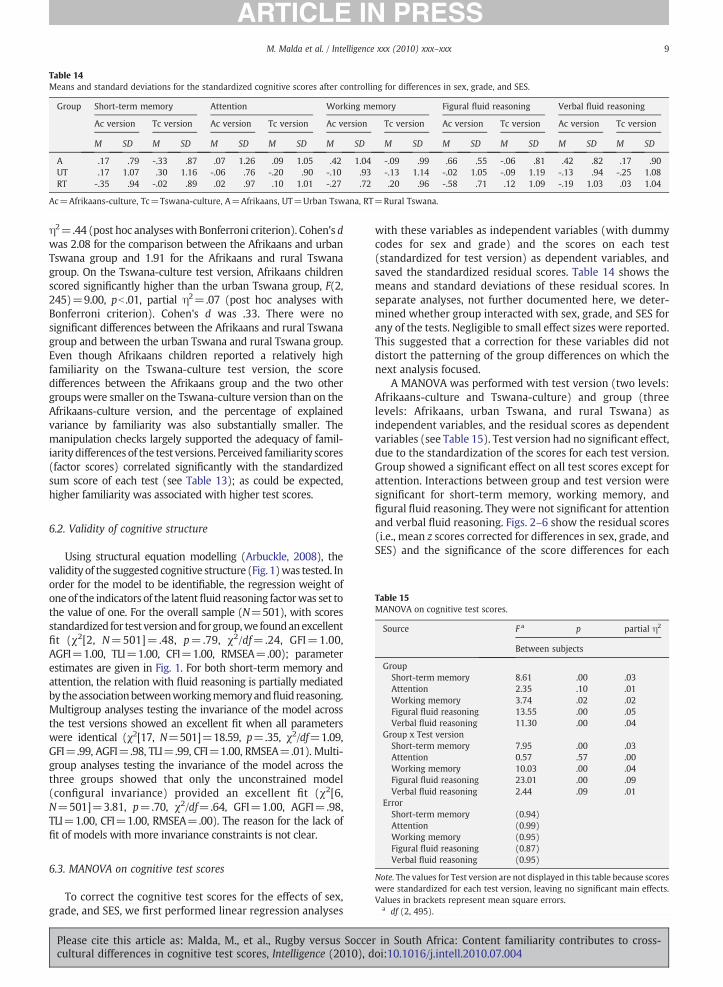
Table 14Means and standard deviations for the standardized cognitive scores after controlling for differences in sex, grade, and SES.
Group Short-term memory Attention Working memory Figural fluid reasoning Verbal fluid reasoning
Ac version Tc version Ac version Tc version Ac version Tc version Ac version Tc version Ac version Tc version
M SD M SD M SD M SD M SD M SD M SD M SD M SD M SD
A .17 .79 -.33 .87 .07 1.26 .09 1.05 .42 1.04 -.09 .99 .66 .55 -.06 .81 .42 .82 .17 .90UT .17 1.07 .30 1.16 -.06 .76 -.20 .90 -.10 .93 -.13 1.14 -.02 1.05 -.09 1.19 -.13 .94 -.25 1.08RT -.35 .94 -.02 .89 .02 .97 .10 1.01 -.27 .72 .20 .96 -.58 .71 .12 1.09 -.19 1.03 .03 1.04
Ac=Afrikaans-culture, Tc=Tswana-culture, A=Afrikaans, UT=Urban Tswana, RT=Rural Tswana.
Table 15MANOVA on cognitive test scores.
Source F a p partial η2
Between subjects
GroupShort-term memory 8.61 .00 .03Attention 2.35 .10 .01Working memory 3.74 .02 .02Figural fluid reasoning 13.55 .00 .05Verbal fluid reasoning 11.30 .00 .04
Group x Test versionShort-term memory 7.95 .00 .03Attention 0.57 .57 .00Working memory 10.03 .00 .04Figural fluid reasoning 23.01 .00 .09Verbal fluid reasoning 2.44 .09 .01
ErrorShort-term memory (0.94)Attention (0.99)Working memory (0.95)Figural fluid reasoning (0.87)Verbal fluid reasoning (0.95)
Note. The values for Test version are not displayed in this table because scoreswere standardized for each test version, leaving no significant main effects.Values in brackets represent mean square errors.
a df (2, 495).
9M. Malda et al. / Intelligence xxx (2010) xxx–xxx
η2=.44 (post hoc analyseswith Bonferroni criterion). Cohen's dwas 2.08 for the comparison between the Afrikaans and urbanTswana group and 1.91 for the Afrikaans and rural Tswanagroup. On the Tswana-culture test version, Afrikaans childrenscored significantly higher than the urban Tswana group, F(2,245)=9.00, pb .01, partial η2=.07 (post hoc analyses withBonferroni criterion). Cohen's d was .33. There were nosignificant differences between the Afrikaans and rural Tswanagroup and between the urban Tswana and rural Tswana group.Even though Afrikaans children reported a relatively highfamiliarity on the Tswana-culture test version, the scoredifferences between the Afrikaans group and the two othergroups were smaller on the Tswana-culture version than on theAfrikaans-culture version, and the percentage of explainedvariance by familiarity was also substantially smaller. Themanipulation checks largely supported the adequacy of famil-iarity differences of the test versions. Perceived familiarity scores(factor scores) correlated significantly with the standardizedsum score of each test (see Table 13); as could be expected,higher familiarity was associated with higher test scores.
6.2. Validity of cognitive structure
Using structural equation modelling (Arbuckle, 2008), thevalidity of the suggested cognitive structure (Fig. 1)was tested. Inorder for the model to be identifiable, the regression weight ofoneof the indicators of the latentfluid reasoning factorwas set tothe value of one. For the overall sample (N=501), with scoresstandardized for test versionand forgroup,we foundanexcellentfit (χ2[2, N=501]=.48, p=.79, χ2/df=.24, GFI=1.00,AGFI=1.00, TLI=1.00, CFI=1.00, RMSEA=.00); parameterestimates are given in Fig. 1. For both short-term memory andattention, the relation with fluid reasoning is partially mediatedby theassociationbetweenworkingmemoryandfluid reasoning.Multigroup analyses testing the invariance of the model acrossthe test versions showed an excellent fit when all parameterswere identical (χ2[17, N=501]=18.59, p=.35, χ2/df=1.09,GFI=.99, AGFI=.98, TLI=.99, CFI=1.00, RMSEA=.01). Multi-group analyses testing the invariance of the model across thethree groups showed that only the unconstrained model(configural invariance) provided an excellent fit (χ2[6,N=501]=3.81, p=.70, χ2/df=.64, GFI=1.00, AGFI=.98,TLI=1.00, CFI=1.00, RMSEA=.00). The reason for the lack offit of models with more invariance constraints is not clear.
6.3. MANOVA on cognitive test scores
To correct the cognitive test scores for the effects of sex,grade, and SES, we first performed linear regression analyses
Please cite this article as: Malda, M., et al., Rugby versus Soccecultural differences in cognitive test scores, Intelligence (2010), d
with these variables as independent variables (with dummycodes for sex and grade) and the scores on each test(standardized for test version) as dependent variables, andsaved the standardized residual scores. Table 14 shows themeans and standard deviations of these residual scores. Inseparate analyses, not further documented here, we deter-mined whether group interacted with sex, grade, and SES forany of the tests. Negligible to small effect sizes were reported.This suggested that a correction for these variables did notdistort the patterning of the group differences on which thenext analysis focused.
A MANOVA was performed with test version (two levels:Afrikaans-culture and Tswana-culture) and group (threelevels: Afrikaans, urban Tswana, and rural Tswana) asindependent variables, and the residual scores as dependentvariables (see Table 15). Test version had no significant effect,due to the standardization of the scores for each test version.Group showed a significant effect on all test scores except forattention. Interactions between group and test version weresignificant for short-term memory, working memory, andfigural fluid reasoning. They were not significant for attentionand verbal fluid reasoning. Figs. 2–6 show the residual scores(i.e., mean z scores corrected for differences in sex, grade, andSES) and the significance of the score differences for each
r in South Africa: Content familiarity contributes to cross-oi:10.1016/j.intell.2010.07.004

00.10.20.30.40.50.60.7
Afrikaans-culture Tswana-culture
Test version
z sc
ore
AfrikaansTswana urbanTswana rural
-0.7-0.6-0.5-0.4-0.3-0.2-0.1
Fig. 2. Mean z scores for groups and test versions for short-term memory. Note. Arrows indicate significant differences (post hoc analyses with Bonferronicriterion). Significant differences between test versions: F(1, 159)=14.50, pb .01 (Afrikaans group) and F(1, 157)=5.09, pb .05 (rural Tswana group). Significantdifferences between groups: F(2, 250)=8.29, pb .01 (Afrikaans-culture version) and F(2, 245)=8.42, pb .01 (Tswana-culture version).
AfrikaansTswana urbanTswana rural
0.50.60.7
10 M. Malda et al. / Intelligence xxx (2010) xxx–xxx
cognitive test in univariate tests. Table 16 provides anoverview of the (dis)confirmation of hypothesis 1 to 3.
According to the first part of hypothesis 1, the Afrikaanschildren were supposed to score at least as high as the ruralTswana children on the Afrikaans-culture test version, withincreasing score differences when going from left to right inFig. 1. Figs. 2–6 show that the Afrikaans children scoredsignificantly higher than the rural Tswana children on theAfrikaans-culture test version for each of the five tests, exceptfor the attention test for which no significant differences werefound. This means that hypothesis 1 was confirmed for alltests of the Afrikaans-culture test version, except for short-term memory. We observed significant differences for thistest, which went in the expected direction (i.e., superiorperformance by Afrikaans children), whereas we expectedrelatively small or nonsignificant differences.
The secondpart of hypothesis 1 stated that the rural Tswanachildrenwere expected to score at least as high as theAfrikaanschildren on the Tswana-culture test version, with increasingscoredifferenceswhengoing from left to right in Fig. 1. Figs. 2–6show, however, that this group did not score significantlyhigher than the Afrikaans children on any of the tests of theTswana-culture test version. This implies a disconfirmation ofthe second part of hypothesis 1 for two tests (workingmemoryand fluid reasoning) for whichwe expected large differences. Itseems that hypothesis 1 (CCH) was not completely supported.
00.10.20.30.40.50.60.7
AfrikaansTswana urbanTswana rural
z sc
ore
Afrikaans-culture Tswana-cultureTest version-0.7
-0.6-0.5-0.4-0.3-0.2-0.1
Fig. 3. Mean z scores for groups and test versions for attention.
-0.4
-0.2-0.1
00.1
z sc
ore
Afrikaans-cultureTest version
0.20.30.4
Tswana-culture-0.7-0.6-0.5
-0.3
Fig. 4.Mean z scores for groups and test versions for working memory. Note.Arrows indicate significant differences (post hoc analyses with Bonferronicriterion). Significant differences between test versions: F(1, 159)=10.11,pb .01 (Afrikaans group) and F(1, 157)=12.14, pb .01 (rural Tswana group).Significant differences between groups: F(2, 250)=12.72, pb .01 (Afrikaans-culture version).
Please cite this article as: Malda, M., et al., Rugby versuscultural differences in cognitive test scores, Intelligence (20
Socce10), d
Hypothesis 2 (SH) stated that one of the groups would scoreat least as high as the other groups on both test versions, withincreasing score differences when going from left to right inFig. 1. Fig. 2–6 show that, although the Afrikaans group scoredat least as high as the rural Tswana group on the Afrikaans-culture version, this was not the case for the Tswana-culturetest version. It seems that hypothesis 2 (SH) was notcompletely confirmed either.
Because neither CCH nor SH was fully supported, wedecided to perform further analyses. In addition to our earlierexamination of the patterning of group score differences foreach of the two test versions, we addressed the patterning ofscores on the test versions, as found within each of the threegroups. CCH states that test content affects performance oncognitively (and with that, culturally) more complex tasks,with more familiar content leading to a higher performancethan less familiar content. Therefore, the Afrikaans and ruralTswana groups are expected to do better on the versiondeveloped for their own group than on the version that wasnot specifically developed for their own group. This meansthat Afrikaans children would score at least as high on theAfrikaans-culture test version as on the Tswana-culture
r in South Africa: Content familiarity contributes to cross-oi:10.1016/j.intell.2010.07.004

-0.7
-0.5-0.4-0.3-0.2
0.20.30.40.5
AfrikaansTswana urbanTswana rural
z sc
ore
Afrikaans-culture Tswana-cultureTest version
-0.6
-0.10
0.1
0.60.7
Fig. 5. Mean z scores for groups and test versions for figural fluid reasoning.Note. Arrows indicate significant differences (post hoc analyses withBonferroni criterion). Significant differences between test versions: F(1,159)=43.08, pb .01 (Afrikaans group) and F(1, 157)=23.52, pb .01 (ruralTswana group). Significant differences between groups: F(2, 250)=47.60,pb .01 (Afrikaans-culture version).
-0.7
-0.4-0.3-0.2
0.50.6 Afrikaans
Tswana urbanTswana rural
-0.5
-0.10
0.10.20.30.4
0.7
-0.6
AfrikaansTswana urbanTswana rural
Afrikaans-culture Tswana-cultureTest version
z sc
ore
Fig. 6. Mean z scores for groups and test versions for verbal fluid reasoning.Note.Arrows indicate significant differences (post hoc analyseswith Bonferronicriterion). Significant differences between groups: F(2, 250)=10.43, pb .01(Afrikaans-culture version) and F(2, 245)=3.85, pb .05 (Tswana-cultureversion).
11M. Malda et al. / Intelligence xxx (2010) xxx–xxx
version; rural Tswana children would score at least as high onthe Tswana-culture version as on the Afrikaans-cultureversion. Differences between test versions are supposed tobe smallest for short-term memory and attention, larger forworking memory, and largest for fluid reasoning.
Fig. 2–6 show that Afrikaans children performed signifi-cantly better on their own test version than on the Tswana testversion for short-term memory, working memory, and figuralfluid reasoning, and performed equally on both versions forattention and verbal fluid reasoning. These findings weremostly in line with CCH; the expected score pattern (forcomparison 1 in Table 16)was confirmed for all tests except forshort-term memory (we expected very small differences) andfor verbal fluid reasoning (we expected large differences).Althoughweexpectedvery small score differencesbetween theshort-term memory versions, we want to stress that thedirection of the differences was in line with CCH; Afrikaanschildren obtained higher scores on the Afrikaans-cultureversion than on the Tswana-culture version.
The rural Tswana children scored significantly higher onthe Tswana-culture test version than on the Afrikaans-cultureversion for short-termmemory, workingmemory, and figuralfluid reasoning. For attention and verbal fluid reasoning,scores did not significantly differ for the Afrikaans-culture andTswana-culture version. These findings were mostly in linewith CCH and confirmed our expectations for all tests (see theexpected score pattern for comparison 2 in Table 16) exceptfor short-term memory (we expected very small differences)and for verbalfluid reasoning (we expected large differences).Although we expected much smaller score differencesbetween the short-term memory versions, we want to stressthat the direction of the differences was in line with CCH;Tswana children obtained higher scores on the Tswana-culture version than on the Afrikaans-culture version.
The score patterns of the urban Tswana children mostlyconfirmedour expectations. They scored in betweenAfrikaansand rural Tswana children on the Afrikaans-culture testversion of all tests (i.e., they did not score significantly higherthan the Afrikaans children and lower than the rural Tswanachildren). Urban Tswana children did not score in between
Please cite this article as: Malda, M., et al., Rugby versus Soccecultural differences in cognitive test scores, Intelligence (2010), d
Afrikaans and rural Tswana children on the Tswana-culturetest version of short-termmemory and verbal fluid reasoning,however, for the other tests of the Tswana-culture version,there were no significant differences between the groups.Hypothesis 3 was confirmed for all tests except for short-termmemory and verbal fluid reasoning of the Tswana-culture testversion.
The urban Tswana children performed equally well on theAfrikaans-culture and Tswana-culture test version for all tests(confirming the expected score pattern for comparison 3 inTable 16), as could be expected based on their exposure toaspects of both Afrikaans and Tswana culture.
Tables 17 and 18 give an overview of Cohen's d values ofthe score differences between groups and the score differ-ences between test versions, respectively. Score differenceswere expected to increase with cognitive complexity. Whencomparing the d values it becomes clear that hardly any scoredifferences were found for attention and larger differenceswere found for working memory and figural fluid reasoning.Contrary to our expectations, quite large differences werefound for short-termmemory and small differences for verbalfluid reasoning.
CCH predicts that the cross-cultural score differences areexplained by the cultural complexity of the tests (conceptual-ized in the present study as the extent to which test content ismore familiar to one of the compared groups). In analysis ofvariance terms, CCH predicts that only disordinal interactionsare found between test version and group for the tests withhigh cognitive complexity: it depends on the test versionwhichgroup scores highest. SH predicts that cross-cultural scoredifferences can be explained by differences in general cognitiveability. This implies that, according to SH, only main effects forgroup and, possibly, ordinal interactions between test versionand group are expected for the high cognitively complex tests:one group scores consistently higher than the other(s). In linewith expectations, the largest score differences were found forthe (theoretically) more cognitively complex tasks. Mostsignificant interactions on these tests were found for theAfrikaans and rural Tswana group and were disordinal, in linewith CCH and not with SH. Differences between the Afrikaansand rural Tswana group were largest for the Afrikaans-culture
r in South Africa: Content familiarity contributes to cross-oi:10.1016/j.intell.2010.07.004

Table 16Level of confirmation of expected score patterns across test versions and groups.
Hypothesis Test version Expected score pattern Cognitive test
Group Short-termmemory
Attention Workingmemory
Figural fluidreasoning
Verbal fluidreasoning
1 Afrikaans-culture Afrikaans≥Rural Tswana noa yes yes yes yesTswana-culture Rural Tswana≥Afrikaans yes yes nob nob no
2 Afrikaans-culture One group≥other groups noa yes yes yes yesTswana-culture One group≥other groups no yes no no yesc
3 Afrikaans-culture Urban Tswana in between other groups yes yes yes yes yesTswana-culture Urban Tswana in between other groups no yes yes yes no
Comparison Group Test version
1 Afrikaans Afrikaans-culture≥Tswana-culture noa yes yes yes nob
2 Rural Tswana-culture≥Afrikaans-culture noa yes yes yes nob
3 Urban Difference between versions smallerthan for other groups
yes yes yes yes yes
Note. Hypothesis 1, 2, and 3, and comparison 1, 2, and 3 are correct for short-term memory and attention when score differences are smallest, for working memorywhen they are large(r) and for fluid reasoning when they are largest. aScore differences are in the expected direction but were not expected to be significant forshort-term memory. bScore differences were not significant. cOnly for the Afrikaans and urban Tswana group.
12 M. Malda et al. / Intelligence xxx (2010) xxx–xxx
version of figural fluid reasoning (F[1, 160]=155.26, pb .01,partial η2=.49, Cohen's d=1.96). Figural fluid reasoningshowed the largest differences between test versions in boththe Afrikaans group (F[1, 159]=43.08, pb .01, partial η2=.21,d=1.04) and the rural Tswana group (F[1, 157]=23.52, pb .01,partial η2=.13, d=-.76). It appears, in summary, that theconfirmation of CCH and disconfirmation of SH is strongest forthe cognitively most complex tests, because the familiarityeffects are largest for these tests.
7. Discussion
Where do cross-cultural differences in cognitive test scorescome from? Spearman's Hypothesis (SH) holds that thedifferences are mainly caused by cross-cultural differences incognitive abilities; however, we expect them to be dependenton the cultural rather than cognitive complexity of a test(Cultural ComplexityHypothesis, CCH). In the current study thecontent familiarity of five cognitive tests was manipulated toexamine its effect on test performance. Two test versions werecreated, an Afrikaans-culture and a Tswana-culture version.The tests were administered to groups of (urban) Afrikaanschildren, (urban) Tswana children from the same area as theAfrikaans children, and (rural) Tswana children from an areathat is relatively isolated from Afrikaans culture. We found anexcellent fit of our hypothesized cognitive structure when
Table 17Cohen's d for cognitive score differences between cultural groups.
Test Afrikaans-culturetest version
Tswana-culturetest version
A - RT A - UT UT - RT A - RT A - UT UT - RT
Short-termmemory
.59 -.00 .51 -.35 -.61 .30
Attention .05 .13 -.09 -.01 .30 -.31Working memory .77 .53 .20 -.29 .04 -.32Figural fluidreasoning
1.96 .81 .62 -.18 .03 -.18
Verbal fluidreasoning
.65 .62 .06 .14 .42 -.26
A=Afrikaans, RT=Rural Tswana, UT=Urban Tswana.
Table 18Cohen's d for cognitive score differences between test versions.
Test Afrikaansgroup
Urban Tswanagroup
Rural Tswanagroup
Short-term memory .60 -.11 -.36Attention -.02 .17 -.09Working memory .50 .03 -.55Figural fluid reasoning 1.04 .06 -.76Verbal fluid reasoning .28 .11 -.22
Please cite this article as: Malda, M., et al., Rugby versuscultural differences in cognitive test scores, Intelligence (20
Socce10), d
analyzing the sample as a whole. The relation of both short-term memory and attention with fluid reasoning was partiallymediated by working memory. Only configural invariancecould be established in a comparison of the factor structure forthe three groups (Afrikaans, urban Tswana, and rural Tswana).Afrikaans children generally scored higher on the Afrikaans-culture version than the Tswana children. Tswana childrenhowever, did not significantly score higher than the Afrikaanschildrenon the Tswana-culture test version.Nevertheless,mostperformance differences between the groups were smaller onthis version than on the Afrikaans-culture version. Afrikaansand rural Tswana children generally performed better on thetest version that was designed for their own group than on theother test version. The urban Tswana group did not scoredifferently on the Afrikaans-culture and Tswana-culture testversion, showing that these children have enough knowledgeof both cultures to perform equally on both versions. We canconclude that our results support the idea that (after correctingfor confounding differences in SES) the content familiarity oftests was an important moderator of cross-cultural differencesin test scores in that children generally performed better on thetest version that was designed for their own group than onanother test version.
The short-termmemory test appeared to bemore sensitivefor group differences than expected on the basis of the test'slow cognitive complexity. Urban Tswana children scoredhighest on both versions of this test.We could not capture anyeducational characteristics to explain these findings (such asspecific training of memory abilities or a stronger reliance onrote learning in the urban Tswana group as compared to the
r in South Africa: Content familiarity contributes to cross-oi:10.1016/j.intell.2010.07.004

13M. Malda et al. / Intelligence xxx (2010) xxx–xxx
other groups). Overall, the largest score differences werefound between the Afrikaans and the rural Tswana groups forthe working memory and figural fluid reasoning tests. Thesetests are seen as cognitively more complex than the attentionand short-term memory tests. SH would predict that on twotest versions with a comparable level of cognitive complexity,regardless of content, score differences between groups are inthe same direction (i.e., interactions between test version andgroup are ordinal). However, on closer examination, therewere significant score differences on the Afrikaans-cultureversion and no significant differences on the Tswana-cultureversion (interactions were disordinal). One could argue thatthe difficulty level of the Tswana version was lower than thatof the Afrikaans-culture version; however, this was only thecase for the working memory test. More importantly,regardless of the level of difficulty, the Afrikaans childrenperformed significantly lower on the Tswana-culture versionthan on the Afrikaans-culture version. Therefore, we concludethat our findings are not in line with SH, and that (aftercorrecting for confounding differences in SES) it is culturalrather than cognitive complexity that explains more differ-ences between groups, providing support for CCH.
Our studyfits in a series of studies that have given argumentsto question the validity of SH. The first type of argument focuseson the statistical analyses applied to test SH that are said to betoo lenient (see Dolan et al., 2004). The second type of argumentconcerns the confounding of cognitive complexity with culturalcomplexity in current tests of SH. A high loading on a generalcognitive ability factor does not merely imply a high cognitivecomplexity, but usually goes together with a high culturalcomplexity. Confirmations of SH that have been reported in theliterature (e.g., Hartmann et al., 2007; Lynn & Owen, 1994; TeNijenhuis & Van der Flier, 1997) may be based on thisconfounding in the data. We confirmed findings by Helms-Lorenz et al. (2003) which indicated that SH can only be testedwhen cultural complexity and cognitive complexity are bothvaried independently. Data from the present study and fromHelms-Lorenz et al. show that when these types of complexityare unconfounded, SH is not supported.
In addition to experimentally manipulating the contentfamiliarity of the tests by creating two versions, familiarityquestions were used to check the perceived familiarity of bothversions. The content familiarityquestions served their purposeof a manipulation check relatively well; yet their validity couldbe challenged. First, social desirability could have played a rolein that children indicated to know certain words or drawingsbecause they believed they were expected to know these.Second, children may not have good insight in their familiaritywith stimuli as compared to tasks. Some children found itdifficult to independently evaluate the complexity of stimuli(words and drawings) and of the task (what had to be donewith the stimuli). Content familiarity appeared very difficult tomeasure. Rather thanmerely relying on self-report, it would bean idea to include a more objective measure of contentfamiliarity. A test exposing children to various types of testcontent andmeasuring their reaction time inmanipulating thiscontent might circumvent the validity issues.
This study has three limitations. First, the between-subjects design limits the direct comparability of the twotest versions. Second, the results show that the Afrikaans-culture and Tswana-culture versions of the verbal fluid
Please cite this article as: Malda, M., et al., Rugby versus Soccecultural differences in cognitive test scores, Intelligence (2010), d
reasoning test were not culturally loaded to the extent thatthey could show differences between the groups. It wasdifficult to construct items that tap cultural complexity to thesame degree and show substantial variation in difficulty; thislack of coherence could have resulted in the low internalconsistencies. Third, for each of the four cognitive abilitiesreflected in our test battery, only one test was used (exceptfor fluid reasoning, for which two tests were used). To findmore unequivocal support for the cognitive structure under-lying the tests (as displayed in Fig. 1), probably more testswould need to be included. A more extensive battery of testswould enable stronger conclusions on the validity of SH.
Our study has some practical implications that should betaken into account in cross-cultural assessment in general,but more specifically in assessment in multicultural societieswhere it is common to derive (cognitive) tests from thecultural background of a single group, usually the majoritygroup. Unfamiliar test content can have a significant negativeeffect on a child's test performance, possibly providing aninaccurate estimation (underestimation) of the child's ability.Therefore, test selection should be based on the appropriate-ness of content whenever possible. The content familiarity ofa cognitive test should be taken into account in evaluations ofa child's performance and in cross-cultural comparisons ofscores.
The present study also has a theoretical implication.Cognitive abilities are domain dependent (i.e., their expressionis dependent on aspects such as the type of cognitive task andthe familiarity of its stimuli), notably themore complex abilities;however, SH does not consider domain features as relevant inthe explanation of cross-cultural differences in cognitive testscores. Neo-Piagetian psychology (e.g., Demetriou, Shayer, &Efklides, 1992) and cognitive psychology (e.g., Keane & Eysenck,2005) include domain features in their models. Cognitivemodels that accommodate cross-cultural differences in abilitiesshould also incorporate these features (such as stimulusfamiliarity). Models of cross-cultural differences in cognitivefunctioning can only be comprehensive when they address thedomain dependence of these differences.
References
Ackerman, P. E., Beier, M. E., & Boyle, M. O. (2005). Working memory andintelligence: The same or different constructs? Psychological Bulletin,131, 30−60.
Anderson, J. R. (1982). Acquisition of cognitive skill. Psychological Review, 89,369−406.
Arbuckle, J. L. (2008). (Version 17.0.0) [Computer program]. Chicago: SPSS.Bridgeman, B., & Buttram, J. (1975). Race differences on nonverbal analogy
test performance as a function of verbal strategy training. Journal ofEducational Psychology, 67, 586−590.
Carraher, T. N., Carraher, D.W., & Schliemann, A. D. (1985). Mathematics in thestreets and in schools.British Journal ofDevelopmental Psychology,3, 21−29.
Carroll, J. B. (1993). Human cognitive abilities: A survey of factor-analyticstudies. Cambridge, United Kingdom: Cambridge University Press.
Conway, A. R. A., Cowan, N., Bunting, M. F., Therriault, D. J., & Minkoff, S. R. B.(2002). A latent variable analysis of working memory capacity, short-termmemory capacity, processing speed, and general fluid intelligence.Intelligence, 30, 163−183.
Demetriou, A., Shayer, M., & Efklides, A. (1992). Neo Piagetian theories ofcognitive development. London: Routledge.
Dolan, C. V., Roorda, W., & Wicherts, J. M. (2004). Two failures of Spearman'shypothesis: The GATB in Holland and the JAT in South Africa. Intelligence,32, 155−173.
Fagan, J. F., & Holland, C. R. (2002). Equal opportunity and racial differencesin IQ. Intelligence, 30, 361−387.
r in South Africa: Content familiarity contributes to cross-oi:10.1016/j.intell.2010.07.004

14 M. Malda et al. / Intelligence xxx (2010) xxx–xxx
Fagan, J. F., & Holland, C. R. (2007). Racial equality in intelligence: Predictionsfrom a theory of intelligence as processing. Intelligence, 35, 319−334.
Fagan, J. F., & Holland, C. R. (2009). Culture-fair prediction of academicachievement. Intelligence, 37, 62−67.
Gathercole, S. E., Pickering, S. J., Ambridge, B., & Wearing, H. (2004). Thestructure of working memory from 4 to 15 years of age. DevelopmentalPsychology, 40, 177−190.
Hakstian, A. R., & Whalen, T. E. (1976). A k-sample significance test forindependent alpha coefficients. Psychometrika, 41, 219−231.
Hartmann, P., Kruuse, N. H. S., & Nyborg, H. (2007). Testing the cross-racialgenerality of Spearman's hypothesis in two samples. Intelligence, 35, 47−57.
Helms-Lorenz,M., Van deVijver, F. J. R., & Poortinga, Y. H. (2003). Cross-culturaldifferences in cognitive performance and Spearman's hypothesis: g or c?Intelligence, 31, 9−29.
Hunt, E., & Carlson, J. (2007). Considerations relating to the study of groupdifferences in intelligence. Perspectives on Psychological Science, 2, 194−213.
Hutton, U. M. Z., & Towse, J. N. (2001). Short-term memory and workingmemory as indices of children's cognitive skills. Memory, 9, 383−394.
Jensen, A. R. (1985). The nature of the Black–White difference on variouspsychometric tests: Spearman's hypothesis. Behavioral and BrainSciences, 8, 193−263.
Jensen, A. R. (1993). Spearman's hypothesis tested with chronometricinformation-processing tasks. Intelligence, 17, 47−77.
Jensen,A.R. (1998).Theg factor: The scienceofmental ability.Westport, CT:Praeger.Keane, M., & Eysenck, M. W. (2005). Cognitive psychology: A student's
handbook. Hove, United Kingdom: Psychology Press.Liu, H. Y., & Weng, L. J. (2009). An effect size index for comparing two
independent alpha coefficients. British Journal of Mathematical andStatistical Psychology, 62, 385−400.
Lynn, R., & Owen, K. (1994). Spearman's hypothesis and test score differencesbetween Whites, Indians, and Blacks in South Africa. Journal of GeneralPsychology, 121, 27−36.
McGrew, K. S. (2005). The Cattell–Horn–Carroll theory of cognitive abilities:Past, present, and future. In D. P. Flanagan, & P. L. Harrison (Eds.),Contemporary intellectual assessment: Theories, tests, and issues(pp. 136−181). New York: The Guilford Press.
Montie, J. E., & Fagan, J. F. (1988). Racial differences in IQ: Item analysis of theStanford-Binet at 3 years. Intelligence, 12, 315−332.
Oberauer, K., Süß, H. -M., Schulze, R.,Wilhelm, O., &Wittmann,W.W. (2000).Working memory capacity — facets of a cognitive ability construct.Personality and Individual Differences, 29, 1017−1045.
Pickering, S. J., & Gathercole, S. E. (2001). Working Memory Test Battery forChildren. London: Pearson Assessment.
Raven, J., Raven, J. C., & Court, J. H. (1998). The Standard Progressive Matrices.San Antonio, TX: Psychological Corporation.
Rushton, J. P. (2002). Jensen effects and African/Coloured/Indian/Whitedifferences on Raven's standard progressive matrices in South Africa.Personality and Individual Differences, 33, 1279−1284.
Rushton, J. P., Bons, T. A., Vernon, P. A., & Cvorovic, J. (2007). Genetic andenvironmental contributions to population group differences on theRaven's progressive matrices estimated from twins reared together andapart. Proceedings of the Royal Society: B, 274, 1773−1777.
Please cite this article as: Malda, M., et al., Rugby versus Soccecultural differences in cognitive test scores, Intelligence (2010), d
Schweizer, K., & Moosbrugger, H. (2004). Attention and working memory aspredictors of intelligence. Intelligence, 32, 329−347.
Serpell, R. (1979). How specific are perceptual skills? A cross-cultural studyof pattern reproduction. British Journal of Psychology, 70, 365−380.
Snijders, J. T., Tellegen, P. J., & Laros, J. A. (1989). Snijders-Oomen Non-verbalintelligence test: SON-R 5,5-17. Manual and research report. Groningen,the Netherlands: Wolters-Noordhoff.
Sternberg, R. J., Grigorenko, E. L., Ngorosho, D., Tantufuye, E.,Mbise, A., Nokes, C.,et al. (2002). Assessing intellectual potential in rural Tanzanian schoolchildren. Intelligence, 30, 141−162.
Süß, H. -M., Oberauer, K., Wittmann,W.W.,Wilhelm, O., & Schulze, R. (2002).Working-memory capacity explains reasoning ability — and a little bitmore. Intelligence, 30, 261−288.
Swanson, H. L. (2008). Working memory and intelligence in children: Whatdevelops? Journal of Educational Psychology, 100, 581−602.
Te Nijenhuis, J., Evers, A., & Mur, J. P. (2000). Validity of the differentialaptitude test for the assessment of immigrant children. EducationalPsychology, 20, 99−115.
Te Nijenhuis, J., Tolboom, E., Resing, W., & Bleichrodt, N. (2004). Does culturalbackground influence the intellectual performance of children fromimmigrant groups? European Journal of Psychological Assessment, 20, 10−26.
Te Nijenhuis, J., & Van der Flier, H. (1997). Comparability of GATB scores forimmigrants and majority group members: Some Dutch findings. Journalof Applied Psychology, 82, 675−687.
Te Nijenhuis, J., & Van der Flier, H. (2003). Immigrant-majority groupdifferences in cognitive performance: Jensen effects, cultural effects, orboth? Intelligence, 31, 443−459.
Te Nijenhuis, J., & Van der Flier, H. (2004). The use of safety suitability testsfor the assessment of immigrant and majority group job applicants.International Journal of Selection and Assessment, 12, 230−242.
Te Nijenhuis, J., & Van der Flier, H. (2005). Immigrant-majority groupdifferences on work-related measures: The case for cognitive complex-ity. Personality and Individual Differences, 38, 1213−1221.
Unsworth, N., & Engle, R. W. (2005). Working memory capacity and fluidabilities: Examining the correlation between Operation Span and Raven.Intelligence, 33, 67−81.
Van de Vijver, F. J. R. (1997). Meta-analysis of cross-cultural comparisons ofcognitive test performance. Journal of Cross-Cultural Psychology, 28,678−709.
Vock, M., & Holling, H. (2008). The measurement of visuo-spatial and verbal-numericalworkingmemory: Development of IRT-based scales. Intelligence,36, 161−182.
Wicherts, J. M., & Dolan, C. V. (2010). Measurement invariance inconfirmatory factor analysis: An illustration using IQ test performanceof minorities. Educational Measurement: Issues & Practice, 29, 3, 39−47.
Wicherts, J. M., Dolan, C. V., Carlson, J. S., & Van der Maas, H. L. J. (2010).Raven's test performance of sub-Saharan Africans: Average performance,psychometric properties, and the Flynn Effect. Learning and IndividualDifferences, 20, 135−151.
Wicherts, J. M., & Johnson, W. (2009). Group differences in the heritability ofitems and test scores. Proceedings of the Royal Society: B, 276, 2675−2683.
r in South Africa: Content familiarity contributes to cross-oi:10.1016/j.intell.2010.07.004