Embed Size (px)
Citation preview
Abstract—The current paper describes MEMS inertial data
acquisition system which is installed on the vibration stand to analyze
the static vehicle suspension dynamics. The analysis is accomplished
in the time and frequency domain using STFT. Also the STFT
parameters are analyzed to obtain the optimal time and frequency
resolution of the spectrum response. The time attenuation and total
frequency range of the oscillations are established.
Keywords— MEMS inertial sensor, suspension dynamics.
I. INTRODUCTION
he MEMS accelerometers may perfectly address active
safety systems in the automotive domain. Control of car
roll-over, vehicle stability for skidding and antilock braking,
parking brake energy, activation of wheel pressure monitoring,
suspension adaptation to car and road condition. MEMS
sensors allow the implementation of a lot of different
functions, as free-fall detection, precise tracking [1], kinetic
measurements [2], tilt measurements [3], vehicle vibration
monitoring [4], antitheft and many others.
The main reasons of the suspension failures are recognized
as deformation multiplications of the flexible suspension
elements and liquid leaks from the dampers while the main
suspension failure symptoms are directed to the increased
noise, increased oscillation amplitudes of the vehicle body and
their slow attenuation.
Several methods exist for the damper diagnostics, as the
study of the unstrained oscillations of the vehicle body after an
artificial roughness transition and comparison of the recorded
oscillation curve with the standard one (Siems & Klein KG,
M-Tronic BIG RED), study of the maximum amplitude and
average resonance frequency of the vehicle wheels (Boge,
1Rosen Miletiev is with the Faculty of Telecommunications at
Technical University of Sofia, 8 Kl. Ohridski Blvd, Sofia 1000,
Bulgaria. E-mail: [email protected] 2Emil Iontchev is with the Higher School of Transport “T.
Kableshkov” 158 Geo Milev Street, Sofia 1574, Bulgaria, E-mail:
[email protected] 3Ivaylo Simeonov is with the Faculty of Computer Systems and
Control at Technical University of Sofia, 8 Kl. Ohridski Blvd, Sofia
1000, Bulgaria, E-mail: [email protected] 4Rumen Yordanov is with the Faculty of Electronic Engineering
and Technologies at Technical University of Sofia, 8 Kl. Ohridski
Blvd, Sofia 1000, Bulgaria, E-mail: [email protected]
Sachs) or measurement of the friction between the wheel and
the test stand (Ravaglioli Beissbarth).
The drawbacks of these methods are obliged to the
dependency of the obtain results from the status of the all
suspension parts not only from the dampers and springs. Also
the definition of the standard attenuation curves is very
difficult or sometimes impossible task.
The evaluation of the suspension status is accomplished on
the basis of the expensive diagnostic equipment for the
dampers and springs while the other suspension elements
status are frequently determined by subjective methods like
shaking, shifting, pressing, etc.
There are two popular suspension testing systems that
utilize the sine swept tire shaker. They each characterize the
damper condition in slightly different manners [5-8].
Regardless of some shortcomings (damper fluid temperature
[9] and tire pressure dependence [10]), if care is taken these
methods may be effective.
The proposed instrumentation for calculation of the
suspension dynamic response is made with MEMS technology
that is less expensive and more accurate then the technology
used in the noted suspension testers. Another feature is that the
system is portable and easy to use. Also the elaborated
MATLAB routine for data analysis allows developing a quick
and time efficient test to assess the performance of the
suspension. The application of the numerical integration
allows calculating the speed and the displacement of the
suspension elements as the low frequency components of the
inertial data are rejected from the signal. This procedure is
accomplished by a band-pass filter, which is constructed on the
basis of the signal spectrum.
II. EXPERIMENTAL STUDY
A common approach for Suspension Parameter Testing
(SPT) systems is to take the vehicle in static positions, and
apply forces in specific ways to record the deflection of the
component to be characterized, i.e. the tire, the springs, or the
various linkages. These quasi-static tests are great for
suspension diagnosis or further developing the models that
have helped advance the automotive design process.
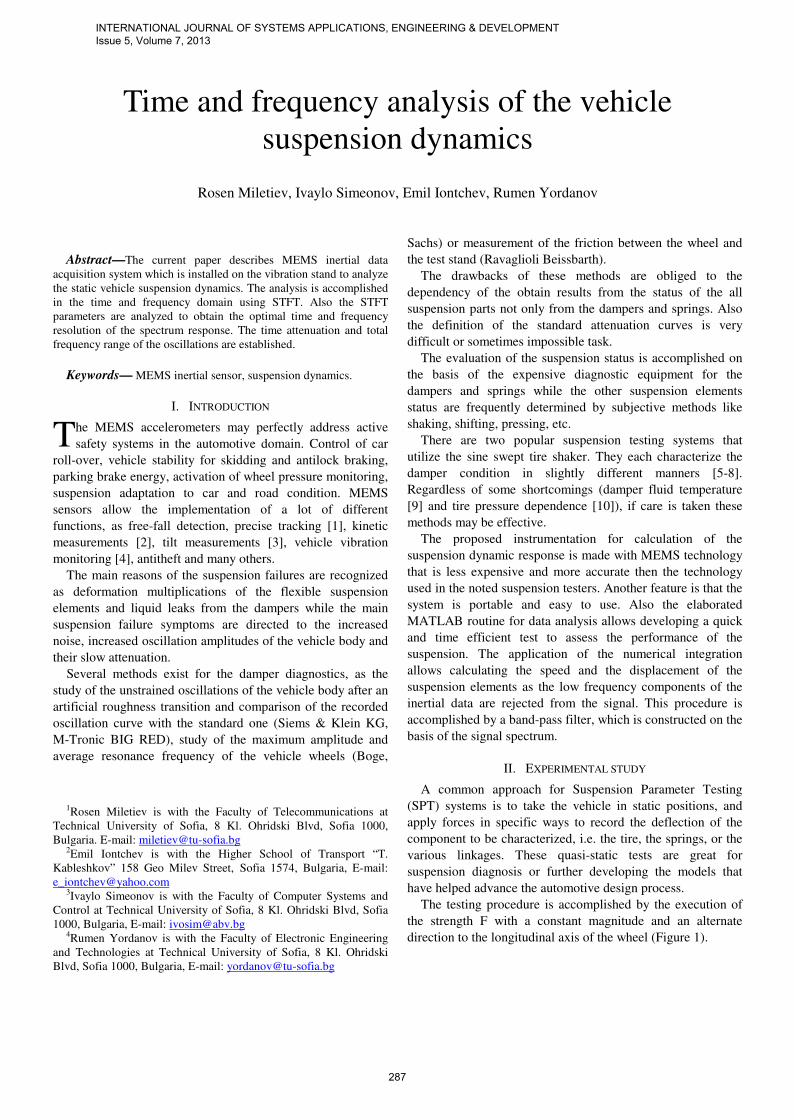
The testing procedure is accomplished by the execution of
the strength F with a constant magnitude and an alternate
direction to the longitudinal axis of the wheel (Figure 1).
Time and frequency analysis of the vehicle
suspension dynamics
Rosen Miletiev, Ivaylo Simeonov, Emil Iontchev, Rumen Yordanov
T
INTERNATIONAL JOURNAL OF SYSTEMS APPLICATIONS, ENGINEERING & DEVELOPMENT Issue 5, Volume 7, 2013
287
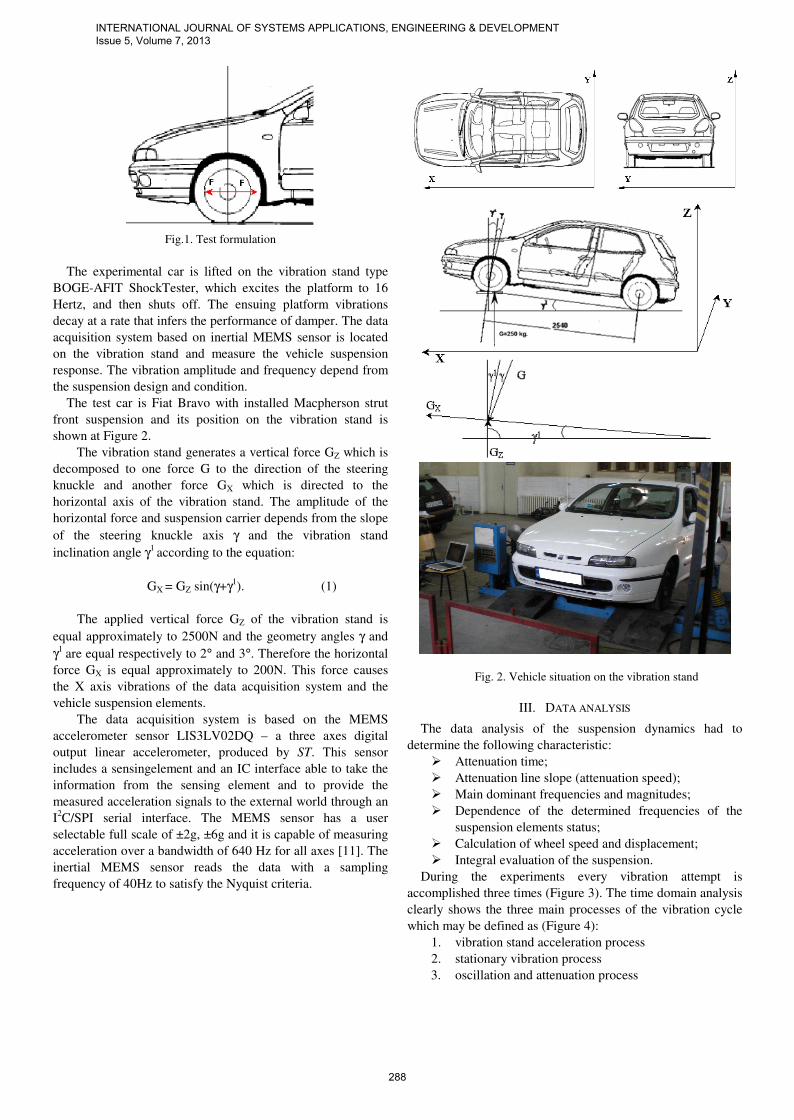
Fig.1. Test formulation
The experimental car is lifted on the vibration stand type
BOGE-AFIT ShockTester, which excites the platform to 16
Hertz, and then shuts off. The ensuing platform vibrations
decay at a rate that infers the performance of damper. The data
acquisition system based on inertial MEMS sensor is located
on the vibration stand and measure the vehicle suspension
response. The vibration amplitude and frequency depend from
the suspension design and condition.
The test car is Fiat Bravo with installed Macpherson strut
front suspension and its position on the vibration stand is
shown at Figure 2.
The vibration stand generates a vertical force GZ which is
decomposed to one force G to the direction of the steering
knuckle and another force GX which is directed to the
horizontal axis of the vibration stand. The amplitude of the
horizontal force and suspension carrier depends from the slope
of the steering knuckle axis γ and the vibration stand
inclination angle γ1 according to the equation:
GX = GZ sin(γ+γ1). (1)
The applied vertical force GZ of the vibration stand is
equal approximately to 2500N and the geometry angles γ and
γ1
are equal respectively to 2° and 3°. Therefore the horizontal
force GX is equal approximately to 200N. This force causes
the X axis vibrations of the data acquisition system and the
vehicle suspension elements.
The data acquisition system is based on the MEMS
accelerometer sensor LIS3LV02DQ – a three axes digital
output linear accelerometer, produced by ST. This sensor
includes a sensingelement and an IC interface able to take the
information from the sensing element and to provide the
measured acceleration signals to the external world through an
I2C/SPI serial interface. The MEMS sensor has a user
selectable full scale of ±2g, ±6g and it is capable of measuring
acceleration over a bandwidth of 640 Hz for all axes [11]. The
inertial MEMS sensor reads the data with a sampling
frequency of 40Hz to satisfy the Nyquist criteria.
Fig. 2. Vehicle situation on the vibration stand
III. DATA ANALYSIS
The data analysis of the suspension dynamics had to
determine the following characteristic:
� Attenuation time;
� Attenuation line slope (attenuation speed);
� Main dominant frequencies and magnitudes;
� Dependence of the determined frequencies of the
suspension elements status;
� Calculation of wheel speed and displacement;
� Integral evaluation of the suspension.
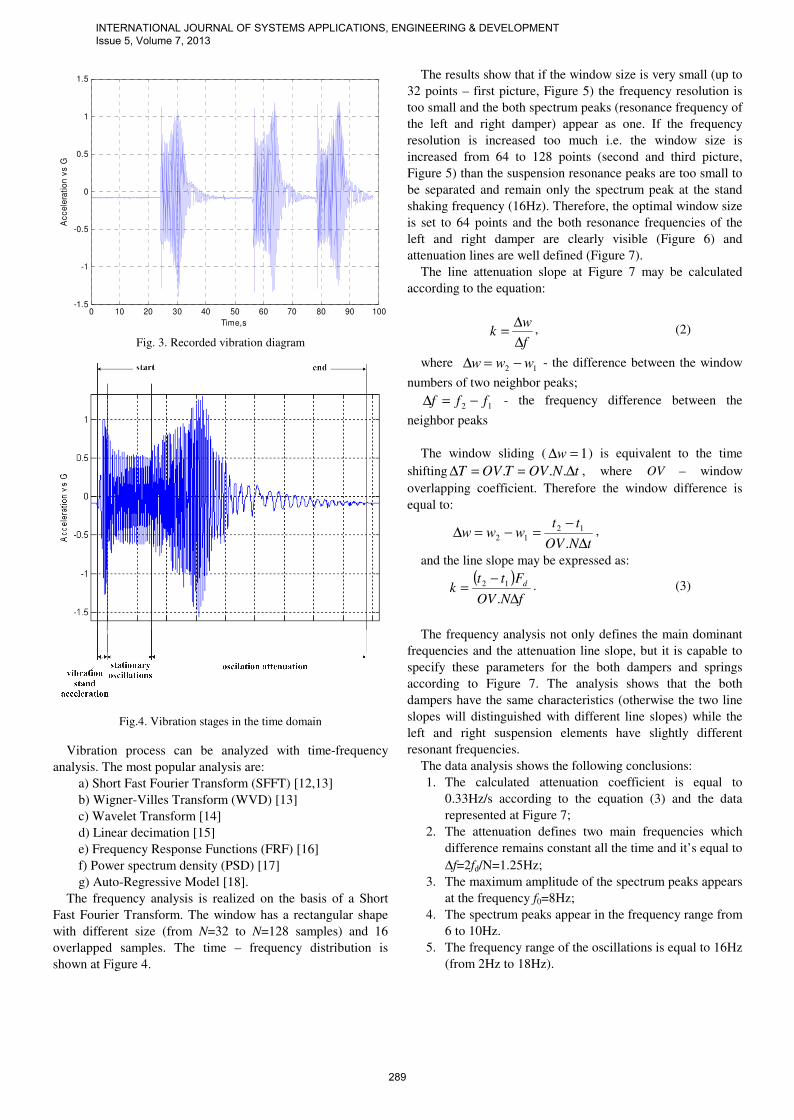
During the experiments every vibration attempt is
accomplished three times (Figure 3). The time domain analysis
clearly shows the three main processes of the vibration cycle
which may be defined as (Figure 4): 1. vibration stand acceleration process
2. stationary vibration process
3. oscillation and attenuation process
INTERNATIONAL JOURNAL OF SYSTEMS APPLICATIONS, ENGINEERING & DEVELOPMENT Issue 5, Volume 7, 2013
288
0 10 20 30 40 50 60 70 80 90 100-1.5
-1
-0.5
0
0.5
1
1.5
Time,s
Ac
ce
lera
tio
n v
s G
Fig. 3. Recorded vibration diagram
Fig.4. Vibration stages in the time domain
Vibration process can be analyzed with time-frequency
analysis. The most popular analysis are:
a) Short Fast Fourier Transform (SFFT) [12,13]
b) Wigner-Villes Transform (WVD) [13]
c) Wavelet Transform [14]
d) Linear decimation [15]
e) Frequency Response Functions (FRF) [16]
f) Power spectrum density (PSD) [17]
g) Auto-Regressive Model [18].
The frequency analysis is realized on the basis of a Short
Fast Fourier Transform. The window has a rectangular shape
with different size (from N=32 to N=128 samples) and 16
overlapped samples. The time – frequency distribution is
shown at Figure 4.
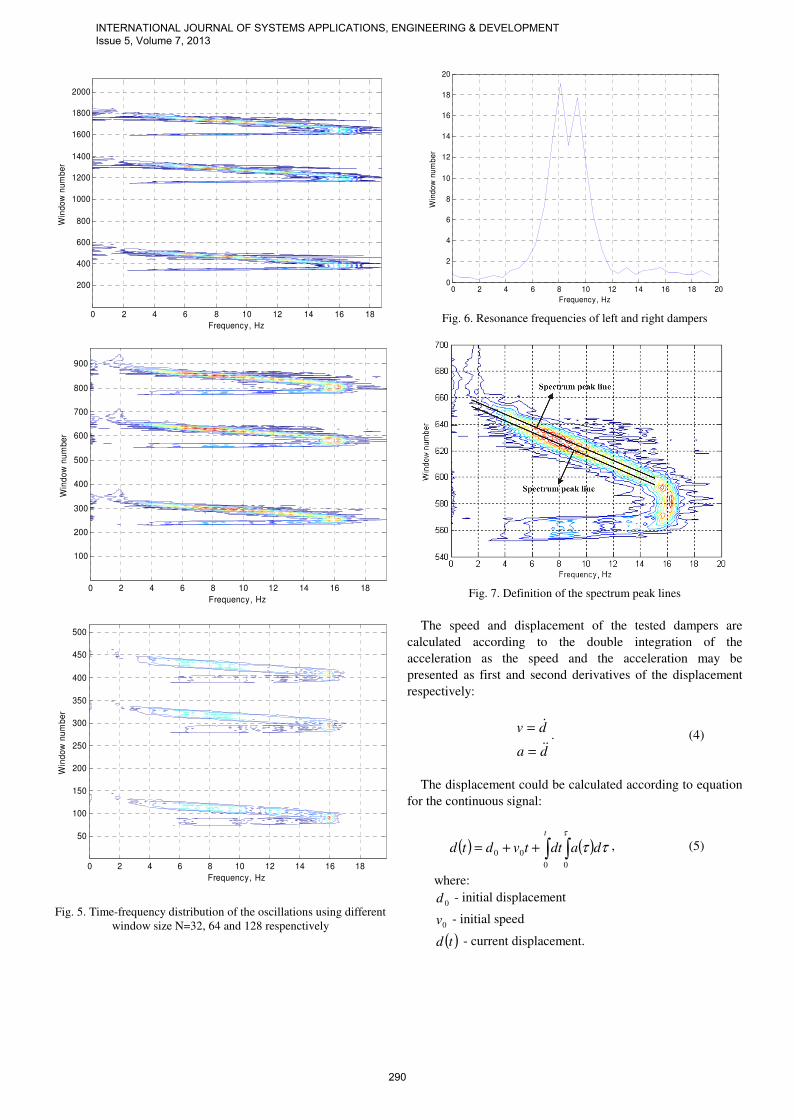
The results show that if the window size is very small (up to
32 points – first picture, Figure 5) the frequency resolution is
too small and the both spectrum peaks (resonance frequency of
the left and right damper) appear as one. If the frequency
resolution is increased too much i.e. the window size is
increased from 64 to 128 points (second and third picture,
Figure 5) than the suspension resonance peaks are too small to
be separated and remain only the spectrum peak at the stand
shaking frequency (16Hz). Therefore, the optimal window size
is set to 64 points and the both resonance frequencies of the
left and right damper are clearly visible (Figure 6) and
attenuation lines are well defined (Figure 7).
The line attenuation slope at Figure 7 may be calculated
according to the equation:
f
wk
∆
∆= , (2)
where 12 www −=∆ - the difference between the window
numbers of two neighbor peaks;
12 fff −=∆ - the frequency difference between the
neighbor peaks
The window sliding ( 1=∆w ) is equivalent to the time
shifting tNOVTOVT ∆==∆ ... , where OV – window
overlapping coefficient. Therefore the window difference is
equal to:
tNOV
ttwww
∆
−=−=∆
.
1212
,
and the line slope may be expressed as:
( )fNOV
Fttk d
∆
−=
.
12 . (3)
The frequency analysis not only defines the main dominant
frequencies and the attenuation line slope, but it is capable to
specify these parameters for the both dampers and springs
according to Figure 7. The analysis shows that the both
dampers have the same characteristics (otherwise the two line
slopes will distinguished with different line slopes) while the
left and right suspension elements have slightly different
resonant frequencies.
The data analysis shows the following conclusions:
1. The calculated attenuation coefficient is equal to
0.33Hz/s according to the equation (3) and the data
represented at Figure 7;
2. The attenuation defines two main frequencies which
difference remains constant all the time and it’s equal to
∆f=2fd/N=1.25Hz;
3. The maximum amplitude of the spectrum peaks appears
at the frequency f0=8Hz;
4. The spectrum peaks appear in the frequency range from
6 to 10Hz.
5. The frequency range of the oscillations is equal to 16Hz
(from 2Hz to 18Hz).
INTERNATIONAL JOURNAL OF SYSTEMS APPLICATIONS, ENGINEERING & DEVELOPMENT Issue 5, Volume 7, 2013
289
Frequency, Hz
Win
do
w n
um
be
r
0 2 4 6 8 10 12 14 16 18
200
400
600
800
1000
1200
1400
1600
1800
2000
Frequency, Hz
Win
do
w n
um
be
r
0 2 4 6 8 10 12 14 16 18
100
200
300
400
500
600
700
800
900
Frequency, Hz
Win
do
w n
um
be
r
0 2 4 6 8 10 12 14 16 18
50
100
150
200
250
300
350
400
450
500
Fig. 5. Time-frequency distribution of the oscillations using different
window size N=32, 64 and 128 respenctively
0 2 4 6 8 10 12 14 16 18 200
2
4
6
8
10
12
14
16
18
20
Frequency, Hz
Win
do
w n
um
be
r
Fig. 6. Resonance frequencies of left and right dampers
Fig. 7. Definition of the spectrum peak lines
The speed and displacement of the tested dampers are
calculated according to the double integration of the
acceleration as the speed and the acceleration may be
presented as first and second derivatives of the displacement
respectively:
da
dv
&&
&
=
=. (4)
The displacement could be calculated according to equation
for the continuous signal:
( ) ( )∫ ∫++=
t
dadttvdtd0 0
00
τ
ττ , (5)
where:
0d - initial displacement
0v - initial speed
( )td - current displacement.
INTERNATIONAL JOURNAL OF SYSTEMS APPLICATIONS, ENGINEERING & DEVELOPMENT Issue 5, Volume 7, 2013
290
As the used accelerometer has the digital output, the speed
could be calculated by numerical integration of the digital
acceleration data:
( )( ) ( )
tiaia
daivnt
∆
−−≅= ∑∫
002
1)( ττ , (6)
where:
n – number of points;
dFt
1=∆ - time interval between (i) and (i-1) sample;
dF - sampling frequency.
Therefore, the speed and the displacement could be
established by numerical integration of the inertial data using
trapezoidal rule:
( ) ( )( ) ( )
( ) ( )( ) ( )
tiviv
idid
tiaia
iviv
cc
cc
cc
∆−−
+−=
∆−−
+−=
2
11
2
11
(7)
Before start the measurement process and the numerical
integration procedure it is necessary to obtain the sampling
frequency to satisfy the Nyquist. It is well known that a
harmonic vibration of frequency ω and displacement amplitude
dmax, results in a maximum acceleration amax calculated as
follows [19]: 2
maxmax .ωda = (8)
Therefore, if the expected maximum acceleration is equal to
±1.5g and the displacement amplitude is equal to 20mm, the
harmonic vibration frequency is equal to:
Hzd
a
f 1.62
max
max
max ==π
(9)
The sampling frequency has to be equal to Fd≥2fmax. The
inertial MEMS sensor reads the data with a minimum sampling
frequency of 40Hz, therefore the Nyquist criteria is satisfied.
The low frequency components of the inertial data are
source of the integration errors while the suspension speed and
displacement are calculated. According to the data frequency
range, the passband filter had to be designed to reject the bias
offset and low frequency components. The following filter
properties are defined according to spectrum response shown
at Figure 7:
� filter passband - 1÷19Hz
� stopband cut-off frequencies – f1=0.5Hz; f2=19.5Hz
� maximum passband ripple – 0.1dB
� Minimum stopband attenuation – 40dB
� Approximation – IIR, Butterworth
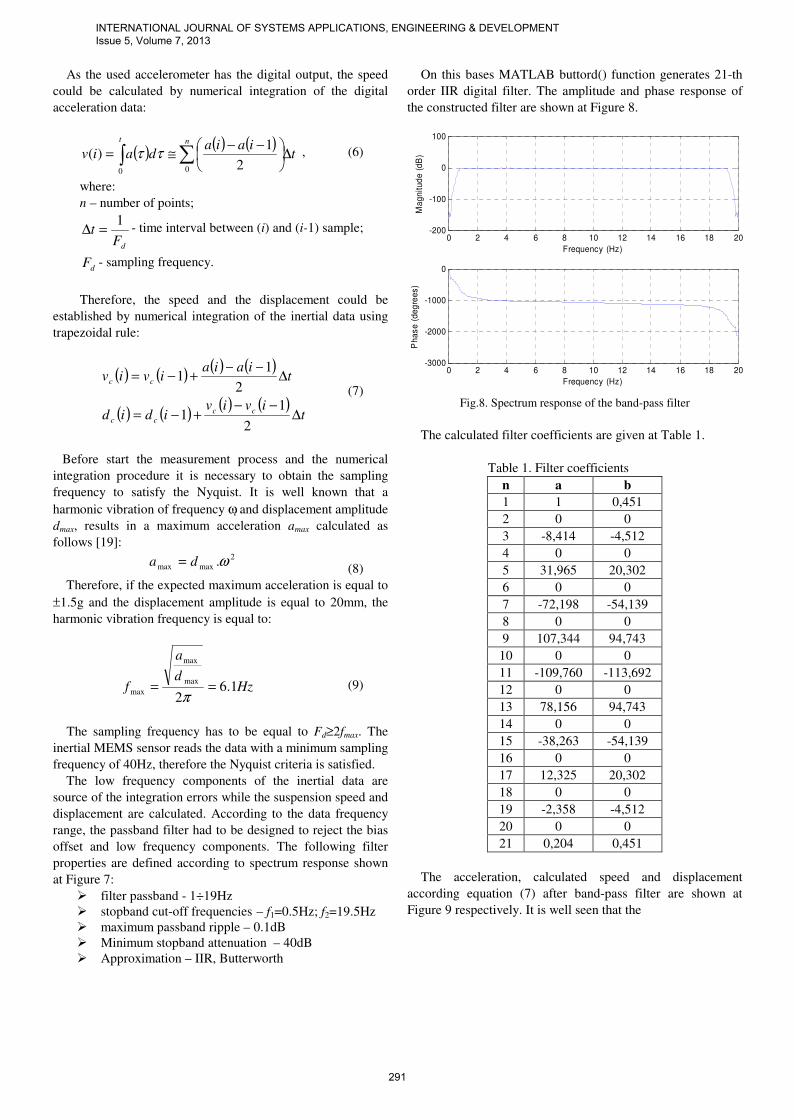
On this bases MATLAB buttord() function generates 21-th
order IIR digital filter. The amplitude and phase response of
the constructed filter are shown at Figure 8.
0 2 4 6 8 10 12 14 16 18 20-3000
-2000
-1000
0
Frequency (Hz)
Ph
as
e (
de
gre
es
)
0 2 4 6 8 10 12 14 16 18 20-200
-100
0
100
Frequency (Hz)
Ma
gn
itu
de
(d
B)
Fig.8. Spectrum response of the band-pass filter
The calculated filter coefficients are given at Table 1.
Table 1. Filter coefficients
n a b
1 1 0,451
2 0 0
3 -8,414 -4,512
4 0 0
5 31,965 20,302
6 0 0
7 -72,198 -54,139
8 0 0
9 107,344 94,743
10 0 0
11 -109,760 -113,692
12 0 0
13 78,156 94,743
14 0 0
15 -38,263 -54,139
16 0 0
17 12,325 20,302
18 0 0
19 -2,358 -4,512
20 0 0
21 0,204 0,451
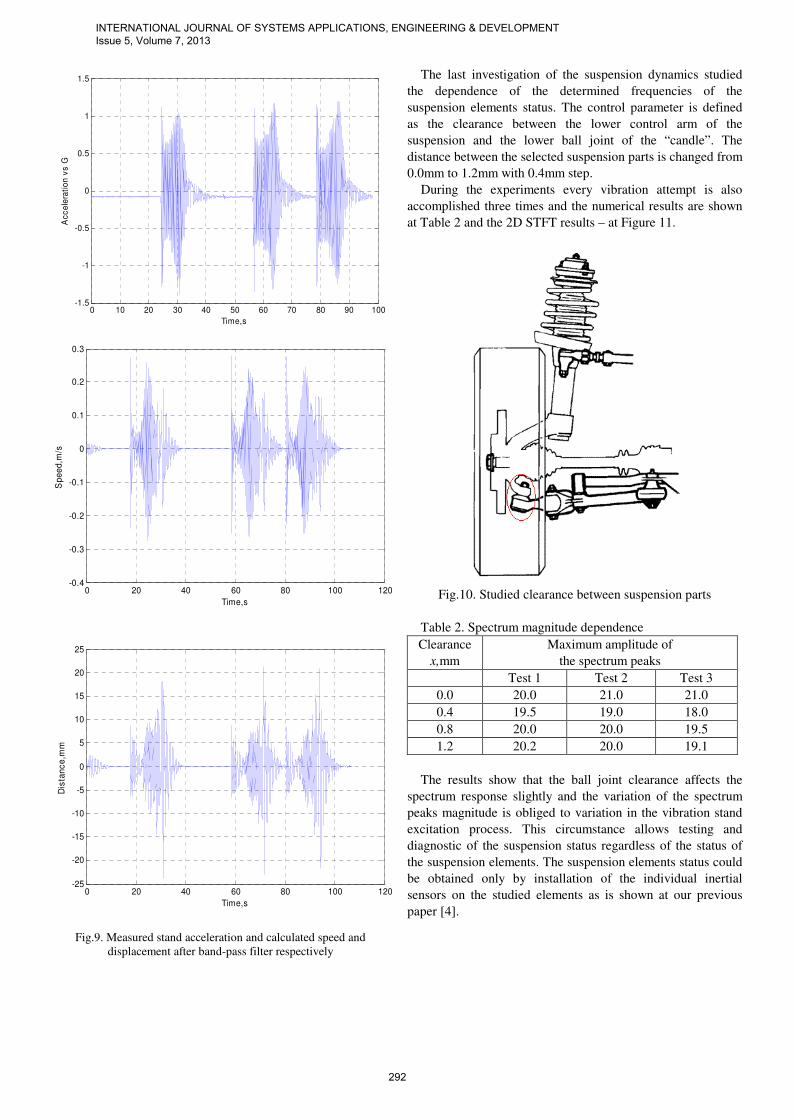
The acceleration, calculated speed and displacement
according equation (7) after band-pass filter are shown at
Figure 9 respectively. It is well seen that the
INTERNATIONAL JOURNAL OF SYSTEMS APPLICATIONS, ENGINEERING & DEVELOPMENT Issue 5, Volume 7, 2013
291
0 10 20 30 40 50 60 70 80 90 100-1.5
-1
-0.5
0
0.5
1
1.5
Time,s
Ac
ce
lera
tio
n v
s G
0 20 40 60 80 100 120-0.4
-0.3
-0.2
-0.1
0
0.1
0.2
0.3
Time,s
Sp
ee
d,m
/s
0 20 40 60 80 100 120-25
-20
-15
-10
-5
0
5
10
15
20
25
Time,s
Dis
tan
ce
,mm
Fig.9. Measured stand acceleration and calculated speed and
displacement after band-pass filter respectively
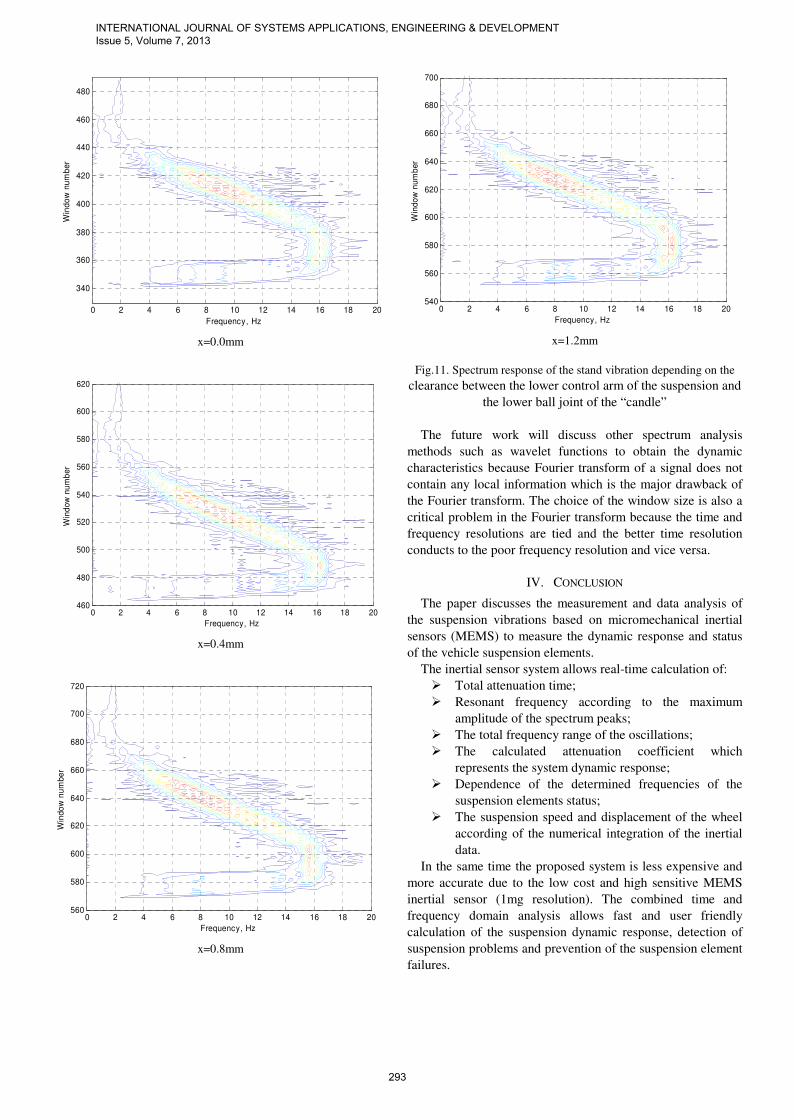
The last investigation of the suspension dynamics studied
the dependence of the determined frequencies of the
suspension elements status. The control parameter is defined
as the clearance between the lower control arm of the
suspension and the lower ball joint of the “candle”. The
distance between the selected suspension parts is changed from
0.0mm to 1.2mm with 0.4mm step.
During the experiments every vibration attempt is also
accomplished three times and the numerical results are shown
at Table 2 and the 2D STFT results – at Figure 11.
Fig.10. Studied clearance between suspension parts
Table 2. Spectrum magnitude dependence
Clearance
x,mm
Maximum amplitude of
the spectrum peaks
Test 1 Test 2 Test 3
0.0 20.0 21.0 21.0
0.4 19.5 19.0 18.0
0.8 20.0 20.0 19.5
1.2 20.2 20.0 19.1
The results show that the ball joint clearance affects the
spectrum response slightly and the variation of the spectrum
peaks magnitude is obliged to variation in the vibration stand
excitation process. This circumstance allows testing and
diagnostic of the suspension status regardless of the status of
the suspension elements. The suspension elements status could
be obtained only by installation of the individual inertial
sensors on the studied elements as is shown at our previous
paper [4].
INTERNATIONAL JOURNAL OF SYSTEMS APPLICATIONS, ENGINEERING & DEVELOPMENT Issue 5, Volume 7, 2013
292
Frequency, Hz
Win
do
w n
um
be
r
0 2 4 6 8 10 12 14 16 18 20
340
360
380
400
420
440
460
480
x=0.0mm
Frequency, Hz
Win
do
w n
um
be
r
0 2 4 6 8 10 12 14 16 18 20460
480
500
520
540
560
580
600
620
x=0.4mm
Frequency, Hz
Win
do
w n
um
be
r
0 2 4 6 8 10 12 14 16 18 20560
580
600
620
640
660
680
700
720
x=0.8mm
Frequency, Hz
Win
do
w n
um
be
r
0 2 4 6 8 10 12 14 16 18 20540
560
580
600
620
640
660
680
700
x=1.2mm
Fig.11. Spectrum response of the stand vibration depending on the
clearance between the lower control arm of the suspension and
the lower ball joint of the “candle”
The future work will discuss other spectrum analysis
methods such as wavelet functions to obtain the dynamic
characteristics because Fourier transform of a signal does not
contain any local information which is the major drawback of
the Fourier transform. The choice of the window size is also a
critical problem in the Fourier transform because the time and
frequency resolutions are tied and the better time resolution
conducts to the poor frequency resolution and vice versa.
IV. CONCLUSION
The paper discusses the measurement and data analysis of
the suspension vibrations based on micromechanical inertial
sensors (MEMS) to measure the dynamic response and status
of the vehicle suspension elements.
The inertial sensor system allows real-time calculation of:
� Total attenuation time;
� Resonant frequency according to the maximum
amplitude of the spectrum peaks;
� The total frequency range of the oscillations;
� The calculated attenuation coefficient which
represents the system dynamic response;
� Dependence of the determined frequencies of the
suspension elements status;
� The suspension speed and displacement of the wheel
according of the numerical integration of the inertial
data.
In the same time the proposed system is less expensive and
more accurate due to the low cost and high sensitive MEMS
inertial sensor (1mg resolution). The combined time and
frequency domain analysis allows fast and user friendly
calculation of the suspension dynamic response, detection of
suspension problems and prevention of the suspension element
failures.
INTERNATIONAL JOURNAL OF SYSTEMS APPLICATIONS, ENGINEERING & DEVELOPMENT Issue 5, Volume 7, 2013
293
ACKNOWLEDGMENT
This paper was prepared and supported by the National
Fund under contract number No.DTK02/2-2009.
REFERENCES
[1]. Haytham Qasem Mahamda, Omar Gorgis, Design and calibration of an
inertial navigation sensor node for precise tracking, 6th WSEAS
International Conference on CIRCUITS, SYSTEMS,
ELECTRONICS,CONTROL & SIGNAL PROCESSING, Cairo, Egypt,
Dec 29-31, 2007
[2]. Josip Music, Roman Kamnik, Vlasta Zanchi, Marko Munih, Model
Based Inertial Sensing for Measuring the Kinematics of Sit-to-Stand
Motion, 3rd WSEAS International Conference on REMOTE SENSING,
Venice, Italy, November 21-23, 2007, pp.8-13
[3]. Krishnamurthy Bhat, Chayalakshmi C.L., Tilt angle measurement using
accelerometer IC and CAN protocol implementation for data
transmission, Proceedings of the 7th WSEAS International Conference
on Applied Informatics and Communications, Athens, Greece, August
24-26, 2007, pp.298-302
[4]. Emil Iontchev, Ilian Damyanov, Ivaylo Simeonov, Rossen Miletiev,
Inertial system for measurement of the dynamic response and status of
the vehicle suspension elements, The Third International Conference on
Digital Information Processing and Communications ICDIPC’2013,
Dubai, UAE, 30 Jan – 01 Feb, 2013
[5]. Tsymberov, Anatoly, “An Improved Non-Intrusive Automotive
Suspension Testing Apparatus with Means to Determine the Condition
of the Dampers”, SAE #960735 (1996)
[6]. Balsarotti, Steve and Bradley, Wayne. “Experimental Evaluation of a
Non-Intrusive, Automotive Suspension Testing Apparatus”, SAE
#2000-01-1329 (2000)
[7]. Haedo, Martin J., “Suspension Tester CVA 2003: User Manual,”
Buenos Aires, Argentina (2003)
[8]. Marius-Constantin O.S. Popescu Nikos E. Mastorakis, Testing and
Simulation of a Motor Vehicle Suspension, International Journal of
Systems applications, Engineering & Development, Issue 2, Volume 3,
2009, University press
[9]. Balsarotti, Steve and Bradley, Wayne. “Experimental Evaluation of a
Non-Intrusive Automotive Suspension Testing Apparatus”. SAE #2000-
01-1329 (2000)
[10]. Monroe suspension, “All About Suspension”, Tenneco (2006)
[11]. Datasheet of LIS2LV02DQ linear accelerometer -
www.st.com/stonline/products/literature/ds/ 10175/lis3l02dq.pdf
[12]. Grant A. Malmedahl, “Analysis of Automotive Damper Data and
Design of a Portable Measurement System”, The Ohio State University,
May 20 (2005)
[13]. Bin Li, Yu Quo , YanChun Ding, TingWei Liu, Jing Na, Yan Gao,
“Vibration Analysis of Rotor System by Combined Adaptive Time-
Frequency Analysis and Independent Component Analysis”, Key
Engineering Materials Vols 474-476, p.1406-1411 (2011)
[14]. Emil Iontchev, Ivaylo Simeonov, Rosen Miletiev – “GPS/INS system for
urban railway monitoring based on MEMS inertial sensors”, 22nd
Micromechanics and Micro Systems Europe Workshop, MME’2011,
ISBN 978-82-7860-224-9 (2011)
[15]. Paweł Sobczak, “Procedure of linear decimation in car suspension
diagnosis”, Transport Problems, Vol. 4, Issue 3, 105-112 (2009)
[16]. Damien Maher, “Combined Time and Frequency Domain Approaches
to the Operational Identification of Vehicle Suspension Systems”, PhD
Thesis, Dublin City University, January (2011)
[17]. Guoying Tian, Wanming Zhai, Jianmin Gao and Shaolin Wang,
“Dynamic Response Analysis of Vertical Vehicle-Track Coupled
System in Frequency Domain”, Third International Conference on
Transportation Engineering (ICTE), Chengdu, China, July 23-25 (2011)
[18]. S.A. Neild, “Using Non-Linear Vibration Techniques to Detect Damage
in Concrete Bridges”, Department of Engineering Science, University of
Oxford, July (2001)
[19]. Martin Arraigada, Manfred Partl - Calculation of displacements of
measured accelerations, analysis of two accelerometers and application
in road engineering, 6th Swiss Transport Research Conference, Monte
Verità / Ascona, March 15 – 17, 2006
INTERNATIONAL JOURNAL OF SYSTEMS APPLICATIONS, ENGINEERING & DEVELOPMENT Issue 5, Volume 7, 2013
294