Embed Size (px)
Citation preview
MIS Cases: Decision Making With Application Software, Second Edition Page 1
Screenshots © Microsoft Corporation. All rights reserved. Copyright © 2005 by Prentice-Hall, Inc., All rights reserved.
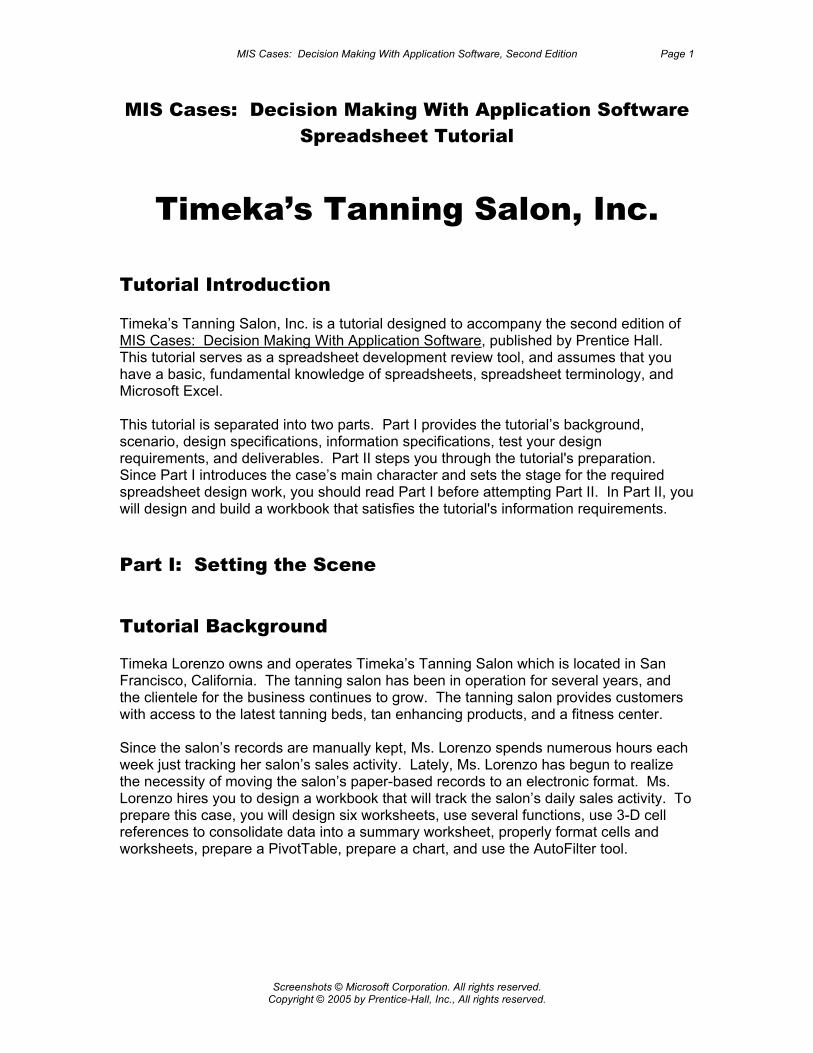
MIS Cases: Decision Making With Application Software Spreadsheet Tutorial
Timeka’s Tanning Salon, Inc. Tutorial Introduction Timeka’s Tanning Salon, Inc. is a tutorial designed to accompany the second edition of MIS Cases: Decision Making With Application Software, published by Prentice Hall. This tutorial serves as a spreadsheet development review tool, and assumes that you have a basic, fundamental knowledge of spreadsheets, spreadsheet terminology, and Microsoft Excel. This tutorial is separated into two parts. Part I provides the tutorial’s background, scenario, design specifications, information specifications, test your design requirements, and deliverables. Part II steps you through the tutorial's preparation. Since Part I introduces the case’s main character and sets the stage for the required spreadsheet design work, you should read Part I before attempting Part II. In Part II, you will design and build a workbook that satisfies the tutorial's information requirements. Part I: Setting the Scene Tutorial Background Timeka Lorenzo owns and operates Timeka’s Tanning Salon which is located in San Francisco, California. The tanning salon has been in operation for several years, and the clientele for the business continues to grow. The tanning salon provides customers with access to the latest tanning beds, tan enhancing products, and a fitness center. Since the salon’s records are manually kept, Ms. Lorenzo spends numerous hours each week just tracking her salon’s sales activity. Lately, Ms. Lorenzo has begun to realize the necessity of moving the salon’s paper-based records to an electronic format. Ms. Lorenzo hires you to design a workbook that will track the salon’s daily sales activity. To prepare this case, you will design six worksheets, use several functions, use 3-D cell references to consolidate data into a summary worksheet, properly format cells and worksheets, prepare a PivotTable, prepare a chart, and use the AutoFilter tool.
Timeka’s Tanning Salon, Inc. Spreadsheet Tutorial Page 2
Screenshots © Microsoft Corporation. All rights reserved. Copyright © 2005 by Prentice-Hall, Inc., All rights reserved.
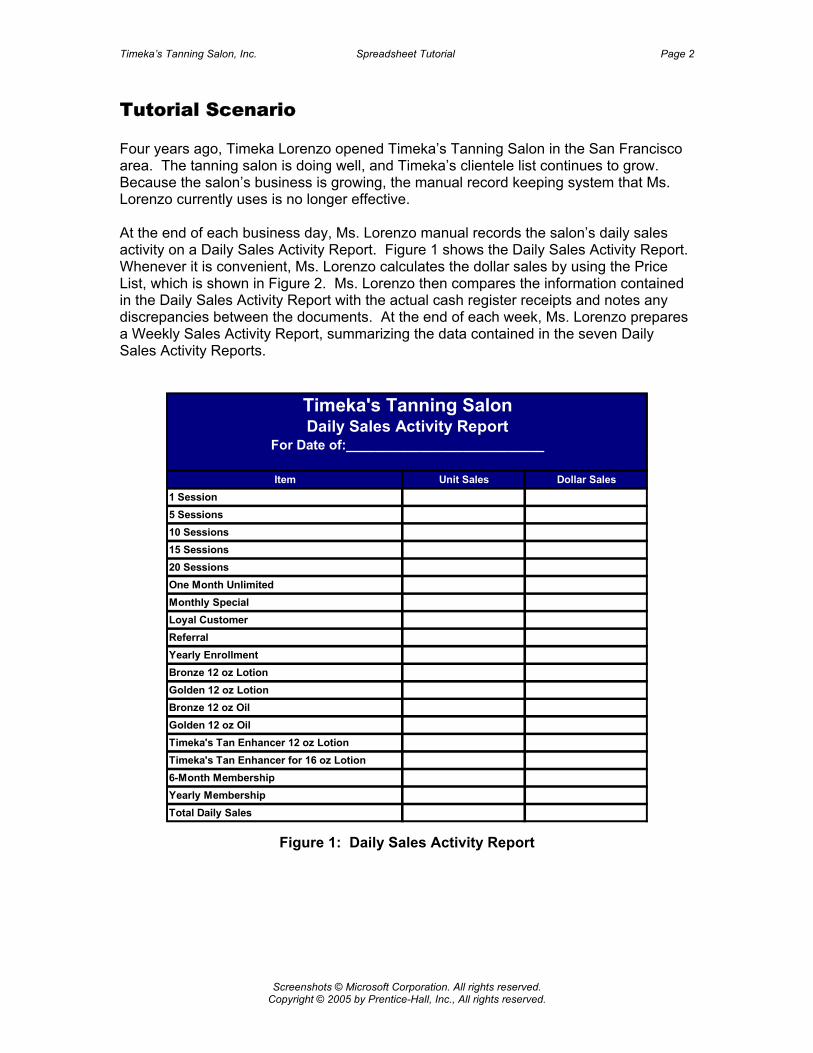
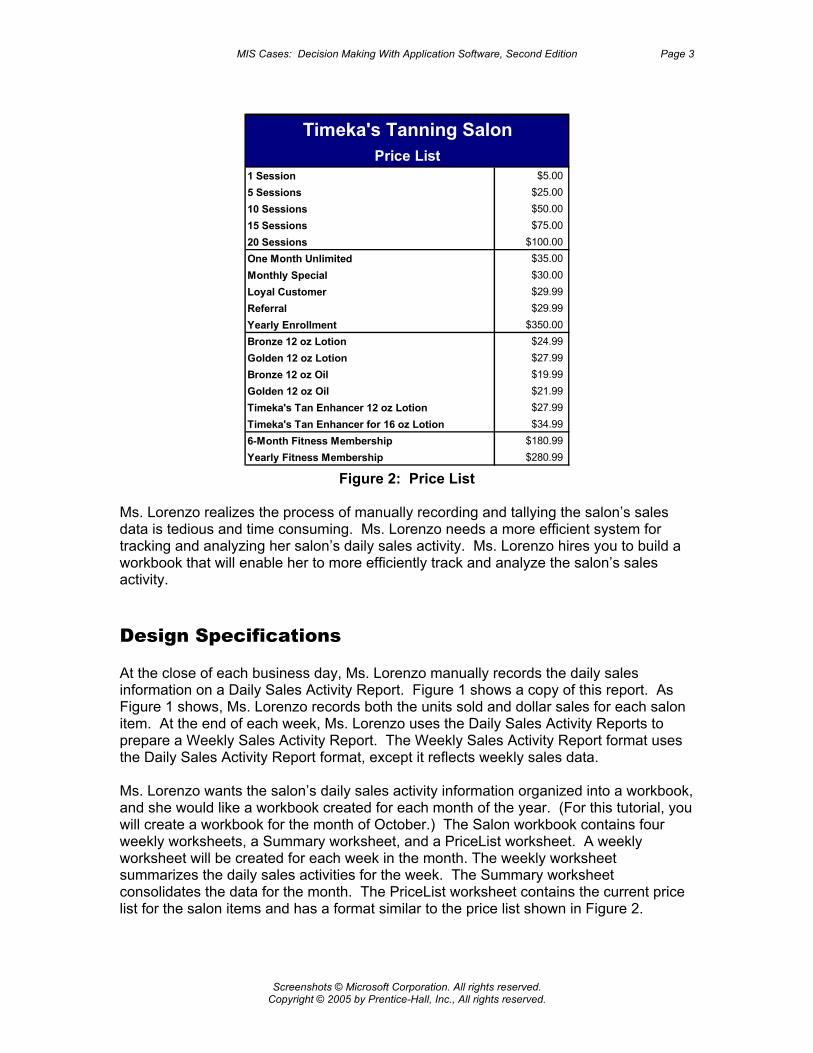
Tutorial Scenario Four years ago, Timeka Lorenzo opened Timeka’s Tanning Salon in the San Francisco area. The tanning salon is doing well, and Timeka’s clientele list continues to grow. Because the salon’s business is growing, the manual record keeping system that Ms. Lorenzo currently uses is no longer effective. At the end of each business day, Ms. Lorenzo manual records the salon’s daily sales activity on a Daily Sales Activity Report. Figure 1 shows the Daily Sales Activity Report. Whenever it is convenient, Ms. Lorenzo calculates the dollar sales by using the Price List, which is shown in Figure 2. Ms. Lorenzo then compares the information contained in the Daily Sales Activity Report with the actual cash register receipts and notes any discrepancies between the documents. At the end of each week, Ms. Lorenzo prepares a Weekly Sales Activity Report, summarizing the data contained in the seven Daily Sales Activity Reports.
Figure 1: Daily Sales Activity Report
Item Unit Sales Dollar Sales1 Session5 Sessions10 Sessions15 Sessions20 SessionsOne Month UnlimitedMonthly SpecialLoyal CustomerReferralYearly EnrollmentBronze 12 oz LotionGolden 12 oz LotionBronze 12 oz OilGolden 12 oz OilTimeka's Tan Enhancer 12 oz LotionTimeka's Tan Enhancer for 16 oz Lotion6-Month MembershipYearly MembershipTotal Daily Sales
Timeka's Tanning SalonDaily Sales Activity Report
For Date of:___________________________
MIS Cases: Decision Making With Application Software, Second Edition Page 3
Screenshots © Microsoft Corporation. All rights reserved. Copyright © 2005 by Prentice-Hall, Inc., All rights reserved.
1 Session $5.005 Sessions $25.0010 Sessions $50.0015 Sessions $75.0020 Sessions $100.00One Month Unlimited $35.00Monthly Special $30.00Loyal Customer $29.99Referral $29.99Yearly Enrollment $350.00Bronze 12 oz Lotion $24.99Golden 12 oz Lotion $27.99Bronze 12 oz Oil $19.99Golden 12 oz Oil $21.99Timeka's Tan Enhancer 12 oz Lotion $27.99Timeka's Tan Enhancer for 16 oz Lotion $34.996-Month Fitness Membership $180.99Yearly Fitness Membership $280.99
Price ListTimeka's Tanning Salon
Figure 2: Price List
Ms. Lorenzo realizes the process of manually recording and tallying the salon’s sales data is tedious and time consuming. Ms. Lorenzo needs a more efficient system for tracking and analyzing her salon’s daily sales activity. Ms. Lorenzo hires you to build a workbook that will enable her to more efficiently track and analyze the salon’s sales activity. Design Specifications At the close of each business day, Ms. Lorenzo manually records the daily sales information on a Daily Sales Activity Report. Figure 1 shows a copy of this report. As Figure 1 shows, Ms. Lorenzo records both the units sold and dollar sales for each salon item. At the end of each week, Ms. Lorenzo uses the Daily Sales Activity Reports to prepare a Weekly Sales Activity Report. The Weekly Sales Activity Report format uses the Daily Sales Activity Report format, except it reflects weekly sales data. Ms. Lorenzo wants the salon’s daily sales activity information organized into a workbook, and she would like a workbook created for each month of the year. (For this tutorial, you will create a workbook for the month of October.) The Salon workbook contains four weekly worksheets, a Summary worksheet, and a PriceList worksheet. A weekly worksheet will be created for each week in the month. The weekly worksheet summarizes the daily sales activities for the week. The Summary worksheet consolidates the data for the month. The PriceList worksheet contains the current price list for the salon items and has a format similar to the price list shown in Figure 2.
Timeka’s Tanning Salon, Inc. Spreadsheet Tutorial Page 4
Screenshots © Microsoft Corporation. All rights reserved. Copyright © 2005 by Prentice-Hall, Inc., All rights reserved.
Information Specifications Ms. Lorenzo will use the new Salon workbook to analyze the tanning salon’s sales activities. She is particularly interested in identifying the most popular tanning sessions, as well as reviewing salon sales by category. In addition to these information requirements, Ms. Lorenzo would like you to provide her with the following information. 1. Ms. Lorenzo wants a pie chart that compares the monthly sales for the tanning
products. 2. Based on the monthly total dollar sales, identify the salon’s top two selling items. 3. Based on the monthly total dollar sales, which salon item appears to be the least
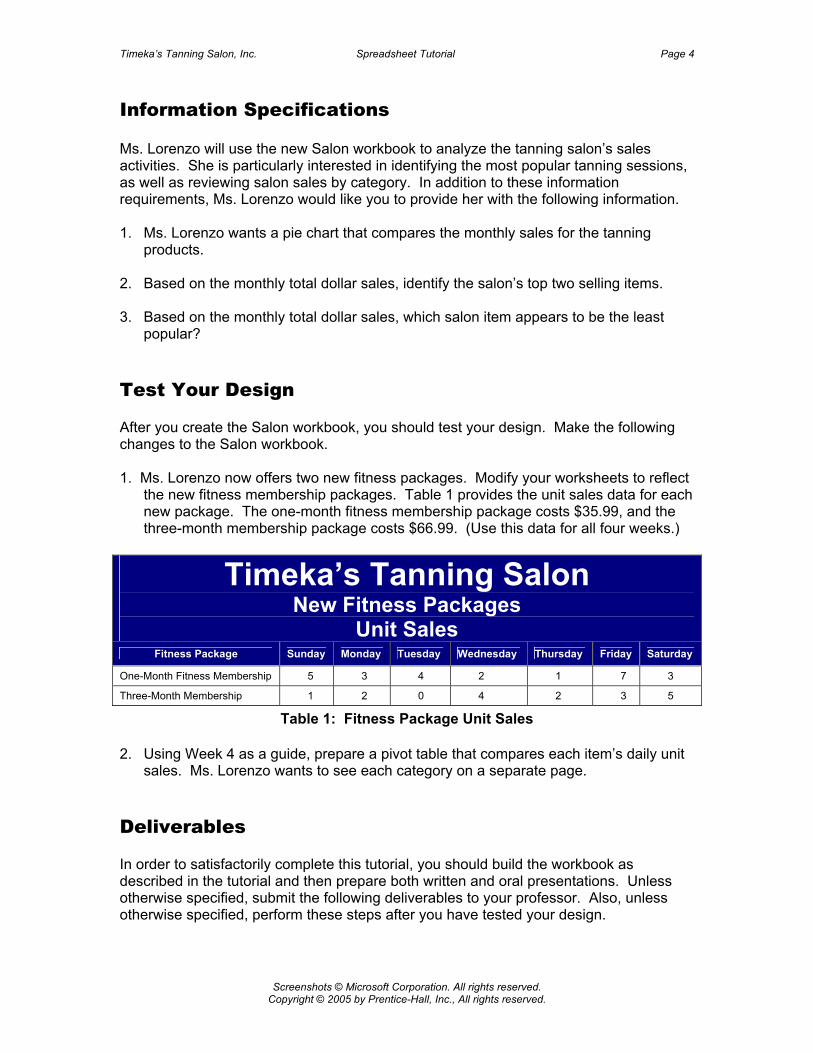
popular? Test Your Design After you create the Salon workbook, you should test your design. Make the following changes to the Salon workbook. 1. Ms. Lorenzo now offers two new fitness packages. Modify your worksheets to reflect
the new fitness membership packages. Table 1 provides the unit sales data for each new package. The one-month fitness membership package costs $35.99, and the three-month membership package costs $66.99. (Use this data for all four weeks.)
Timeka’s Tanning Salon New Fitness Packages
Unit Sales
Fitness Package Sunday Monday Tuesday Wednesday Thursday Friday Saturday
One-Month Fitness Membership 5 3 4 2 1 7 3
Three-Month Membership 1 2 0 4 2 3 5
Table 1: Fitness Package Unit Sales 2. Using Week 4 as a guide, prepare a pivot table that compares each item’s daily unit
sales. Ms. Lorenzo wants to see each category on a separate page. Deliverables In order to satisfactorily complete this tutorial, you should build the workbook as described in the tutorial and then prepare both written and oral presentations. Unless otherwise specified, submit the following deliverables to your professor. Also, unless otherwise specified, perform these steps after you have tested your design.

MIS Cases: Decision Making With Application Software, Second Edition Page 5
Screenshots © Microsoft Corporation. All rights reserved. Copyright © 2005 by Prentice-Hall, Inc., All rights reserved.
1. A written report discussing any assumptions you have made about the tutorial and the key elements of the tutorial. Additionally, what features did you add to make the workbook more functional? User friendly? (Please note that these assumptions cannot violate any of the requirements specified above and must be approved by your professor.)
2. A printout of each worksheet. 3. A printout of each worksheet’s formulas. 4. An electronic, working copy of your workbook that meets the criteria mentioned in the
case scenario and specifications sections. 5. Results for each question posed above. (A memo to your instructor discussing these
results should also be provided.) 6. As mentioned above, you should prepare an oral presentation. (Your instructor will
establish the time allocated to your presentation.) You should use a presentation package and discuss the key features of your workbook. Also, discuss how the workbook is beneficial for Ms. Lorenzo. What additional information should be included in the workbook to make it more useful?
Timeka’s Tanning Salon, Inc. Spreadsheet Tutorial Page 6
Screenshots © Microsoft Corporation. All rights reserved. Copyright © 2005 by Prentice-Hall, Inc., All rights reserved.
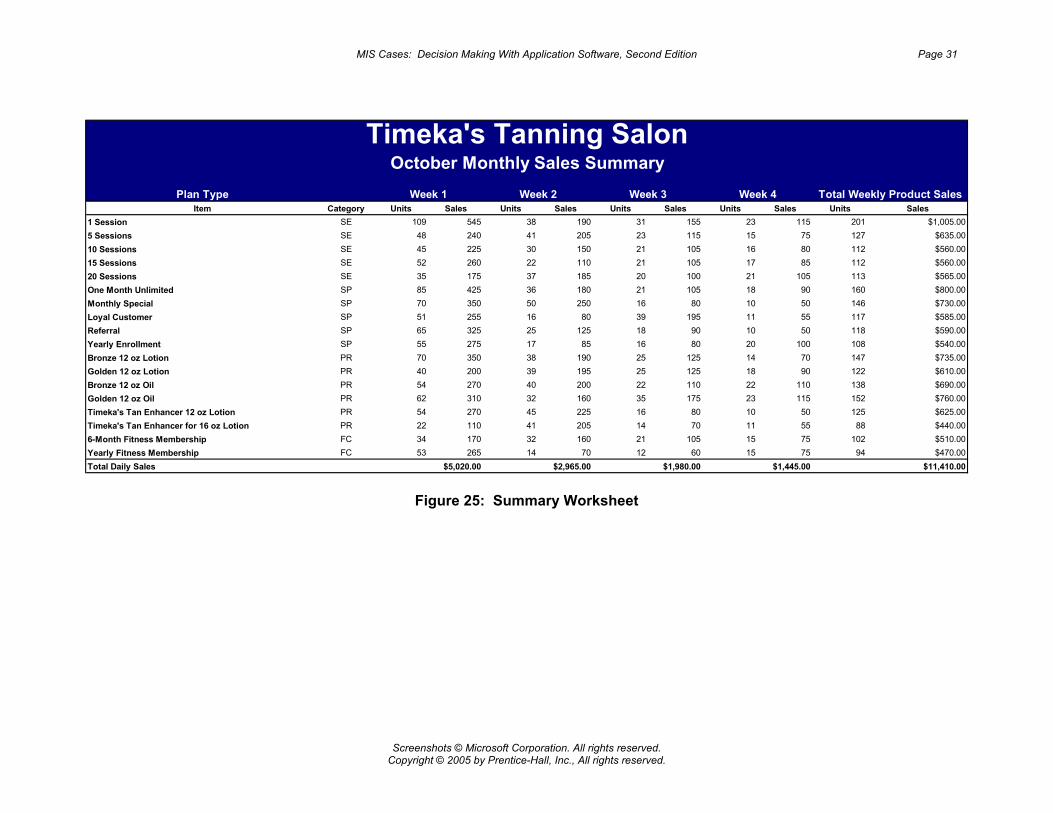
Part II: Workbook Preparation Design Preparation If you have not already done so, please read Part I of this tutorial. To satisfy Ms. Lorenzo’s design specifications, you will develop a workbook that contains weekly, summary, and price list worksheets. You will prepare four weekly worksheets. Each weekly worksheet summarizes the daily sales activity for each week. The weekly worksheets will be named Week1, Week2, Week3, and Week4. The summary worksheet is named Summary and consolidates the data from the weekly worksheets. The price list worksheet is named PriceList and contains the current price list for the salon. The weekly worksheets use the price list worksheet’s data to calculate the daily dollar sales. The Salon workbook preparation can be broken into four primary activities. These activities involve preparing the initial workbook, creating the PriceList worksheet, creating the weekly worksheets, and creating a Summary worksheet. Each activity is described below. For reference purposes, Figure 3 shows the completed PriceList worksheet. Figure 24 shows the Week1 worksheet. Figure 25 shows the completed Summary worksheet. (The data shown in these figures do not reflect the updates required by the Test Your Design section.) Activity 1: Initial Workbook Preparation The initial workbook preparation involves three major tasks: creating and saving a new workbook, inserting three additional worksheets, and renaming the worksheets. Each task is reviewed below. (Please keep in mind that you should periodically save your work!) Task 1: Create and Save a New Workbook To perform the initial workbook preparation, perform the following steps: 1. Start Microsoft Excel. 2. Create a new workbook. 3. Save the new workbook as Salon. Task 2: Insert Three New Worksheets To insert a new worksheet, you can: 1. From the Insert menu located on the Worksheet Menu Bar, select the Worksheet
command.
MIS Cases: Decision Making With Application Software, Second Edition Page 7
Screenshots © Microsoft Corporation. All rights reserved. Copyright © 2005 by Prentice-Hall, Inc., All rights reserved.
2. Repeat this step 2 times. Task 3: Rename the Worksheets To rename the worksheets, you can: 1. Right click the sheet tab name, and then select the Rename command. Type the
worksheet’s new name. 2. Repeat this process for each worksheet. Name the worksheets: PriceList,
Summary, Week1, Week2, Week3, and Week4. (Hint: Keep the worksheets in this order.)
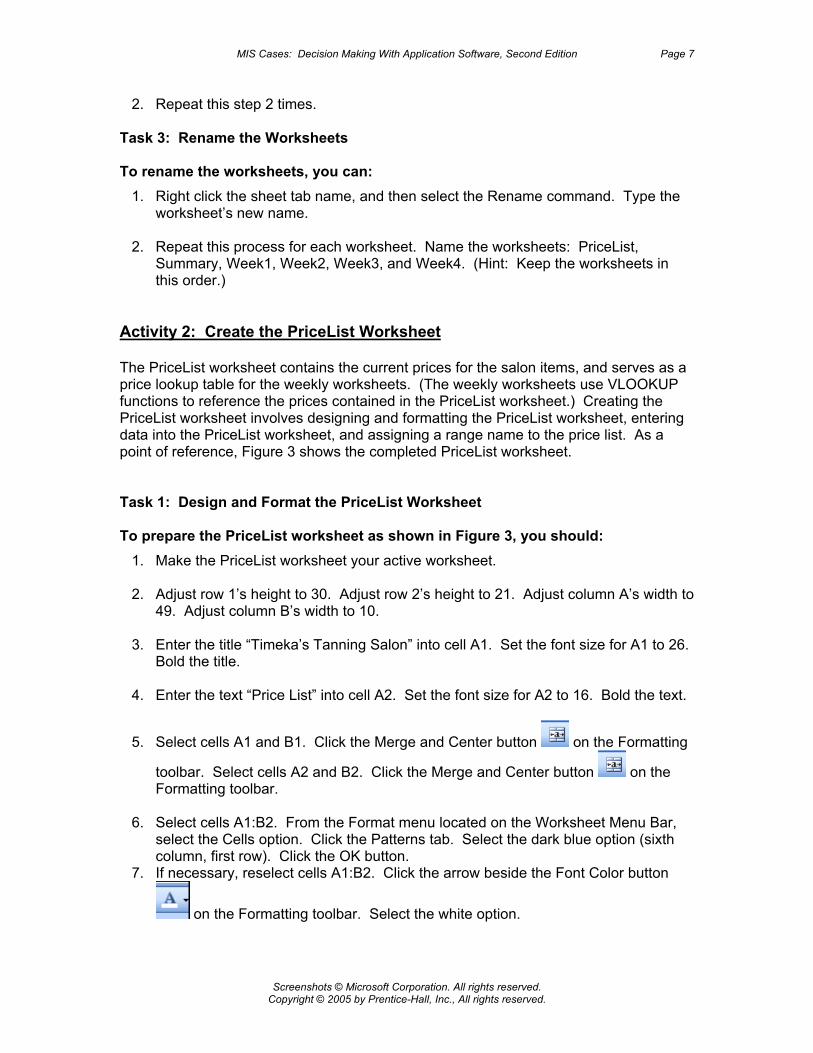
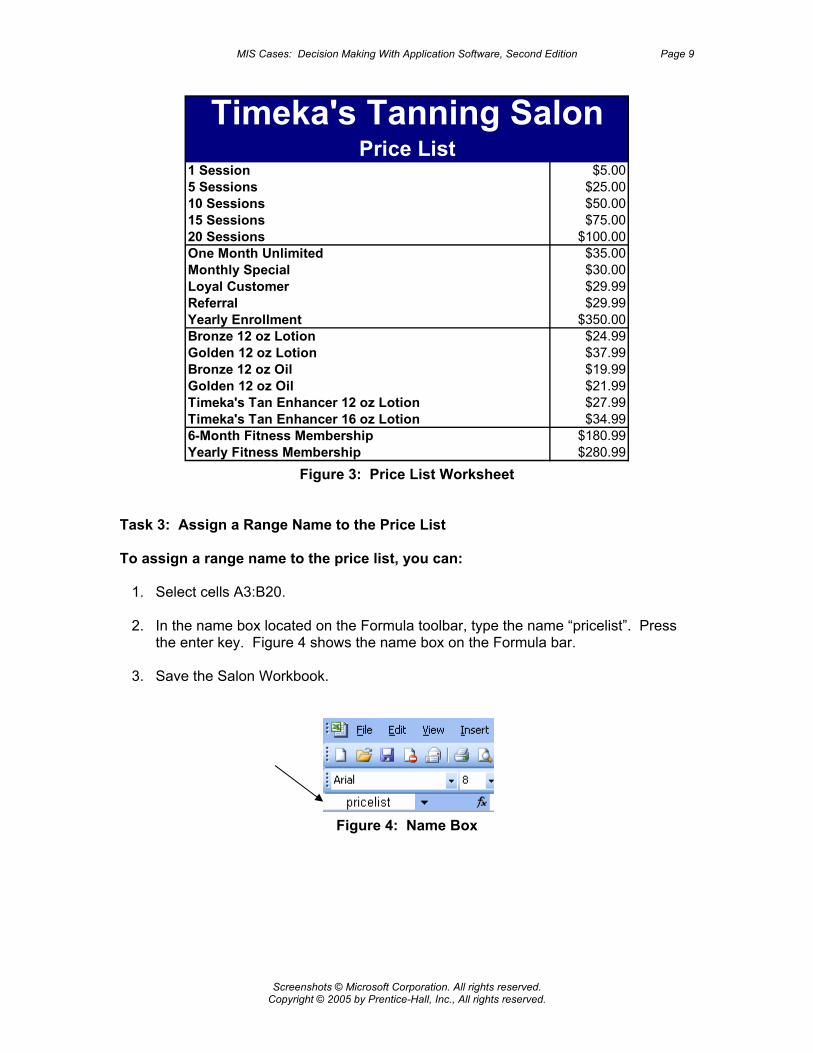
Activity 2: Create the PriceList Worksheet The PriceList worksheet contains the current prices for the salon items, and serves as a price lookup table for the weekly worksheets. (The weekly worksheets use VLOOKUP functions to reference the prices contained in the PriceList worksheet.) Creating the PriceList worksheet involves designing and formatting the PriceList worksheet, entering data into the PriceList worksheet, and assigning a range name to the price list. As a point of reference, Figure 3 shows the completed PriceList worksheet. Task 1: Design and Format the PriceList Worksheet To prepare the PriceList worksheet as shown in Figure 3, you should: 1. Make the PriceList worksheet your active worksheet. 2. Adjust row 1’s height to 30. Adjust row 2’s height to 21. Adjust column A’s width to
49. Adjust column B’s width to 10. 3. Enter the title “Timeka’s Tanning Salon” into cell A1. Set the font size for A1 to 26.
Bold the title. 4. Enter the text “Price List” into cell A2. Set the font size for A2 to 16. Bold the text.
5. Select cells A1 and B1. Click the Merge and Center button on the Formatting
toolbar. Select cells A2 and B2. Click the Merge and Center button on the Formatting toolbar.
6. Select cells A1:B2. From the Format menu located on the Worksheet Menu Bar,
select the Cells option. Click the Patterns tab. Select the dark blue option (sixth column, first row). Click the OK button.
7. If necessary, reselect cells A1:B2. Click the arrow beside the Font Color button
on the Formatting toolbar. Select the white option.
Timeka’s Tanning Salon, Inc. Spreadsheet Tutorial Page 8
Screenshots © Microsoft Corporation. All rights reserved. Copyright © 2005 by Prentice-Hall, Inc., All rights reserved.
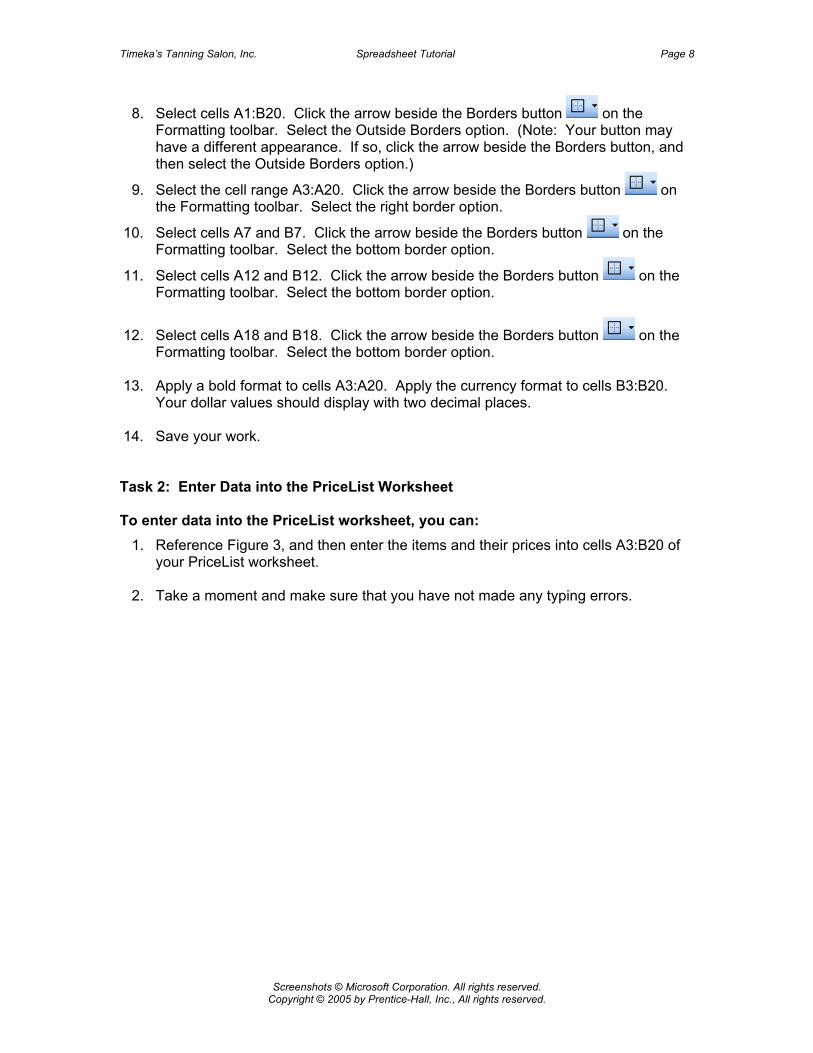
8. Select cells A1:B20. Click the arrow beside the Borders button on the Formatting toolbar. Select the Outside Borders option. (Note: Your button may have a different appearance. If so, click the arrow beside the Borders button, and then select the Outside Borders option.)
9. Select the cell range A3:A20. Click the arrow beside the Borders button on the Formatting toolbar. Select the right border option.
10. Select cells A7 and B7. Click the arrow beside the Borders button on the Formatting toolbar. Select the bottom border option.
11. Select cells A12 and B12. Click the arrow beside the Borders button on the Formatting toolbar. Select the bottom border option.
12. Select cells A18 and B18. Click the arrow beside the Borders button on the Formatting toolbar. Select the bottom border option.
13. Apply a bold format to cells A3:A20. Apply the currency format to cells B3:B20.
Your dollar values should display with two decimal places. 14. Save your work. Task 2: Enter Data into the PriceList Worksheet
To enter data into the PriceList worksheet, you can: 1. Reference Figure 3, and then enter the items and their prices into cells A3:B20 of
your PriceList worksheet. 2. Take a moment and make sure that you have not made any typing errors.
MIS Cases: Decision Making With Application Software, Second Edition Page 9
Screenshots © Microsoft Corporation. All rights reserved. Copyright © 2005 by Prentice-Hall, Inc., All rights reserved.
1 Session $5.005 Sessions $25.0010 Sessions $50.0015 Sessions $75.0020 Sessions $100.00One Month Unlimited $35.00Monthly Special $30.00Loyal Customer $29.99Referral $29.99Yearly Enrollment $350.00Bronze 12 oz Lotion $24.99Golden 12 oz Lotion $37.99Bronze 12 oz Oil $19.99Golden 12 oz Oil $21.99Timeka's Tan Enhancer 12 oz Lotion $27.99Timeka's Tan Enhancer 16 oz Lotion $34.996-Month Fitness Membership $180.99Yearly Fitness Membership $280.99
Timeka's Tanning SalonPrice List
Figure 3: Price List Worksheet
Task 3: Assign a Range Name to the Price List To assign a range name to the price list, you can: 1. Select cells A3:B20. 2. In the name box located on the Formula toolbar, type the name “pricelist”. Press
the enter key. Figure 4 shows the name box on the Formula bar. 3. Save the Salon Workbook.
Figure 4: Name Box

Timeka’s Tanning Salon, Inc. Spreadsheet Tutorial Page 10
Screenshots © Microsoft Corporation. All rights reserved. Copyright © 2005 by Prentice-Hall, Inc., All rights reserved.
Activity 3: Create the Weekly Worksheets Since the four weekly worksheets have the same design and formatting requirements, you can group the worksheets and then format and design their layout at the same time. To properly prepare the worksheets, you need to group the worksheets, format and design the worksheets, enter data into the worksheets, and enter formulas into the worksheets. When creating the formulas to calculate the daily sales, your formulas will reference data contained in the PriceList worksheet. Task 1: Group the Week1, Week2, Week3, and Week4 Worksheets To group the weekly worksheets, you can: 1. Click the Week1 sheet tab. While holding down the Shift key, click the Week4
sheet tab. (When a worksheet is part of a worksheet group, its sheet tab has a white background. Figure 5 shows that the Week1, Week2, Week3, and Week4 worksheets are grouped. In Figure 5, Week1 is the active sheet. Keep in mind that any changes made to the Week1 worksheet will also be made to the Week2, Week3, and Week4 worksheets.)
Figure 5: Grouped Worksheets
Task 2: Format and Design the Week1, Week2, Week3, and Week4 Worksheets To format and design the weekly worksheets, you should: 1. Set row 1’s height to 30; set row 2’s height to 21, and set row 3’s row height to 26.
To set a row’s height, you can:
a. From the Format menu located on the Worksheet Menu Bar, select the Row command; then select the Height option.
2. Adjust column A’s width to 38. Adjust column R’s width to 16. To set a column’s
width, you can:
a. From the Format menu located on the Worksheet Menu Bar, select the Column command; then select the Width option.
3. In cell A1, enter the text “Timeka’s Tanning Salon”.
4. Select the cell range A1:R1. Click the Merge and Center button on the
Formatting toolbar. Set the font size to 26. Click the Bold button on the Formatting toolbar.
MIS Cases: Decision Making With Application Software, Second Edition Page 11
Screenshots © Microsoft Corporation. All rights reserved. Copyright © 2005 by Prentice-Hall, Inc., All rights reserved.
5. In cell A2, enter the text “Weekly Sales”. Set the font size to 16. Click the Bold
button on the Formatting toolbar.
6. Select the range A2:R2. Click the Merge and Center button on the Formatting toolbar.
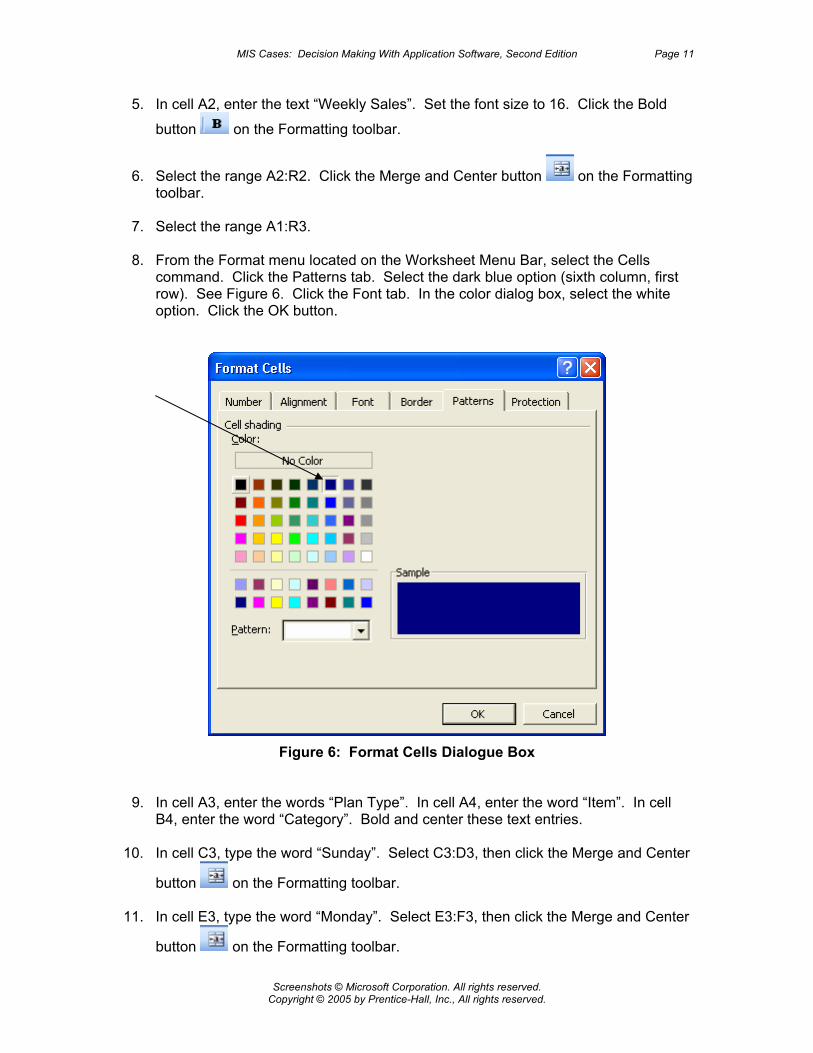
7. Select the range A1:R3. 8. From the Format menu located on the Worksheet Menu Bar, select the Cells
command. Click the Patterns tab. Select the dark blue option (sixth column, first row). See Figure 6. Click the Font tab. In the color dialog box, select the white option. Click the OK button.
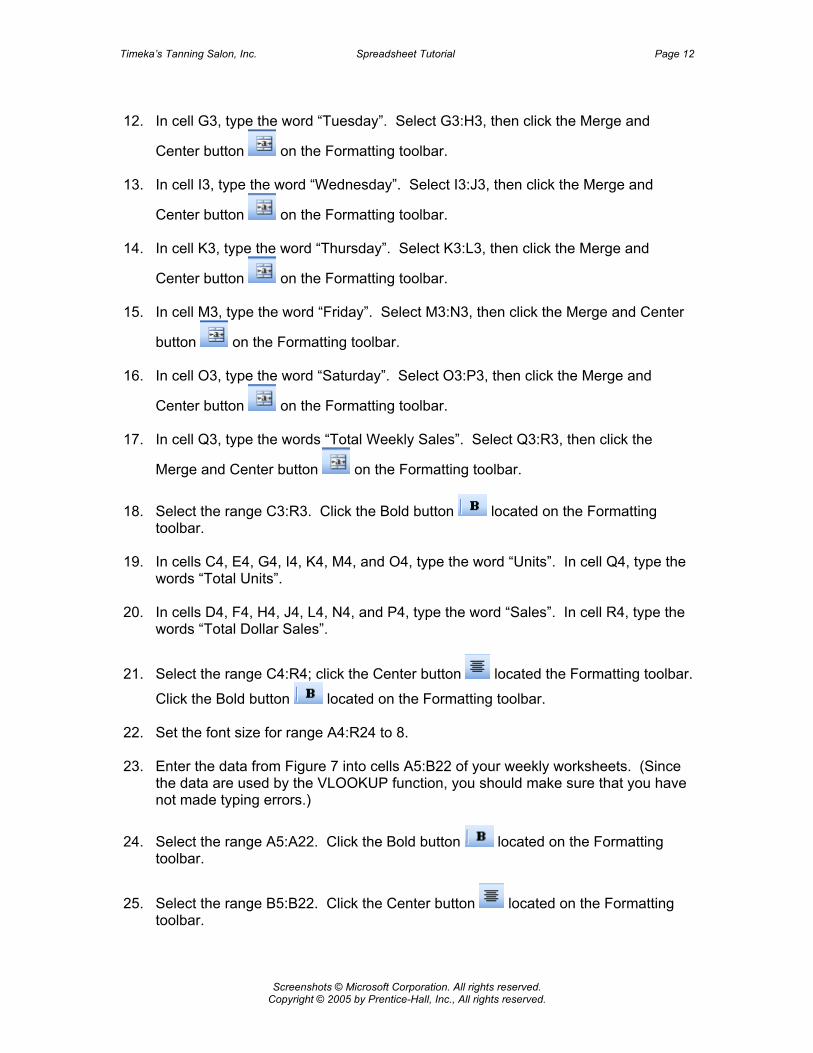
Figure 6: Format Cells Dialogue Box 9. In cell A3, enter the words “Plan Type”. In cell A4, enter the word “Item”. In cell
B4, enter the word “Category”. Bold and center these text entries. 10. In cell C3, type the word “Sunday”. Select C3:D3, then click the Merge and Center
button on the Formatting toolbar. 11. In cell E3, type the word “Monday”. Select E3:F3, then click the Merge and Center
button on the Formatting toolbar.
Timeka’s Tanning Salon, Inc. Spreadsheet Tutorial Page 12
Screenshots © Microsoft Corporation. All rights reserved. Copyright © 2005 by Prentice-Hall, Inc., All rights reserved.
12. In cell G3, type the word “Tuesday”. Select G3:H3, then click the Merge and
Center button on the Formatting toolbar. 13. In cell I3, type the word “Wednesday”. Select I3:J3, then click the Merge and
Center button on the Formatting toolbar. 14. In cell K3, type the word “Thursday”. Select K3:L3, then click the Merge and
Center button on the Formatting toolbar. 15. In cell M3, type the word “Friday”. Select M3:N3, then click the Merge and Center
button on the Formatting toolbar. 16. In cell O3, type the word “Saturday”. Select O3:P3, then click the Merge and
Center button on the Formatting toolbar. 17. In cell Q3, type the words “Total Weekly Sales”. Select Q3:R3, then click the
Merge and Center button on the Formatting toolbar.
18. Select the range C3:R3. Click the Bold button located on the Formatting toolbar.
19. In cells C4, E4, G4, I4, K4, M4, and O4, type the word “Units”. In cell Q4, type the
words “Total Units”. 20. In cells D4, F4, H4, J4, L4, N4, and P4, type the word “Sales”. In cell R4, type the
words “Total Dollar Sales”.
21. Select the range C4:R4; click the Center button located the Formatting toolbar.
Click the Bold button located on the Formatting toolbar. 22. Set the font size for range A4:R24 to 8. 23. Enter the data from Figure 7 into cells A5:B22 of your weekly worksheets. (Since
the data are used by the VLOOKUP function, you should make sure that you have not made typing errors.)
24. Select the range A5:A22. Click the Bold button located on the Formatting toolbar.
25. Select the range B5:B22. Click the Center button located on the Formatting toolbar.
MIS Cases: Decision Making With Application Software, Second Edition Page 13
Screenshots © Microsoft Corporation. All rights reserved. Copyright © 2005 by Prentice-Hall, Inc., All rights reserved.
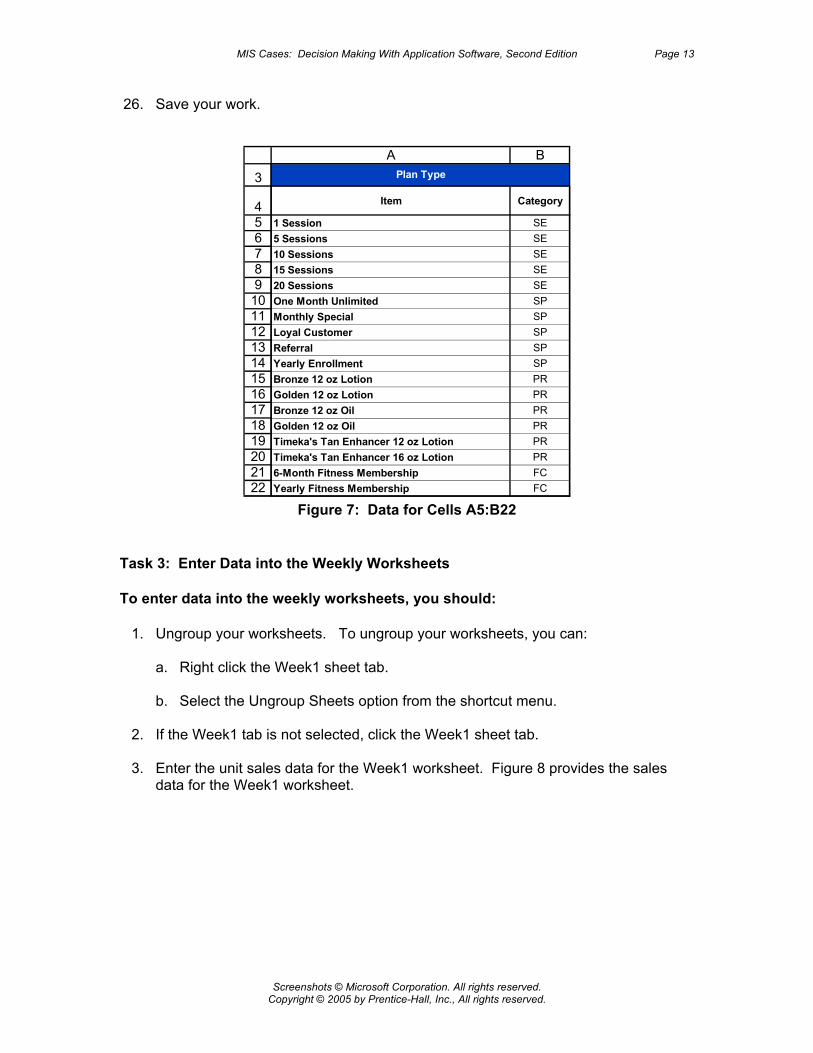
26. Save your work.
Figure 7: Data for Cells A5:B22
Task 3: Enter Data into the Weekly Worksheets To enter data into the weekly worksheets, you should: 1. Ungroup your worksheets. To ungroup your worksheets, you can:
a. Right click the Week1 sheet tab. b. Select the Ungroup Sheets option from the shortcut menu.
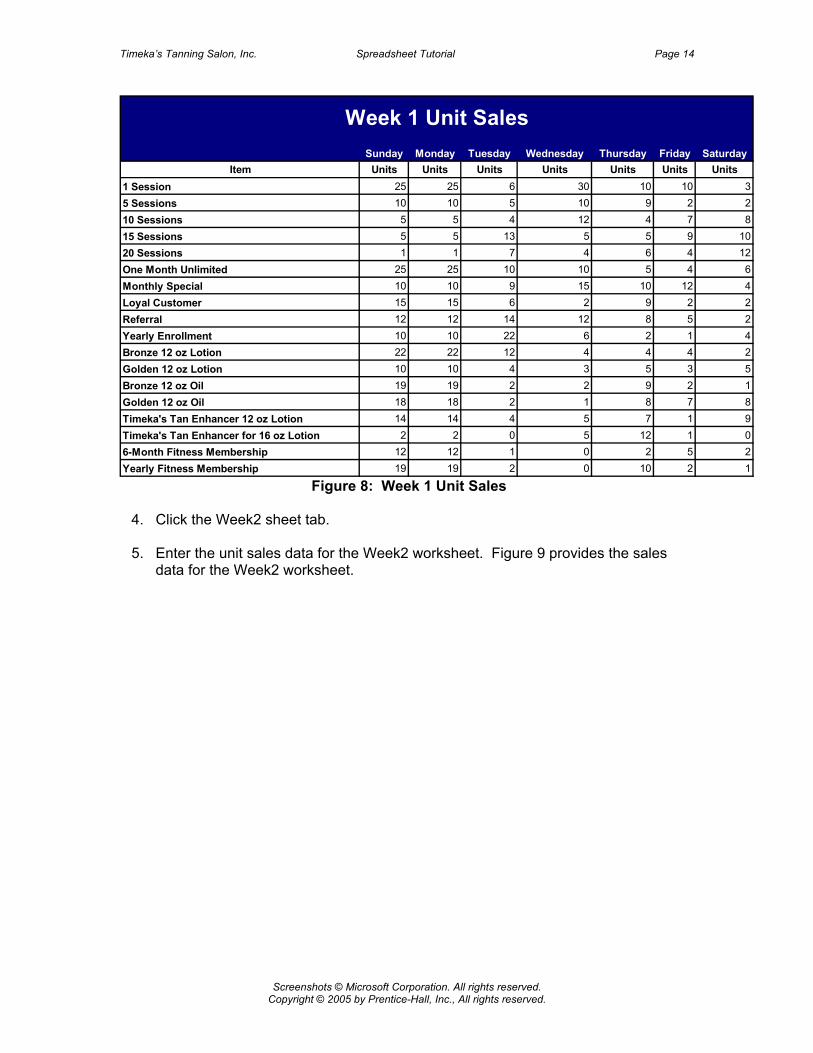
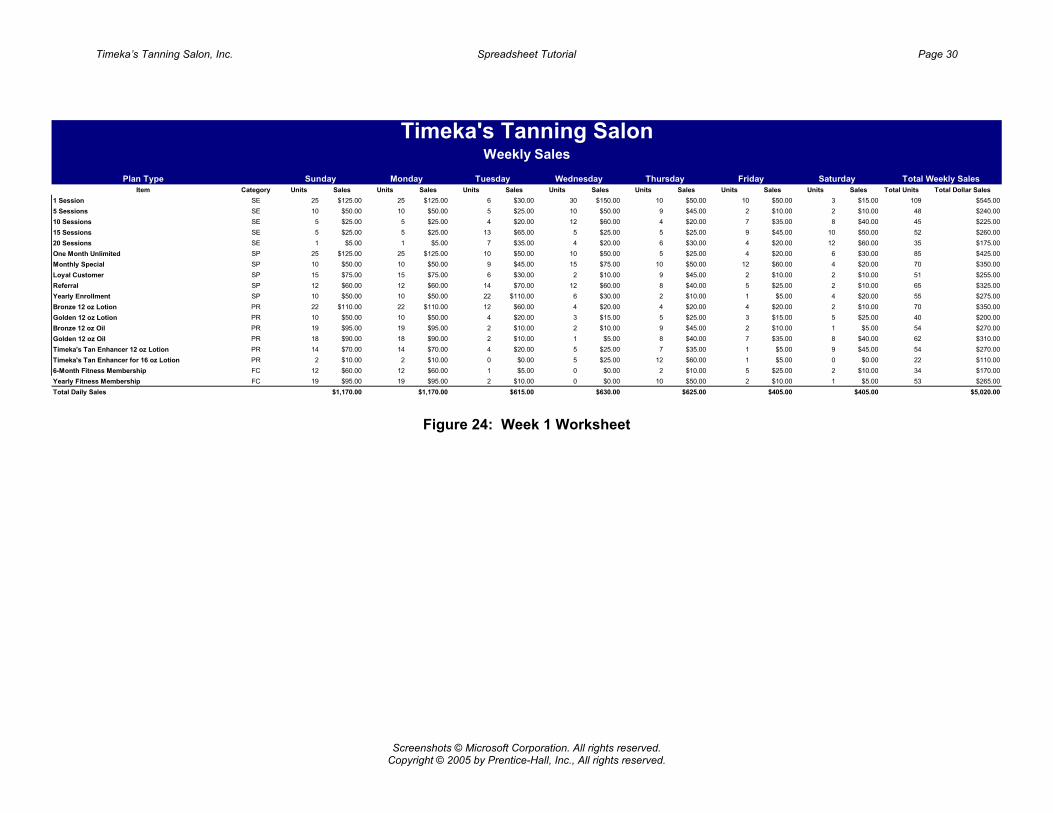
2. If the Week1 tab is not selected, click the Week1 sheet tab. 3. Enter the unit sales data for the Week1 worksheet. Figure 8 provides the sales
data for the Week1 worksheet.
3
456789
10111213141516171819202122
A B
Item Category
1 Session SE5 Sessions SE10 Sessions SE15 Sessions SE20 Sessions SEOne Month Unlimited SPMonthly Special SPLoyal Customer SPReferral SPYearly Enrollment SPBronze 12 oz Lotion PRGolden 12 oz Lotion PRBronze 12 oz Oil PRGolden 12 oz Oil PRTimeka's Tan Enhancer 12 oz Lotion PRTimeka's Tan Enhancer 16 oz Lotion PR6-Month Fitness Membership FCYearly Fitness Membership FC
Plan Type
Timeka’s Tanning Salon, Inc. Spreadsheet Tutorial Page 14
Screenshots © Microsoft Corporation. All rights reserved. Copyright © 2005 by Prentice-Hall, Inc., All rights reserved.
Sunday Monday Tuesday Wednesday Thursday Friday SaturdayItem Units Units Units Units Units Units Units
1 Session 25 25 6 30 10 10 35 Sessions 10 10 5 10 9 2 210 Sessions 5 5 4 12 4 7 815 Sessions 5 5 13 5 5 9 1020 Sessions 1 1 7 4 6 4 12One Month Unlimited 25 25 10 10 5 4 6Monthly Special 10 10 9 15 10 12 4Loyal Customer 15 15 6 2 9 2 2Referral 12 12 14 12 8 5 2Yearly Enrollment 10 10 22 6 2 1 4Bronze 12 oz Lotion 22 22 12 4 4 4 2Golden 12 oz Lotion 10 10 4 3 5 3 5Bronze 12 oz Oil 19 19 2 2 9 2 1Golden 12 oz Oil 18 18 2 1 8 7 8Timeka's Tan Enhancer 12 oz Lotion 14 14 4 5 7 1 9Timeka's Tan Enhancer for 16 oz Lotion 2 2 0 5 12 1 06-Month Fitness Membership 12 12 1 0 2 5 2Yearly Fitness Membership 19 19 2 0 10 2 1
Week 1 Unit Sales
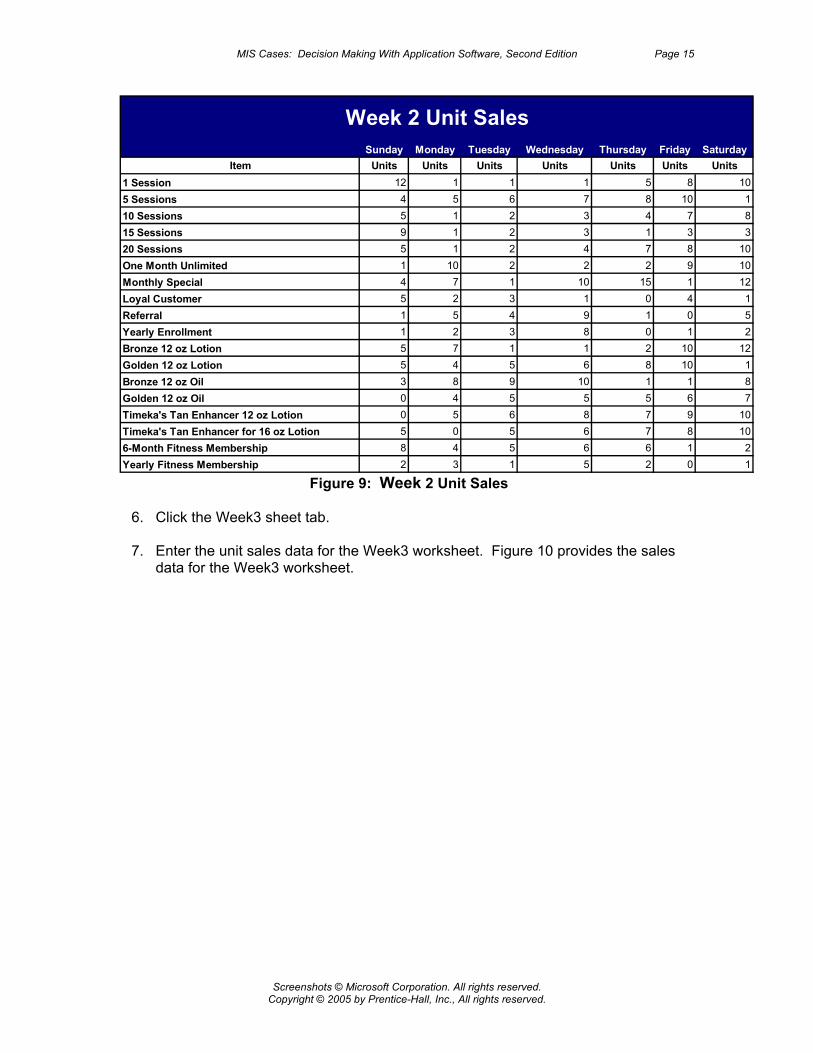
Figure 8: Week 1 Unit Sales 4. Click the Week2 sheet tab. 5. Enter the unit sales data for the Week2 worksheet. Figure 9 provides the sales
data for the Week2 worksheet.
MIS Cases: Decision Making With Application Software, Second Edition Page 15
Screenshots © Microsoft Corporation. All rights reserved. Copyright © 2005 by Prentice-Hall, Inc., All rights reserved.
Sunday Monday Tuesday Wednesday Thursday Friday SaturdayItem Units Units Units Units Units Units Units
1 Session 12 1 1 1 5 8 105 Sessions 4 5 6 7 8 10 110 Sessions 5 1 2 3 4 7 815 Sessions 9 1 2 3 1 3 320 Sessions 5 1 2 4 7 8 10One Month Unlimited 1 10 2 2 2 9 10Monthly Special 4 7 1 10 15 1 12Loyal Customer 5 2 3 1 0 4 1Referral 1 5 4 9 1 0 5Yearly Enrollment 1 2 3 8 0 1 2Bronze 12 oz Lotion 5 7 1 1 2 10 12Golden 12 oz Lotion 5 4 5 6 8 10 1Bronze 12 oz Oil 3 8 9 10 1 1 8Golden 12 oz Oil 0 4 5 5 5 6 7Timeka's Tan Enhancer 12 oz Lotion 0 5 6 8 7 9 10Timeka's Tan Enhancer for 16 oz Lotion 5 0 5 6 7 8 106-Month Fitness Membership 8 4 5 6 6 1 2Yearly Fitness Membership 2 3 1 5 2 0 1
Week 2 Unit Sales
Figure 9: Week 2 Unit Sales 6. Click the Week3 sheet tab. 7. Enter the unit sales data for the Week3 worksheet. Figure 10 provides the sales
data for the Week3 worksheet.

Timeka’s Tanning Salon, Inc. Spreadsheet Tutorial Page 16
Screenshots © Microsoft Corporation. All rights reserved. Copyright © 2005 by Prentice-Hall, Inc., All rights reserved.
Sunday Monday Tuesday Wednesday Thursday Friday SaturdayItem Units Units Units Units Units Units Units
1 Session 1 1 2 6 10 7 45 Sessions 3 2 0 7 2 5 410 Sessions 4 2 0 8 1 2 415 Sessions 7 2 0 2 2 2 620 Sessions 2 2 3 2 8 1 2One Month Unlimited 2 5 3 1 0 5 5Monthly Special 0 4 2 0 0 8 2Loyal Customer 0 3 8 0 9 9 10Referral 0 1 2 4 1 6 4Yearly Enrollment 0 3 2 5 2 2 2Bronze 12 oz Lotion 1 8 2 6 3 2 3Golden 12 oz Lotion 1 5 4 1 4 2 8Bronze 12 oz Oil 1 2 8 2 2 5 2Golden 12 oz Oil 0 2 6 6 9 5 7Timeka's Tan Enhancer 12 oz Lotion 0 0 7 4 2 1 2Timeka's Tan Enhancer for 16 oz Lotion 5 1 2 2 1 1 26-Month Fitness Membership 1 2 2 8 1 5 2Yearly Fitness Membership 1 2 1 1 1 4 2
Week 3 Unit Sales
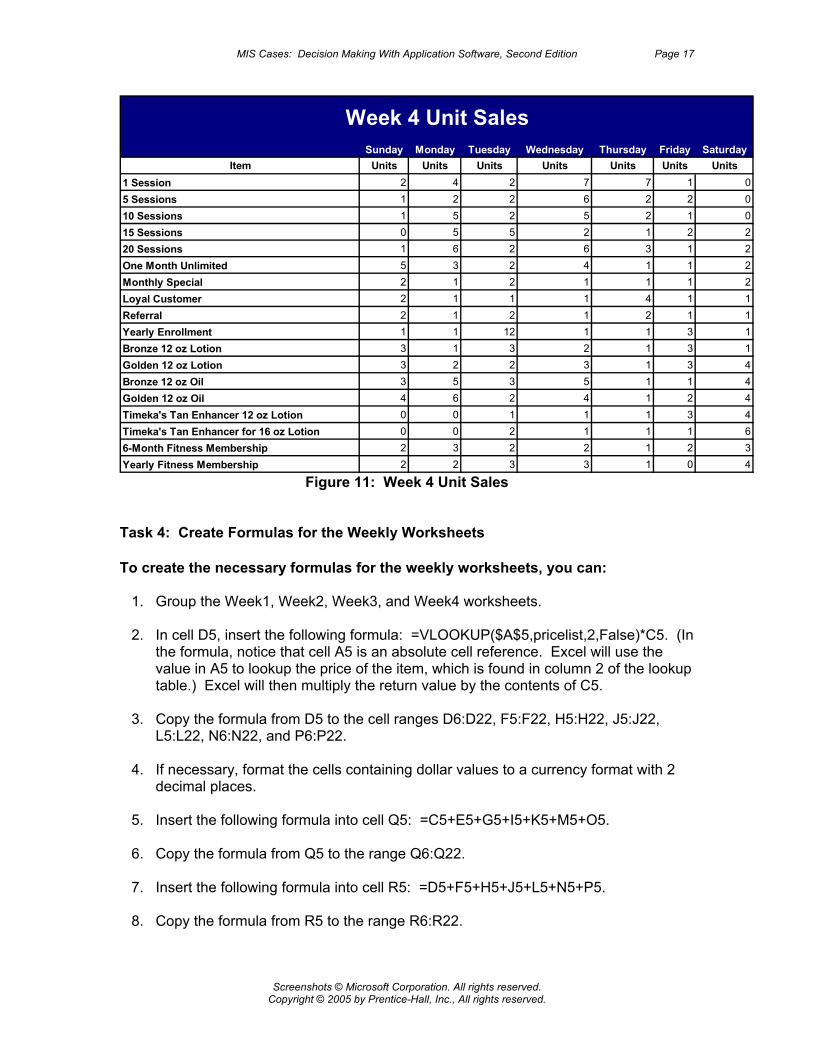
Figure 10: Week 3 Unit Sales 8. Click the Week4 sheet tab. 9. Enter the unit sales data for the Week4 worksheet. Figure 11 provides the sales
data for the Week4 worksheet.
MIS Cases: Decision Making With Application Software, Second Edition Page 17
Screenshots © Microsoft Corporation. All rights reserved. Copyright © 2005 by Prentice-Hall, Inc., All rights reserved.
Sunday Monday Tuesday Wednesday Thursday Friday SaturdayItem Units Units Units Units Units Units Units
1 Session 2 4 2 7 7 1 05 Sessions 1 2 2 6 2 2 010 Sessions 1 5 2 5 2 1 015 Sessions 0 5 5 2 1 2 220 Sessions 1 6 2 6 3 1 2One Month Unlimited 5 3 2 4 1 1 2Monthly Special 2 1 2 1 1 1 2Loyal Customer 2 1 1 1 4 1 1Referral 2 1 2 1 2 1 1Yearly Enrollment 1 1 12 1 1 3 1Bronze 12 oz Lotion 3 1 3 2 1 3 1Golden 12 oz Lotion 3 2 2 3 1 3 4Bronze 12 oz Oil 3 5 3 5 1 1 4Golden 12 oz Oil 4 6 2 4 1 2 4Timeka's Tan Enhancer 12 oz Lotion 0 0 1 1 1 3 4Timeka's Tan Enhancer for 16 oz Lotion 0 0 2 1 1 1 66-Month Fitness Membership 2 3 2 2 1 2 3Yearly Fitness Membership 2 2 3 3 1 0 4
Week 4 Unit Sales
Figure 11: Week 4 Unit Sales Task 4: Create Formulas for the Weekly Worksheets To create the necessary formulas for the weekly worksheets, you can: 1. Group the Week1, Week2, Week3, and Week4 worksheets. 2. In cell D5, insert the following formula: =VLOOKUP($A$5,pricelist,2,False)*C5. (In
the formula, notice that cell A5 is an absolute cell reference. Excel will use the value in A5 to lookup the price of the item, which is found in column 2 of the lookup table.) Excel will then multiply the return value by the contents of C5.
3. Copy the formula from D5 to the cell ranges D6:D22, F5:F22, H5:H22, J5:J22,
L5:L22, N6:N22, and P6:P22. 4. If necessary, format the cells containing dollar values to a currency format with 2
decimal places. 5. Insert the following formula into cell Q5: =C5+E5+G5+I5+K5+M5+O5. 6. Copy the formula from Q5 to the range Q6:Q22. 7. Insert the following formula into cell R5: =D5+F5+H5+J5+L5+N5+P5. 8. Copy the formula from R5 to the range R6:R22.
Timeka’s Tanning Salon, Inc. Spreadsheet Tutorial Page 18
Screenshots © Microsoft Corporation. All rights reserved. Copyright © 2005 by Prentice-Hall, Inc., All rights reserved.
9. Apply the currency format with two decimal places to the range R5:R22.
10. Make cell A23 your active cell. Click the bold button . Set the font size to 8. In cell A23, type “Total Daily Sales”.
11. Insert a formula that will sum the total dollar sales for each item. To sum the dollar
sales for each item, you can: a. Make D23 your active cell.
b. Click the AutoSum button located on the Standard toolbar. c. Make sure the cell range is correct. If it is, press the enter key. If it is not, then
edit the cell range. d. Repeat this process for cells F23, H23, J23, L23, N23, and P23. 12. In cell R23, include a grand total. To sum the dollar sales for each item, you can: a. Make R23 your active cell.
b. Click the AutoSum button located on the Standard toolbar. c. Make sure the cell range is correct. If it is, press the enter key. If it is not, then
edit the cell range. 13. If necessary, display the unit sales with a number format and no decimal points.
14. Select the range B23:R23. Click the Bold button located on the Formatting toolbar. Set the font size to 8.
15. Select the range Q5:R22. Set the font size to 8.
16. Select the range A22:R22. Click the arrow beside the Borders button on the Formatting toolbar. Select the bottom border option.
17. Ungroup the worksheets. 18. Save your work. Activity 4: Summary Worksheet Preparation The Summary worksheet consolidates the data contained in the four weekly worksheets. Preparation of the Summary worksheet involves formatting and designing the Summary worksheet and creating formulas with 3-D cell references.
MIS Cases: Decision Making With Application Software, Second Edition Page 19
Screenshots © Microsoft Corporation. All rights reserved. Copyright © 2005 by Prentice-Hall, Inc., All rights reserved.
Task 1: Format and Design the Summary Worksheet To format and design the Summary worksheet, perform the following steps. 1. Click the Summary sheet tab. 2. Set row 1’s height to 30; set row 2’s height to 20.25, and set row 3’s row height to
26. To set a row’s height, you can: a. From the Format menu located on the Worksheet Menu bar, select the Row
command; then select the Height option. 3. Adjust column A’s width to 38. Adjust column L’s width to 16. To set a column’s
width, you can: a. From the Format menu located on the Worksheet Menu bar, select the Column
command; then select the Width option. 4. In cell A1, enter “Timeka’s Tanning Salon”.
5. Select the cell range A1:L1. Click the merge and center button on the
Formatting toolbar. Set the font size to 26. Click the Bold button on the Formatting toolbar.
6. In cell A2, enter the text “Monthly Sales Summary”. (Enter the name of the current
month before the word monthly. If you prefer, you may use the month of October.) Set the font size to 16. Click the Bold button on the Formatting toolbar.
7. Select the range A2:L2. Click the merge and center button on the Formatting toolbar.
8. Select the range A1:L3. 9. From the Format menu located on the Worksheet Menu Bar, select the Cells
command. Click the Patterns tab. Select the dark blue option (sixth column, first row). See Figure 6. Click the Font tab. Set the font color for this range to white.
10. In cell A3, enter the words “Plan Type”. In cell A4, enter the text Item. In cell B4,
enter the word “Category”. Bold and center these text entries. 11. In cell C3, type the text “Week 1”. Select the range C3:D3, then click the Merge
and Center button on the Formatting toolbar. 12. In cell E3, type the text “Week 2”. Select the range E3:F3, then click the Merge
and Center button on the Formatting toolbar.
Timeka’s Tanning Salon, Inc. Spreadsheet Tutorial Page 20
Screenshots © Microsoft Corporation. All rights reserved. Copyright © 2005 by Prentice-Hall, Inc., All rights reserved.
13. In cell G3, type the text “Week 3”. Select the range G3:H3, then click the Merge
and Center button on the Formatting toolbar. 14. In cell I3, type “Week 4”. Select the range I3:J3, then click the Merge and Center
button on the Formatting toolbar. 15. In cell K3, type the text “Total Weekly Product Sales”. Select the range K3:L3,
then click the Merge and Center button on the Formatting toolbar.
16. Select the range C3:L3. Click the Bold button on the Formatting toolbar. 17. Click the Week1 sheet tab; copy the range C4:L4. 18. Click the Summary sheet tab; select the cell range C4:L4; click the Paste button
located on the Formatting toolbar. 19. Set the font size for cells A4 and B4 to 8. 20. Click the Week1 sheet tab; copy the range A5:B23.
21. Click the Summary sheet tab; click cell A5; click the Paste button located on the Formatting toolbar.
22. If necessary, select B5:B22 then click the Center button on the Formatting toolbar. 23. If necessary, select the cell range A5:L23. Set the font size for the range to 8. Task 2: Create Formulas for the Summary Worksheet To create formulas for the Summary worksheet, perform the following steps. 1. In cell C5, type the formula =SUM(Week1!Q5). Copy this formula to the cell range
C6:C22. In cell D5, type the formula =SUM(Week1!R5). Copy this formula to cell range D6:D22. In cell E5, type the formula =SUM(Week2!Q5). Copy this formula to cell range E6:E22. IN cell F5, type the formula =SUM(Week2!R5). Copy this formula to cell range F6:F22. In cell G5, type the formula =SUM(Week3!Q5). Copy this formula to cell range G6:G22. IN cell H5, type the formula =SUM(Week3!R5). Copy this formula to cell range H6:H22. In cell I5, type the formula =SUM(Week4!Q5). Copy this formula to cell range I6:I22. IN cell J5, type the formula =SUM(Week4!R5). Copy this formula to cell range J6:J22.
2. In cell K5, insert the formula =C5+E5+G5+I5. Copy this formula to the cell range
K6:K22. 3. In cell L5, insert the formula =D5+F5+H5+J5. Copy this formula to the cell range
L6:L22.
MIS Cases: Decision Making With Application Software, Second Edition Page 21
Screenshots © Microsoft Corporation. All rights reserved. Copyright © 2005 by Prentice-Hall, Inc., All rights reserved.
4. In cell D23, insert the formula =SUM(D5:D22). Copy this formula to cells F23,
H23, J23, and L23. 5. Bold the cell ranges D23:L23 and L5:L22. Apply the currency format with two
decimal places to these ranges.
6. Select the range A1:L23. Click the arrow beside the borders button on the Formatting toolbar. Select the Outside Borders option. (Note: Your button may have a different appearance. If so, click the arrow beside the borders button, and then select the Outside Borders option.)
7. Select the cell range A3:L3. Click the arrow beside the borders button on the Formatting toolbar. Select the Bottom Border option.
8. Select the cell range A22:L22. Click the arrow beside the borders button on the Formatting toolbar. Select the Bottom Border option.
9. Select the cell range A4:L4. Click the arrow beside the borders button on the Formatting toolbar. Select the Bottom Border option.
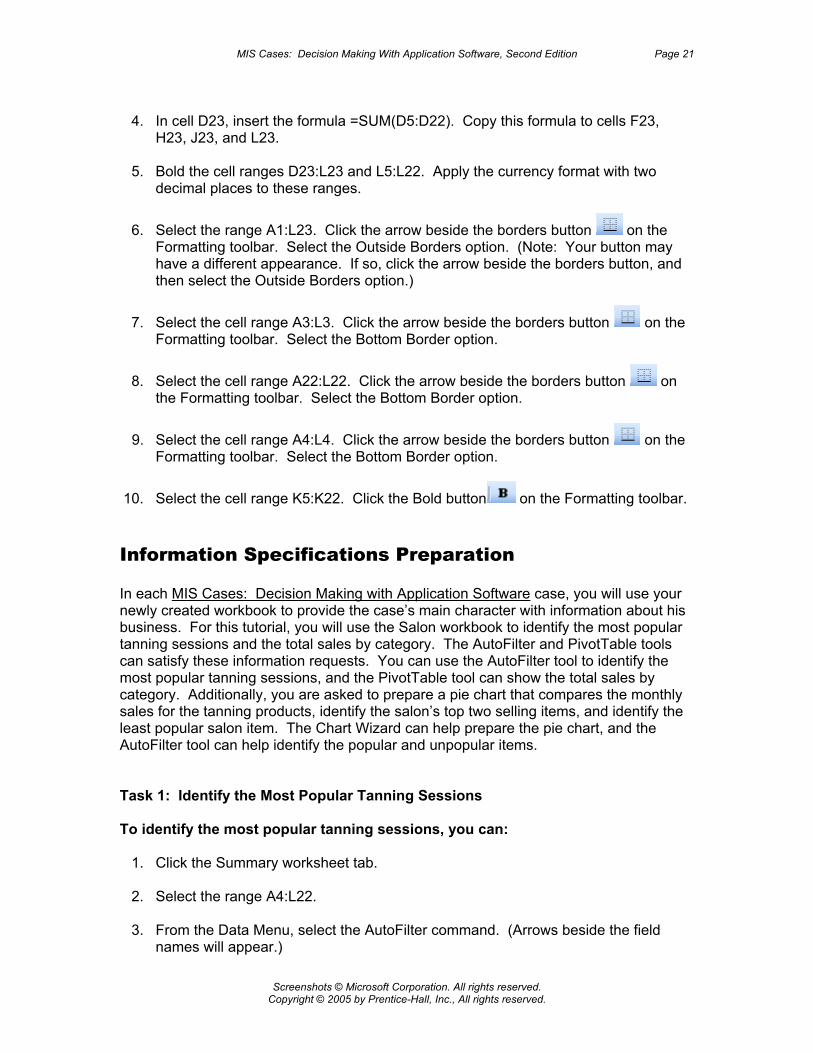
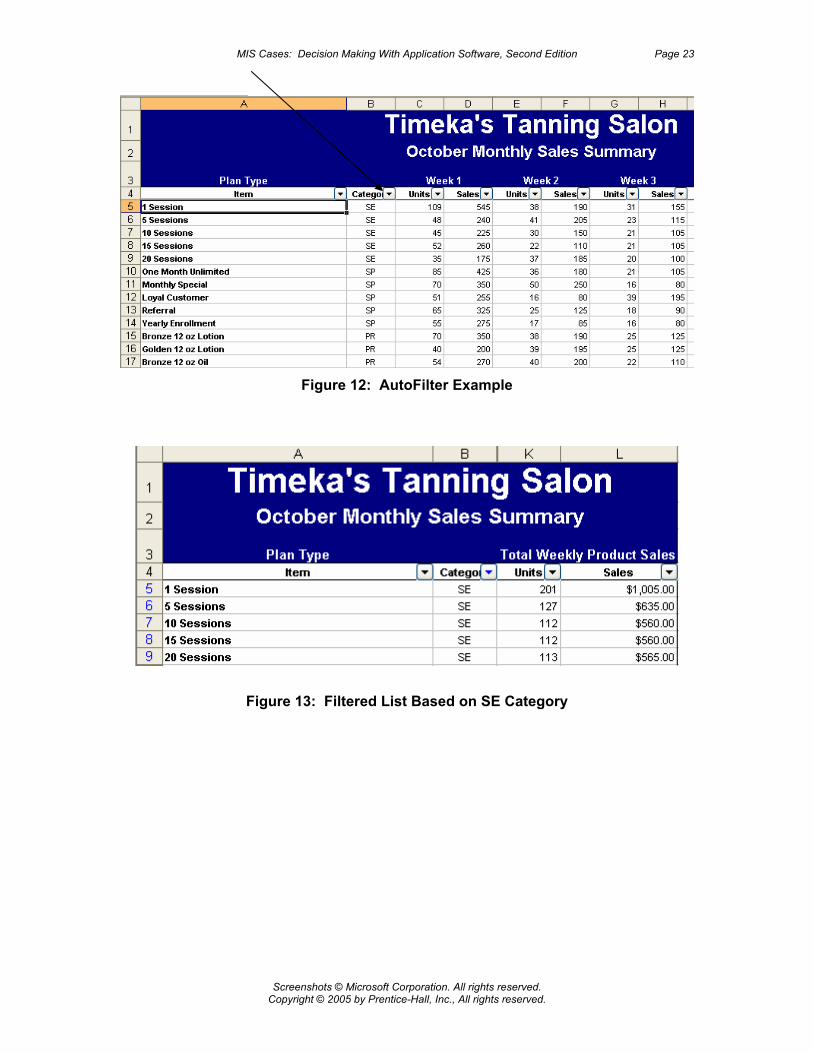
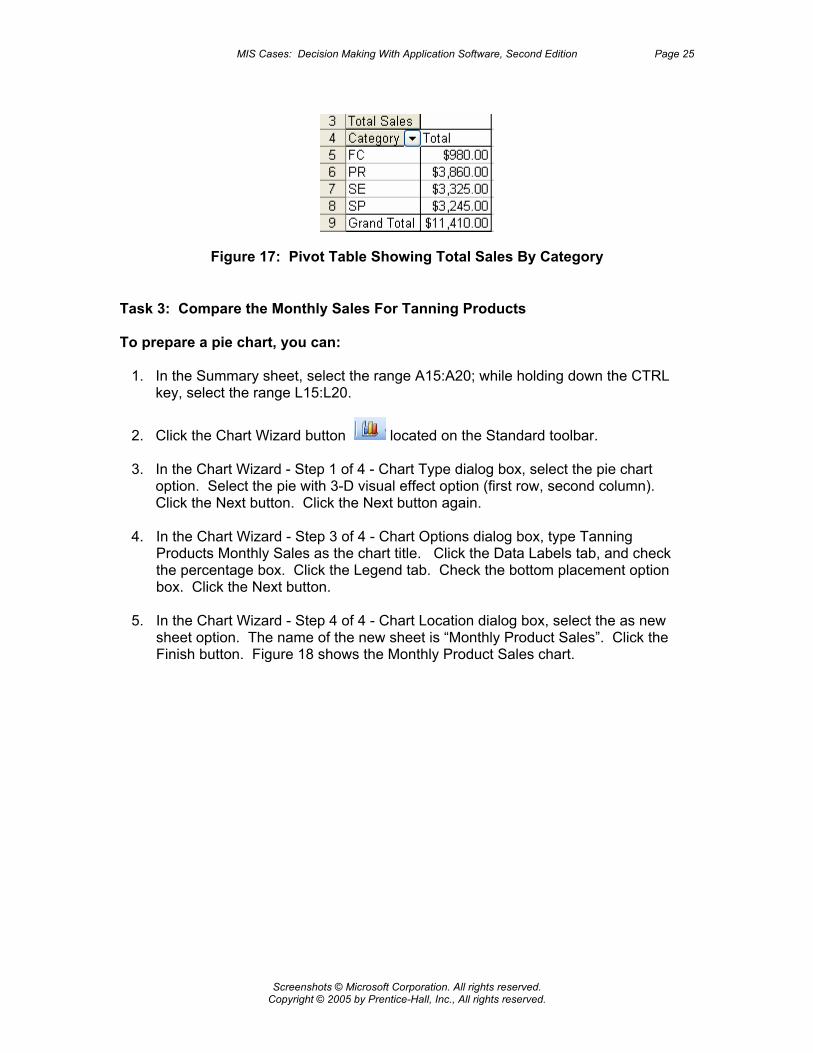
10. Select the cell range K5:K22. Click the Bold button on the Formatting toolbar. Information Specifications Preparation In each MIS Cases: Decision Making with Application Software case, you will use your newly created workbook to provide the case’s main character with information about his business. For this tutorial, you will use the Salon workbook to identify the most popular tanning sessions and the total sales by category. The AutoFilter and PivotTable tools can satisfy these information requests. You can use the AutoFilter tool to identify the most popular tanning sessions, and the PivotTable tool can show the total sales by category. Additionally, you are asked to prepare a pie chart that compares the monthly sales for the tanning products, identify the salon’s top two selling items, and identify the least popular salon item. The Chart Wizard can help prepare the pie chart, and the AutoFilter tool can help identify the popular and unpopular items. Task 1: Identify the Most Popular Tanning Sessions To identify the most popular tanning sessions, you can: 1. Click the Summary worksheet tab. 2. Select the range A4:L22. 3. From the Data Menu, select the AutoFilter command. (Arrows beside the field
names will appear.)
Timeka’s Tanning Salon, Inc. Spreadsheet Tutorial Page 22
Screenshots © Microsoft Corporation. All rights reserved. Copyright © 2005 by Prentice-Hall, Inc., All rights reserved.
4. Click the arrow beside the Category field name. See Figure 12. 5. Since Ms. Lorenzo wants to view the most popular tanning sessions, click the SE
option in the category list. The list is now filtered based on the SE option. Figure 13 shows the filtered results. (Although columns C through K are hidden in Figure 13, you do not need to hide your columns.)
6. From the Data menu, select the AutoFilter command. (This step turns off the
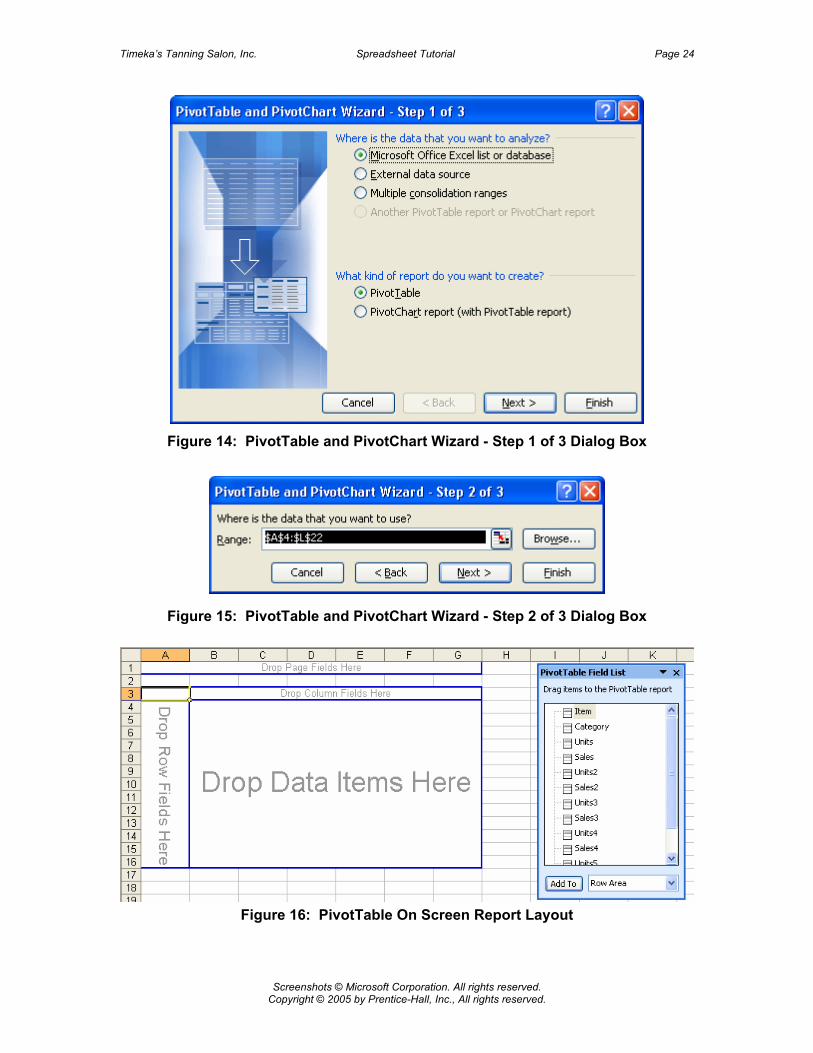
AutoFilter.) Task 2: Show Total Sales by Category To view the total monthly sales by category, you can use the PivotTable tool. To prepare a pivot table, you can: 1. In the Summary sheet, select the range A4:L22. 2. From the Data menu, select the PivotTable and PivotChart Report option. (The
PivotTable and PivotChart Wizard-Step 1 of 3 dialog box appears.) 3. Specify that your data are in an Excel List, and you want to create a PivotTable.
(See Figure 14.) Click the next button. 4. In the PivotTable and PivotChart Wizard-Step 2 of 3 dialog box, make sure that the
range is Summary!$A$4:$L$22. See Figure 15. Click the Finish button. 5. Specify the PivotTable’s layout. Figure 16 shows the pivot table’s on screen report
layout. (Keep in mind that you can also use the PivotTable Wizard to design the report.)
6. From the PivotTable Field List, drag the Category field name to the Drop Row
Fields Here area of the PivotTable layout. From the PivotTable Field List, drag the Sales5 field name to the Drop Data Items Here area of the layout template. Your report should look similar to Figure 17. In Figure 17, notice that the field name Sales5 has been changed to Total Sales, and the Total Sales values use a currency format with two decimal places. (The next step explains how to make these changes.)
7. In the PivotTable, right click on the Sum of Sales5 field name button. Select the
field settings option from the shortcut menu. The PivotTable Field Settings Dialog box now opens. In the Name box, type Total Sales. Next, click the Number button, select the currency format and set the number of decimal places to two. Click OK; Click OK.
8. Rename the sheet tab to CategorySales. 9. Save your work.
MIS Cases: Decision Making With Application Software, Second Edition Page 23
Screenshots © Microsoft Corporation. All rights reserved. Copyright © 2005 by Prentice-Hall, Inc., All rights reserved.
Figure 12: AutoFilter Example
Figure 13: Filtered List Based on SE Category
Timeka’s Tanning Salon, Inc. Spreadsheet Tutorial Page 24
Screenshots © Microsoft Corporation. All rights reserved. Copyright © 2005 by Prentice-Hall, Inc., All rights reserved.
Figure 14: PivotTable and PivotChart Wizard - Step 1 of 3 Dialog Box
Figure 15: PivotTable and PivotChart Wizard - Step 2 of 3 Dialog Box
Figure 16: PivotTable On Screen Report Layout
MIS Cases: Decision Making With Application Software, Second Edition Page 25
Screenshots © Microsoft Corporation. All rights reserved. Copyright © 2005 by Prentice-Hall, Inc., All rights reserved.
Figure 17: Pivot Table Showing Total Sales By Category
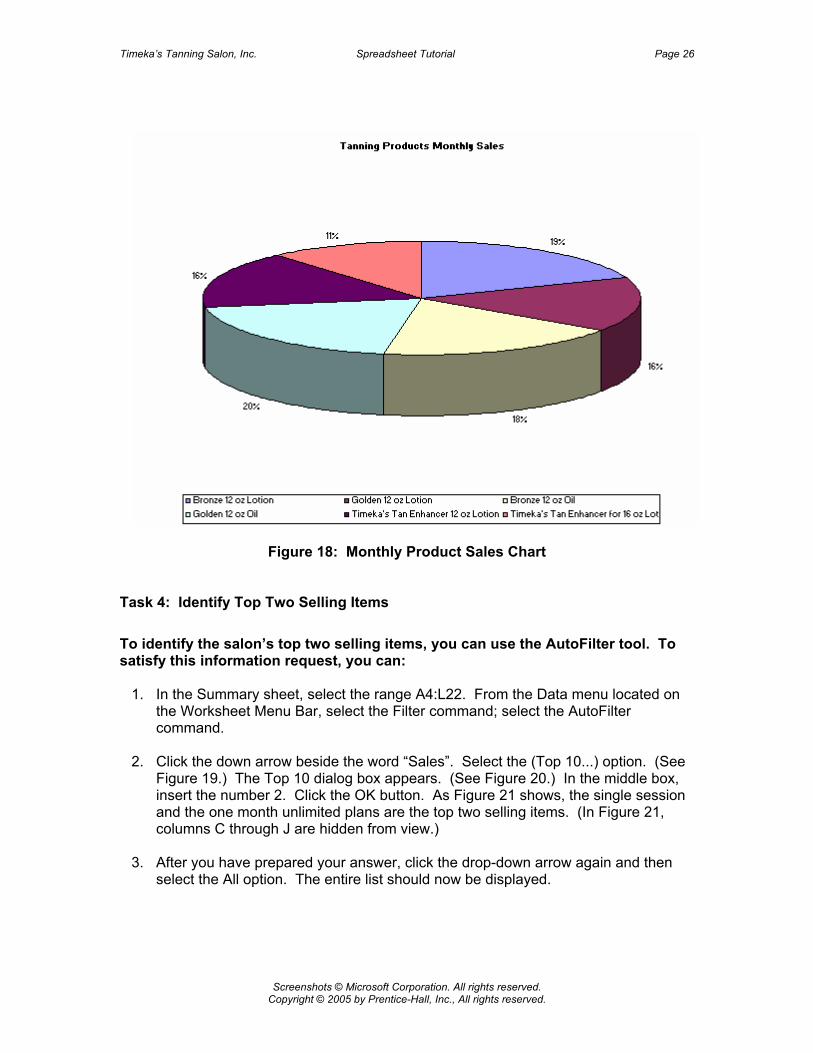
Task 3: Compare the Monthly Sales For Tanning Products To prepare a pie chart, you can: 1. In the Summary sheet, select the range A15:A20; while holding down the CTRL
key, select the range L15:L20.
2. Click the Chart Wizard button located on the Standard toolbar. 3. In the Chart Wizard - Step 1 of 4 - Chart Type dialog box, select the pie chart
option. Select the pie with 3-D visual effect option (first row, second column). Click the Next button. Click the Next button again.
4. In the Chart Wizard - Step 3 of 4 - Chart Options dialog box, type Tanning
Products Monthly Sales as the chart title. Click the Data Labels tab, and check the percentage box. Click the Legend tab. Check the bottom placement option box. Click the Next button.
5. In the Chart Wizard - Step 4 of 4 - Chart Location dialog box, select the as new
sheet option. The name of the new sheet is “Monthly Product Sales”. Click the Finish button. Figure 18 shows the Monthly Product Sales chart.
Timeka’s Tanning Salon, Inc. Spreadsheet Tutorial Page 26
Screenshots © Microsoft Corporation. All rights reserved. Copyright © 2005 by Prentice-Hall, Inc., All rights reserved.
Figure 18: Monthly Product Sales Chart
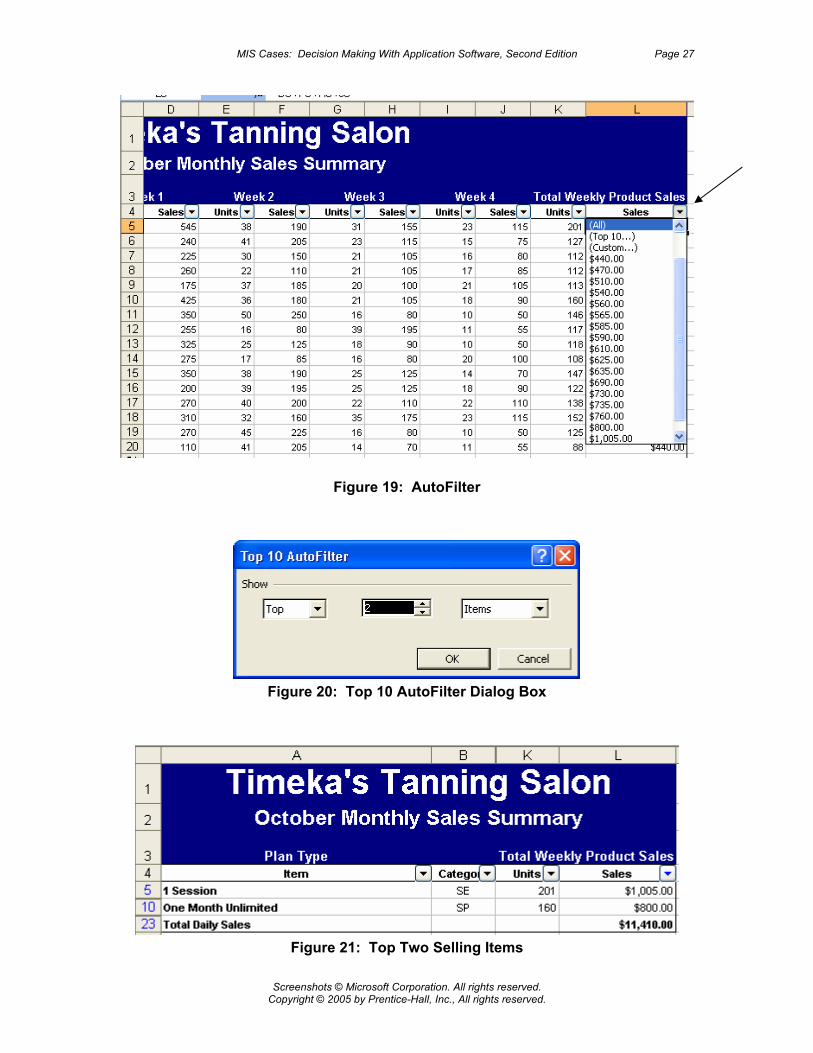
Task 4: Identify Top Two Selling Items To identify the salon’s top two selling items, you can use the AutoFilter tool. To satisfy this information request, you can: 1. In the Summary sheet, select the range A4:L22. From the Data menu located on
the Worksheet Menu Bar, select the Filter command; select the AutoFilter command.
2. Click the down arrow beside the word “Sales”. Select the (Top 10...) option. (See
Figure 19.) The Top 10 dialog box appears. (See Figure 20.) In the middle box, insert the number 2. Click the OK button. As Figure 21 shows, the single session and the one month unlimited plans are the top two selling items. (In Figure 21, columns C through J are hidden from view.)
3. After you have prepared your answer, click the drop-down arrow again and then
select the All option. The entire list should now be displayed.
MIS Cases: Decision Making With Application Software, Second Edition Page 27
Screenshots © Microsoft Corporation. All rights reserved. Copyright © 2005 by Prentice-Hall, Inc., All rights reserved.
Figure 19: AutoFilter
Figure 20: Top 10 AutoFilter Dialog Box
Figure 21: Top Two Selling Items
Timeka’s Tanning Salon, Inc. Spreadsheet Tutorial Page 28
Screenshots © Microsoft Corporation. All rights reserved. Copyright © 2005 by Prentice-Hall, Inc., All rights reserved.
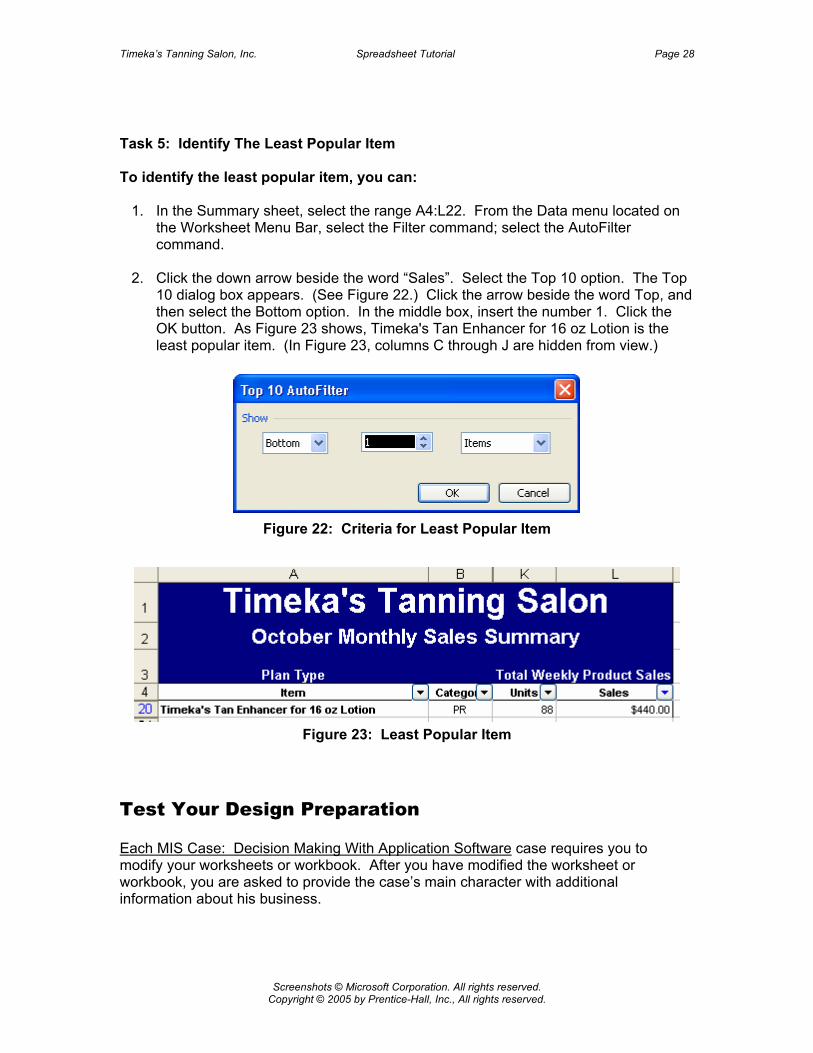
Task 5: Identify The Least Popular Item To identify the least popular item, you can: 1. In the Summary sheet, select the range A4:L22. From the Data menu located on
the Worksheet Menu Bar, select the Filter command; select the AutoFilter command.
2. Click the down arrow beside the word “Sales”. Select the Top 10 option. The Top
10 dialog box appears. (See Figure 22.) Click the arrow beside the word Top, and then select the Bottom option. In the middle box, insert the number 1. Click the OK button. As Figure 23 shows, Timeka's Tan Enhancer for 16 oz Lotion is the least popular item. (In Figure 23, columns C through J are hidden from view.)
Figure 22: Criteria for Least Popular Item
Figure 23: Least Popular Item Test Your Design Preparation Each MIS Case: Decision Making With Application Software case requires you to modify your worksheets or workbook. After you have modified the worksheet or workbook, you are asked to provide the case’s main character with additional information about his business.
MIS Cases: Decision Making With Application Software, Second Edition Page 29
Screenshots © Microsoft Corporation. All rights reserved. Copyright © 2005 by Prentice-Hall, Inc., All rights reserved.
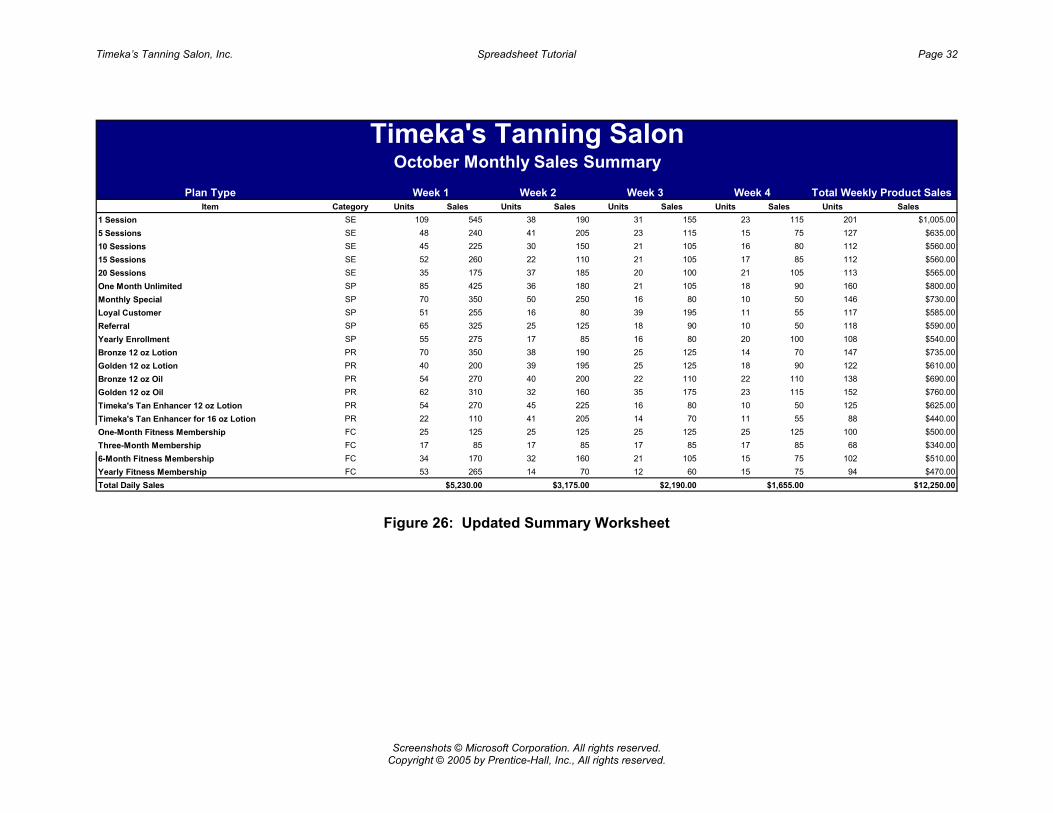
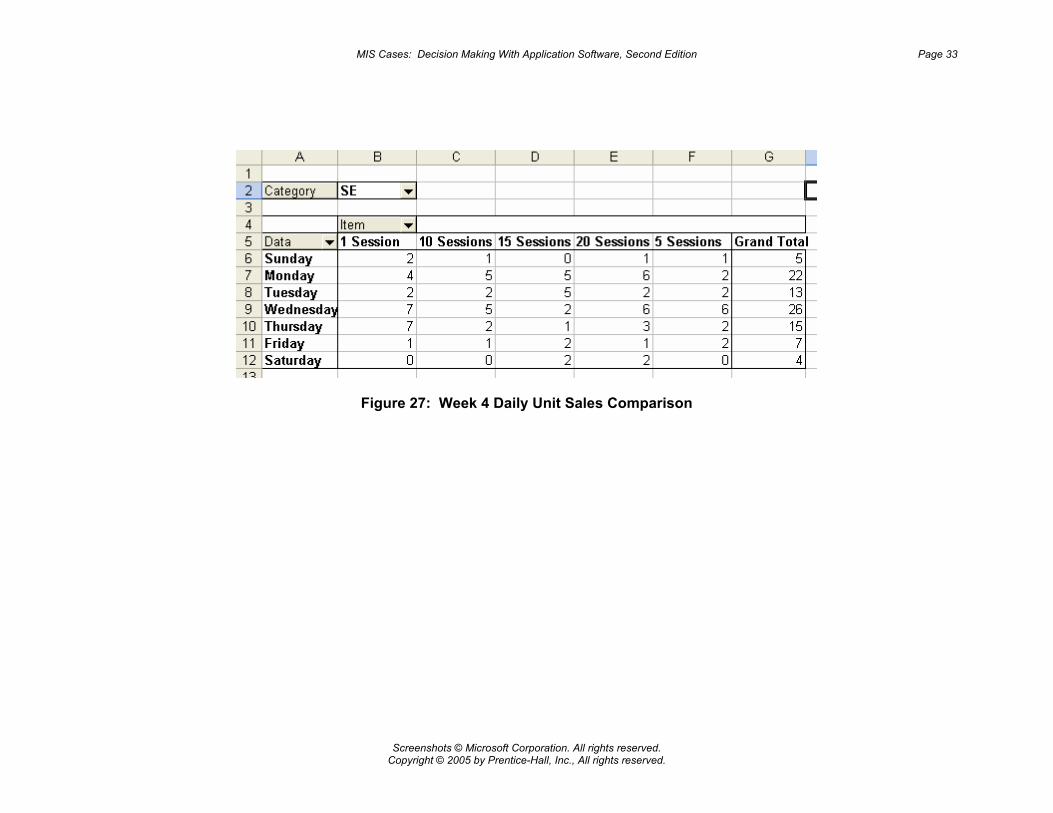
As the tutorial mentions, the salon now offers two new fitness packages. Table 1 provides the new fitness package data. To include this new fitness package information, you need to insert two new rows in the PriceList, Summary, Week1, Week2, Week3, and Week4 worksheets. Since you should be familiar with inserting rows and updating formulas, the process of inserting the two new rows is left as an exercise for you. However, in the PriceList worksheet, consider inserting the new rows between the current rows 18 and 19. For the Summary, Week1, Week2, Week3, and Week4 worksheets, consider inserting the new rows between the current rows 20 and 21. Figure 26 shows the updated Summary worksheet. The Test Your Design section also requires you to prepare a pivot table. The pivot table compares the daily item unit sales for Week 4. Figure 27 shows the pivot table. Case Deliverables Preparation For each MIS Cases: Decision Making with Application Software case, you will prepare several deliverables. Your instructor will specify which deliverables you are to prepare. The Test Your Design section often specifies that the workbook is to be modified and that new data are to be added. This request encourages you to prepare a flexible workbook that is adaptable to changing business needs. Since the Test Your Design section often alters the data in your newly created workbook, you should confirm with your instructor whether or not he wants the deliverables printed for the Information Specifications section before you complete the Test Your Design section or after the Test Your Design section is completed.
Timeka’s Tanning Salon, Inc. Spreadsheet Tutorial Page 30
Screenshots © Microsoft Corporation. All rights reserved. Copyright © 2005 by Prentice-Hall, Inc., All rights reserved.
Figure 24: Week 1 Worksheet
Plan TypeItem Category Units Sales Units Sales Units Sales Units Sales Units Sales Units Sales Units Sales Total Units Total Dollar Sales
1 Session SE 25 $125.00 25 $125.00 6 $30.00 30 $150.00 10 $50.00 10 $50.00 3 $15.00 109 $545.005 Sessions SE 10 $50.00 10 $50.00 5 $25.00 10 $50.00 9 $45.00 2 $10.00 2 $10.00 48 $240.0010 Sessions SE 5 $25.00 5 $25.00 4 $20.00 12 $60.00 4 $20.00 7 $35.00 8 $40.00 45 $225.0015 Sessions SE 5 $25.00 5 $25.00 13 $65.00 5 $25.00 5 $25.00 9 $45.00 10 $50.00 52 $260.0020 Sessions SE 1 $5.00 1 $5.00 7 $35.00 4 $20.00 6 $30.00 4 $20.00 12 $60.00 35 $175.00One Month Unlimited SP 25 $125.00 25 $125.00 10 $50.00 10 $50.00 5 $25.00 4 $20.00 6 $30.00 85 $425.00Monthly Special SP 10 $50.00 10 $50.00 9 $45.00 15 $75.00 10 $50.00 12 $60.00 4 $20.00 70 $350.00Loyal Customer SP 15 $75.00 15 $75.00 6 $30.00 2 $10.00 9 $45.00 2 $10.00 2 $10.00 51 $255.00Referral SP 12 $60.00 12 $60.00 14 $70.00 12 $60.00 8 $40.00 5 $25.00 2 $10.00 65 $325.00Yearly Enrollment SP 10 $50.00 10 $50.00 22 $110.00 6 $30.00 2 $10.00 1 $5.00 4 $20.00 55 $275.00Bronze 12 oz Lotion PR 22 $110.00 22 $110.00 12 $60.00 4 $20.00 4 $20.00 4 $20.00 2 $10.00 70 $350.00Golden 12 oz Lotion PR 10 $50.00 10 $50.00 4 $20.00 3 $15.00 5 $25.00 3 $15.00 5 $25.00 40 $200.00Bronze 12 oz Oil PR 19 $95.00 19 $95.00 2 $10.00 2 $10.00 9 $45.00 2 $10.00 1 $5.00 54 $270.00Golden 12 oz Oil PR 18 $90.00 18 $90.00 2 $10.00 1 $5.00 8 $40.00 7 $35.00 8 $40.00 62 $310.00Timeka's Tan Enhancer 12 oz Lotion PR 14 $70.00 14 $70.00 4 $20.00 5 $25.00 7 $35.00 1 $5.00 9 $45.00 54 $270.00Timeka's Tan Enhancer for 16 oz Lotion PR 2 $10.00 2 $10.00 0 $0.00 5 $25.00 12 $60.00 1 $5.00 0 $0.00 22 $110.006-Month Fitness Membership FC 12 $60.00 12 $60.00 1 $5.00 0 $0.00 2 $10.00 5 $25.00 2 $10.00 34 $170.00Yearly Fitness Membership FC 19 $95.00 19 $95.00 2 $10.00 0 $0.00 10 $50.00 2 $10.00 1 $5.00 53 $265.00Total Daily Sales $1,170.00 $1,170.00 $615.00 $630.00 $625.00 $405.00 $405.00 $5,020.00
Timeka's Tanning SalonWeekly Sales
Sunday Monday Tuesday Wednesday Thursday Friday Saturday Total Weekly Sales
MIS Cases: Decision Making With Application Software, Second Edition Page 31
Screenshots © Microsoft Corporation. All rights reserved. Copyright © 2005 by Prentice-Hall, Inc., All rights reserved.
Figure 25: Summary Worksheet
Plan TypeItem Category Units Sales Units Sales Units Sales Units Sales Units Sales
1 Session SE 109 545 38 190 31 155 23 115 201 $1,005.005 Sessions SE 48 240 41 205 23 115 15 75 127 $635.0010 Sessions SE 45 225 30 150 21 105 16 80 112 $560.0015 Sessions SE 52 260 22 110 21 105 17 85 112 $560.0020 Sessions SE 35 175 37 185 20 100 21 105 113 $565.00One Month Unlimited SP 85 425 36 180 21 105 18 90 160 $800.00Monthly Special SP 70 350 50 250 16 80 10 50 146 $730.00Loyal Customer SP 51 255 16 80 39 195 11 55 117 $585.00Referral SP 65 325 25 125 18 90 10 50 118 $590.00Yearly Enrollment SP 55 275 17 85 16 80 20 100 108 $540.00Bronze 12 oz Lotion PR 70 350 38 190 25 125 14 70 147 $735.00Golden 12 oz Lotion PR 40 200 39 195 25 125 18 90 122 $610.00Bronze 12 oz Oil PR 54 270 40 200 22 110 22 110 138 $690.00Golden 12 oz Oil PR 62 310 32 160 35 175 23 115 152 $760.00Timeka's Tan Enhancer 12 oz Lotion PR 54 270 45 225 16 80 10 50 125 $625.00Timeka's Tan Enhancer for 16 oz Lotion PR 22 110 41 205 14 70 11 55 88 $440.006-Month Fitness Membership FC 34 170 32 160 21 105 15 75 102 $510.00Yearly Fitness Membership FC 53 265 14 70 12 60 15 75 94 $470.00Total Daily Sales $5,020.00 $2,965.00 $1,980.00 $1,445.00 $11,410.00
Timeka's Tanning SalonOctober Monthly Sales Summary
Week 1 Week 2 Week 3 Week 4 Total Weekly Product Sales
Timeka’s Tanning Salon, Inc. Spreadsheet Tutorial Page 32
Screenshots © Microsoft Corporation. All rights reserved. Copyright © 2005 by Prentice-Hall, Inc., All rights reserved.
Figure 26: Updated Summary Worksheet
Plan TypeItem Category Units Sales Units Sales Units Sales Units Sales Units Sales
1 Session SE 109 545 38 190 31 155 23 115 201 $1,005.005 Sessions SE 48 240 41 205 23 115 15 75 127 $635.0010 Sessions SE 45 225 30 150 21 105 16 80 112 $560.0015 Sessions SE 52 260 22 110 21 105 17 85 112 $560.0020 Sessions SE 35 175 37 185 20 100 21 105 113 $565.00One Month Unlimited SP 85 425 36 180 21 105 18 90 160 $800.00Monthly Special SP 70 350 50 250 16 80 10 50 146 $730.00Loyal Customer SP 51 255 16 80 39 195 11 55 117 $585.00Referral SP 65 325 25 125 18 90 10 50 118 $590.00Yearly Enrollment SP 55 275 17 85 16 80 20 100 108 $540.00Bronze 12 oz Lotion PR 70 350 38 190 25 125 14 70 147 $735.00Golden 12 oz Lotion PR 40 200 39 195 25 125 18 90 122 $610.00Bronze 12 oz Oil PR 54 270 40 200 22 110 22 110 138 $690.00Golden 12 oz Oil PR 62 310 32 160 35 175 23 115 152 $760.00Timeka's Tan Enhancer 12 oz Lotion PR 54 270 45 225 16 80 10 50 125 $625.00Timeka's Tan Enhancer for 16 oz Lotion PR 22 110 41 205 14 70 11 55 88 $440.00One-Month Fitness Membership FC 25 125 25 125 25 125 25 125 100 $500.00Three-Month Membership FC 17 85 17 85 17 85 17 85 68 $340.006-Month Fitness Membership FC 34 170 32 160 21 105 15 75 102 $510.00Yearly Fitness Membership FC 53 265 14 70 12 60 15 75 94 $470.00Total Daily Sales $5,230.00 $3,175.00 $2,190.00 $1,655.00 $12,250.00
Timeka's Tanning SalonOctober Monthly Sales Summary
Week 1 Week 2 Week 3 Week 4 Total Weekly Product Sales
MIS Cases: Decision Making With Application Software, Second Edition Page 33
Screenshots © Microsoft Corporation. All rights reserved. Copyright © 2005 by Prentice-Hall, Inc., All rights reserved.
Figure 27: Week 4 Daily Unit Sales Comparison