Embed Size (px)
Citation preview

page 263 #1ab, 2, 5, 7, 10b, 13, 16
Times Midpoint, mi Frequency, fi mifi cumulative freq4-5 4.5 32 144 325-6 5.5 50 275 826-7 6.5 125 812.5 2077-8 7.5 67 502.5 2748-9 8.5 108 918 382
Median:
13)
6.2February-19-152:39 PM
MDM4U Page 1

Ch 6.2 - Measures of Spread
variability: how samples differ from each other; more similar samples mean lower variability, which is a better representation of the population
percentile: the percent of all the data that are less than or equal to a specific data value
The median is also called the 50th percentile. Why?50% of the data values are less than or equal to the median (and 50% are greater or equal)
Percentile Rank:
p is the percentile, n is the size of the population, R is the whole number rank of the data point (round down if necessary)
Percentile:
MDM4U Page 2
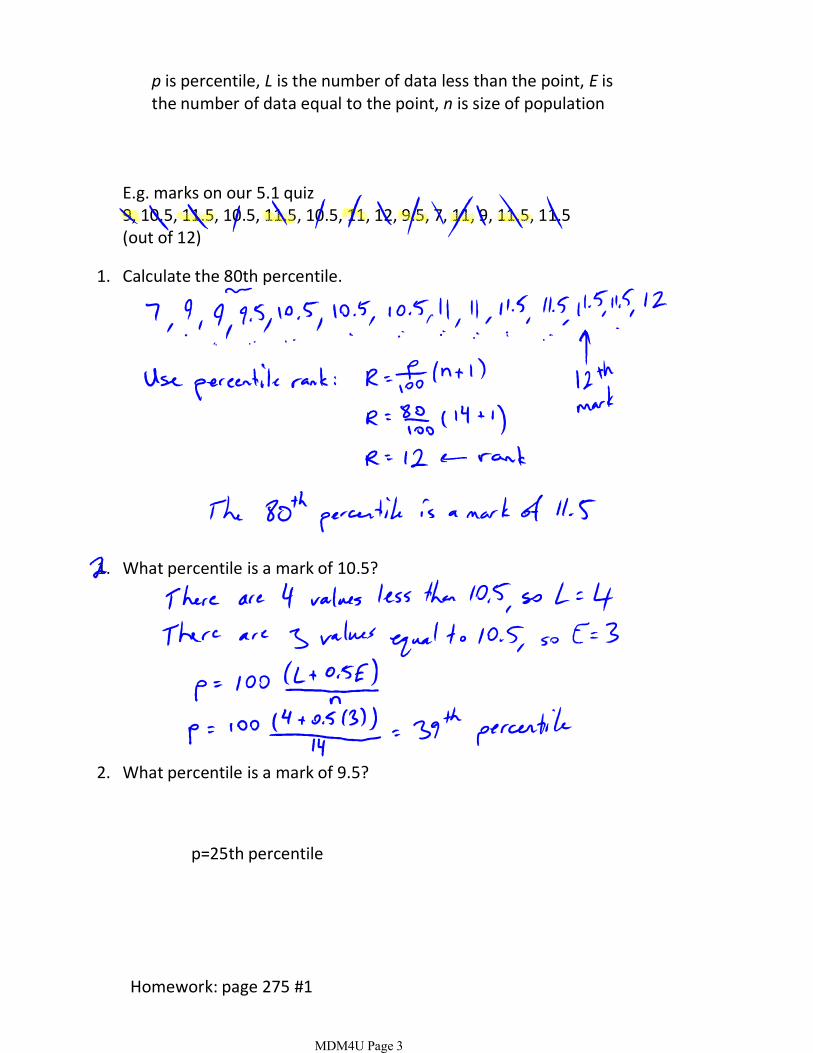
p is percentile, L is the number of data less than the point, E is the number of data equal to the point, n is size of population
E.g. marks on our 5.1 quiz9, 10.5, 11.5, 10.5, 11.5, 10.5, 11, 12, 9.5, 7, 11, 9, 11.5, 11.5(out of 12)
1. Calculate the 80th percentile.
1. What percentile is a mark of 10.5?
2. What percentile is a mark of 9.5?
Homework: page 275 #1
p=25th percentile
MDM4U Page 3

quartiles: three points that divide the data set into four equal groups
• first quartile (Q1) is the _______ percentile• second quartile (Q2) is the _________, the ________ percentile• third quartile (Q3) is the ________ percentile
interquartile range: the difference between the first and third quartiles (IQR = Q3 - Q1)https://www.mathsisfun.com/data/quartiles.htmlNOTE: see page 269 for box and whisker plots
E.g.For the following data set, determine the median, range, first and third quartiles, and interquartile range
Golf Score Frequency Cumulative Frequency70–75 1 175–80 2 380–85 8 1185–90 4 1590–95 2 1795–100 5 22100–105 3 25
median
range
first quartile
MDM4U Page 4
third quartile
IQR
outlier: a piece of data that is more than 1.5 times the IQR below Q1 or above Q3in the above example,
HW: page 275 #1, 3, 5, 9
MDM4U Page 5