Embed Size (px)
Citation preview
Tin Kam Ho Bell Laboratories
Lucent Technologies
Outlines
• Classifier Combination:– Motivation, methods, difficulties
• Data Complexity Analysis:– Motivation, methods, early results
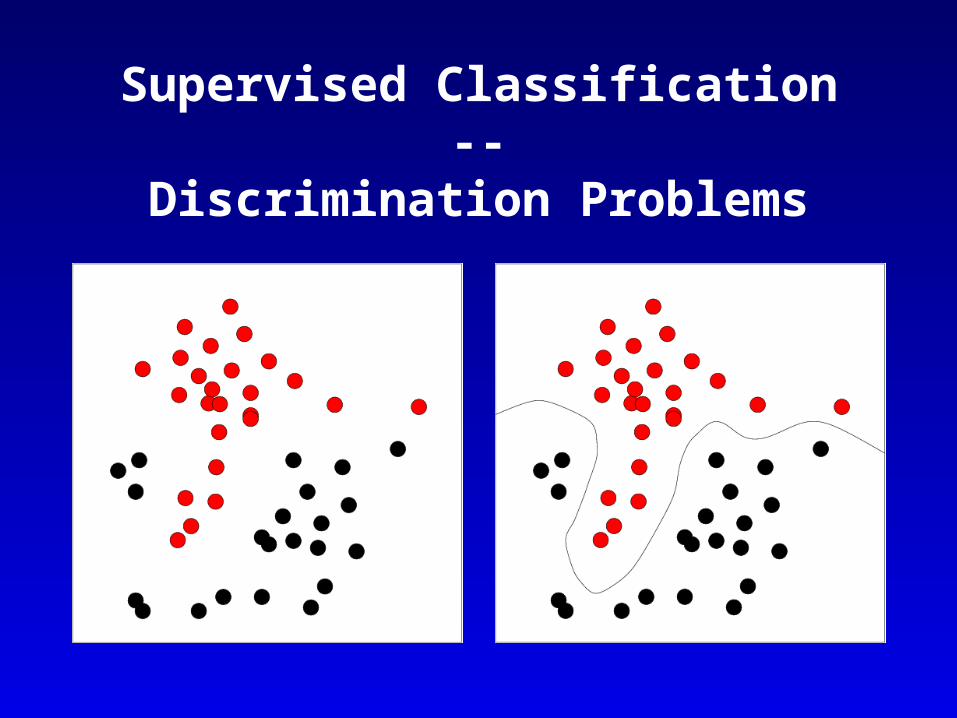
Supervised Classification --Discrimination Problems
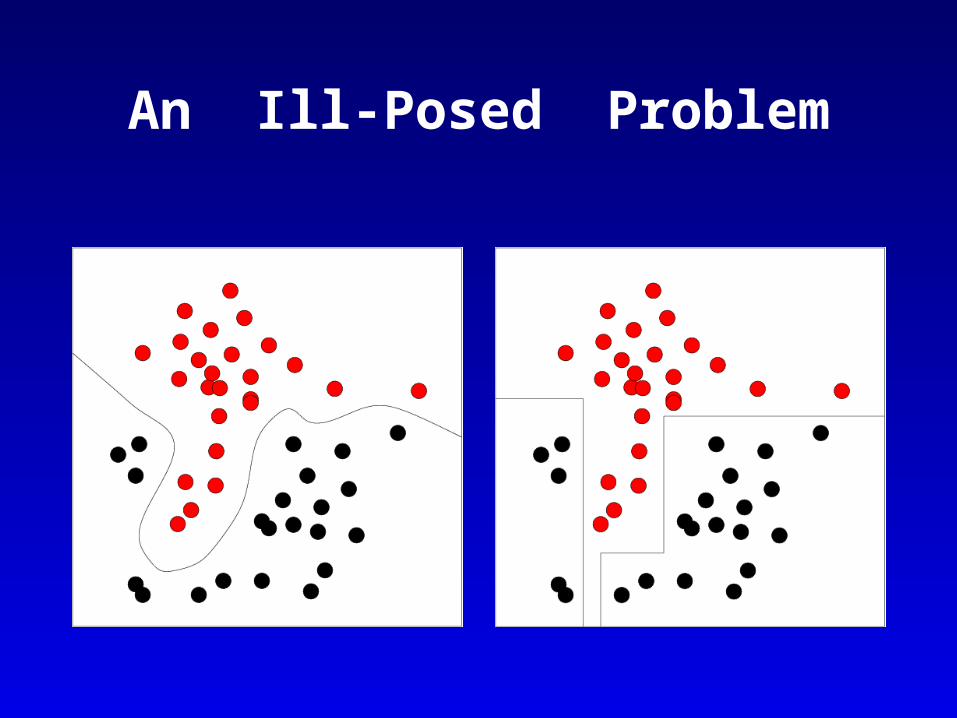
An Ill-Posed Problem
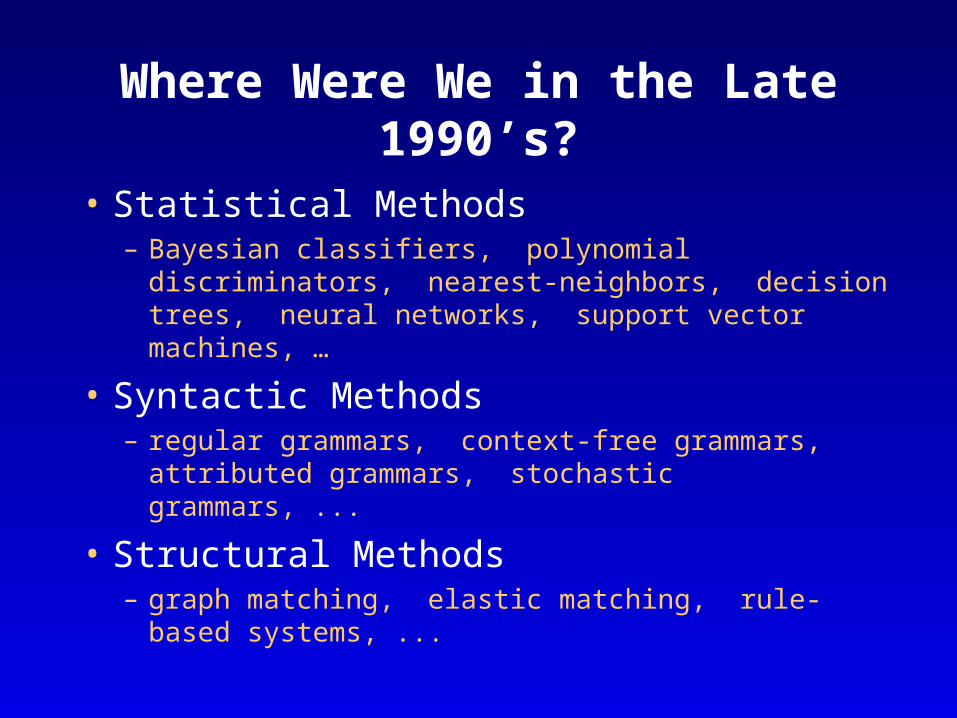
Where Were We in the Late 1990’s?
• Statistical Methods– Bayesian classifiers, polynomial discriminators, nearest-
neighbors, decision trees, neural networks, support vector machines, …
• Syntactic Methods– regular grammars, context-free grammars, attributed
grammars, stochastic grammars, ...
• Structural Methods– graph matching, elastic matching, rule-based systems, ...
Classifiers
• Competition among different …– choices of features– feature representations– classifier designs
• Chosen by heuristic judgements
• No clear winners
Classifier Combination Methods
• Decision optimization methods– find consensus from a given set of classifiers– majority/plurality vote, sum/product rule– probability models, Bayesian approaches– logistic regression on ranks or scores– classifiers trained on confidence scores
Classifier Combination Methods
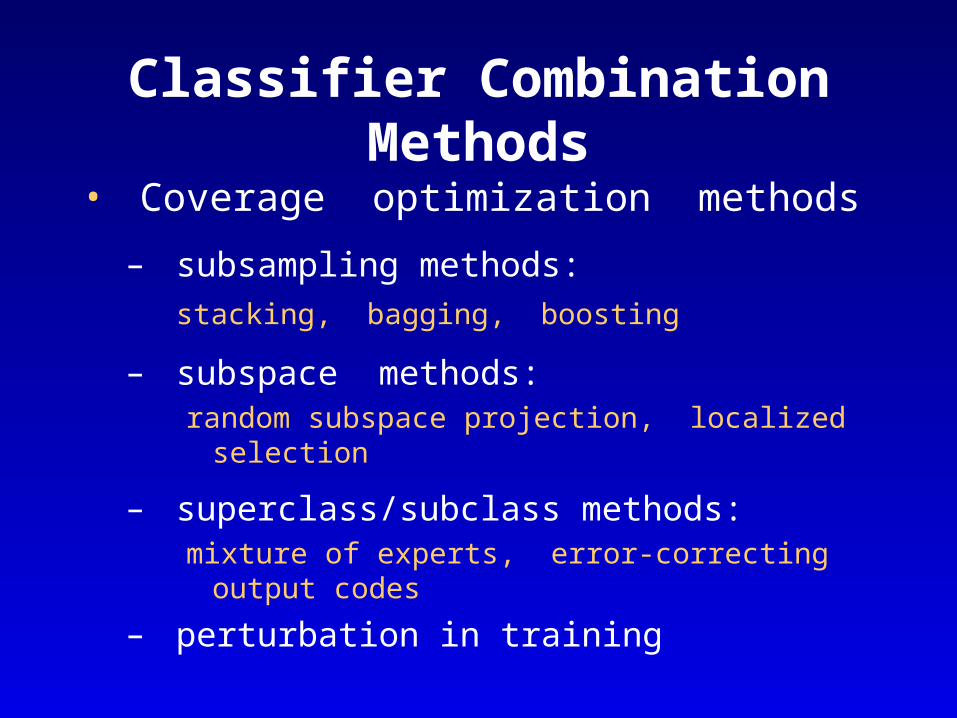
• Coverage optimization methods
– subsampling methods:
stacking, bagging, boosting
– subspace methods: random subspace projection, localized selection
– superclass/subclass methods: mixture of experts, error-correcting output codes
– perturbation in training
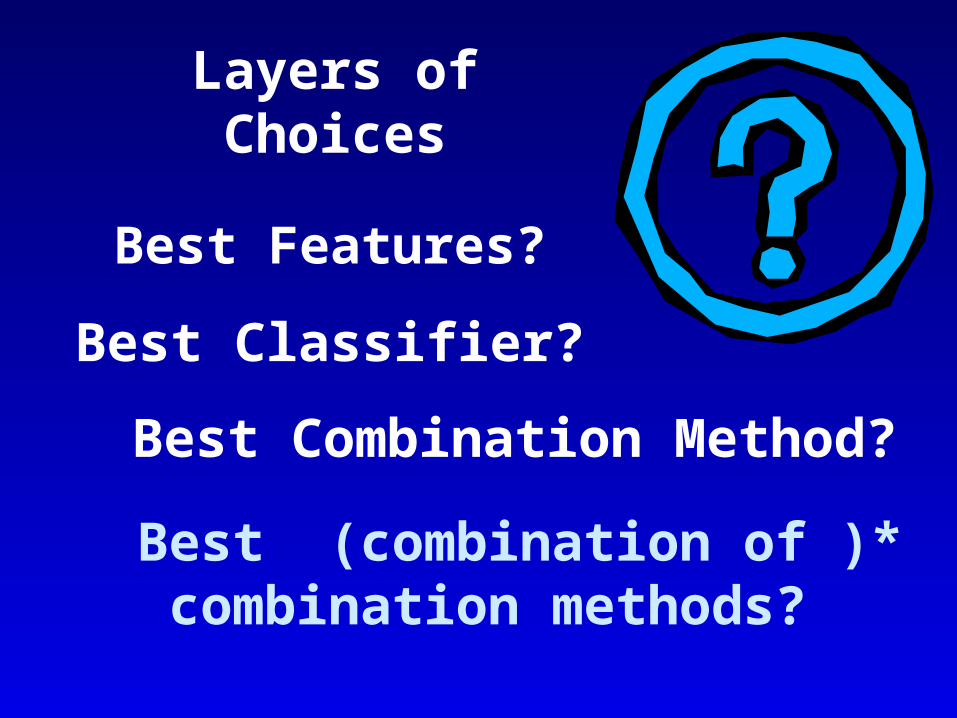
Layers of Choices
Best Features?
Best Classifier?
Best Combination Method?
Best (combination of )* combination methods?
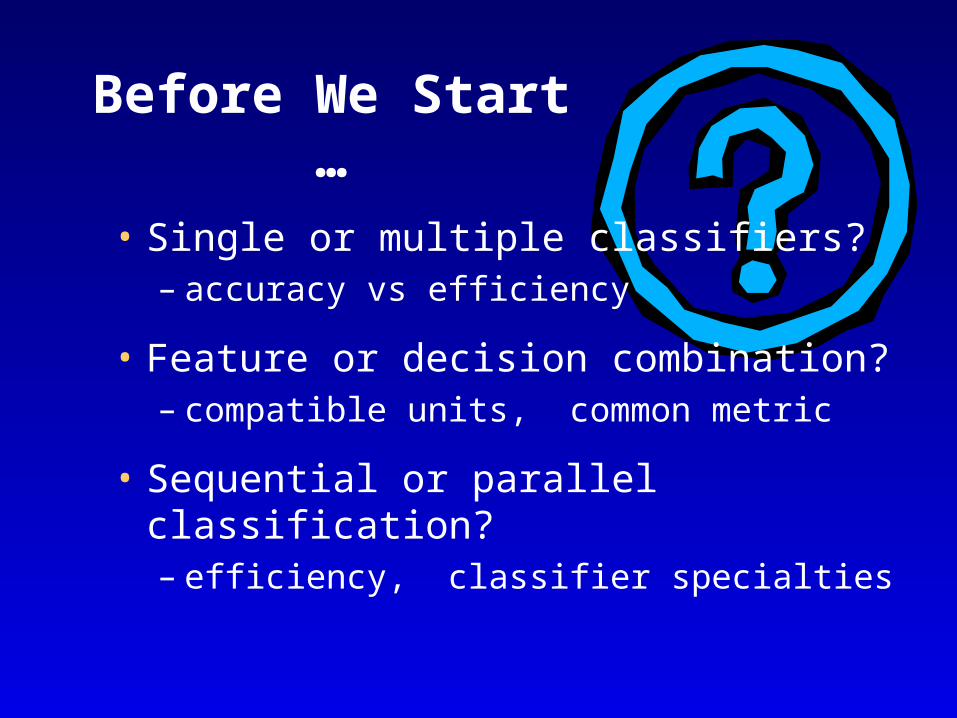
Before We Start …
• Single or multiple classifiers?– accuracy vs efficiency
• Feature or decision combination?– compatible units, common metric
• Sequential or parallel classification?– efficiency, classifier specialties
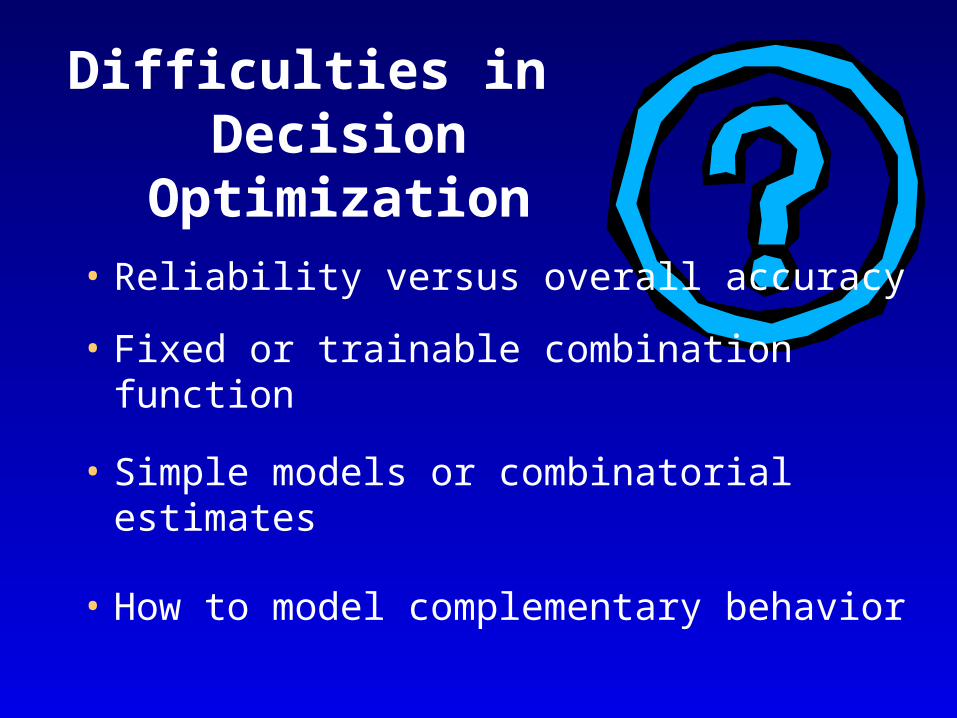
Difficulties in Decision Optimization
• Reliability versus overall accuracy
• Fixed or trainable combination function
• Simple models or combinatorial estimates
• How to model complementary behavior
Difficulties inCoverage Optimization
• What kind of differences to introduce:– Subsamples? Subspaces? Subclasses?– Training parameters? – Model geometry?
• 3-way tradeoff: – discrimination + uniformity + generalization
• Effects of the form of component classifiers
Dilemmas and Paradoxes
• Weaken individuals for a stronger whole?
• Sacrifice known samples for unseen cases?
• Seek agreements or differences?
Model of Complementary Decisions
• Statistical independence of decisions:assumed or observed?
• Collective vs point-wise error estimates
• Related estimates of neighboring samples
Stochastic Discrimination
• Set-theoretic abstraction
• Probabilities in model or feature spaces
• Enrichment / Uniformity / Projectability
• Convergence by law of large numbers
Stochastic Discrimination
• Algorithm for uniformity enforcement
• Fewer, but more sophisticated classifiers
• Other ways to address the 3-way trade-off
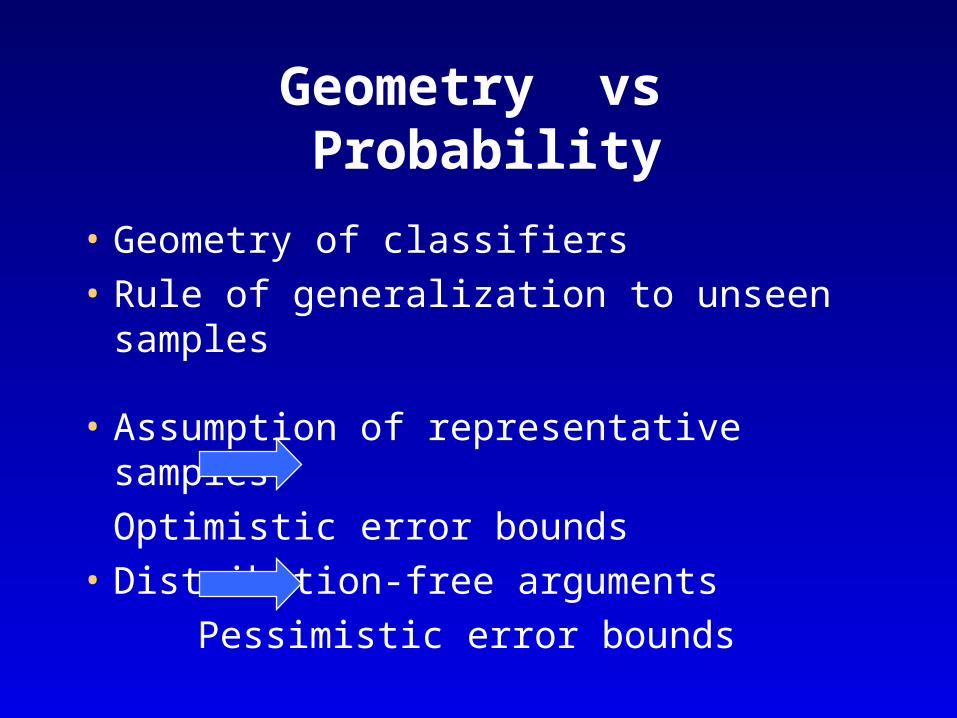
Geometry vs Probability
• Geometry of classifiers
• Rule of generalization to unseen samples
• Assumption of representative samples
Optimistic error bounds
• Distribution-free arguments
Pessimistic error bounds
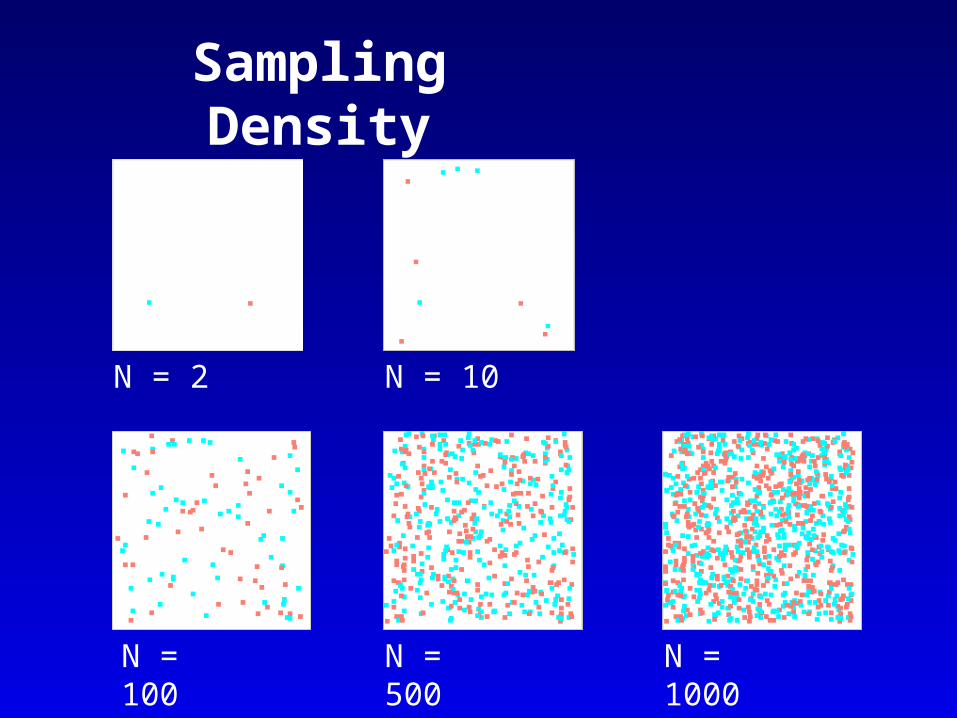
Sampling Density
N = 2 N = 10
N = 100 N = 500 N = 1000
Summary of Difficulties
• Many theories have inadequate assumptions• Geometry and probability lack connection• Combinatorics defies detailed modeling• Attempt to cover all cases gives weak results
• Empirical results overly specific to problems• Lack of systematic organization of evidences
More Questions
• How do confidence scores differ from feature values?• Is combination a convenience or a necessity?• What are common among various
combination methods?• When should the combination hierarchy
terminate?
Data Dependent Behavior of Classifiers
• Different classifiers excel in
different problems
• So do combined systems
• This complicates theories and
interpretation of observations
Questions to ask:
• Does this method work for all problems?
• Does this method work for this problem?
• Does this method work for this type of problems?
Study the interaction of
data and classifiers
Characterization of
Data and Classifier Behavior
in a Common Language
Sources of Difficultyin Classification
• Class ambiguity
• Boundary complexity
• Sample size and dimensionality
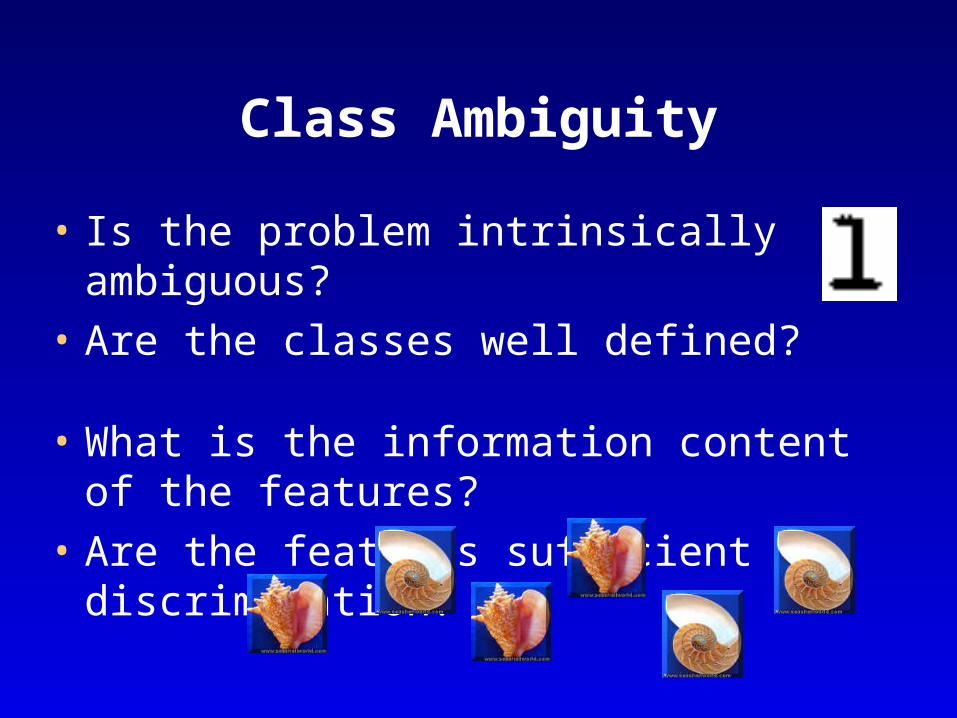
Class Ambiguity
• Is the problem intrinsically ambiguous?
• Are the classes well defined?
• What is the information content of the features?
• Are the features sufficient for discrimination?
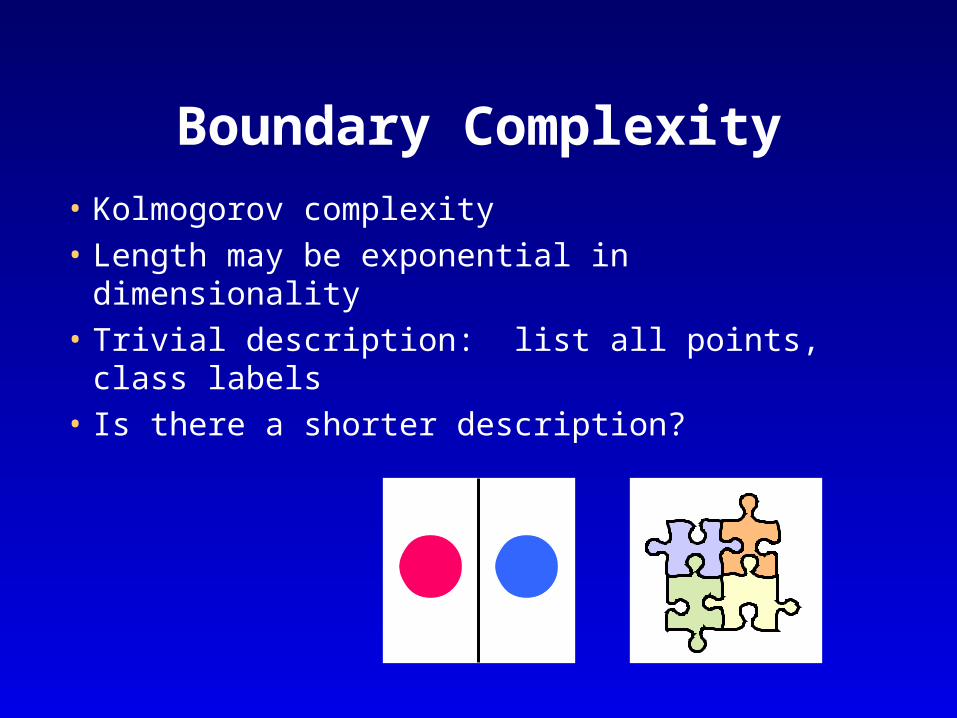
• Kolmogorov complexity
• Length may be exponential in dimensionality
• Trivial description: list all points, class labels
• Is there a shorter description?
Boundary Complexity
Sample Size & Dimensionality
• Problem may appear deceptively simple or complex with small samples
• Large degree of freedom in high-dim. spaces
• Representativeness of samples vs.
generalization ability of classifiers
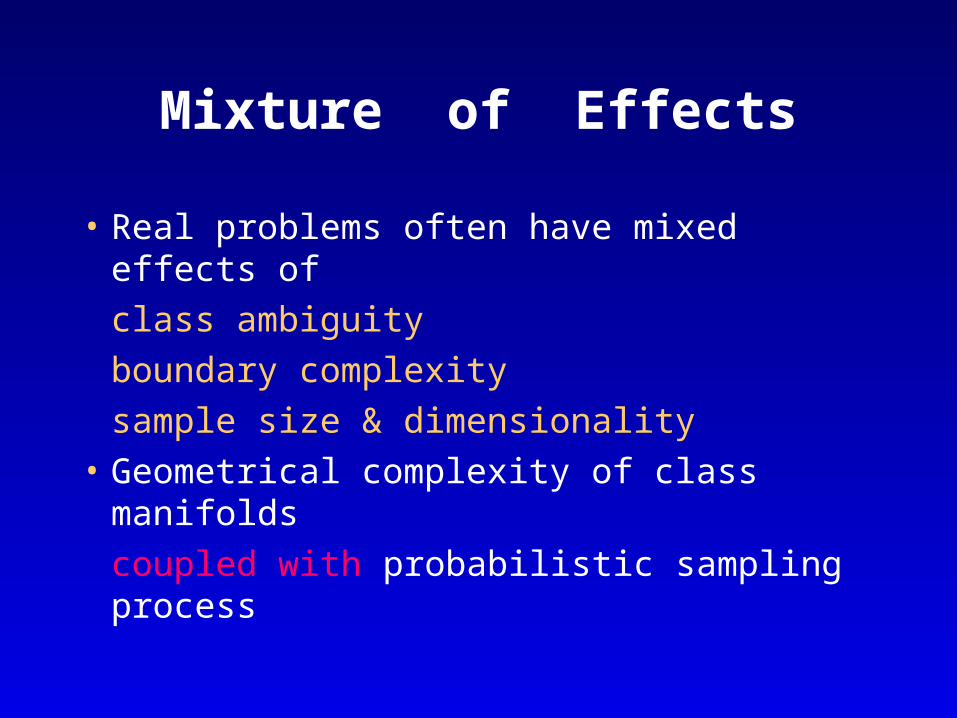
Mixture of Effects
• Real problems often have mixed effects of
class ambiguity
boundary complexity
sample size & dimensionality
• Geometrical complexity of class manifolds
coupled with probabilistic sampling process
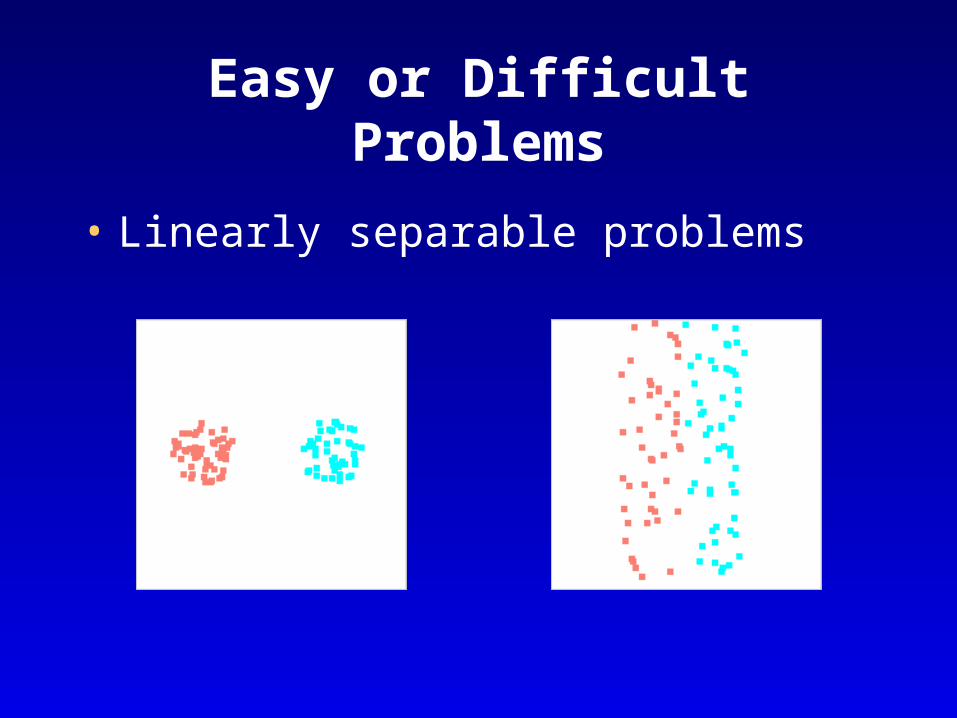
Easy or Difficult Problems
• Linearly separable problems
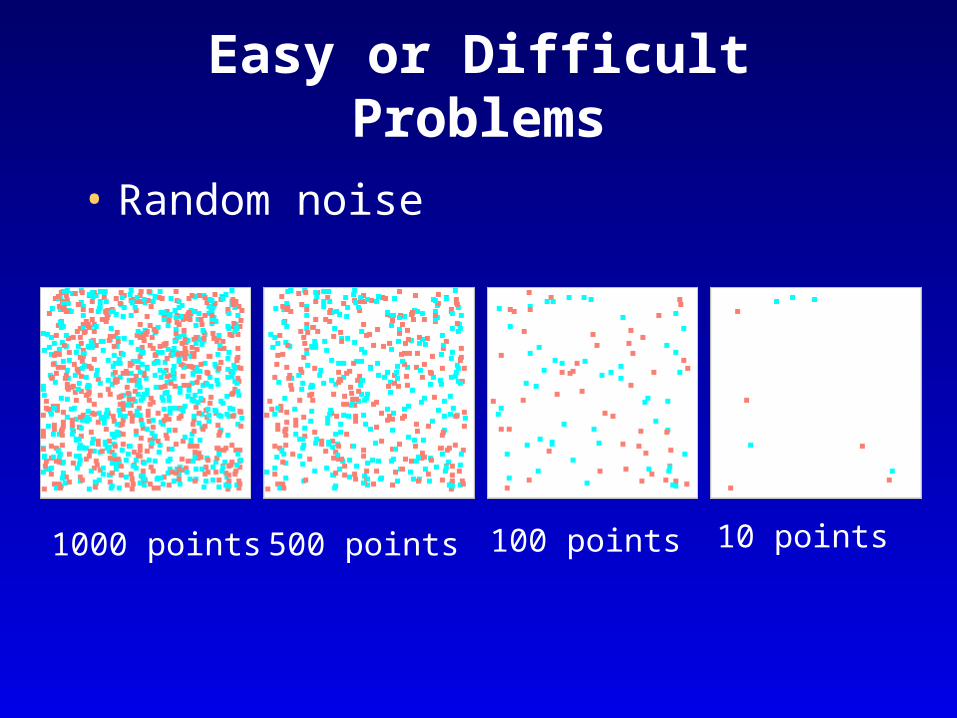
Easy or Difficult Problems
• Random noise
1000 points 500 points 100 points 10 points
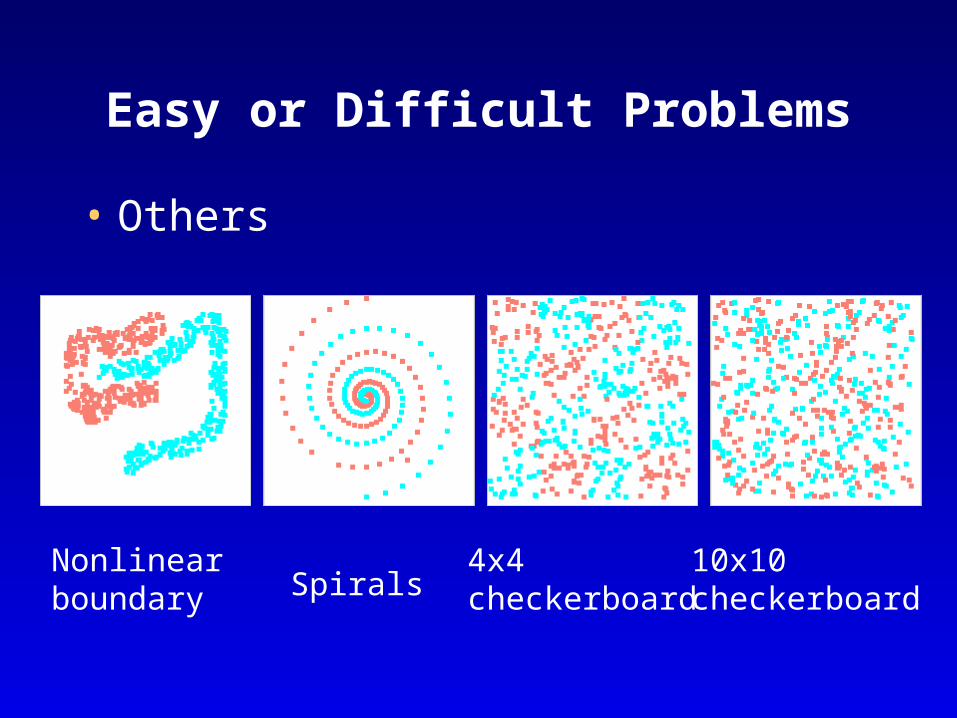
Easy or Difficult Problems
• Others
Nonlinearboundary Spirals
4x4checkerboard
10x10checkerboard
Description of Complexity
• What are real-world problems like?
• Need a description of complexity to
– set expectation on recognition accuracy
– characterize behavior of classifiers
• Apparent or true complexity?
Possible Measures
• Separability of classes– linear separability– length of class boundary– intra / inter class scatter and distances
• Discriminating power of features– Fisher’s discriminant ratio– overlap of feature values– feature efficiency
Possible Measures
• Geometry, topology, clustering effects– curvature of boundaries– overlap of convex hulls– packing of points in regular shapes– intrinsic dimensionality– density variations
Linear Separability
• Intensively studied in early literature• Many algorithms only stop with positive
conclusions– Perceptrons, Perceptron Cycling Theorem, 1962– Fractional Correction Rule, 1954– Widrow-Hoff Delta Rule, 1960– Ho-Kashyap algorithm, 1965– Linear programming, 1968
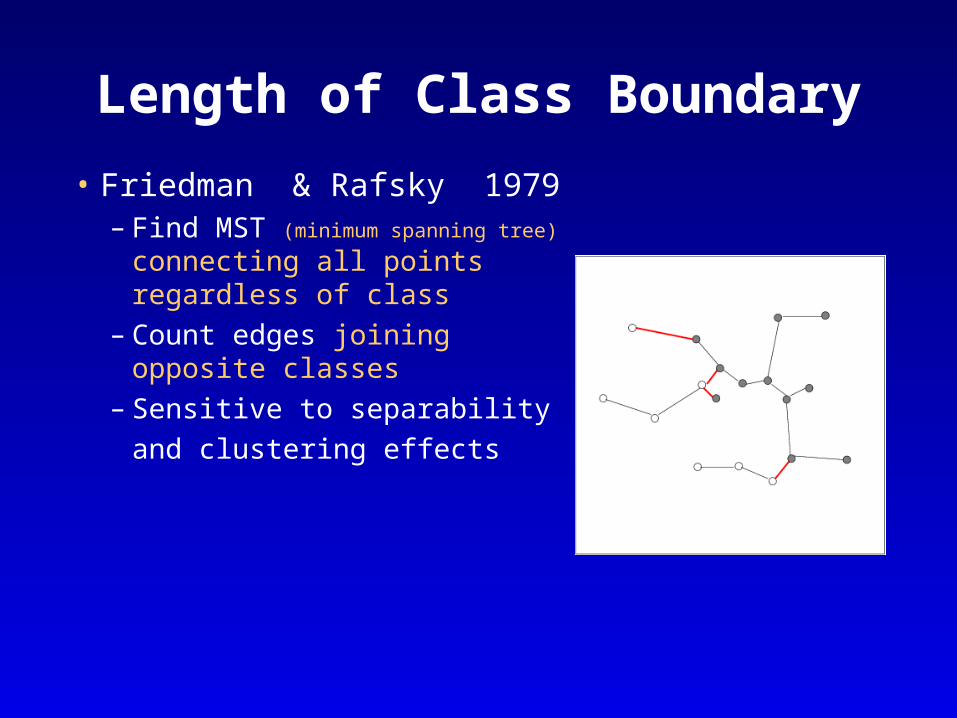
Length of Class Boundary
• Friedman & Rafsky 1979– Find MST (minimum spanning tree)
connecting all points regardless of class
– Count edges joining opposite classes
– Sensitive to separability
and clustering effects
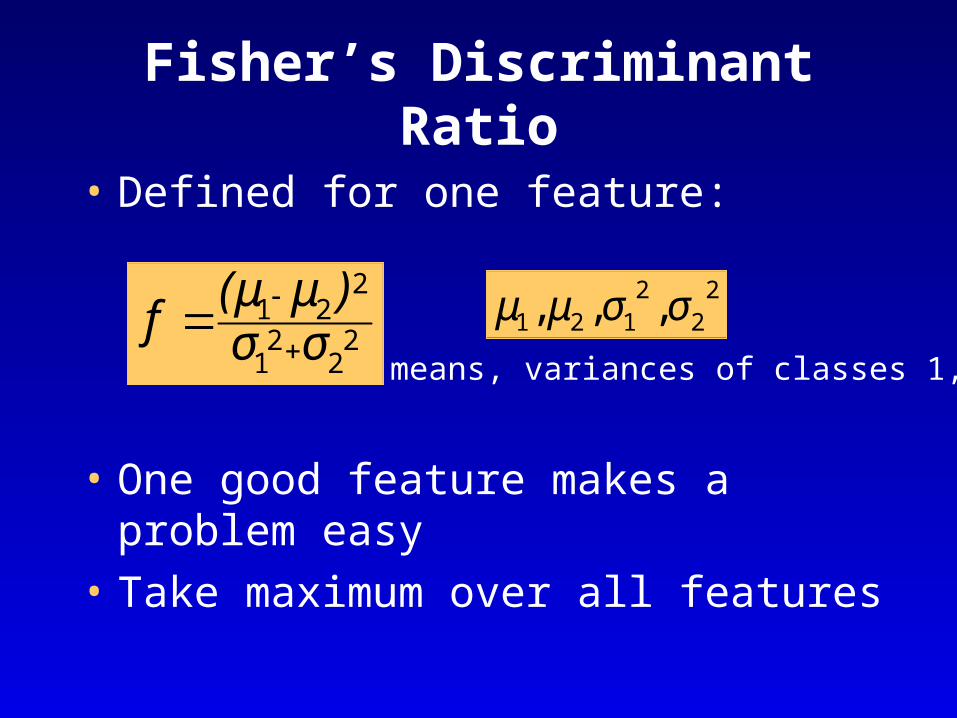
Fisher’s Discriminant Ratio
• Defined for one feature:
22
21
221
σσ)μ(μ
f
2
22
121 ,,, σσμμ
means, variances of classes 1,2
• One good feature makes a problem easy
• Take maximum over all features
Volume of Overlap Region
• Overlap of class manifolds
• Overlap region of each dimension asa fraction of range spanned by the two classes
• Multiply fractions to estimate volume
• Zero if no overlap
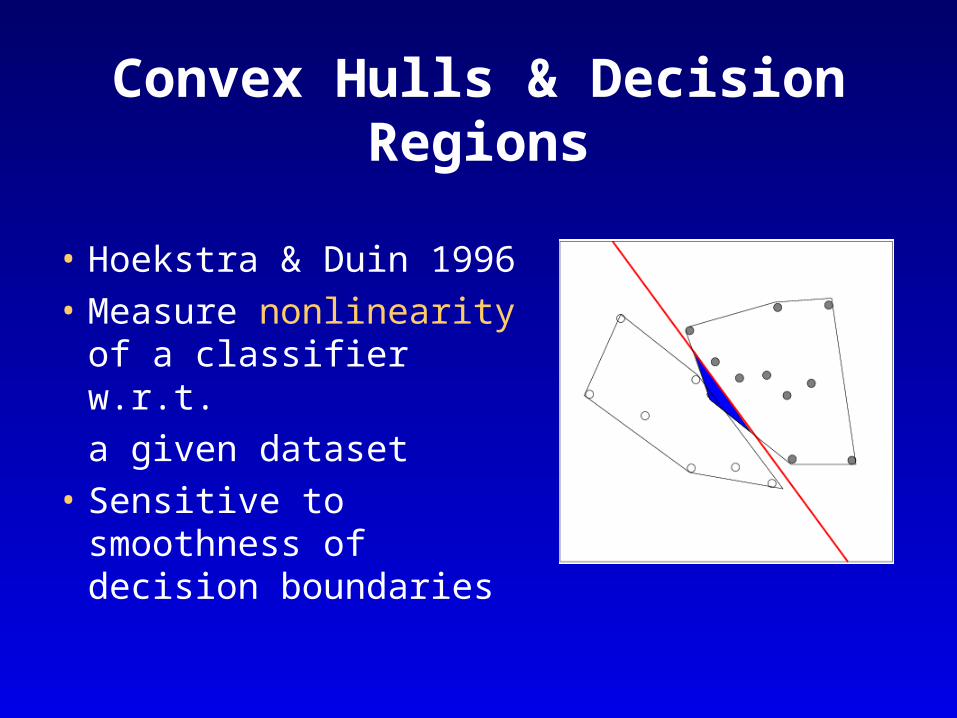
Convex Hulls & Decision Regions
• Hoekstra & Duin 1996
• Measure nonlinearity of a classifier w.r.t.
a given dataset
• Sensitive to smoothness of decision boundaries
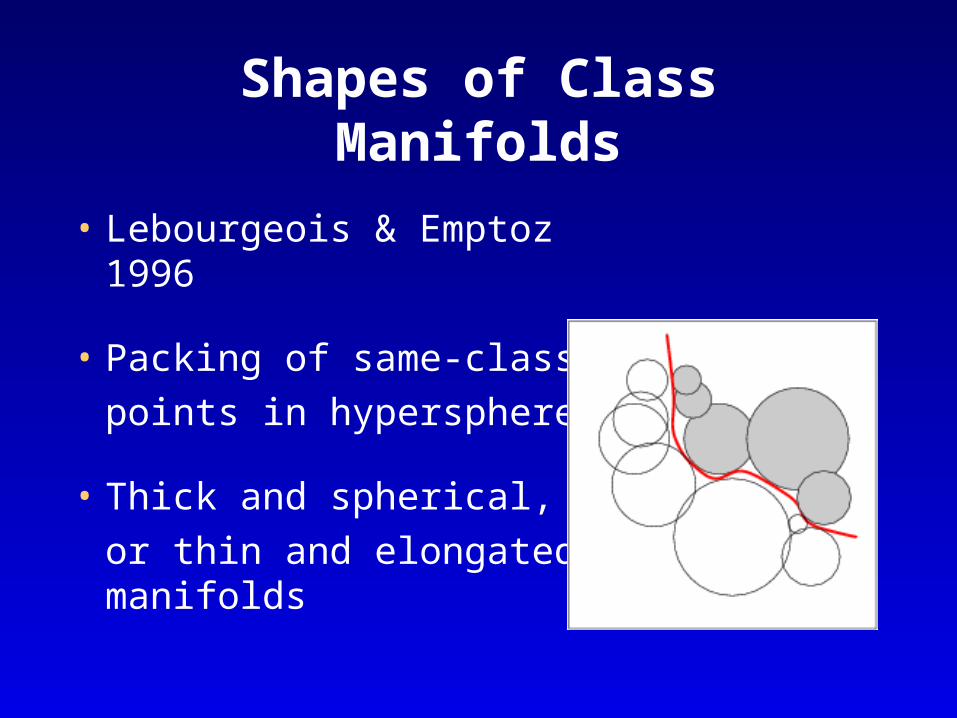
Shapes of Class Manifolds
• Lebourgeois & Emptoz 1996
• Packing of same-class
points in hyperspheres
• Thick and spherical,
or thin and elongated manifolds
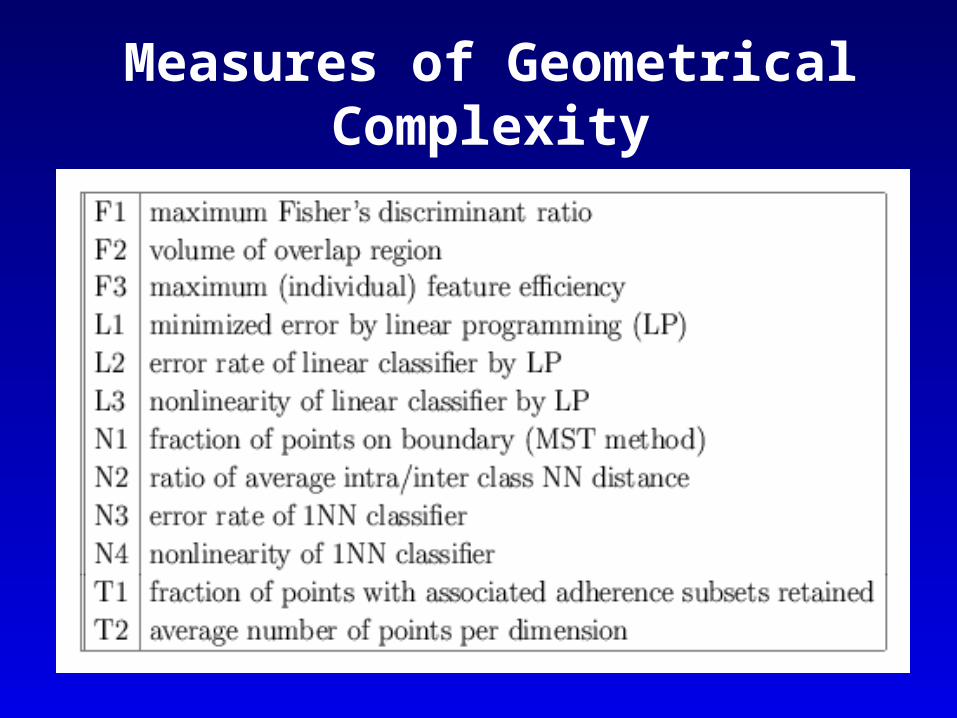
Measures of Geometrical Complexity
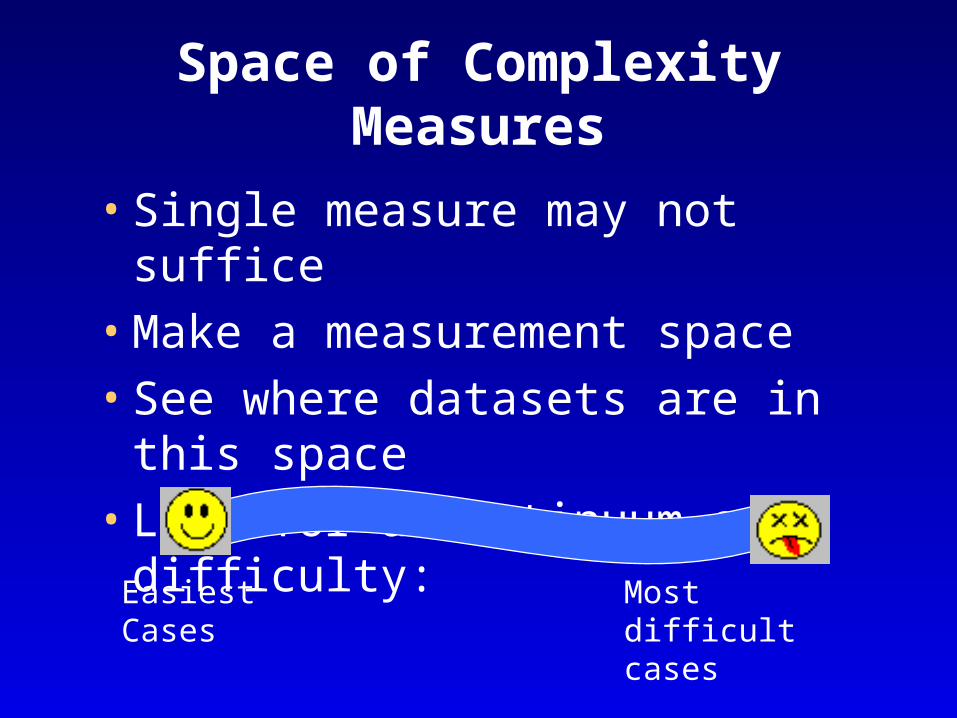
Space of Complexity Measures
• Single measure may not suffice
• Make a measurement space
• See where datasets are in this space
• Look for a continuum of difficulty:
Easiest Cases Most difficult cases
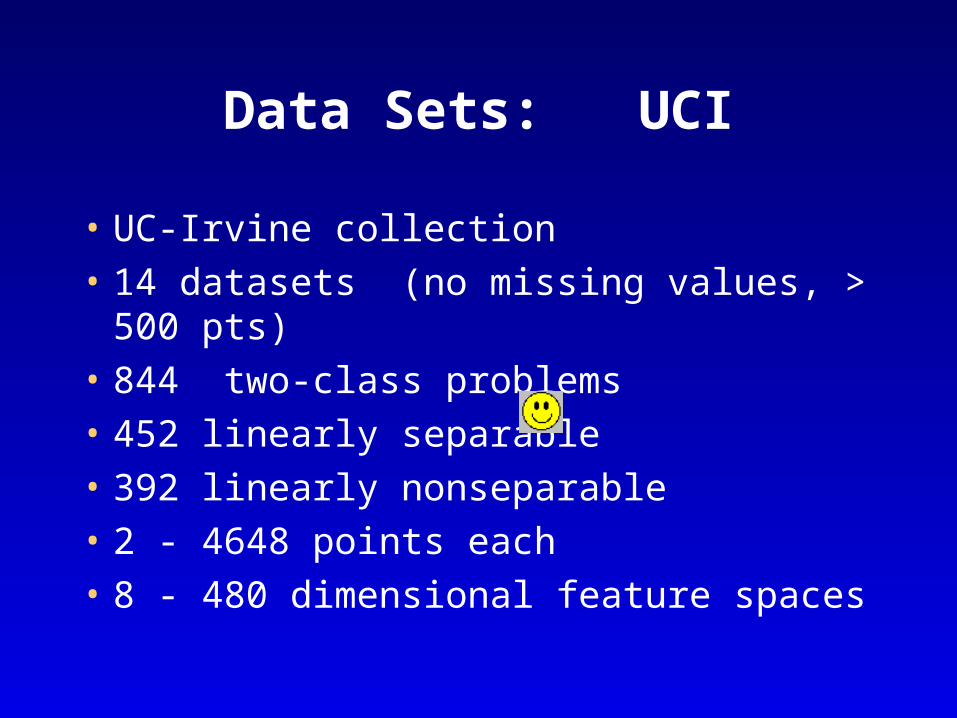
• UC-Irvine collection
• 14 datasets (no missing values, > 500 pts)
• 844 two-class problems
• 452 linearly separable
• 392 linearly nonseparable
• 2 - 4648 points each
• 8 - 480 dimensional feature spaces
Data Sets: UCI
Data Sets: Random Noise
• Randomly located and labeled points
• 100 artificial problems
• 1 to 100 dimensional feature spaces
• 2 classes, 1000 points per class
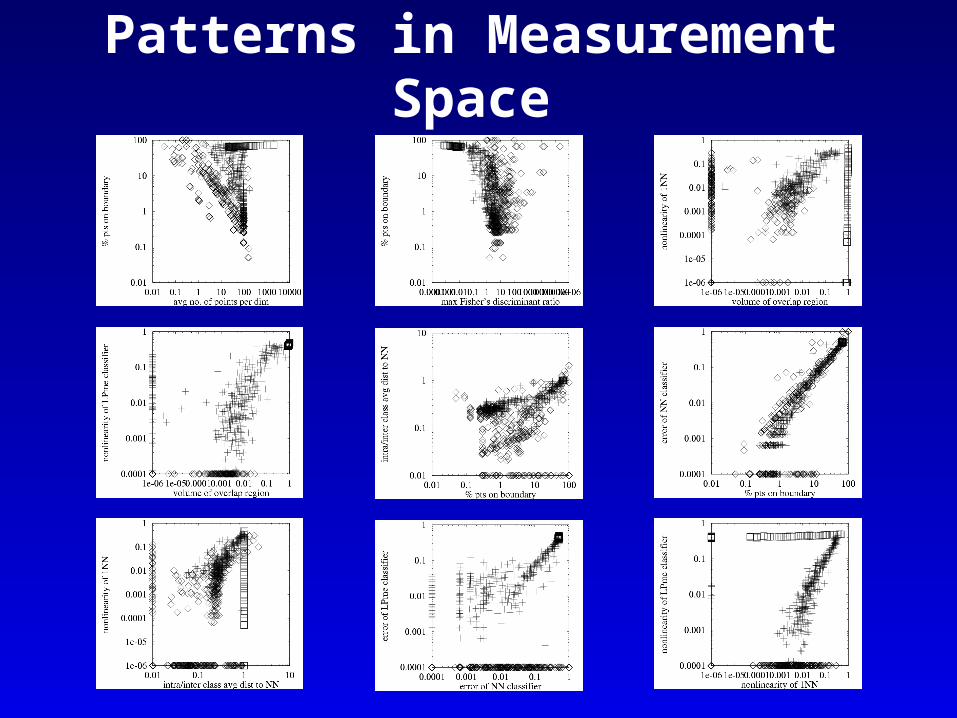
Patterns in Measurement Space
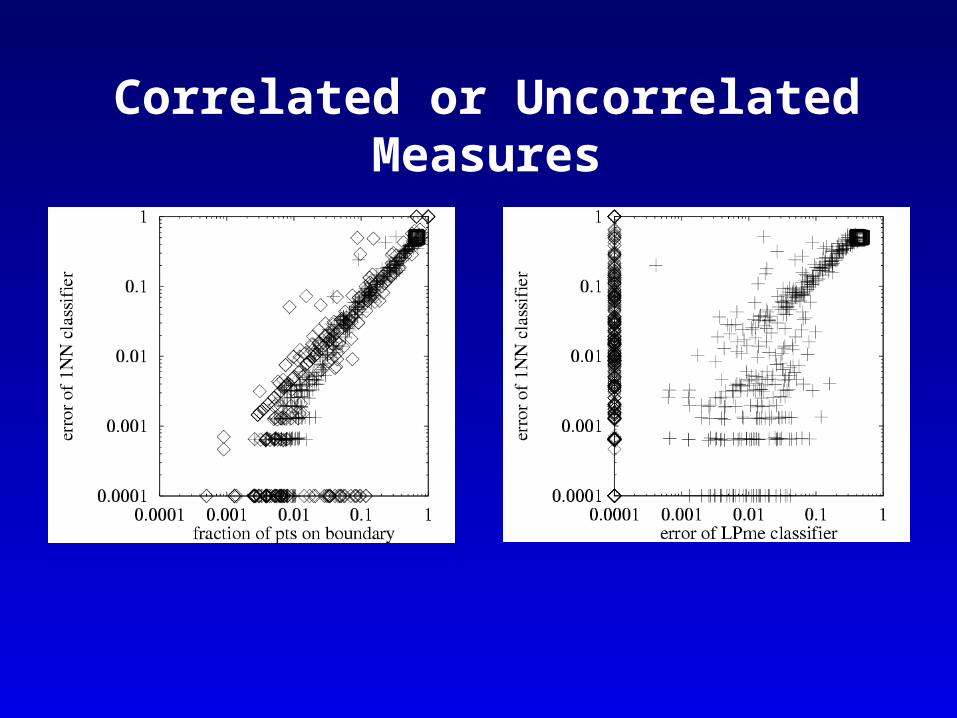
Correlated or Uncorrelated Measures
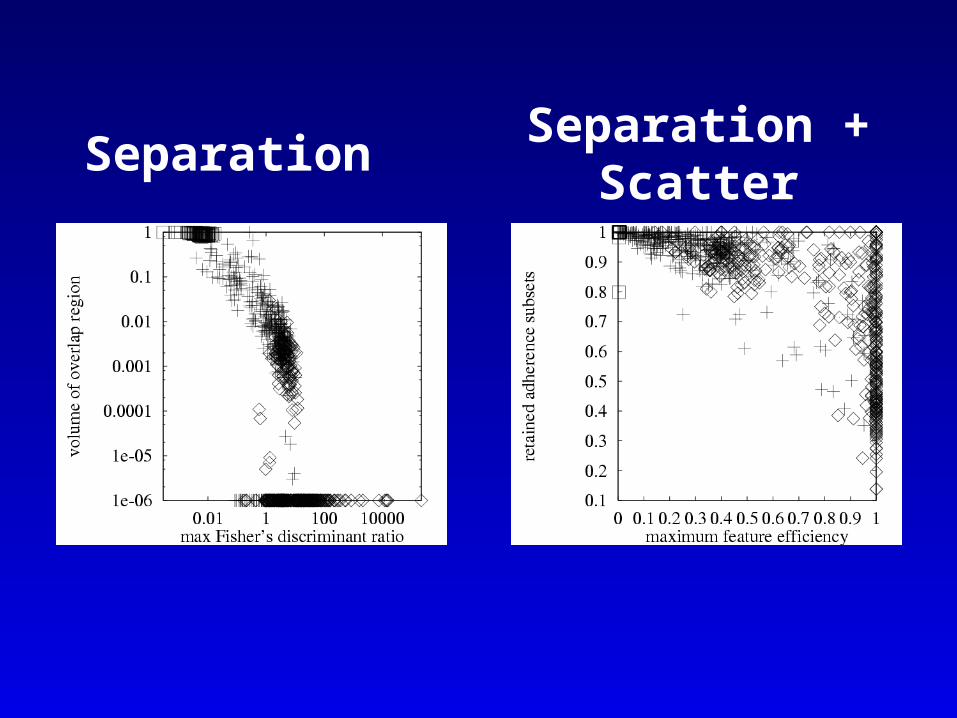
Separation + ScatterSeparation
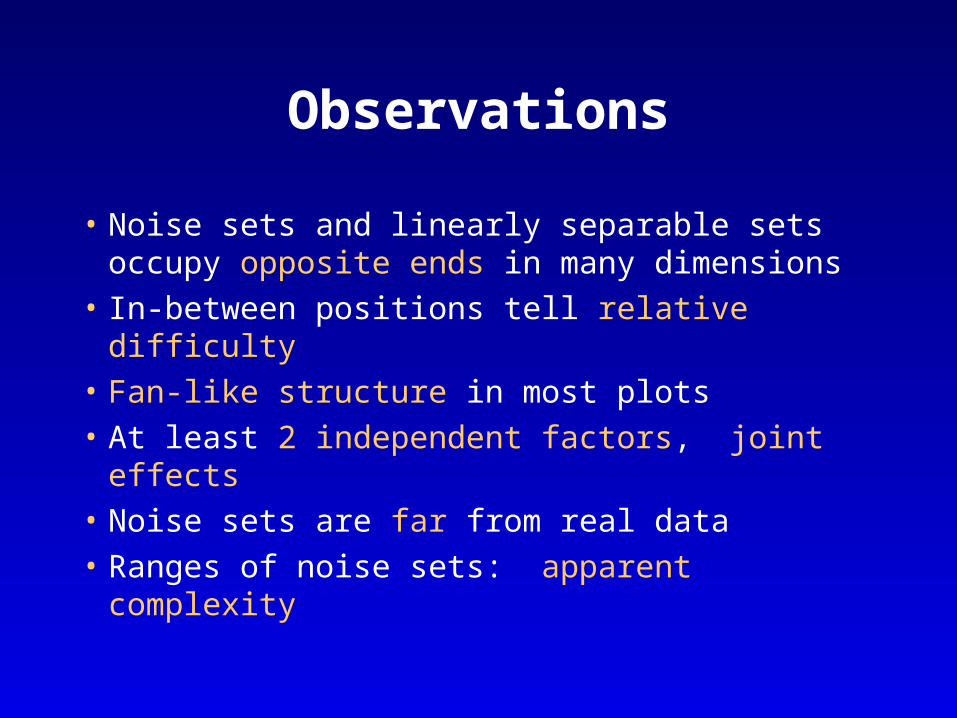
Observations
• Noise sets and linearly separable sets occupy opposite ends in many dimensions
• In-between positions tell relative difficulty
• Fan-like structure in most plots
• At least 2 independent factors, joint effects
• Noise sets are far from real data
• Ranges of noise sets: apparent complexity
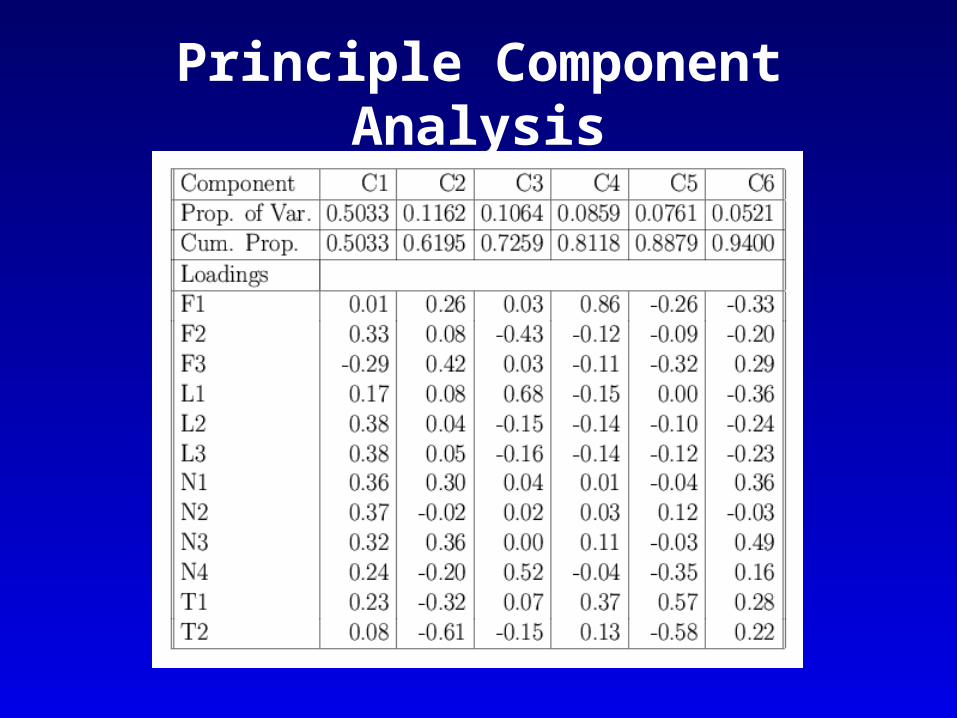
Principle Component Analysis
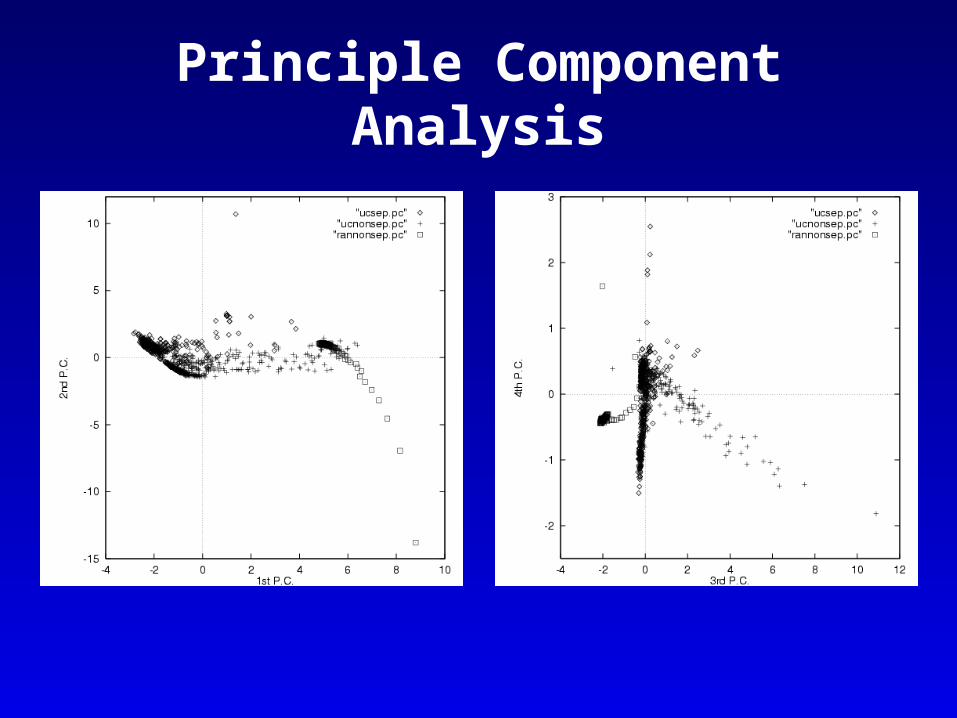
Principle Component Analysis
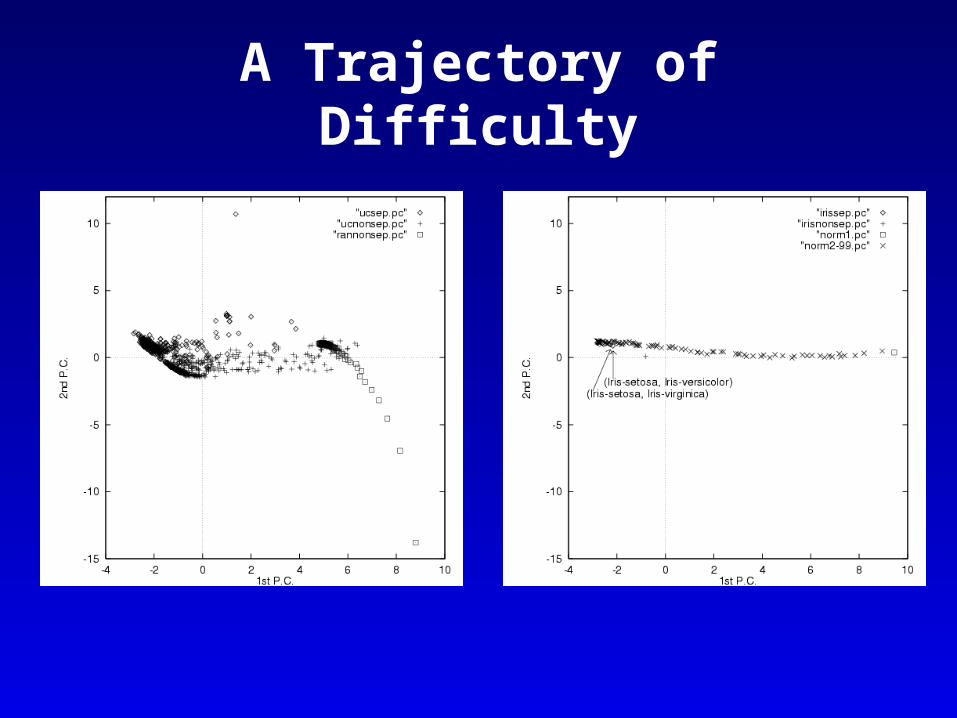
A Trajectory of Difficulty
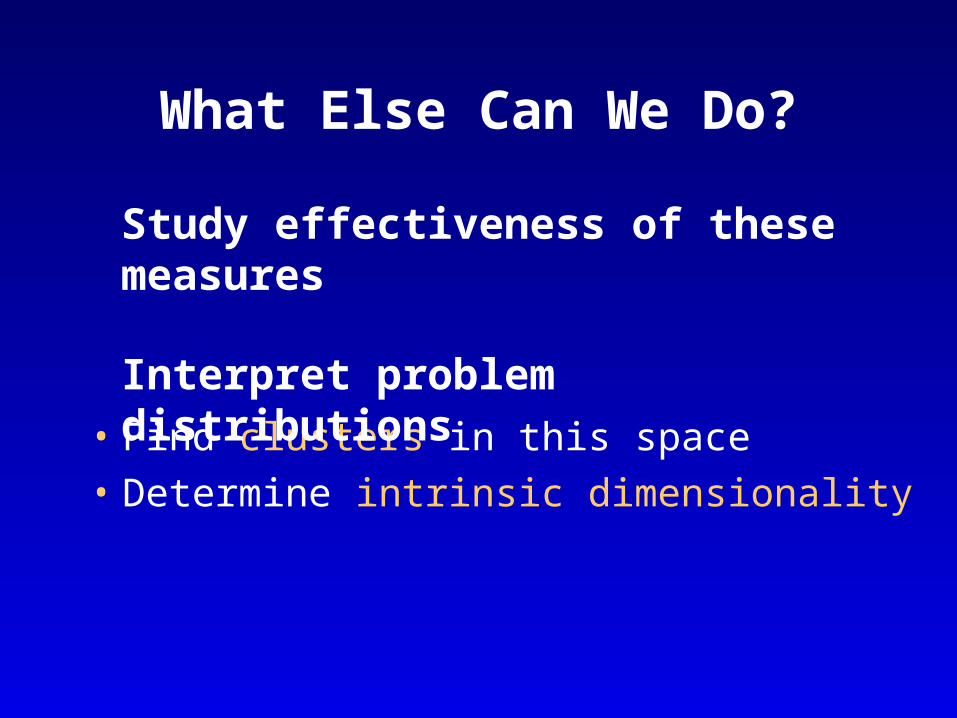
What Else Can We Do?
• Find clusters in this space
• Determine intrinsic dimensionality
Study effectiveness of these measures
Interpret problem distributions
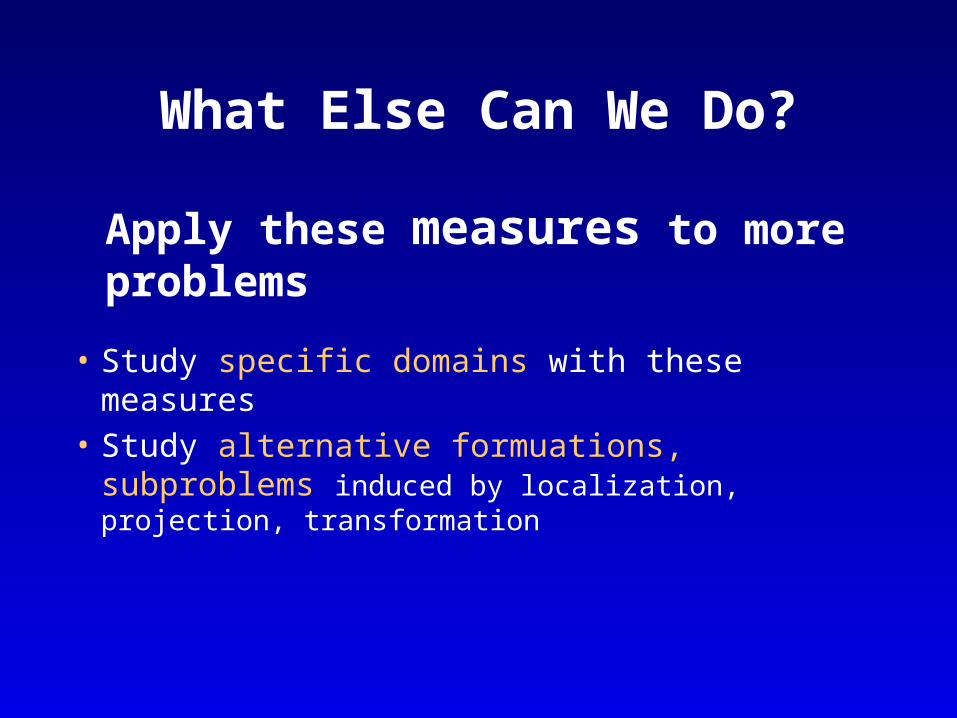
What Else Can We Do?
• Study specific domains with these measures• Study alternative formuations, subproblems
induced by localization, projection, transformation
Apply these measures to more problems
What Else Can We Do?
Relate complexity measures to
classifier behavior
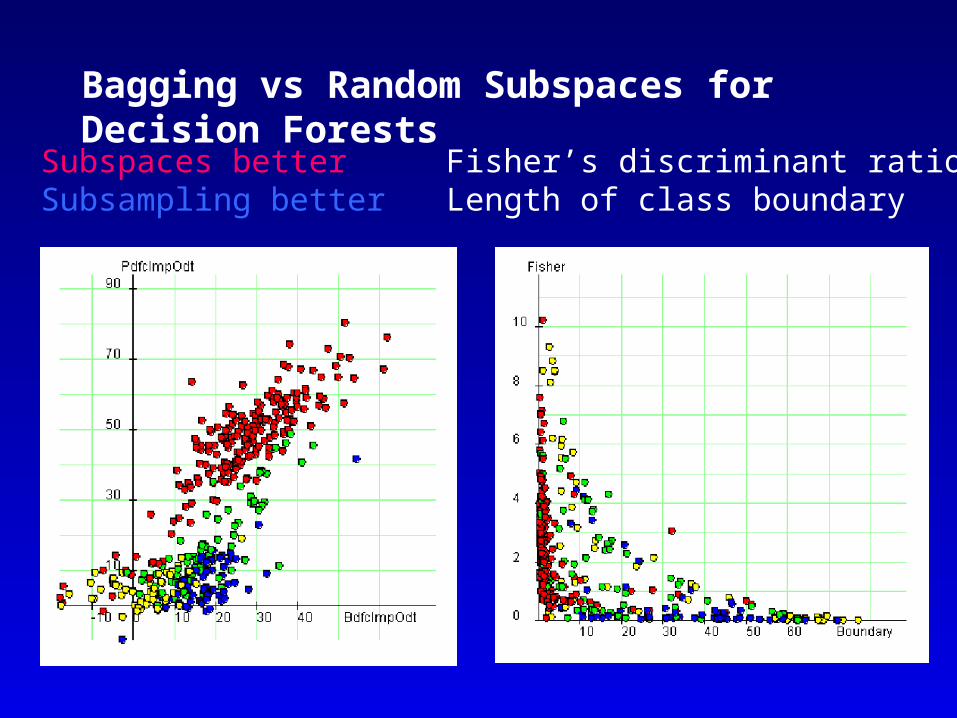
Bagging vs Random Subspaces for Decision Forests
Subspaces betterSubsampling better
Fisher’s discriminant ratioLength of class boundary
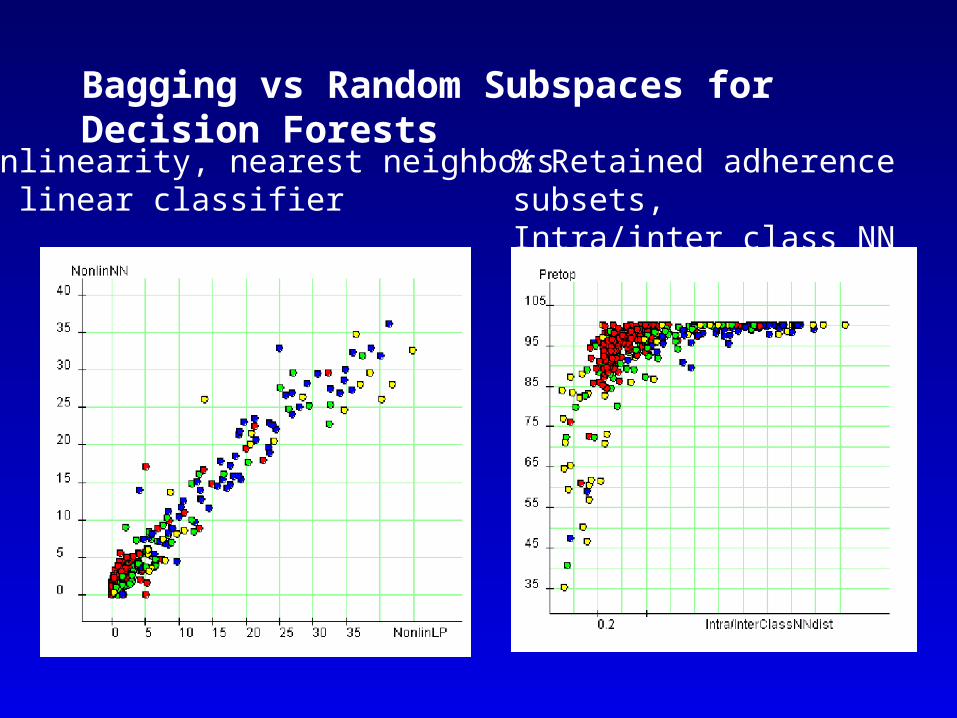
Bagging vs Random Subspaces for Decision Forests
Nonlinearity, nearest neighborsvs linear classifier
% Retained adherence subsets,Intra/inter class NN distances
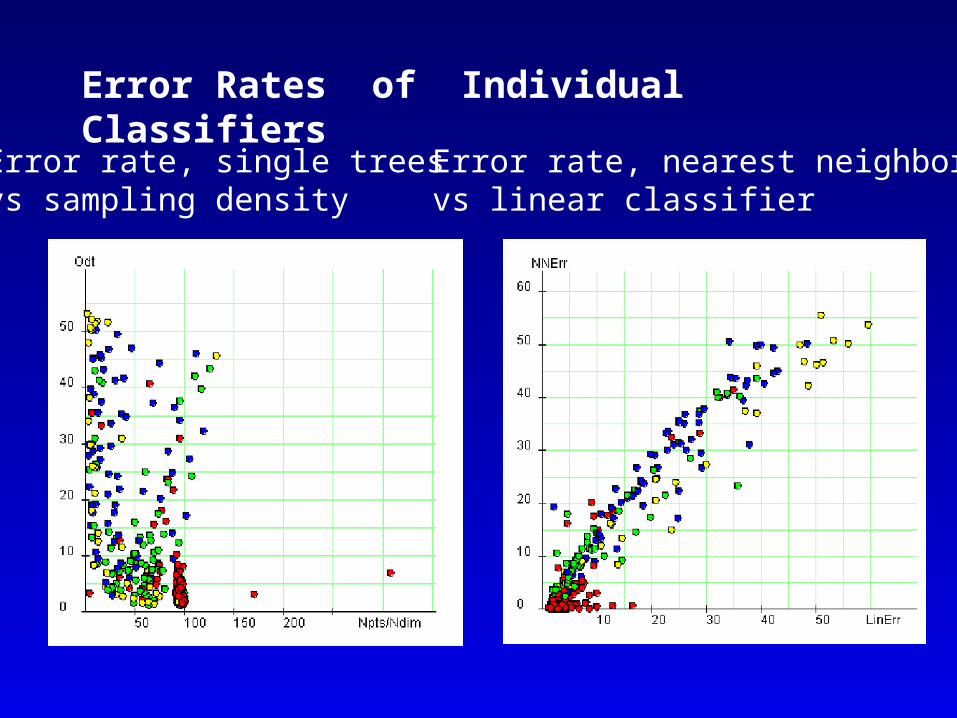
Error Rates of Individual Classifiers
Error rate, nearest neighborsvs linear classifier
Error rate, single treesvs sampling density
Observations• Both types of forests are good for
problems of various degrees of difficulty
• Neither is good for extremely difficult cases- many points on boundary - ratio of intra/inter class NN dist. close to 1 - low Fisher’s discriminant ratio - high nonlinearity of NN or LP classifiers
• Subsampling is preferable for sparse samples
• Subspaces is preferable for smooth boundaries
Conclusions
• Real-world problems have different types of geometric characteristics
• Relevant measures can be related to classifier accuracies
• Data complexity analysis improves understanding of classifier or combination behavior
• Helpful for combination theories and practices