Embed Size (px)
Citation preview

DOCUMENT RESUME
ED 095 802 HE 005 879
AUTHOR !tinsel, John B.TITLE Student Profile: Freshmen - 1973-74. Part II: SAT,
High School Decile, and Entrance Testing.PUB DATE Jul 74NOT? 23p.
EDRS PRICE NF -$0.75 HC-$1.50 PLUS POSTAGEDESCRIPTORS Academic Ability; *Academic Achievement; Aptitude
Tests; *College Freshmen; *college Students; GradePoint Average; *H gher Education; Research Projects;*Student Characte istics
IDENTIFIERS *New College Hof ra University
ABSTRACTThis document esents data concerning the 1973-74
New College (Hofstra) entering freshmen. High school decile data andScholastic Aptitude Test (SAT) data are collected as a part of theusual admission procedures. In addition, 50 of the 68 freshmen wereadministered the Cooperative Reading Test, the Omnibus PersonalityInventory, and the New College Entrance Questionnaire. Based upon areview of SAT, high school deciles, and entrance test data onentering freshmen, 1973-74, the following points were made: (1)
Overall, the level of academic achievement based on SAT scores hasdropped an average of 4 or 5 percent over students admitted theprevious year. (2) The mean high school decile for entering studentswas 3.5 and is approximately the same as Hofstra Freshmen in general.(3) Reading levels of entering freshmen are above average overall,but levels of comprehension are slightly below average. (4) Studentsselecting New College appear to be intellectually motivated, to havean interest in the pursuit of ideas rather than facts, and to preferthe kind of social environment that they perceive exists at New
.
College. (MJM)

STUDENT PROFILE: FRESHMEN 1973-74
PART II: SAT, H1GH SCHOOL DECILE, AND ENTRANCE TESTING
U.S. DEPARTMENT OP HEALTH.EDUCATIONS. WELFARENATIONAL INSTITUTE DP
EDUCATIONTHIS DOCUMENT HAS SEEN REPRODUCED EXACTLY AS RECEIVED FROMTHE PERSON OR ORGANIZATION ORIGINATING IT POINTS OF VIEW OR OPINIONS'TATED DO NOT NECESSARILY REPRESENT OFFICIAL NATIONAL INSTITUTE OFEDUCATION POSITION OR POLICY
John R. KiruCnordin4tor
03LLF.CE RESEAY.CH OFFICE
NUR° Reptwt E7July, 1974
(Datn for tbib rport colicrLed and an:Ily....vd by Jcifernon
Latbom, Rcacarch Associate, Ncw Galicts Lducation31 kouenrch UifiN0

INTRODUCTION
This report concerns additional' data avaliable on the 197-74 New Collegeentering freshman. SAT and high school docile data are collected as part ofthe usual admissions procedures. In addition, students are asked to partici-pate in A testing program as part of Freshmen Orientation at New College.1973-74 marked the first year that the Omnibus Personality Inventory (OPI)and the Cooperative English Reading Test (C-2) as measures of intellectualorientation and reading skills, respectively, wore included. These testshave been added for research and program evaluation purposes and will beadministered to each entering class henceforth, thus permitting comparativeanalyses from year to year of various characteristics of entering students.It is hoped that such information will be helpful in program development forthe College. In addition; planned research involving the relationship ofreading skills and intellectual characteristics to various aspects of thestudents academic life is planned.
PROCEDURES
Fifty of the 68 entering freshmen were tested as a group in two, two hourtesting sessions during the freshmen orientation in September, 1973.
Instruments
Four different instruments were administered including: (1) ACE questionairewhich is given to all entering students at Hofstra. Results of this questionaireare included in NCCRO Report #6.(2) Cooperative Reading Test: This test is a nationally normed readingmeasure including vocabulary, reading speed and comprehension. A variety ofnormative groups can be used for interpreting test scores. The norm groupchosen was obviously, "entering freshmen at a liberal arts college."(3) Omnibus Personality Inventory: The OPI is a multiscale, true-false,self-administering personality inventory, developed u to assess selectedattitudes, values, and interests, chiefly relevant in the areas of normalego-functioning and intellectual activity." (heist and Yong°, 1968,p.1).Results include fourteen individual scale measures and one composite measurecalled the "Intellectual Disposition Category". The five scales which comprisethe IDC category are said to provide a general measure of intellectualorientation or disposition, specifically denoting whether logical, analyticalthinking takes precedence over thinking that involves free use of imaginationand perceptual-cognitive exploration. Finally, it should be emphasized thatthe uri is a measure of intr.11cctual disposition or style, not ability or
achievement.(4) ?yew College Entrance Questionaire: This is a locally developed questionairedesigned 00 elicit inforniation about reasons why the student choose 'elow College,his perception of the college, how he learned about the college, what other
scoole he applied to, etc.*
* The College Questionaire was developed several years ago, and in manyways wc rodunuant to in,vritiaLivn included ou
thi qucvtionniro tiLf1 bcou revised and shertened for future administrations,

- 2
PROCEDURESInstruments continued
In addition to entrance test data, SAT and high school decilo data were
collected from admissions records.
RESULTS
SAT and high school docile data were ava/iable on 61 of the 68 enteringstudents. Only 50 of the 68 participated in the entrance testing; therefore,results are based on data for approximatoly 3/4 or 74 of the entering class.
marlijsttss11201 Decile
Table 1 presents an analysis of mean SAT scores and High School deciles byConcentration Area and then total mean SAT scores for entering freshmen.Concentration Areas were determined by the students stated Area at the timeof his/her registration for the Spring Semester. Also, included as a specialgroup are those students who were, at that time, still "Undecided" as to Area.These figures are not adjusted for attrition during the year and they do notinclude students who entered in the Special Studies Program.
TABLE 1
Mean SAT & High School Deciles for Entering Freshmenby Concentration Area, 1973.74
,...-.......
AREA N SATVERBAL MATH ODWINED
H. SC.
DECILE
HUMANITIES 11 540.9 495.5 518.2 5,1
SOCIAL SCIENCE 24 525.9 505.0 515.4 3.2
NATURAL SCIENCE 15 517.3 566.0 541.7 3.1
LIBERAL ARTS 1 490.0 600.0 545.0 4.0
UNDECIDED 10 512.0 506.0 509.0 3.8
TOTAL 61 523.3 520.3 522.0 3.5
When vievd by Area, the SAT scores of the 1973-74 New College class appear to
be relativcly honncniour. The apparent aeperiority of the Natural Science
Students SAT i,ati1 is not surprisinz and is consistent with trends for NewCollege Natural Science students in the post several years. The apparent
Verbal SAT superiority of Humanities students is also not unexpected, although
there is a noticeable, drop in Humanities Math SAT scores over the previow
year (516.5 to 495.5).

RESULTSSAT en4111h§E.hool Docile continued BES1 COPT INNIABLE
The differences between Areas in mean high school docile is also interesting.While Social Science and Natural Science students are approximately equalin this category, the i!umanities students are noticeably lower in class standing
than any of the other groups. Any explanation of this pnenomenon is notreadily visible from this type of data, but would be a question worthy of
further exploration.
Cowered to other stiodents entering Nofstra in the Fall, 1973, New College
freshmen are at approximately the same level in terms of high schoo:. decile
(bofstra :lean = 3.3; New College Nean = 3.5). The Hofstra mean Verbal SAT is
499 for 1973-74, while the New College Verbal Mean is 523. On the other hand,
the average SAT Math score for Hofstra students was 536 compared to cn average
of 520 at New College.
Table 2 provides a comparative analysis of SAT scores for entering students in
New College over the past three years. (Comparable data on high school deciles
over the same time period is not avaliable.)
TAilLE 2
Comparison of Mean SAT scores of New College Entering FreshmenOver the Past Three Years
YEAR
----N MEAN SAT
VERsAL MATH COMBINED
1971 - 72 142 583.2 556.8 570.0
1972 - 73 108 553.1 543;8 548.5
1973 - 74 61 523.6 520.3 522.0
It is quite apparent from Table 2 that the mean SAT scores have been consistently
dropping over the past three years. Overall, the mean Verbal. SAT has fallen
aFpro%imately 5%, the i.;ath Sid approximately 4%, and the colnhined SIIT approximately
54 since 1972-73. The decreases in mean scores since 1971-72 are of course,
even greater. It is not known whether these decreases are consistent with
drops rt 1:of6tca University or ;It oth,:r school` but if so they
could be a reelection of Univ..:rrity recruitment policies o. al artifact of shifts
in tho colle::,e population natiotiwids.
An analysis of Si'.T scores for 25 of the 1973-74 frcshmen who withdrew! frou the
college: sometime during the year, or who failed to iscre.,istcr for the Fall,
1974-75 snoester, thus sogf;evting their intention not to return to New college,
reventctd th.'t the Iean SAT Verbal for these stud. its was 495 or an average of
of foe o:; On the other h,:nd,
the nverle,c i:ath sAr for "withdrawn" student:, w:-.0 SuO or appro:etimatly 40
point3 ntov:: tne avocaL.: ..;;;; :v. L.HL:ci.16 Thfc inir,r-at.Nn4

4RESULTSSAT and Hie' School Decile continued asi con AVAILABLE
combined with the fact that the average Verbal SAT score for New Collegefreshmen has been consistently higher than the 1.14th SAT, suggests thatNew College may be more attractive to students with stronger Verbal skills,and that students with these strengths are more likely to stay at NewCollege. This hypothesis is worthy of further investigation.
Entrance Testing,
Table 3 contains mean scores for entering freshmen on the Cooperative ReadingTest and the 04nibus Pertonality Inventory. For comparative purposes meanscores for trannfer students entering hew College in the Fall, 1973-74 andstudents in the Special Studies Program in the Fall semester are also included.
Cooperative Reading Test:
As indicated, the overall mean percentile rank on the C-2 for entering freshmenwas 63.8, which is noticeably highe: than the mean percentile rank for either ofthe other two groups of entering students. The range of overall scores forentering freshmen was from a high of 95 to a low of 8, with a standard deviationof 18 percentile points. The freshmen appear tb be .moot proficient in readingspeed, but the level of comprehension of what they read may be adversely effectedas indicated by the 43.3 mean percentile score. In all three groups, level ofcomprehension is the lowest, yet the freshmen still exceed the other two groups.The exact meaning of these differences is not clear, although lower scores amongthe SSP students might have been expected given the nature of this populationof students who need special acacemIc assIstance. un the ocher hand, one mighthave expected transfer students to be more proficient in reading skills as aresult of their prim. experience in college.
In summary, it would appear that the New College entering freshmen are readingat a level comparable to that of other freshmen in liberal arts colleges.Relatively speaking, the level of comprehension in reading among New Collegefreshmen is weak.
Future research with the C-2 will include studies of the relationship betweenreading scores and academic performance, as well as the relationship of thesescores to SAT scores. (A cursory review of this latter relationship with thecurrent students suggests a minimal correlation.)

- 5 -
B COI MAME
TABLE 3
C-2 READING AND OlalIBUS PERSONALITY INVENTORY MEASURESBY CROUPS EUR FALL 1973-1974 ENTERING STUDENTS
TYPE OF MEASUREMENT FRESHMEN TRANSFER SSP FALL
C-2 READING TEST
Summary 7. Rank 63.8 49.9 43.6
Vocabulary 53.0 49.2 46.9
Speed of Comprehension 76.4 60.1 46.9
Level of Comprehen4on 43.3 37.2 36.1
MINIBUS PERSONALITY INVENIURY
Intellectual Disposition Cat. 4.1 4.4 5.3
Thinking Introversion 53.9 52.8 46.0
Theoretical Orientation 52.9 50.0 44.5
Estheticism 53.8 53.7 50.4
Complexity 59.0 59.3 52.7
Autonomy 58.2 58.5 54.5
Religious Orientation 55.5 57.9 54.9
Social Extroversion 45.3 46.1 49.4
Impulse Expression 58.4 58.5 58.2
Personal Integration 47.9 48.8 51.6
Anxiety Level 48.2 48.7 51.0
Altruism 49.0 51.1 47.2
Practical Outlook 41.2 41.5 46.7
Masculinity-Feminin:Lty 46.0 44.0 46.4
Response Bias 48.4 45.2 45.9

-6
RESULTS
Continued
Omnibus Personality Inventory:
Kg Uri AVAIIABLE
Raw scores on each of the 14 scales of the OPI are conveitnd to standardscores with a mean of 50 and standard deviation of 10. The IntellectualDisposition Category (IDC) is a composite score. The lcwer the IDC value(i.e. 1, 2, etc.) the more disposed is the group or individual to pursueintellectual educational goals rather than practical educational goals.The average JDC for any representative sample of Amarican College studentswould probably fall near category 5 (Heist and Yonge, 1968).
Lean scores for the three groups of entering students are not remarkablydifferent from each other or from college students in general. Scales onwhich the entering freshmen approximate one standard deviation from thenational norms of entering freshmen include the Complexity (CO), Autonomy(AU), Impulse Expression (IE) and Practical Outlook (PU) scales. Based ondescriptions of these particular scales, it would appear that New Collegestudents enjoy complex and challenging tasks, are tolerant of ambiguities,and are less concerned with practical actions as opposed to theoretical
concerns. Similarly, they are more interested in ideas than facts and tend
to believe that there is more than one answer to'a question. Finally, they
appear to be less restrictive and more independent and impulsive in theirthinking than are typical college students. These descriptions are suggestivebased upon group scores and are not intended as inclusive or absolute for allNew College freshemen.
Looking specifically at the IDC, we find that New College students tall ata'out the "average" for American College students (average=5). Students who fall
in categories 1 and 2 represents very broad intellectual interests andpursuits, often manifest high levels of esthetic sensitivity and appreciation,and reach out for a variety of perceptual and cognitive experiences; generallyspeaking, these are highly intellectually motivated students. On the other
hand, students in Categories 7 and 8 are less committed to intellectualinterests and are more interested in tangible and practical pursuits; theirthinking is nonabstract and nontheoretical (Heist and Yonge, 1968).
Given these descriptions of extreme IDC categories, it would seem that whilethe New College freshmen resemble college students nationwide (mean IDC=4.1)on this dimension, they more closely resemble other students with "intellectual
interests" than do freshmen in the Special Studies Program, or for that
matter, transfer students entering New College.
Factor analysis of OPI results with New College freshmen produced four primary
factors
Factor 1: Intellectual and Study Orientation
SCALO. FOlt 1,214 Col,T,EGE FlIES1111..14
Thinking Introversion 53.9
Theoretical Orientation 52.9
Estheticisim 53.8
Compl,xity 5V.0
Impulse expression 5(J.4

.7-
RESULTS
Continued Big COP1 AVAILABLE
Persons scoring high on.thc scales in this factor present a reflective andtheoretical orientation to the world of ideas and to their academic studies.They also express D preference for perceptual and cognitive tasks whichinvolve esthetic qualities. beyond thin, these high scor:_rs may be individualswith a readiness to express impulses and seek immediate gratification, whileoverlooking the conventional modes of thinking or behaving. As a group, theNew College freshmen scored above average on these dimenisions.
Factor II: Social Orientation and Personal AdjustmentSCANE MEAN scon FQR Nal FilLS}U12N
Social Extraversion 45.3Personal Integration 47.9Anxiety Level 48.2Response Bias 48.4
This factor represents the dimensions of social and emotional adjustment andas a group, the New College freshmen scored slightly below the mean for collegestudents in general. Persons scoring low on these scales tend to avoidsocial functions of a forml nature, express some feelings of inadequacy orpersonal uncertainty, and tend to be worrisome and restless. While the NewCollege students do score lower than average, the differences from the meanfor College students is not extreme.
The fact that students have enlected to come to New Colle7e may be a manifestationof tendencies noted in both Factors I and and may further reflect theirperception of New College as a small community of scholars. If the above scoreshave any validity at all, these students may have seen New College as a placeconsistent with their own intellectual and social orientation.
Factor III: Wor...; Outlook
SCALE MEAN SCORE FOR NV COLLEGE FREUMEN
Masculinity-Femininity 46.0Practical Outlook 41.2
Again, the New College freshmen score below the average on those dimensions,sng::3ting a preference for literary and esthetic interests and an orientation tothe world of ideas rather than facts or practical consequences.
Factor IV: Liberalism and IndependenceSCALE MEAN SO)Rii FUR NEW OJLL3GE FRESIDTA
Religious uricntation 55.5Autonomy 58.2
These above average scores suggests a lack of religious zeal among the NewCollege students and a belief that the established order is not necessarilythe only or right way. They tend to qui:stion authority and to value independenceof action and though.
8
RESULTS
continued BO COPY MAORI
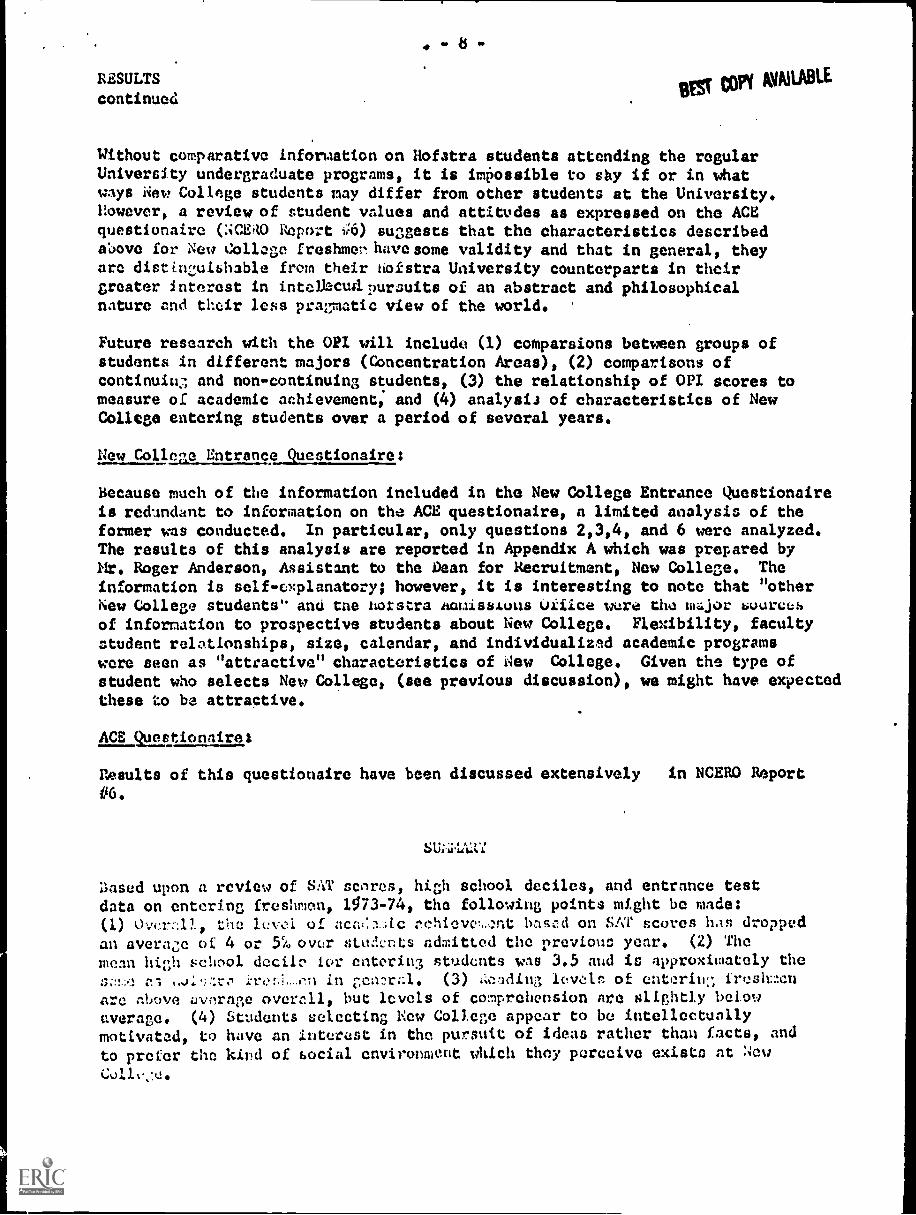
Without comparative information on Hofatra students attending the regularUniversity undergraduate programs, it is impossible to shy if or in whatways New College students nay differ from other students at the University.however, a review of student values and attitudes as expressed on the ACEquestionaire (N C1'0 Report 16) suggests that the characteristics describedabove for New College freshmen have some validity and that in general, theyare distinguishable from their nofstra University counterparts in their
greater interest in intellecuilpursuits of an abstract and philosophicalnature and their less pragmatic view of the world.
Future research with the OPI will include (1) comparsions between groups ofstudents in different majors (Concentration Areas), (2) comparisons ofcontinuing and non-continuing students, (3) the relationship of OPI scores tomeasure of academic achievement, and (4) analysis of characteristics of NewCollege entering students over a period of several years.
New College Entrance Questionaire:
Because much of the information included in the New College Entrance Questionaireis redendant to information on the ACE questionaire, a limited analysis of theformer was conducted. In particular, only questions 2,3,4, and 6 were analyzed.The results of this analysis are reported in Appendix A which was prepared byHt. Roger Anderson, Assistant to the Dean for Recruitment, New College. Theinformation is self-explanatory; however, it is interesting to note that "otherNew College students" and tne notstra 401.118S4UUS Oifice were the major source::,
of information to prospective students about New College. Flexibility, facultystudent relationships, size, calendar, and individualized academic programswere seen as "attractive" characteristics of New College. Given the type ofstudent who selects New College, (see previous discussion), we might have expectedthese to be attractive.
ACE galtionairet
Results of this questionaire have been discussed extensively in NCERO Report
#6.
Dasud upon a review of SAT sceres, high school deciles, and entrance testdata on entering freshmen, 1573-74, the following points might be made:(1) Ovcr .11, the leNvi. of ace:Th;to ;,chieve...cnt baszd on SAT scores hAn dropped
an averaze of 4 or 5% over atu:nts admitted the previous year. (2) The
mean high school decilo tor entorin3 ntudents was 3.5 and is approximately the
rl .-11 in cen2r;:l. (3) .4:It-Una ic.vcln of entcrie:,, frcsh=n
arc above avcrage over:111, but levels of comprehension are slightly below
overage. (4) Students selecting Eew College appear to be intellectuallymotivated, to have an interest in the pursuit of ideas rather than facts, and
to prefer the kind of social environment which they perceive exists at New
Collv.c.

- 9 -
BESTtors *ARABLE
RZFLIZoICES
Heist, Paul and Yonge, George. Omnibus Personality Inventory (Form F)The Psychological Corporation, 1968.

APPENDIX A
NEW COLLEGE OF HOFSTRA
WI COM WALEJurw 6, 1974
goluga 2: To what other schools did you apply? Were you accepted?
SCHOOL. NUMBER APPLYING NUMBER ACCEPTED
Adelphi 4 4
Beloit 1
Bowdoin 2 1
Brigham Young 1 1
Brown .1
Bucknell 1 1
C.C.N.Y. 1 1
Columbia 1 1
Cornell 2
Drew 1 2.
Florida State 1 1
Fordham 3 . 3
Franklin Pierce 1 1
Georgetown 1 1
George Washington 1 1.
Gettysburg 1 1
Hampshire 2 1
Hunter 1 1
Ithaca 4 4
New CollegeSarasota 1 1
New York Tech. 1 1
New York University 1 1
Ni,11.,ara 1 1
-lc-

4
BEST COM AVNIABLE
NEW COLLEGE OF HOFSTRA
Question 2: To what ocher schools did you apply? Were you accepted?
SCHOOL NUMBER APPLYING
P. 2
NUMBER ACCEPTED
Northeastern 1 1
Ohio State 2 2
Penn. State 1 1
Post 4 4
Queens College 1 1
Rider 1 1
R.P.I. 1 1
Rutgers 1 1
St. Johns 3 3
Sarah Lawrence 1
State University of Ncw York System
Albany 2 2
Binghampton 1 1
New Paltz 1
Oneonta 2 2
Potsdam 1 1
Purchase 1 1
Stony Brook 3 3
Nassau C.C. 1 1
Suffolk C.C. 1 1
Farmingdale 1 1
Syracuse 2 2
Temple 1 1.
-

BES1 COPY AVAILABLE
NEW COLLEGE OF HOFSTRAQuestion 2: To what other schools did you apply? Were you accepted?
SCHOOL
U. of Massachusetts
U. of Miami
U. of Pennsylvania
U. of Rhode Island
U. of Utah
.U. of Wisconsin
Vassar
Wagner
Windham
P. 3
NUMBER APPLYING NU14DER ACCEPTED
2 2
2 2
1 1
1 1
1 1
1 1
1 1
1.
.
1
1 1
.11

NEW COLLEGE OF HOFSTRA
OUESTION 3: How did you find out about New College?
BM CON AVAIIABLE
NUMBER OF STUDENTS FOUND OUT THROUCH
13 Another New College Student
9 Hofstra Univ. Admissions Office
8 Students Own Research
7 High School Guidance Counselor
5 Hofstra University Bulletin
2 Admissions RepresentativeHigh School Visit
2 College Night
1 College-For-A-Day
1 Not Sure
QUESTION 4: What thatacteristics of New College appear mostattractive to you?
FREQUENCY MENTIONED ChARACTERISTIC
10 Flexibility
10 Faculty Student Relationships
9 Size
8 Calendar
8 Individualized Academic Programa
7 Independent Study
6 Overn13 Structure
3 Part Of Large University
2 Blanket Tuition
1 Off - Campus Study1 Lncntion
Writing Progrnrn

,t 4
COrt AVAIIABLE
NEW COLLEGE OF HOFSTRA
QUESTION 6: What characteristics of New College appear leastattractive to you?
N.B. Since this question, and all the preceeding were askedduring Freshman Oriontaton, before anyone really knewthe ins and outs of the College, I do not feel that theresponses are reliable.
FREQUENCY MENTIONED CHARACTERISTIC
28 None
4 Part of Hofstra University
3 Other Students in New College
2 Too Academically Demanding
2 Socially Separated from Main Campus
2 Location
2 Having to take Courses on Main Campus
1 Tuition too High
1 Course Distribution (?)
1 Everyone Trying to Hard to BeInrovative

COri NOWA1'117.011 B
In an effort to rake New Collere recruitment more responsiveto trends and patterns, I have conducted an exhaustive study ofthose geographic regiwis which have yielded students to New Collegein the past. While I realize that "new areas" should not heoverlooked as possible sources of qualified students, I believethat with the limitations of budpet and tine, New Collegerecruitment should .concentrate on its areas of streneth. I willtrust that the University's Admissions office adequately andaccurately represent New College when visiting areas previouslyvirgin to Hofstra University. There is one exception to thisidea, and that will be delt with later it this report,
What follows then is a synthesis of a edriee:of charts,(also included), which I hope accurately tell the story of whereNew College students have cone from. The information containedherein has never been presented as such before, and vas obtainedby going through a series of annual and semi.annual reports, andlists of students, T have cnnsellmAnted rsny rhArts into a few,(five), but all details are available,
rollowing the synthesis in a series pf recommendations.It is hoped that these are accurate, but they are my own interpretation of the material, and therefore, I'm sure, are subject todebate,
With this in mind, I give you the past six years eNewCollege,

BEV cori AVAILABLE
Charts I and II 'Illustrate all those areas which have yielded students toNew ColLege over the past .six years. Charte I is what 1 consider to be primaryareas, while Chart II illustrates what IT. call secondary areas. We can see onChart I the importance of Nassau and Suffolk touutien yielding almost consistentlyhalf of the New College studeota. This io not serpising due to the publicityit originally had, and tha difference it exhibits. An interesting trend can benoted in the growth of importance in those five areas, outside New York State,which I coasider to be primary areas, (New Jersey, 'renesylvania, Connecticut,Massachueetta, and Rhoda Island). They are now yielding almost consistently307. of the New College students. While I have noted the entire ntate for apacenecessity, uo find coat of the students coming free this area arc centered aroundmetropolitan centers. The Queens, Brooklyn and New York City area is con-sistently low, though one would think it to be higher due to its proximity tothe Nassau and Suffolk area. I feel this is due to the virtual neglect ofthis area in a recruitoeut sense. Weetcheater County end its surrounding areasand other parte of New York State 'fluctuate y &eld from 51 to 10% of thestudent body in any given ;Tear.
Chart 11, the secondary areas, can be seen to be rather random. Howeverthree states, Maryland, Washington D.C. and Florida, seam to offer us one or twostudents almost consistently. Maryland and Washington D.C. can and shpuld be goodareas for us with the proper development. This is particularly true with thatcorridor streching from Baltimore, to D.C. This is an affluent area, concernedabout education. Florida's yield in due I believe to the good fortune ofobtaining one student in 1969 who, through her own efforts, has convinced others tocome.
Chart three is an illustration of those areas from which applied and acceptedstudents for this coming September have come. There are no significant differencesover previous years.
Chart TV is a comparison, again by geographic origin, of those studentaentering New College in 1972, and those entering the other undergraduate i*ees ofthe University in that same year. It is is interesting to note the greatei4,,dependence of the University on local students as compered to New College.Converaly New College gains in strength the further away from home we go.The entire university draws more students from Queens, Brooklyn and NewYork City, than does New Collage. This illustrates that the potential is there,it needs only to be tapped.
Chart V is put in pretty much out of general interest. I do howler:sr have
geographic areas broken down by areas of concentration. However there are no sig-nificant trends, and for the cdnservation of space, I did not include thisrather leruthy list.

Chart' : r.t(.2
/1, BEST COPY AVAILABLE
1968 1969 1970 1971 1972 1973x N x N %N % N % N 7. N
NASSAU 43 48.8 57 45.2 48 37.2 50
SUFFOLK 11 12.5 6 4.7 6 4.6 7
TOTAL 54 61.3 63 50.0 54 41.8 57
QUEENS 5 5.6 1.0 7.9 9 7.0 8
BROOKLYN 1 1.1 5 4.0 3 2.3 0
NEW YORK CITY 2 2.2 2 1.6 3 2.3 4
TOTAL 8 8.9 17 13.5 15 11.6 12
WESTCBESTER & SURR. 6 6.8 3 2.4 6 4.6 6
OTRER. N.Y. STATE 3 3.4 5 4.0 6 4.6 4
TOTAL 9 10.2 8 6.4 12 9.3 10
NEW JERSEY 7 7.9 4 3.1. 18 13.9 14
PENNSYLVANIA 5 5.6 14 11.1 5 3.9 12
CONNECTICUT 2 2.2 3 2.4 6 4.6 9
MASSACHUSETTS 1 1.1 4 3.1 12 9.3 4
MODE ISLAND 1 1.1 0 0 1.
TOTAL 16 17.9 25 19.8 41 31.7 40Of/ .41.114 ..Mr
GRAND TOTAL 87 98.9 3.13 89.7 122 94.6 119p . . 111114 .... ...Is .*
38.5 37 38.9 24 39.3
5.4 6 6.3 8 13.2
43.8 43 45.2 32 52.5
6.2 4 4.2 3 4.9
3 3.1. 1 1.6
3.0 2 2.1 0
9.2
4.6 3 3.1 1 1.6
3.0 5 5.3 3 4.9
7.6 8 8.4 4 6.541010
10.8 11 11.6 3 4.9
9.2 9 9.5 9 14.7
6.9 6 6.3 3 4,9
3.0 5 5.3 2 3.2
.8 1 1.1 0
30.7 32 33.7 17 27.81.144Pole .. . 0.
. 11.411111.~...0110.0
91.4 92 96.9 57 93.5

chart //str COPS'AV.NIABIE
1968
CANADA 1 1.1
1969F. 7.
1970N x
1971N
1972 1973N 7. N 7,
MAINE 1 .8
MARYLAND 3 2.4 4 3.1 1 .8 1 1.6I LLINO IS 3 2.4 2 1 . 5
VIRGINIA 1 .8 1 .8
DELAWARE 1 .8
FLORIDA 2 1.6 1 .8 1 .8 2 3.2WASHINGTON D.C. 1 .8 1 .8 1 1.6TEXAS 1 .8
ILLINOIS 1 .8 2 2.1LOUISIANA 1 .8
CALIFORNIA 1 .8ALABAMA 1 .8
wia, HAMPSHIRE 1 .8
NORTH CAROLINA 1 .8
MISSOURI1 1.1
ENGLAND 1 .8
4 'V %b'S Y. , 014 Jo - . ....J. se. ./.041.
3.1 4 6.5.tGRAND TOTAL 1 1.1 13 10.3 7 5.4 11 8.6 3
1 1 1 1 6 . 1 W ..1 . . . . . . P . %1 1 1 1

Citart
NASSAU
SUFFOLK
,.2-- ts/ '/1 ,Y
N
49 41,6
15 12.7
'arm. 64 54.30104401111p0M414141/11008010041",111441.011.110.001.011M.
QUEENS 4 3.3
BROOKLYN 1 .9
NEW YORK CITY 2 1.8
TOTAL 7 6.0111Moswom1011111MmerelellOamIliike01110~000
WESTCHESTER & SURR.
OTHER N.Y. STATE
TOTAL
5
4
9
N"?.W JERSEY 12
PENNSYLVANIA 10
CONNECTICUT 0
MASSACHUSETTS 11
RHO ISLAND 1.
DELAWARE
MARYLAND
4.2
3.3
7.5
10.2
8.5.
9.3
.9
TORL 34 28.9
1 .9
3 2.5
TOTAL 4 3.4*4* ~....vsirevwwor.r.s...
COrf NOBLE

.;har ta-1:f
e.,NASSAU
SUFFOLK
TOTAL
38.9
6 . 3
45. 2 69.0
QUZENS
BROOKLYN
NEW YORK CITY
TOTAL
4.2
3.1
. 2.1
9 . 5 16.0
WESTCHESTER 6i SURR. 3.1
OTHER N.Y. STATE 5.3
TOTAL 8.4 4.0
NEW JERSEY
PENNSYLVANIA
CONNECTICUT
MASSACHUSETTS
MODS ISLAND
DMZ& AREAS
TOTAL
11.6
9 . 5
6.3
5.3
1.1
3.2
36.9 11.0
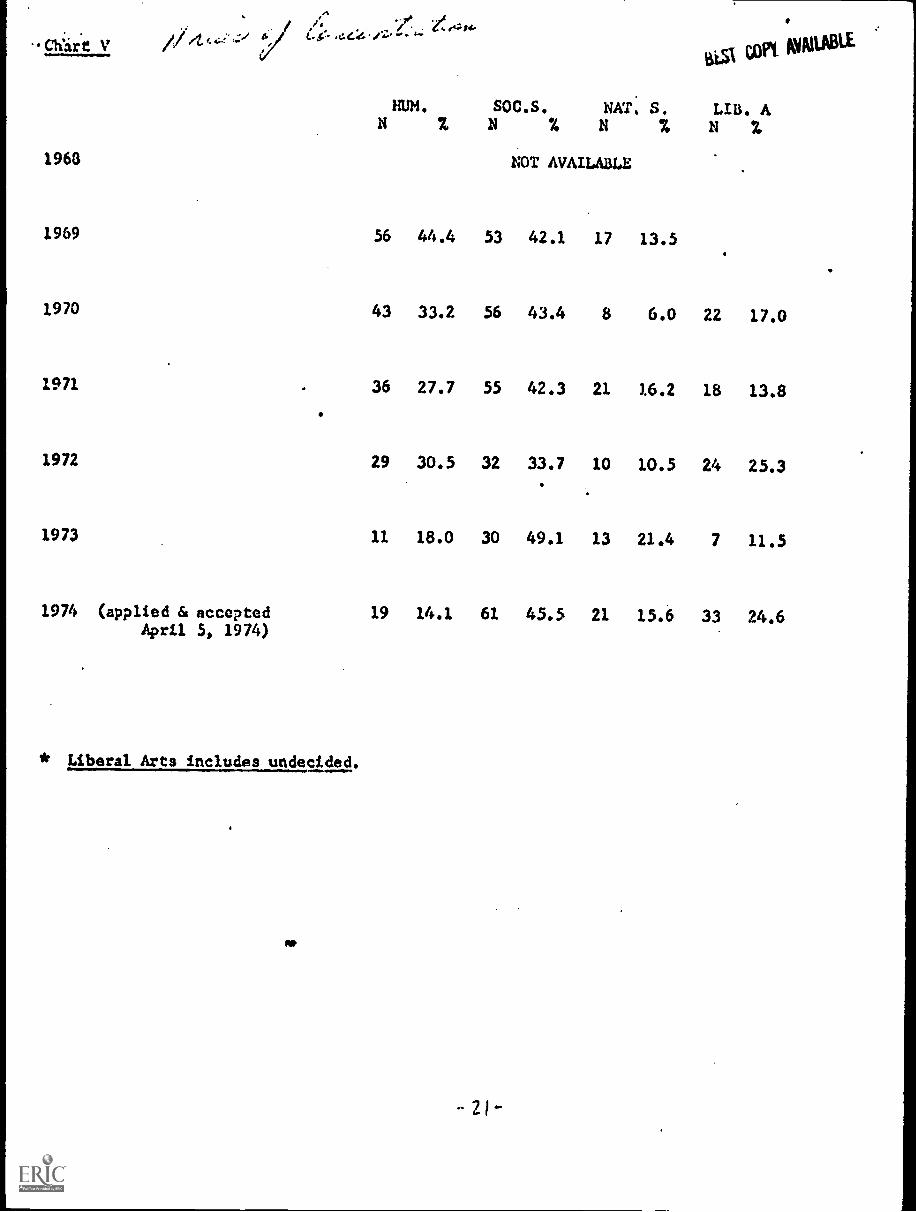
Ch'ire V
/ O.; /4.
HUM. SOC.S. NAT, S. LLB. AN N % N 7
196B NOT AVAILABLE
1969 56 44.4 53 42.1 17 13.5
1970 43 33.2 56 43.4 8 6.0 22 17.0
1971 36 27.7 55 42.3 21 1.6.2 18 13.8
1972 29 30.5 32 33.7 10 10.5 24 25.3
1973 11 18.0 30 49.1 13 21.4 7 11.5
1974 (applied & accepted 19 14.1 61. 45.5 21 15.6 33 24.6April 5, 1974)
* Liberal Arts includes undecided.

1101AVAIIIMI
RECnMMENDATTONSI
Based on the preceding information I would lilce to offer thefollowing recommendation's:
. I think it is obvious that New College must maintain on excellentrapport, and continue to do an exhaustive recruit:ins! effort inthe area of Nassau and Suffolk counties. This is irreritive,since these areas yield fifty percent of the New Collegestudent population.
- New College must build up the recruitnent activity in the areas ofQueens, Brooklyn, and New York City. The experience of the Universitas a whole has shown that this can be a valuable area, it needonly to be tapped.
- Westchester and the surrounding area can be important. Yetthere sees to be some problem in recruiting as rany as seempossible, I due not think this is due to a lack of recruitment.The University recruits quite extensively in this area, butwith results that differ little from ours,
- It is important te keep recruiting in the metropolitan areas ofNew Jersey, Connecticut, Pennsylvania, Yassachusetts and RhodeIsland, Thic now accounts for roughly thirty percent of theNew College entering class.
The exception with retard to the primary areas cores 'henconsidering the upstate New York //Tea, Tn..the past this hasnot yielded a great amount of students. But with the hopefulpassage of the Tuition Assistance Program, this is an areathat could be very valuable, and deserves some recrult9ent.. The secondary areas have alwilys been a random type of thine.But I think that work should be done in the areas of Baltimore,Maryland, and Washington D.C.