Embed Size (px)
Citation preview

1521-009X/41/5/1125–1133$25.00 http://dx.doi.org/10.1124/dmd.112.050617DRUG METABOLISM AND DISPOSITION Drug Metab Dispos 41:1125–1133, May 2013Copyright ª 2013 by The American Society for Pharmacology and Experimental Therapeutics
Tissue Distribution and Identification of Radioactivity Componentsat Elimination Phase after Oral Administration of [14C]CS-1036,
an a-Amylase Inhibitor, to Rats s
Tomohiro Honda, Hideo Takakusa, Takahiro Murai, and Takashi Izumi
Drug Metabolism & Pharmacokinetics Research Laboratories, R&D Division (T.H., H.T., T.I.), and Corporate Strategy Department,Corporate Strategy Division (T.M.), Daiichi Sankyo Co., Ltd., Tokyo, Japan
Received December 7, 2012; accepted March 1, 2013
ABSTRACT
(2R,3R,4R)-4-hydroxy-2-(hydroxymethyl)pyrrolidin-3-yl 4-O-(6-deoxy-b-D-glucopyranosyl)-a-D-glucopyranoside (CS-1036) is a potent in-hibitor of pancreatic and salivary a-amylase. After oral administrationof [14C]CS-1036 to rats, the radioactivity was still detectable up to7–14 days after administration in various tissues, and its terminalphase in plasma could be explained neither by the exposure ofCS-1036 nor its major metabolite M1. The slow elimination ofradioactivity in various tissues was hypothesized to be caused bycovalent binding to macromolecules or use for biogenic compo-nents. To assess the use for biogenic components, amino acidanalysis of plasma proteins and lipid analysis of adipose tissuewere conducted after repeated oral administration of [14C]CS-1036by high-performance liquid chromatography and acceleratedmass spectrometry and by thin layer chromatography and liquid
chromatography/mass spectrometry, respectively. In amino acidanalysis, glutamic acid, aspartic acid, alanine, and proline wereidentified as major radioactive amino acids, and radioactivenonessential amino acids occupied 76.0% of the radioactivity. Inlipid analysis, a part of the radioactive lipids were identified as thefatty acids constituting the neutral lipids by lipase-hydrolysis. Theradioactive fatty acids from neutral lipids were identified as palmiticacid, oleic acid, and 8,11,14-eicosatrienoic acid. Intestinal florawere involved in CS-1036 metabolism and are indicated to beinvolved in the production of small molecule metabolites, which arethe sources for amino acids and fatty acids, from [14C]CS-1036. Inconclusion, radioactivity derived from [14C]CS-1036 was incorpo-rated as the constituents of amino acids of plasma proteins andfatty acids of neutral lipids.
Introduction
(2R,3R,4R)-4-hydroxy-2-(hydroxymethyl)pyrrolidin-3-yl 4-O-(6-de-oxy-b-D-glucopyranosyl)-a-D-glucopyranoside (CS-1036) is a noveland potent inhibitor of pancreatic and salivary a-amylase in rats andhumans (Honda et al., 2013). CS-1036 is expected to inhibit starchdigestion in diets via a-amylase inhibition, which leads to the sup-pression of postprandial glucose elevation.After oral administration of [14C]CS-1036 (Fig. 1A) in rats, radio-
activity was mainly excreted in feces (80.28% of the dose) (Hondaet al., 2013). On the other hand, urine was the main route of excretionfrom the systemic circulation, and 77.21% of the dose was excretedafter intravenous administration. CS-1036 exhibited linear pharmaco-kinetics in intravenous and oral administration (0.3–10 mg/kg) with lowclearance (2.67–3.44 ml/min/kg), low volume of distribution (0.218–0.237 l/kg), and low oral absorption (bioavailability: 1.73%–2.44%).CS-1036 was metabolized by intestinal flora but not in hepatic, renal,and intestinal S9 fractions. The main metabolite of CS-1036, M1 (Fig.1B), was absorbed, and the absorbed fraction of M1 was mainly excretedin urine (5.3% of the dose up to 24 hours after oral administration of[14C]CS-1036) (Honda et al., 2013).
In the present study, the tissue distribution of radioactivity wasevaluated after oral administration of [14C]CS-1036, and the causes ofslow elimination of radioactivity were investigated. In some cases,slow elimination of radioactivity after the treatment of a radiolabeledcompound is caused by covalent binding to macromolecules (Zhanget al., 2005; Takakusa et al., 2008). However, the covalent bindingwas not expected for CS-1036, because CS-1036 had not beenmetabolized in the liver, kidney, and intestine. Then, to assess the usefor biogenic components, the amino acid analysis of plasma proteinsafter oral administration of [14C]CS-1036 was conducted to identifythe radioactive amino acids semiqualitatively with use of high-performance liquid chromatography (HPLC) and accelerated massspectrometry (AMS), which is used for the detection of a smallamount of 14C (Kitagawa et al., 1993). Furthermore, the lipid analysisof the adipose tissue after oral administration of [14C]CS-1036 wasperformed by 2-dimensional thin layer chromatography (2D-TLC),and liquid chromatography/tandem mass spectrometry (LC-MS/MS).
Materials and Methods
Materials. [14C]CS-1036 (41.9, 42.2, 42.4, and 63.5 mCi/mg; radiochemicalpurity: 98.6% or 98.5%) was synthesized at GE Healthcare UK Ltd. (Buck-inghamshire, UK) and Sekisui Medical Co., Ltd. (Tokyo, Japan). Phenyl-isothiocyanate and phenylthiocarbamyl (PTC)–amino acid mobile phase A and B
dx.doi.org/10.1124/dmd.112.050617.s This article has supplemental material available at dmd.aspetjournals.org.
ABBREVIATIONS: 2D-TLC, 2-dimensional thin layer chromatography; 2-NPH, 2-nitrophenylhydrazine; AMS, accelerator mass spectrometry; CS-1036, (2R,3R,4R)-4-hydroxy-2-(hydroxymethyl)pyrrolidin-3-yl 4-O-(6-deoxy-b-D-glucopyranosyl)-a-D-glucopyranoside; HCl, hydrochloric acid;HPLC, high-performance liquid chromatography; LC-MS/MS, liquid chromatography/tandem mass spectrometry; LSC, liquid scintillation counting;PTC, phenylthiocarbamyl; RAD, radioactivity detector; TCA, tricarboxylic acid.
1125
http://dmd.aspetjournals.org/content/suppl/2013/03/01/dmd.112.050617.DC1Supplemental material to this article can be found at:
at ASPE
T Journals on June 21, 2018
dmd.aspetjournals.org
Dow
nloaded from

were purchased from Wako Pure Chemical Industries, Ltd. (Osaka, Japan). Lipasefrom porcine pancreas (type II) was purchased from Sigma-Aldrich Co. (St.Louis, MO). 2-Nitrophenylhydrazine (2-NPH) hydrochloride and 1-ethyl-3-(3-dimethylaminopropyl)carbodiimide hydrochloride were purchased from TokyoChemical Industry Co., Ltd. (Tokyo, Japan). Other reagents and solvents usedwere commercially available and either of guaranteed grade, extra pure reagentgrade, amino acid analysis grade, volumetric analysis grade, LC/MS grade, orHPLC grade.
Animals. All animal studies were conducted with approval in accordancewith the guidelines of the Institutional Animal Care and Use Committeeof Daiichi Sankyo. Male F344/DuCrlCrlj rats at 7 weeks of age, purchasedfrom Charles River Laboratories Japan, Inc. (Kanagawa, Japan), were usedafter 5 or 6 days of acclimatization. Diets were freely accessed during theacclimatization. Water was given ad libitum throughout the acclimatization andexperiment.
Sample Collection for Radioactivity Concentration-Time Profiles of[14C]CS-1036 in Rats. [14C]CS-1036 (5 mg/kg, 209 mCi/kg) was administeredorally to overnight-fasted rats (n = 4). Food was given 8 hours after doseadministration. Blood samples were taken from the jugular vein at designatedtime points up to 72 hours after dose administration under diethyl etheranesthesia. Blood samples were centrifuged to obtain plasma, and the plasmasamples were subjected to radioactivity measurement.
Sample Collection for Tissue Distribution of Radioactivity in Rats.[14C]CS-1036 (5 mg/kg, 319 mCi/kg) was administered orally to rats (159–167 g;n = 3). After administration, blood samples were taken from the abdominal aortaat 1, 4, 8, 24, 72, 168, and 336 hours after dose administration. Subsequently, theliver, kidney, spleen, white adipose tissue, pancreas, cerebrum, and mandibulargland were collected from each rat and then subjected to radioactivitymeasurement. A part of each blood sample was centrifuged to obtain plasma.
Sample Collection for Amino Acid Analysis of Proteins and Fatty AcidAnalysis of Lipids. [14C]CS-1036 (10 mg/kg/day, 422 mCi/kg/day, or 424mCi/kg/day) was administered orally and repeatedly for 4 or 5 days at 24-hour intervals (4 or 5 doses, respectively) to rats (166–189 g; n = 3 each).Food was freely accessed throughout the experiments. For the proteinanalysis, blood samples were taken from the aorta abdominalis at 24 hoursafter the fifth administration under diethyl ether inhalation. Then, theplasma samples prepared by centrifugation were pooled. For the lipidanalysis, the white adipose tissue was collected at 24 hours after the fourthadministration under diethyl ether inhalation. For both amino acid and fattyacid analysis, the control samples were collected from rats without drugtreatment.
Hydrochloric Acid (HCl)–Hydrolysis of Plasma Sample. Aliquots of 0.5ml of the pooled plasma sample and control plasma sample were mixed with 5ml of acetonitrile and homogenized using a supersonic homogenizer (VP-30S,
Taitec Co., Ltd.; Saitama, Japan). After centrifugation at 1870 g for 10 minutesat 4°C (CF7D2, Hitachi Koki Co., Ltd.; Tokyo, Japan) and the removal of thesupernatant, the plasma protein pellets were washed with a series of solvents(0.4 M trichloroacetic acid, 80% methanol in water, and 30% ether in ethanol)to remove any unbound radioactivity from protein fraction (Henesey et al.,1999). The washes were repeated until the supernatants contained less thantwice the background radioactivity, as determined by liquid scintillationcounting (LSC). The pellets were dried under a flow of nitrogen gas, and thendried under reduced pressure (Bio Freeze Drier, Model BFD-2, Nihon FreezerCo., Ltd.; Tokyo, Japan).
The following procedure for the HCl-hydrolysis was performed according tothe reported method (Smith and Stockell, 1954) with minor modifications. Apart of the dried pellet samples (c.a. 5 mg) was mixed with 6 N HCl (1 ml of 6N HCl per 3 mg of the pellet). After replacement by nitrogen gas, the samplewas heated in an oil bath at 110°C for 24 hours. After the sample was cooled toroom temperature, the sample was evaporated using a rotary evaporator. Afterthe addition of 5 ml of purified water, the sample was evaporated again. Afterthe addition of 5 ml of purified water, the sample was freeze-dried (Bio FreezeDrier, Model BFD-2). Each freeze-dried sample was dissolved with 3 ml ofpurified water. The prepared HCl-hydrolyzed samples were used for furtherchemical derivatization. Aliquots of 0.3 ml of the HCl-hydrolyzed sampleprepared from the pooled plasma sample were transferred into LSC vials forradioactivity measurement.
PTC-Derivatization of HCl-Hydrolyzed Plasma Samples. The followingprocedure for the PTC-derivatization was performed according to the reportedmethod (Heinrikson and Meredith, 1984; Ng et al., 1987) with minormodifications. Aliquots of 30 ml of HCl-hydrolyzed samples of pooled plasmaand control plasma and aliquots of 10 ml of amino acid mixture standardsolution were evaporated using a centrifugation evaporator. Aliquots of 20 mlof ethanol/water/triethylamine (2/2/1, v/v/v) were added to each sample andevaporated. For PTC-derivatization of amino acids, aliquots of 50 ml ofethanol/water/triethylamine/phenylisocyanate (7/1/1/1, v/v/v/v) were added toeach sample and left standing at room temperature for 20 minutes. Afterevaporation, 0.5 ml of PTC-derivatized amino acid mobile phase A was addedto each sample for the HPLC sample preparation of PTC-derivatized aminoacid samples.
Amino Acid Analysis. On the basis of the reported method (Bidlingmeyeret al., 1984; Heinrikson and Meredith, 1984; Cohen et al., 1986; Ng et al.,1987), PTC-derivatized amino acid samples were analyzed and fractionatedusing an HPLC system (LC10Avp series, Shimadzu Corp.; Kyoto, Japan) forthe radioactivity measurement using AMS. The analytical conditions forHPLC were as follows: analytical column, Wakosil PTC (4.0 mm � 200 mm;Wako Pure Chemical Industries, Ltd.); column oven temperature, 40°C;mobile phase A, PTC-amino acid mobile phase A; mobile phase B, PTC-amino acid mobile phase B; flow rate, 1 ml/min; gradient of mobile phase B,5%–75% from 0–15 minutes (linear), 75%–100% from 15–20 minutes;injection volume, 50 ml; and UV detection, 254 nm. The HPLC eluates ofPTC-derivatized amino acid samples for 14C-containing and control plasmasamples were fractionated from 0 to 15 minutes in tared tubes at 6-secondintervals (150 fractions for each sample), and their UV-chromatograms werealso recorded.
AMS measurement was performed according to the reported method(Kitagawa et al., 1993) with use of an NEC 1.5SDH-1 0.6MV Pelletron AMSsystem (National Electrostatics Corp.; Middleton, WI). 14C-containing andcontrol plasma samples for AMS measurement were 10-fold diluted withultrapure water. Aliquots of 10 ml of diluted sample for HPLC, 50 ml of dilutedHPLC eluate sample, and 10 ml of fractionated HPLC eluate samples wereadded to 25 ml of carrier carbon (170 mg/ml sodium benzoate aqueoussolution). The 14C-concentration (sample 14C dpm/g or ml) in the test samplewas calculated with Sample 14C (dpm) and aliquot size (g or ml) in thefollowing equation:
Sample14C ðdpm=g or mlÞ ¼ Sample14C ðdpmÞAliquot ðg or mlÞ
The 14C-concentration derived from the drug (Drug 14C dpm/g or ml) wascalculated as follows:
Fig. 1. Chemical structure of [14C]CS-1036 (A) and its metabolite, M1 (B).
1126 Honda et al.
at ASPE
T Journals on June 21, 2018
dmd.aspetjournals.org
Dow
nloaded from
Drug14C ðdpm=g or mlÞ ¼ Sample14C ðdpm=g or mlÞ2Background14C ðdpm=g or mlÞ
where, background 14C was obtained from the control samples.The 14C-content in the HPLC fraction (Fraction 14C) was calculated as
follows:
Fraction14C ðdpm=fractionÞ ¼ Drug14C ðdpm=gÞ �W ðg=fractionÞ
where, W (g/fraction) was the weight of each fraction.The ratio of radioactivity in each HPLC fraction was calculated as follows:
Ratio ð%Þ ¼ Fraction14C ðdpm=fractionÞ � 100�14CA ðdpm=mlÞ � Vinjected ðmlÞ�
where, 14CA (dpm/ml) and Vinjected (ml) were the radioactivity of the HPLCeluate sample and its injected volume for fractionation (50 ml). The retentiontime of each PTC-derivatized amino acid peak was confirmed by comparing theUV-chromatograms of reference amino acid standards.
Lipid Extraction from Adipose Tissue. After addition of approximately 4-fold volume of phosphate-buffered saline (pH 7.4) to the tissue weight toadipose tissue, the adipose homogenate was prepared. The extraction of lipidswas performed according to the reported method (Folch, 1942). Approximately40 ml of chloroform/methanol (2/1, v/v) solution was added to 2 ml of adiposehomogenate, and the sample was shaken for over 1 hour. The sample wasfiltered, and approximately 1/5 volume of 0.1% potassium chloride solution tothe total sample volume was added. After shaking the sample for liquid-liquidextraction, the sample was centrifuged, and the lower phase of the sample wascollected. To concentrate the sample, the sample was evaporated and re-constituted with approximately 1 ml of chloroform/methanol (2/1, v/v) solution.Then, 0.02 ml of each lipid sample was transferred to an LSC vial. For thesample preparation of TLC, 0.5 ml of pooled lipid sample and control lipidsample from adipose tissue were evaporated and reconstituted with 0.5 ml ofchloroform/methanol (2/1, v/v) solution.
Lipid Hydrolysis by Lipase. Aliquots of 1 ml of adipose homogenatesamples were mixed with 0.1 ml taurocholate solution (final: 25 mM), 5 ml ofcalcium chloride solution (final: 12.5 mM), and 0.1 ml of porcine lipasesuspension (final: 8.33 mg/ml) and incubated at 37°C overnight. Then, 20 mlof chloroform/methanol (2/1, v/v) solution was added, and the lipase-treatedlipid samples were prepared in the same way as described above. In thereconstitution of lipase-treated lipid sample after evaporation of the lower phasein liquid-liquid extraction, 0.2 and 0.5 ml of chloroform/methanol (2/1, v/v)solution were added to lipase-treated lipid samples and its control sample,respectively. In addition, the recovery of radioactivity in the upper phase wasmeasured by LSC.
Lipid Analysis by 2D-TLC. Aliquots of 10 ml of the lipid samples and thelipase-treated lipid samples were spotted on the TLC plate (20 cm � 20 cm;Silica gel 60, No. 1.05721.0009; Merck KgaA; Darmstadt, Germany). The TLCplate was placed in a bath with a mobile phase, chloroform/methanol/28%aqueous ammonia = 65/35/5 (v/v/v), for the first dimension run. After the firstrun, the TLC plate placed in the bath with a mobile phase, chloroform/acetone/methanol/acetic acid/water = 5/2/1/1/0.5 (v/v/v/v/v), for the second dimensionrun. For the detection of lipid spots by UV light irradiation, 0.03% rhodamine6G in 95% ethanol solution was sprayed on the TLC plate. The radioactivity onthe TLC plate was analyzed using a bioimaging analyzer, BAS-2500 (FujifilmCorp.; Tokyo, Japan). Each lipid was identified by comparing each chromato-gram with that of the standards and the map of lipid spots (Rouser et al., 1976).
Lipid Hydrolysis and Derivatization of Fatty Acids. Lipid hydrolysis andderivatization of fatty acids were performed according to the reported method(Miwa, 2002) with minor modifications. The lipid sample extracted fromadipose tissue was diluted 100-fold with ethanol. Aliquots of 0.2 ml of thediluted lipid sample were mixed with 0.1 ml of 0.4 M potassium hydroxide(KOH)/ethanol (1/1, v/v) solution and incubated at 80°C for 20 minutesfor hydrolysis. Then, the sample was mixed with 0.2 ml of 20 mM 2-NPH in0.3 M HCl/ethanol (1/1, v/v) solution and 0.2 ml of 250 mM 1-ethyl-3-(3-dimethylaminopropyl)carbodiimide in pyridine/ethanol (3/97, v/v) solution andincubated at 80°C for 5 minutex. After incubation, 50 ml of 10% KOH inmethanol/water (1/1, v/v) solution was added and incubated again at 80°C for 5
minutes. After the sample was cooled at room temperature, 4 ml of 33 mMphosphate buffer (pH 6.4)/0.5 M HCl (3.8/0.4, v/v) and 5 ml of n-hexane wereadded. After shaking the sample for liquid-liquid extraction, the sample wascentrifuged and the upper organic phase was collected. The sample wasevaporated and reconstituted by ethanol to prepare the 2-NPH derivatized fattyacid sample out of the lipid sample extracted from adipose tissue. In the sameway as described above, 2-NPH derivatized fatty acid standards for the fattyacid analysis were prepared.
Preparation of Fatty Acid Samples for Analysis by RadioactivityDetector (RAD) Equipped with HPLC and MS. Ethanol solution of the 2-NPH derivatized fatty acid sample (400 ml) was evaporated, reconstituted byacetonitrile (80 ml), and centrifuged at 21,600 g for 3 minutes at 4°C. Then, thesupernatant was subjected to LC-RAD and LC-MS analysis (injection volume:50 ml). In addition, 30 ml of the supernatant was diluted with acetonitrile (270ml) and subjected to LC-MS and LC-MS/MS analyses (injection volume: 5 ml).In addition, 2-NPH derivatized fatty acid standards were also subjected to LC-MS and LC-MS/MS analyses.
Identification of Fatty Acid by RAD and MS. Fatty acid analysis wasperformed using an HPLC system (Alliance 2695 separations module coupledwith a 2996 photodiode array detector; Waters Corp.; Milford, MA) equippedwith an RAD (Radiomatic 500TR; Perkin Elmer, Inc.; Waltham, MA) and anMS (Q-Tof Ultima mass spectrometer; Waters Corp.). The analytical conditionswere as follows: analytical column, Inertsil C8-3 (4.6 mm � 250 mm, 5 mm-GL Sciences Inc.; Tokyo, Japan); column oven temperature, 30°C; mobilephase A, water; mobile phase B: acetonitrile; flow rate of mobile phase forHPLC, 1 ml/min; split ratio of the eluent, 1/5 to MS and 4/5 to RAD; gradientelution condition for the mobile phase B, 85% from 0 to 20 minutes (constant),85%–95% for 20–30 minutes (linear), 85% from 30.1 to 40 minutes (constant);liquid scintillation cocktail, Ultima-Flo M (PerkinElmer, Inc.); flow rate ofliquid scintillation cocktail: 3 ml/min, mixed with the eluate from HPLC;capillary voltage, 3 kV; cone voltage: 80 V; collision energy 10 eV (for LC-MSanalysis) or 25 eV (for LC-MS/MS analysis); analytical software for RAD: Flo-One for Windows (version 3.65); and analytical software for MS: MassLynx(version 4.1; Waters Corp.).
Radioactivity Measurement by LSC. In the tissue distribution study, blood(0.1 ml) was mixed with benzene saturated with 0.4 ml of benzoyl peroxide(Wako Pure Chemical Industries, Ltd.), 2 ml of Soluene-350 (PerkinElmerInc.), and 10 ml of Hionic-Fluor (PerkinElmer Inc.). Plasma (0.1 ml) was mixedwith tissue solubilizer (2 ml of Soluene-350) and 10 ml of Hionic-Fluor. Thecerebrum, liver, and kidney were weighed and homogenized with a 2-foldvolume of saline. Then, an aliquot of the homogenate (0.5 ml) was weighed andsolubilized with 2 ml of Soluene-350, followed by the addition of 10 ml ofHionic-Fluor. For the other tissues, the entire tissues or a portion of tissues wereweighed and mixed with 2 ml of Soluene-350 and 10 ml of Hionic-Fluor. Forthe other study, the blood, plasma, adipose tissue, lipid, upper phase of lipidextract, and HCl-hydrolyzed samples in LSC vials were mixed with tissuesolubilizer (1 ml of NCS-II; GE Healthcare UK Ltd.; Buckinghamshire, UK),followed by the addition of a scintillation cocktail (10 ml of Hionic-Fluor). Thesamples were subjected to radioactivity measurement by LSC using a Tri-carb307 counter or 2900TR counter (PerkinElmer, Inc.). The counting efficiencywas corrected by the external standard source method. The concentrations ofradioactivity (ng equivalent of CS-1036/ml or g tissue) were calculated usingthe specific activity of [14C]CS-1036, the radioactivity of each sample, and thevolume or weight of each sample in the LSC vial.
Data Calculation. The concentrations of radioactivity (dpm/ml or g tissue)in the plasma and adipose samples were calculated by the radioactivity of eachsample divided by the volume or weight of each sample in the LSC vial. Theconcentrations of radioactivity (ng equivalent of CS-1036/ml or g tissue) in theplasma and adipose samples were calculated from the concentrations ofradioactivity of each sample (dpm/ml or g tissue) and the specific activity of14C-CS-1036.
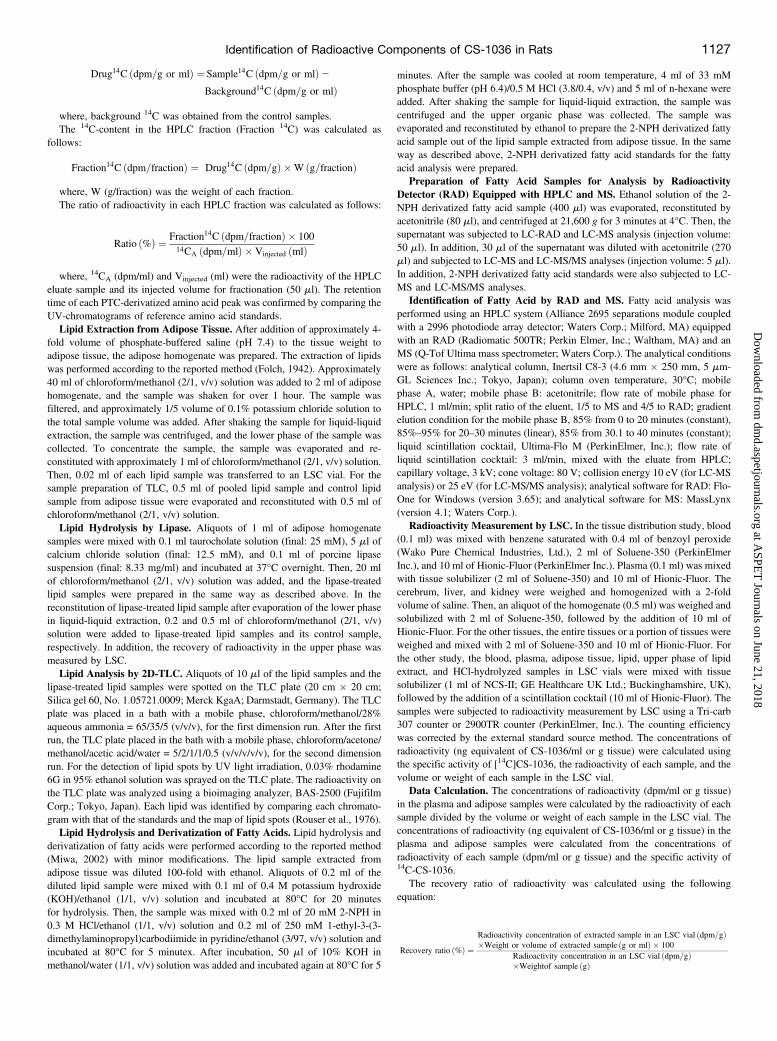
The recovery ratio of radioactivity was calculated using the followingequation:
Recovery ratio ð%Þ ¼Radioactivity concentration of extracted sample in an LSC vial ðdpm=gÞ�Weight or volume of extracted sample ðg or mlÞ � 100
Radioactivity concentration in an LSC vial ðdpm=gÞ�Weightof sample ðgÞ
Identification of Radioactive Components of CS-1036 in Rats 1127
at ASPE
T Journals on June 21, 2018
dmd.aspetjournals.org
Dow
nloaded from
Results
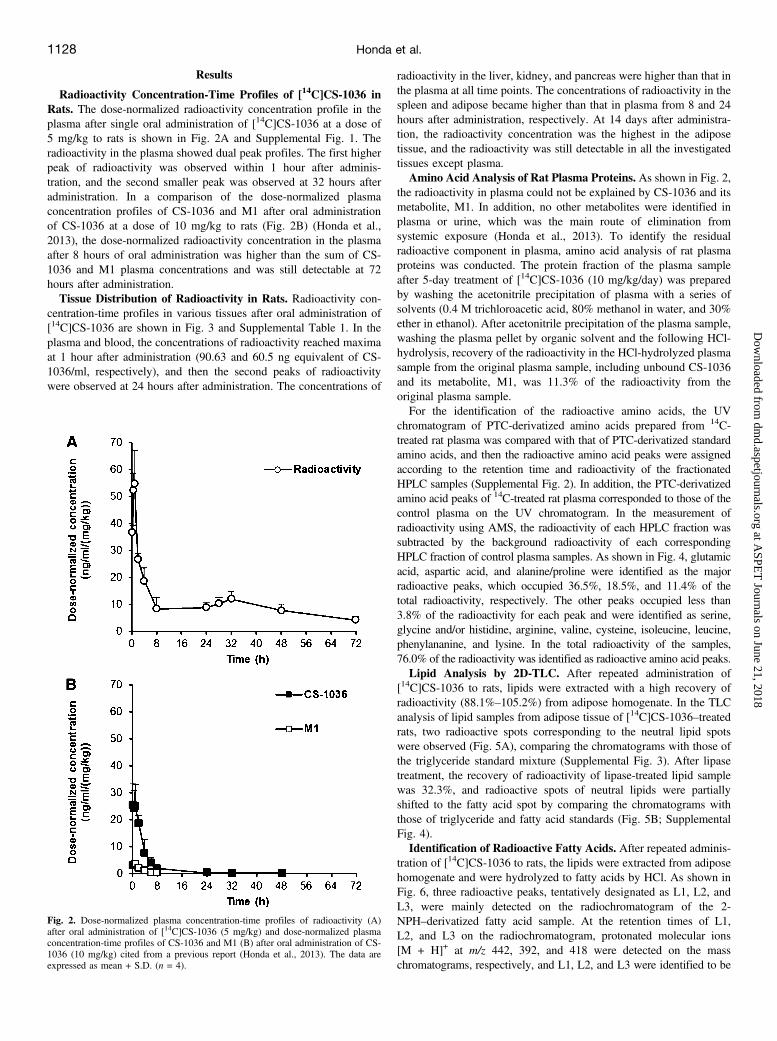
Radioactivity Concentration-Time Profiles of [14C]CS-1036 inRats. The dose-normalized radioactivity concentration profile in theplasma after single oral administration of [14C]CS-1036 at a dose of5 mg/kg to rats is shown in Fig. 2A and Supplemental Fig. 1. Theradioactivity in the plasma showed dual peak profiles. The first higherpeak of radioactivity was observed within 1 hour after adminis-tration, and the second smaller peak was observed at 32 hours afteradministration. In a comparison of the dose-normalized plasmaconcentration profiles of CS-1036 and M1 after oral administrationof CS-1036 at a dose of 10 mg/kg to rats (Fig. 2B) (Honda et al.,2013), the dose-normalized radioactivity concentration in the plasmaafter 8 hours of oral administration was higher than the sum of CS-1036 and M1 plasma concentrations and was still detectable at 72hours after administration.Tissue Distribution of Radioactivity in Rats. Radioactivity con-
centration-time profiles in various tissues after oral administration of[14C]CS-1036 are shown in Fig. 3 and Supplemental Table 1. In theplasma and blood, the concentrations of radioactivity reached maximaat 1 hour after administration (90.63 and 60.5 ng equivalent of CS-1036/ml, respectively), and then the second peaks of radioactivitywere observed at 24 hours after administration. The concentrations of
radioactivity in the liver, kidney, and pancreas were higher than that inthe plasma at all time points. The concentrations of radioactivity in thespleen and adipose became higher than that in plasma from 8 and 24hours after administration, respectively. At 14 days after administra-tion, the radioactivity concentration was the highest in the adiposetissue, and the radioactivity was still detectable in all the investigatedtissues except plasma.Amino Acid Analysis of Rat Plasma Proteins. As shown in Fig. 2,
the radioactivity in plasma could not be explained by CS-1036 and itsmetabolite, M1. In addition, no other metabolites were identified inplasma or urine, which was the main route of elimination fromsystemic exposure (Honda et al., 2013). To identify the residualradioactive component in plasma, amino acid analysis of rat plasmaproteins was conducted. The protein fraction of the plasma sampleafter 5-day treatment of [14C]CS-1036 (10 mg/kg/day) was preparedby washing the acetonitrile precipitation of plasma with a series ofsolvents (0.4 M trichloroacetic acid, 80% methanol in water, and 30%ether in ethanol). After acetonitrile precipitation of the plasma sample,washing the plasma pellet by organic solvent and the following HCl-hydrolysis, recovery of the radioactivity in the HCl-hydrolyzed plasmasample from the original plasma sample, including unbound CS-1036and its metabolite, M1, was 11.3% of the radioactivity from theoriginal plasma sample.For the identification of the radioactive amino acids, the UV
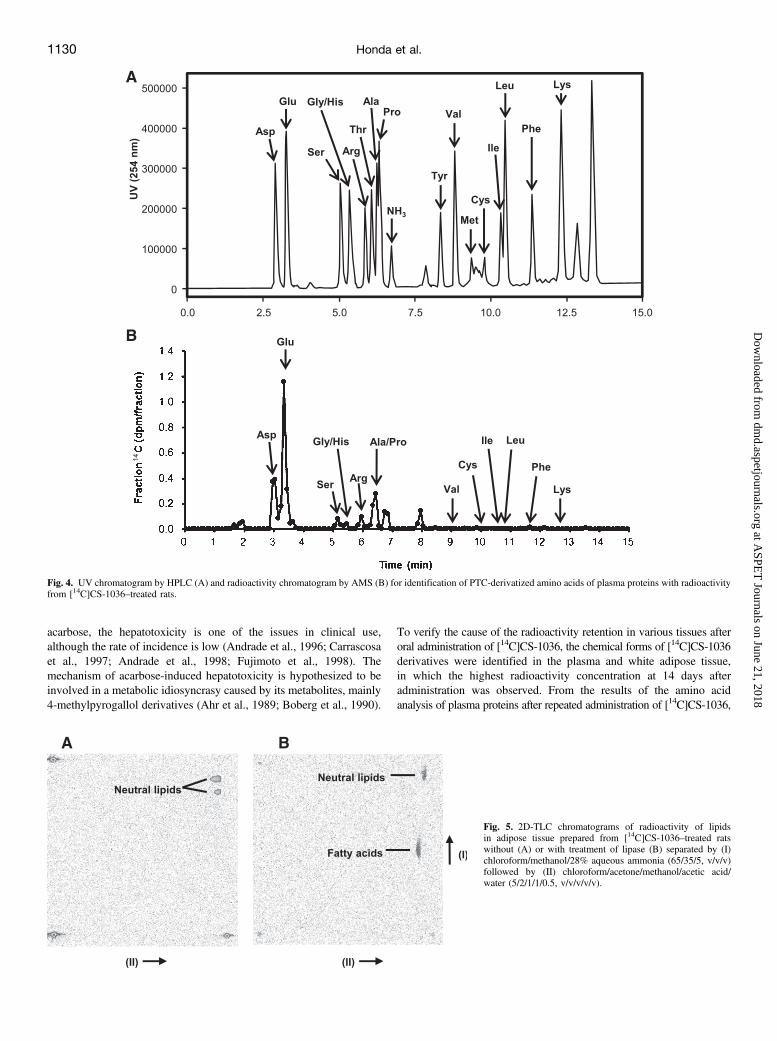
chromatogram of PTC-derivatized amino acids prepared from 14C-treated rat plasma was compared with that of PTC-derivatized standardamino acids, and then the radioactive amino acid peaks were assignedaccording to the retention time and radioactivity of the fractionatedHPLC samples (Supplemental Fig. 2). In addition, the PTC-derivatizedamino acid peaks of 14C-treated rat plasma corresponded to those of thecontrol plasma on the UV chromatogram. In the measurement ofradioactivity using AMS, the radioactivity of each HPLC fraction wassubtracted by the background radioactivity of each correspondingHPLC fraction of control plasma samples. As shown in Fig. 4, glutamicacid, aspartic acid, and alanine/proline were identified as the majorradioactive peaks, which occupied 36.5%, 18.5%, and 11.4% of thetotal radioactivity, respectively. The other peaks occupied less than3.8% of the radioactivity for each peak and were identified as serine,glycine and/or histidine, arginine, valine, cysteine, isoleucine, leucine,phenylananine, and lysine. In the total radioactivity of the samples,76.0% of the radioactivity was identified as radioactive amino acid peaks.Lipid Analysis by 2D-TLC. After repeated administration of
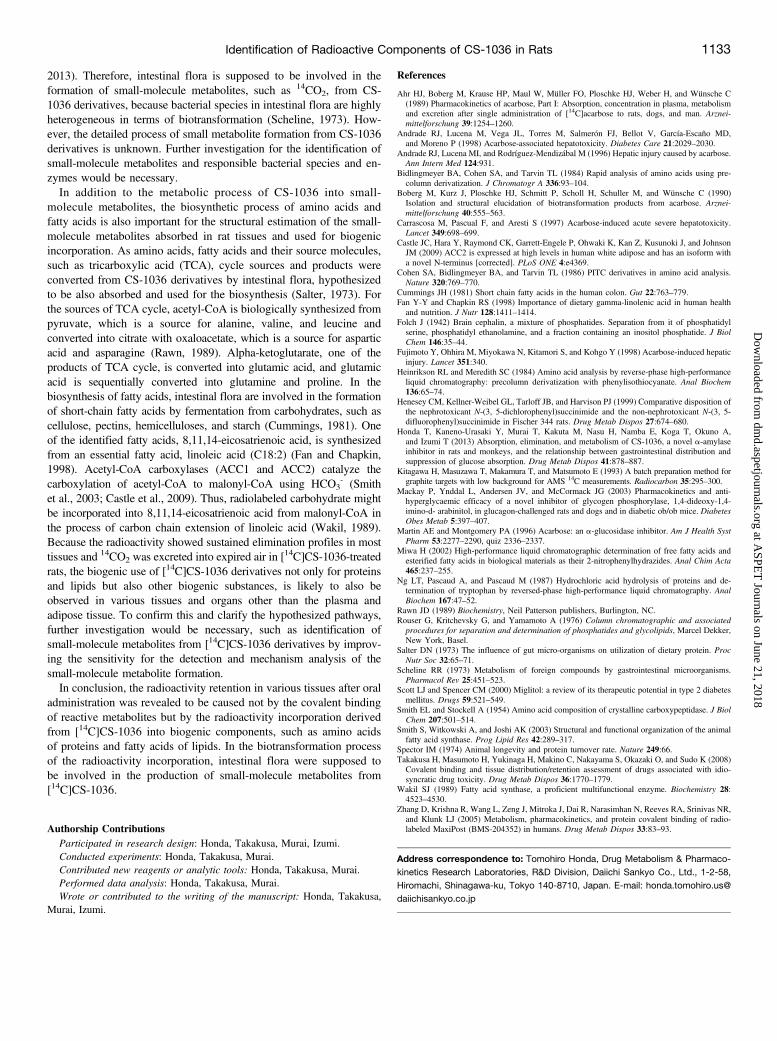
[14C]CS-1036 to rats, lipids were extracted with a high recovery ofradioactivity (88.1%–105.2%) from adipose homogenate. In the TLCanalysis of lipid samples from adipose tissue of [14C]CS-1036–treatedrats, two radioactive spots corresponding to the neutral lipid spotswere observed (Fig. 5A), comparing the chromatograms with those ofthe triglyceride standard mixture (Supplemental Fig. 3). After lipasetreatment, the recovery of radioactivity of lipase-treated lipid samplewas 32.3%, and radioactive spots of neutral lipids were partiallyshifted to the fatty acid spot by comparing the chromatograms withthose of triglyceride and fatty acid standards (Fig. 5B; SupplementalFig. 4).Identification of Radioactive Fatty Acids. After repeated adminis-
tration of [14C]CS-1036 to rats, the lipids were extracted from adiposehomogenate and were hydrolyzed to fatty acids by HCl. As shown inFig. 6, three radioactive peaks, tentatively designated as L1, L2, andL3, were mainly detected on the radiochromatogram of the 2-NPH–derivatized fatty acid sample. At the retention times of L1,L2, and L3 on the radiochromatogram, protonated molecular ions[M + H]+ at m/z 442, 392, and 418 were detected on the masschromatograms, respectively, and L1, L2, and L3 were identified to be
Fig. 2. Dose-normalized plasma concentration-time profiles of radioactivity (A)after oral administration of [14C]CS-1036 (5 mg/kg) and dose-normalized plasmaconcentration-time profiles of CS-1036 and M1 (B) after oral administration of CS-1036 (10 mg/kg) cited from a previous report (Honda et al., 2013). The data areexpressed as mean + S.D. (n = 4).
1128 Honda et al.
at ASPE
T Journals on June 21, 2018
dmd.aspetjournals.org
Dow
nloaded from

2-NPH derivatized 8,11,14-eicosatrienoic acid (C20:3), palmitic acid(C16:0), and oleic acid (C18:1), respectively, by confirming the cor-respondence of the chromatographic retention times and LC-MS/MSspectra of 2-NPH–derivatized fatty acid standards with those of radio-active fatty acids (Fig. 7; Supplemental Fig. 5).
Discussion
After oral administration of [14C]CS-1036 to rats, radioactivity inplasma showed that the dual peak profiles were eliminated slowly andwere still detectable up to 72 hours after administration, with anobservation of the second peak at 32 hours after administration. CS-1036 exhibited a low oral bioavailability (1.73%–2.44%) and a lowbiliary excretion (, 1% of the dose), although intestinal secretion wasobserved after intravenous administration of [14C]CS-1036 (17.8% ofthe dose as fecal excretion) (Honda et al., 2013). Although intestinalflora hydrolyzed the O-glycoside bond of CS-1036, followed by N-acetylation, CS-1036, which is a highly hydrophilic molecule witha trisaccharide-like structure, exhibited a low oral absorption and wasmetabolically stable in hepatic, renal, and intestinal S9 fraction(Honda et al., 2013). These facts suggest that enterohepatic circulationhas no relation to the sustained elimination of radioactivity fromplasma, with a dual peak profile and some unknown factors, whichcould be explained neither by the exposures of CS-1036 nor its majormetabolite, M1, involved in this phenomenon (Honda et al., 2013).One possible hypothesis is the covalent binding of CS-1036
metabolites to plasma proteins. Drugs that exhibit a long half-life ofthe radioactivity in the plasma in animals and humans are reported tobe often linked with covalent binding of reactive metabolites tomacromolecules in the plasma (Zhang et al., 2005). However, CS-1036 and its metabolites were not considered to exhibit covalentbinding potency to plasma proteins. Furthermore, in tissue distributionof [14C]CS-1036 in rats, the radioactivity showed slow elimination notonly in blood, plasma, and liver but also in other various tissues, suchas adipose tissue and spleen, and was still detectable up to 7 or 14 daysafter administration, indicating that the slow elimination of radioac-tivity was not possibly caused by the covalent binding of reactivemetabolites of CS-1036 to macromolecules. If reactive metabolitesbind covalently to tissue proteins, the residual radioactivity mainly inthe liver should be observed at 72 or 168 hours after administration inrats, and this well correlates with the in vivo covalent binding tohepatic proteins (Takakusa et al., 2008).To discriminate the mechanisms of the residual radioactivity from
covalent binding is important for CS-1036. An a-glucosidase inhibitor,acarbose, is expected to be a similar class of agents as the a-amylaseinhibitor in terms of the suppression of glucose absorption (Martin andMontgomery, 1996; Scott and Spencer, 2000). The systemic absorptionof acarbose is limited to about 1.7% of the dose estimated from theurinary excretion in humans, and intestinal flora were also involved inthe metabolism of acarbose; in addition, a reduced metabolite,4-methypyrogallol, was produced and received further metabolismby glucuronidation, sulfation, and methylation (Ahr et al., 1989). In
Fig. 3. Tissues radioactivity concentration-time profiles after single oral administrationof [14C]CS-1036 to rats at a dose of 5 mg/kg.The data are expressed as mean + S.D.(n = 3). The upper panel is the enlarged viewof the lower panel.
Identification of Radioactive Components of CS-1036 in Rats 1129
at ASPE
T Journals on June 21, 2018
dmd.aspetjournals.org
Dow
nloaded from
acarbose, the hepatotoxicity is one of the issues in clinical use,although the rate of incidence is low (Andrade et al., 1996; Carrascosaet al., 1997; Andrade et al., 1998; Fujimoto et al., 1998). Themechanism of acarbose-induced hepatotoxicity is hypothesized to beinvolved in a metabolic idiosyncrasy caused by its metabolites, mainly4-methylpyrogallol derivatives (Ahr et al., 1989; Boberg et al., 1990).
To verify the cause of the radioactivity retention in various tissues afteroral administration of [14C]CS-1036, the chemical forms of [14C]CS-1036derivatives were identified in the plasma and white adipose tissue,in which the highest radioactivity concentration at 14 days afteradministration was observed. From the results of the amino acidanalysis of plasma proteins after repeated administration of [14C]CS-1036,
Fig. 4. UV chromatogram by HPLC (A) and radioactivity chromatogram by AMS (B) for identification of PTC-derivatized amino acids of plasma proteins with radioactivityfrom [14C]CS-1036–treated rats.
Fig. 5. 2D-TLC chromatograms of radioactivity of lipidsin adipose tissue prepared from [14C]CS-1036–treated ratswithout (A) or with treatment of lipase (B) separated by (I)chloroform/methanol/28% aqueous ammonia (65/35/5, v/v/v)followed by (II) chloroform/acetone/methanol/acetic acid/water (5/2/1/1/0.5, v/v/v/v/v).
1130 Honda et al.
at ASPE
T Journals on June 21, 2018
dmd.aspetjournals.org
Dow
nloaded from

glutamic acid, aspartic acid, and alanine/proline were identified asthe major radioactive peaks. The peaks from glutamine and asparaginemight include the peaks from glutamic acid and aspartic acid, respec-tively, because glutamine and asparagine were converted into glutamicacid and aspartic acid, respectively, in the process of HCl-hydrolysis.These major identified amino acids, including glutamine and as-paragine, were nonessential amino acids that were capable of beingbiosynthesized in rats (Rawn, 1989). These results indicate that theradioactivity derived from [14C]CS-1036 is incorporated as constituentsof amino acids of rat plasma proteins. The turnover rate of rat albumin,
which is the major protein in the plasma, was reported to be 5 days(Spector, 1974). Thus, the radioactivity was proposed to be eliminatedslowly because of the incorporation of the radioactivity from [14C]CS-1036into the constituents of plasma proteins.The radioactivity incorporation into lipids was also observed, and
the radioactivity was also incorporated into 8,11,14-eicosatrienoic acid(C20:3), palmitic acid (C16:0), and oleic acid (C18:1) in adiposetissue. These are the novel findings that a chemically synthesized drugis metabolized by intestinal flora and used to the biogenic components,such as amino acids and fatty acids.
Fig. 6. Radiochromatogram of the 2-NPH–derivatized fatty acidsample from adipose tissue of the [14C]CS-1036–treated rat.
Fig. 7. LC-MS/MS spectra of (A) L1 at m/z 442, (B) L2 at m/z 392, and (C) L3 at m/z 418 and their assignments to the structures of 2-NPH–derivatized 8,11, 14-eicosatrienoic acid, palmitic acid, and oleic acid, respectively. *Dehydration and elimination of hydrocarbons from fatty acid moieties.
Identification of Radioactive Components of CS-1036 in Rats 1131
at ASPE
T Journals on June 21, 2018
dmd.aspetjournals.org
Dow
nloaded from

The biotransformation pathway of CS-1036 derivatives into aminoacids of proteins and fatty acids of lipids was proposed as shownin Fig. 8. CS-1036, M1, and/or their N-acetyl metabolites wereconsidered to be starting materials for further biotransformation toamino acids and fatty acids, because CS-1036, M1, and their N-acetylmetabolites contain [14C]-labeled positions of [14C]CS-1036, andglucose and deoxyglucose moieties of [14C]CS-1036 do not contain14C. After oral administration of [14C]CS-1036 to rats, CS-1036(approximately 5% of the dose) was metabolized to M1 by intestinalflora, and 2.34% of radioactivity was excreted into expired air as 14CO2
after oral administration of [14C]CS-1036; however, no other smallradiolabeled molecules derived from [14C]CS-1036 were identified inthe plasma, urine, feces, and intestinal contents, possibly because of the
low productivity and/or lack of sensitivity for detection (Honda et al.,2013). The major radioactive amino acids and fatty acids (palmitic acidand oleic acid), which were nonessential amino acids and nonessentialfatty acids (Rawn, 1989), respectively, were identified after oraladministration of [14C]CS-1036. In the metabolic process of CS-1036,hepatic, renal, and intestinal enzymes were not involved in the smallmolecule metabolite formation from CS-1036 (Honda et al., 2013). M1(1,4-dideoxy-1,4-imino-D-arabinitol) is mainly excreted in the urine asa parent compound with a high CL (25 ml/min/kg) and a short half-life(0.8 hour in oral administration) in rats, although M1 is reported to behighly absorbed, with the oral bioavailability of 89% (Mackay et al.,2003). Accordingly, the urinary excretion of M1 was 5.3% of the doseup to 24 hours after oral administration of CS-1036 (Honda et al.,
Fig. 8. Proposed schematic biotransformation pathway of [14C]CS-1036–derived radioactivity incorporation. M1, M2, and M3 formation from CS-1036 was proposed in theprevious report (Honda et al., 2013).
1132 Honda et al.
at ASPE
T Journals on June 21, 2018
dmd.aspetjournals.org
Dow
nloaded from
2013). Therefore, intestinal flora is supposed to be involved in theformation of small-molecule metabolites, such as 14CO2, from CS-1036 derivatives, because bacterial species in intestinal flora are highlyheterogeneous in terms of biotransformation (Scheline, 1973). How-ever, the detailed process of small metabolite formation from CS-1036derivatives is unknown. Further investigation for the identification ofsmall-molecule metabolites and responsible bacterial species and en-zymes would be necessary.In addition to the metabolic process of CS-1036 into small-
molecule metabolites, the biosynthetic process of amino acids andfatty acids is also important for the structural estimation of the small-molecule metabolites absorbed in rat tissues and used for biogenicincorporation. As amino acids, fatty acids and their source molecules,such as tricarboxylic acid (TCA), cycle sources and products wereconverted from CS-1036 derivatives by intestinal flora, hypothesizedto be also absorbed and used for the biosynthesis (Salter, 1973). Forthe sources of TCA cycle, acetyl-CoA is biologically synthesized frompyruvate, which is a source for alanine, valine, and leucine andconverted into citrate with oxaloacetate, which is a source for asparticacid and asparagine (Rawn, 1989). Alpha-ketoglutarate, one of theproducts of TCA cycle, is converted into glutamic acid, and glutamicacid is sequentially converted into glutamine and proline. In thebiosynthesis of fatty acids, intestinal flora are involved in the formationof short-chain fatty acids by fermentation from carbohydrates, such ascellulose, pectins, hemicelluloses, and starch (Cummings, 1981). Oneof the identified fatty acids, 8,11,14-eicosatrienoic acid, is synthesizedfrom an essential fatty acid, linoleic acid (C18:2) (Fan and Chapkin,1998). Acetyl-CoA carboxylases (ACC1 and ACC2) catalyze thecarboxylation of acetyl-CoA to malonyl-CoA using HCO3
- (Smithet al., 2003; Castle et al., 2009). Thus, radiolabeled carbohydrate mightbe incorporated into 8,11,14-eicosatrienoic acid from malonyl-CoA inthe process of carbon chain extension of linoleic acid (Wakil, 1989).Because the radioactivity showed sustained elimination profiles in mosttissues and 14CO2 was excreted into expired air in [
14C]CS-1036-treatedrats, the biogenic use of [14C]CS-1036 derivatives not only for proteinsand lipids but also other biogenic substances, is likely to also beobserved in various tissues and organs other than the plasma andadipose tissue. To confirm this and clarify the hypothesized pathways,further investigation would be necessary, such as identification ofsmall-molecule metabolites from [14C]CS-1036 derivatives by improv-ing the sensitivity for the detection and mechanism analysis of thesmall-molecule metabolite formation.In conclusion, the radioactivity retention in various tissues after oral
administration was revealed to be caused not by the covalent bindingof reactive metabolites but by the radioactivity incorporation derivedfrom [14C]CS-1036 into biogenic components, such as amino acidsof proteins and fatty acids of lipids. In the biotransformation processof the radioactivity incorporation, intestinal flora were supposed tobe involved in the production of small-molecule metabolites from[14C]CS-1036.
Authorship ContributionsParticipated in research design: Honda, Takakusa, Murai, Izumi.Conducted experiments: Honda, Takakusa, Murai.Contributed new reagents or analytic tools: Honda, Takakusa, Murai.Performed data analysis: Honda, Takakusa, Murai.Wrote or contributed to the writing of the manuscript: Honda, Takakusa,
Murai, Izumi.
References
Ahr HJ, Boberg M, Krause HP, Maul W, Müller FO, Ploschke HJ, Weber H, and Wünsche C(1989) Pharmacokinetics of acarbose, Part I: Absorption, concentration in plasma, metabolismand excretion after single administration of [14C]acarbose to rats, dogs, and man. Arznei-mittelforschung 39:1254–1260.
Andrade RJ, Lucena M, Vega JL, Torres M, Salmerón FJ, Bellot V, García-Escaño MD,and Moreno P (1998) Acarbose-associated hepatotoxicity. Diabetes Care 21:2029–2030.
Andrade RJ, Lucena MI, and Rodríguez-Mendizábal M (1996) Hepatic injury caused by acarbose.Ann Intern Med 124:931.
Bidlingmeyer BA, Cohen SA, and Tarvin TL (1984) Rapid analysis of amino acids using pre-column derivatization. J Chromatogr A 336:93–104.
Boberg M, Kurz J, Ploschke HJ, Schmitt P, Scholl H, Schuller M, and Wünsche C (1990)Isolation and structural elucidation of biotransformation products from acarbose. Arznei-mittelforschung 40:555–563.
Carrascosa M, Pascual F, and Aresti S (1997) Acarbose-induced acute severe hepatotoxicity.Lancet 349:698–699.
Castle JC, Hara Y, Raymond CK, Garrett-Engele P, Ohwaki K, Kan Z, Kusunoki J, and JohnsonJM (2009) ACC2 is expressed at high levels in human white adipose and has an isoform witha novel N-terminus [corrected]. PLoS ONE 4:e4369.
Cohen SA, Bidlingmeyer BA, and Tarvin TL (1986) PITC derivatives in amino acid analysis.Nature 320:769–770.
Cummings JH (1981) Short chain fatty acids in the human colon. Gut 22:763–779.Fan Y-Y and Chapkin RS (1998) Importance of dietary gamma-linolenic acid in human healthand nutrition. J Nutr 128:1411–1414.
Folch J (1942) Brain cephalin, a mixture of phosphatides. Separation from it of phosphatidylserine, phosphatidyl ethanolamine, and a fraction containing an inositol phosphatide. J BiolChem 146:35–44.
Fujimoto Y, Ohhira M, Miyokawa N, Kitamori S, and Kohgo Y (1998) Acarbose-induced hepaticinjury. Lancet 351:340.
Heinrikson RL and Meredith SC (1984) Amino acid analysis by reverse-phase high-performanceliquid chromatography: precolumn derivatization with phenylisothiocyanate. Anal Biochem136:65–74.
Henesey CM, Kellner-Weibel GL, Tarloff JB, and Harvison PJ (1999) Comparative disposition ofthe nephrotoxicant N-(3, 5-dichlorophenyl)succinimide and the non-nephrotoxicant N-(3, 5-difluorophenyl)succinimide in Fischer 344 rats. Drug Metab Dispos 27:674–680.
Honda T, Kaneno-Urasaki Y, Murai T, Kakuta M, Nasu H, Namba E, Koga T, Okuno A,and Izumi T (2013) Absorption, elimination, and metabolism of CS-1036, a novel a-amylaseinhibitor in rats and monkeys, and the relationship between gastrointestinal distribution andsuppression of glucose absorption. Drug Metab Dispos 41:878–887.
Kitagawa H, Masuzawa T, Makamura T, and Matsumoto E (1993) A batch preparation method forgraphite targets with low background for AMS 14C measurements. Radiocarbon 35:295–300.
Mackay P, Ynddal L, Andersen JV, and McCormack JG (2003) Pharmacokinetics and anti-hyperglycaemic efficacy of a novel inhibitor of glycogen phosphorylase, 1,4-dideoxy-1,4-imino-d- arabinitol, in glucagon-challenged rats and dogs and in diabetic ob/ob mice. DiabetesObes Metab 5:397–407.
Martin AE and Montgomery PA (1996) Acarbose: an a-glucosidase inhibitor. Am J Health SystPharm 53:2277–2290, quiz 2336–2337.
Miwa H (2002) High-performance liquid chromatographic determination of free fatty acids andesterified fatty acids in biological materials as their 2-nitrophenylhydrazides. Anal Chim Acta465:237–255.
Ng LT, Pascaud A, and Pascaud M (1987) Hydrochloric acid hydrolysis of proteins and de-termination of tryptophan by reversed-phase high-performance liquid chromatography. AnalBiochem 167:47–52.
Rawn JD (1989) Biochemistry, Neil Patterson publishers, Burlington, NC.Rouser G, Kritchevsky G, and Yamamoto A (1976) Column chromatographic and associatedprocedures for separation and determination of phosphatides and glycolipids, Marcel Dekker,New York, Basel.
Salter DN (1973) The influence of gut micro-organisms on utilization of dietary protein. ProcNutr Soc 32:65–71.
Scheline RR (1973) Metabolism of foreign compounds by gastrointestinal microorganisms.Pharmacol Rev 25:451–523.
Scott LJ and Spencer CM (2000) Miglitol: a review of its therapeutic potential in type 2 diabetesmellitus. Drugs 59:521–549.
Smith EL and Stockell A (1954) Amino acid composition of crystalline carboxypeptidase. J BiolChem 207:501–514.
Smith S, Witkowski A, and Joshi AK (2003) Structural and functional organization of the animalfatty acid synthase. Prog Lipid Res 42:289–317.
Spector IM (1974) Animal longevity and protein turnover rate. Nature 249:66.Takakusa H, Masumoto H, Yukinaga H, Makino C, Nakayama S, Okazaki O, and Sudo K (2008)Covalent binding and tissue distribution/retention assessment of drugs associated with idio-syncratic drug toxicity. Drug Metab Dispos 36:1770–1779.
Wakil SJ (1989) Fatty acid synthase, a proficient multifunctional enzyme. Biochemistry 28:4523–4530.
Zhang D, Krishna R, Wang L, Zeng J, Mitroka J, Dai R, Narasimhan N, Reeves RA, Srinivas NR,and Klunk LJ (2005) Metabolism, pharmacokinetics, and protein covalent binding of radio-labeled MaxiPost (BMS-204352) in humans. Drug Metab Dispos 33:83–93.
Address correspondence to: Tomohiro Honda, Drug Metabolism & Pharmaco-kinetics Research Laboratories, R&D Division, Daiichi Sankyo Co., Ltd., 1-2-58,Hiromachi, Shinagawa-ku, Tokyo 140-8710, Japan. E-mail: [email protected]
Identification of Radioactive Components of CS-1036 in Rats 1133
at ASPE
T Journals on June 21, 2018
dmd.aspetjournals.org
Dow
nloaded from