Embed Size (px)
Citation preview

Title Dysfunction of lipid sensor GPR120 leads to obesity in bothmouse and human.
Author(s)
Ichimura, Atsuhiko; Hirasawa, Akira; Poulain-Godefroy,Odile; Bonnefond, Amélie; Hara, Takafumi; Yengo, Loïc;Kimura, Ikuo; Leloire, Audrey; Liu, Ning; Iida, Keiko;Choquet, Hélène; Besnard, Philippe; Lecoeur, Cécile;Vivequin, Sidonie; Ayukawa, Kumiko; Takeuchi, Masato;Ozawa, Kentaro; Tauber, Maithé; Maffeis, Claudio; Morandi,Anita; Buzzetti, Raffaella; Elliott, Paul; Pouta, Anneli; Jarvelin,Marjo-Riitta; Körner, Antje; Kiess, Wieland; Pigeyre, Marie;Caiazzo, Roberto; Van Hul, Wim; Van Gaal, Luc; Horber,Fritz; Balkau, Beverley; Lévy-Marchal, Claire; Rouskas,Konstantinos; Kouvatsi, Anastasia; Hebebrand, Johannes;Hinney, Anke; Scherag, Andre; Pattou, François; Meyre,David; Koshimizu, Taka-Aki; Wolowczuk, Isabelle; Tsujimoto,Gozoh; Froguel, Philippe
Citation Nature (2012)
Issue Date 2012-02-19
URL http://hdl.handle.net/2433/153278
Right ©2012 Macmillan Publishers Limited. All rights reserved; 許諾条件により本文は2012-08-19に公開.
Type Journal Article
Textversion author
Kyoto University
1
Dysfunction of lipid sensor GPR120 leads to obesity in both mouse and human
Atsuhiko Ichimura1*, Akira Hirasawa1*, Odile Poulain-Godefroy2,3*, Amélie
Bonnefond2,3*, Takafumi Hara1, Loïc Yengo2,3, Ikuo Kimura1, Audrey Leloire2,3, Ning
Liu1, Keiko Iida1, Hélène Choquet2,3, Philippe Besnard4, Cécile Lecoeur2,3, Sidonie
Vivequin2,3, Kumiko Ayukawa1, Masato Takeuchi1, Kentaro Ozawa1, Maithé Tauber5,
Claudio Maffeis6,7, Anita Morandi2,3,6, Raffaella Buzzetti8, Paul Elliott9, Anneli
Pouta10,11, Marjo-Riitta Jarvelin9,10,12, Antje Körner13, Wieland Kiess13, Marie
Pigeyre14,15, Roberto Caiazzo14,16, Wim Van Hul17, Luc Van Gaal18, Fritz Horber19,
Beverley Balkau20,21, Claire Lévy-Marchal22, Konstantinos Rouskas2,3,23, Anastasia
Kouvatsi23, Johannes Hebebrand24, Anke Hinney24, Andre Scherag25, François
Pattou14,16, David Meyre2,3,26, Taka-aki Koshimizu27, Isabelle Wolowczuk2,3, Gozoh
Tsujimoto1#, Philippe Froguel2,3,28#
1Department of Genomic Drug Discovery Science, Graduate School of Pharmaceutical Sciences, Kyoto University, 46-29 Yoshida Shimoadachi-cho, Sakyo-ku, Kyoto 606-8501, Japan; 2Centre National de la Recherche Scientifique (CNRS)-Unité mixte de recherche (UMR) 8199, Lille Pasteur Institute, Lille 59000, France; 3Lille Nord de France University, Lille 59000, France; 4Institut National de la Santé et de la Recherche Médicale (Inserm)-UMR U866, Physiologie de la Nutrition, Bourgogne University, AgroSup Dijon, Dijon 21078, France; 5Inserm-U563, Children’s Hospital, Centre Hospitalier Universitaire, Toulouse 31000, France; 6Regional Centre for Juvenile Diabetes, Obesity and Clinical Nutrition, Verona 37134, Italy; 7Department of Mother and Child, Biology-Genetics, Section of Paediatrics, University of Verona, Verona 37134, Italy; 8Department of Clinical Sciences, La Sapienza University, Rome 00161, Italy; 9Medical Research Council-HPA Centre for Environment and Health, Department of Epidemiology and Biostatistics, School of Public Health, St Mary’s campus, Imperial College London, London W2 1PG, UK; 10National Public Health Institute, Biocenter Oulu, University of Oulu, Oulu 90220, Finland; 11Institute of Clinical Medicine/Obstetrics and Gynecology, University of Oulu, Oulu 90220, Finland; 12Institute of Health Sciences, University of Oulu, Oulu 90220, Finland; 13Center for Pediatric Research, Department of Women´s & Child Health, University of Leipzig, Leipzig 04317, Germany; 14Inserm-U859, Lille Nord de France University, Lille 59000, France; 15Lille University Hospital, Nutrition, Lille 59000, France; 16Lille University Hospital, Endocrine Surgery, Lille 59000, France; 17Department of Medical Genetics, University of Antwerp, Antwerp 2610, Belgium; 18Department of Endocrinology, Antwerp University Hospital, Antwerp 2650, Belgium; 19Department of Surgery and Internal Medicine, Clinic Lindberg, Medical Department, Winterthur 8400, and University of Berne, Berne 3011, Switzerland; 20Inserm-U780, Centre for research in Epidemiology and Population Health (CRESP), Villejuif 94800, France; 21Paris-Sud 11 University, Orsay 91405, France; 22Inserm-U690, Robert Debré hospital, Paris 75935, France; 23Department of Genetics, Development and Molecular Biology, School of Biology, Aristotle University of Thessaloniki, Thessaloniki 541 24, Greece; 24Department of Child and Adolescent Psychiatry, University of Duisburg-Essen, Essen 45147, Germany; 25Institute for Medical Informatics, Biometry and Epidemiology, University of Duisburg-Essen, Essen 45122, Germany; 26McMaster University, Hamilton L8S4L8, Canada; 27Department of Pharmacology, Division of Molecular Pharmacology, Jichi Medical University, Tochigi 329-0498, Japan; 28Department of Genomics of Common Disease, School of Public Health, Imperial College London, Hammersmith Hospital, London W12 0NN, UK.
* These authors contributed equally to this work. # Address correspondence to:

2
- Philippe Froguel, M.D., Ph.D., Section of Genomic Medicine, Hammersmith Hospital,
Room E303 Burlington-Danes building Hammersmith Hospital, Imperial College
London, Du Cane Road, London W12 0NN, UK. Tel: 44 (0)777 3 777 132, Fax: 44
(0)207 594 6543; Email: [email protected];
- Gozoh Tsujimoto, M.D., Ph.D., Department of Genomic Drug Discovery Science,
Graduate School of Pharmaceutical Sciences, Kyoto University, 46-29 Yoshida
Shimoadachi-cho Sakyo-ku, Kyoto 606-8501, Japan. Tel: 81-75-753-4523, Fax:
81-75-753-4544; E-mail: [email protected].
3
SUMMARY
Free fatty acids (FFAs) provide an important energy source as nutrients, and also
act as signaling molecules in various cellular processes1-4. Several
G-protein-coupled receptors have been identified as FFAs receptors which play significant roles in physiology as well as in several diseases3,5-13. GPR120 functions
as a receptor for unsaturated long-chain free fatty acids and plays a critical role in
various physiologic homeostasis mechanisms such as adipogenesis, regulation of appetite or food preference5,6,14-16. Here, we show that high-fat diet (HFD)-fed
GPR120-deficient mice develop obesity, glucose intolerance and fatty liver with
decreased adipocyte differentiation and lipogenesis and enhanced hepatic
lipogenesis. Insulin resistance of HFD-fed GPR120-deficient mice is associated
with reduced insulin signaling and enhanced inflammation in adipose tissue. In
human, we show that GPR120 expression in adipose tissue is significantly higher in
obese individuals than in lean controls. GPR120 exons sequencing in obese subjects
reveals a deleterious non-synonymous mutation (p.R270H) which inhibits the
GPR120 signaling activity. Furthermore, the p.R270H variant increases risk for
obesity in European populations. Overall, this study demonstrates that the lipid
sensor GPR120 has a key role in dietary fat-sensing and, thereby, in the control of
energy balance in both humans and rodents.
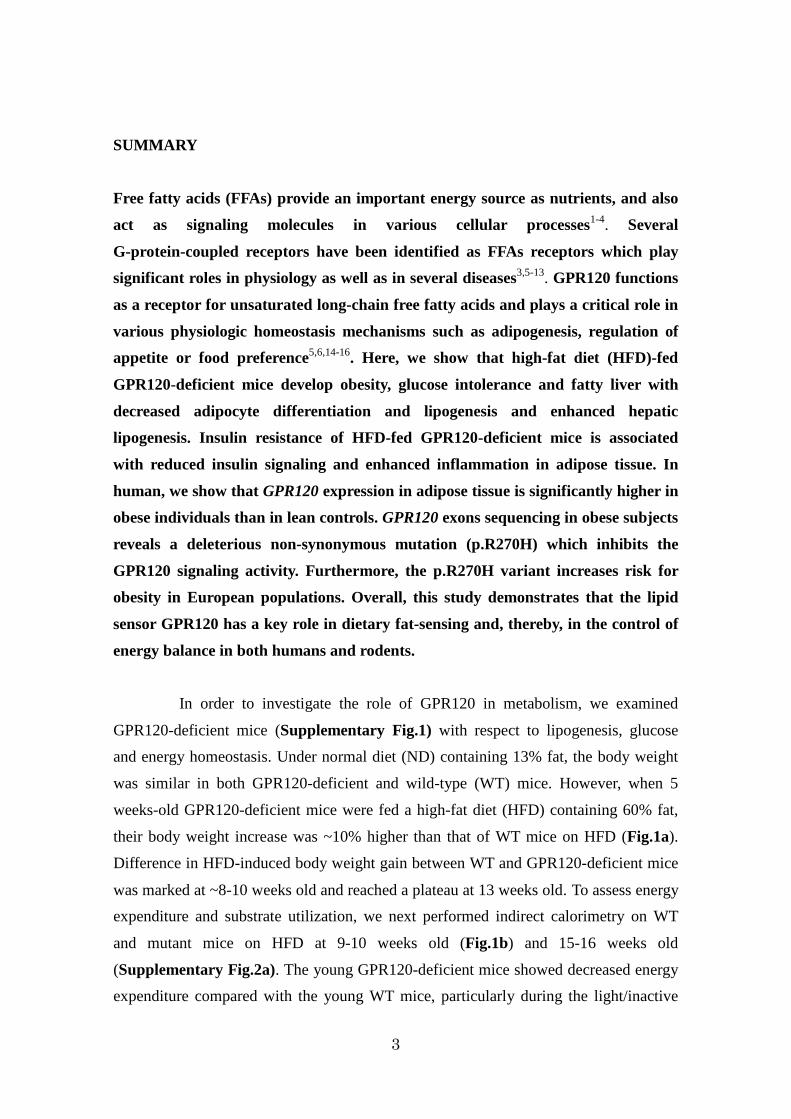
In order to investigate the role of GPR120 in metabolism, we examined
GPR120-deficient mice (Supplementary Fig.1) with respect to lipogenesis, glucose
and energy homeostasis. Under normal diet (ND) containing 13% fat, the body weight
was similar in both GPR120-deficient and wild-type (WT) mice. However, when 5
weeks-old GPR120-deficient mice were fed a high-fat diet (HFD) containing 60% fat,
their body weight increase was ~10% higher than that of WT mice on HFD (Fig.1a).
Difference in HFD-induced body weight gain between WT and GPR120-deficient mice
was marked at ~8-10 weeks old and reached a plateau at 13 weeks old. To assess energy expenditure and substrate utilization, we next performed indirect calorimetry on WT
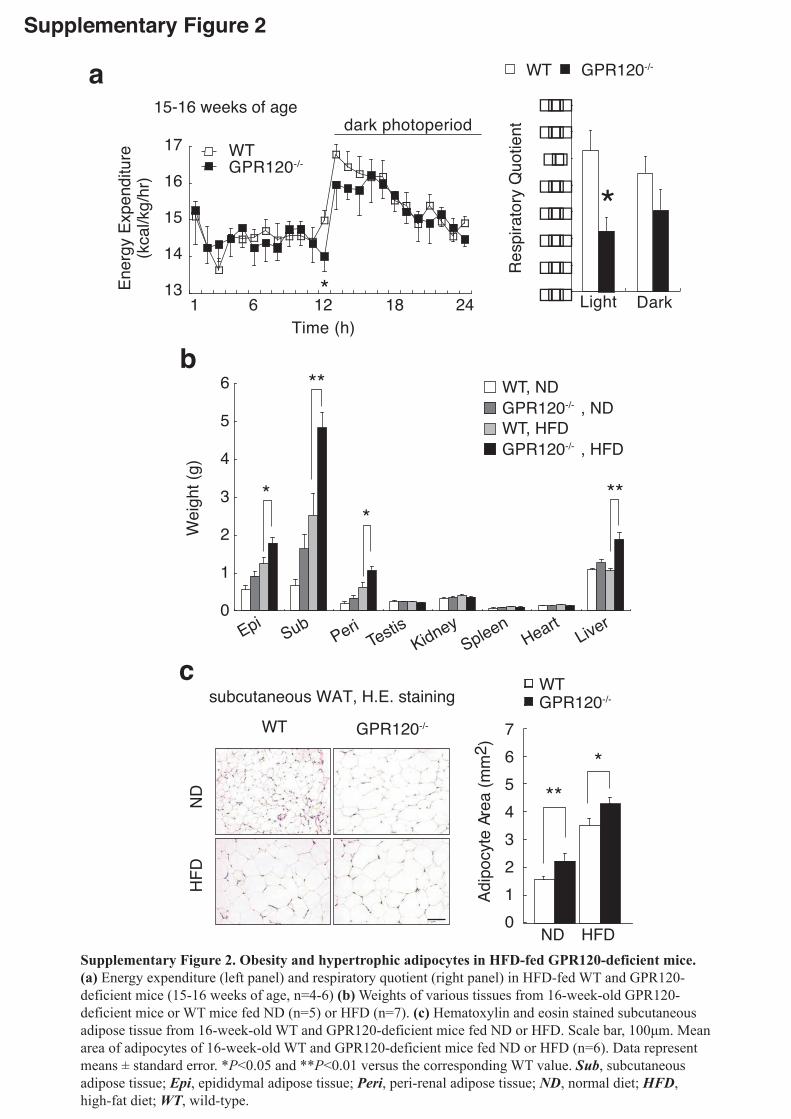
and mutant mice on HFD at 9-10 weeks old (Fig.1b) and 15-16 weeks old
(Supplementary Fig.2a). The young GPR120-deficient mice showed decreased energy
expenditure compared with the young WT mice, particularly during the light/inactive
4
phase (Fig.1b left panel), while older mutant and WT mice showed no such a
difference (Supplementary Fig.2a left panel). The difference in energy expenditure
between GPR120-deficient and WT mice was observed only in the light phase,
indicating that lack of the GPR120 receptor primarily affects basal metabolism
especially in young mice. The decreased energy expenditure might explain the
difference we found in body weight gain between HFD-fed WT and mutant young mice.
The lower respiratory quotient (RQ) values in mutant mice could be due to insufficient
glucose utility probably because of the decreased insulin sensitivity. In all experiments,
both groups of mice showed similar levels of locomotor activity (data not shown).
White adipose tissue (WAT) and liver were substantially heavier in HFD-fed
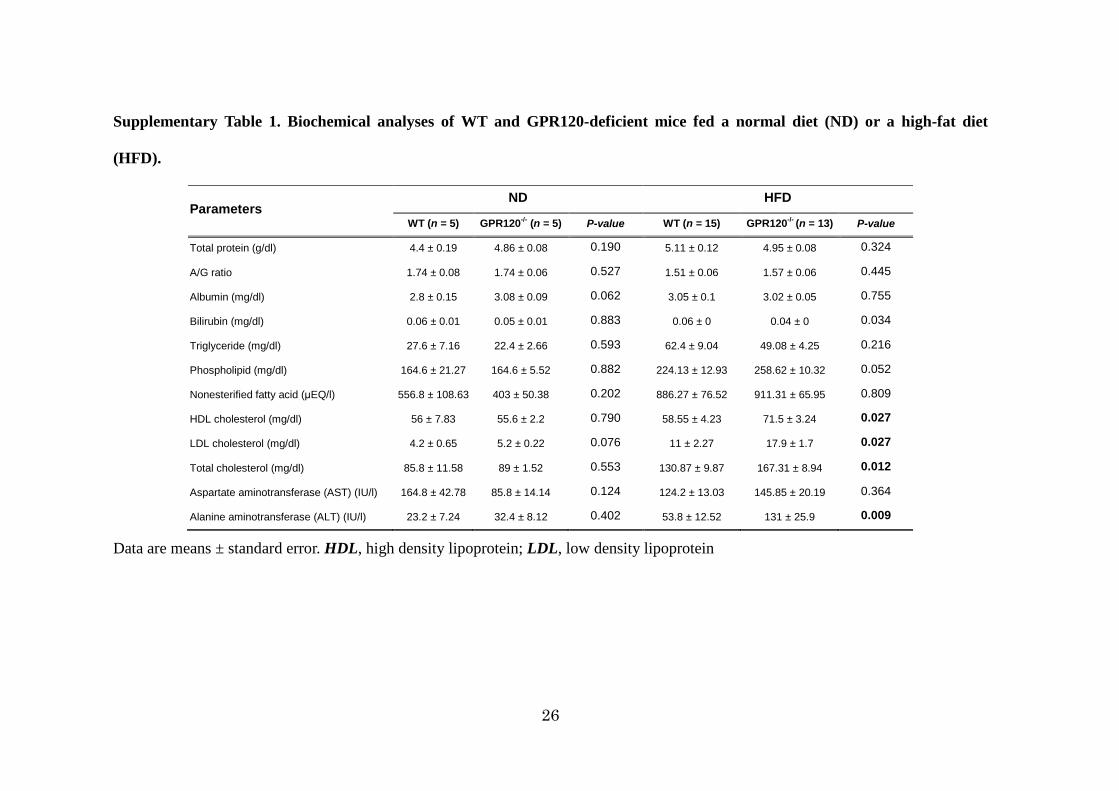
GPR120-deficient mice (Supplementary Fig.2b). Plasma low- and high-density
lipoprotein cholesterols were significantly higher in HFD-fed GPR120-deficient mice,
along with substantially elevated serum alanine aminotransferase levels, indicating
abnormal cholesterol metabolism and liver function (Supplementary Table1).
Micro-computed tomography scanning revealed that 16 weeks-old GPR120-deficient
mice stored much more fat than WT (Fig.1c). A significant increase in adipocyte size in
both epididymal (Fig.1d) and subcutaneous (Supplementary Fig.2c) fat was observed
in GPR120-deficient mice. Furthermore, the expression of macrophage marker genes
(Cd11b, Cd68 and F4/80) and the number of F4/80 positive cells were markedly
enhanced in epididymal tissue from HFD-fed GPR120-deficient mice (Fig.1e,f). Moreover, these mice exhibited liver steatosis and hepatic triglycerides (TG) content
was markedly increased (Fig.1g). Overall, HFD-induced obesity and fatty livers were
more severe in GPR120-deficient mice than in WT mice.
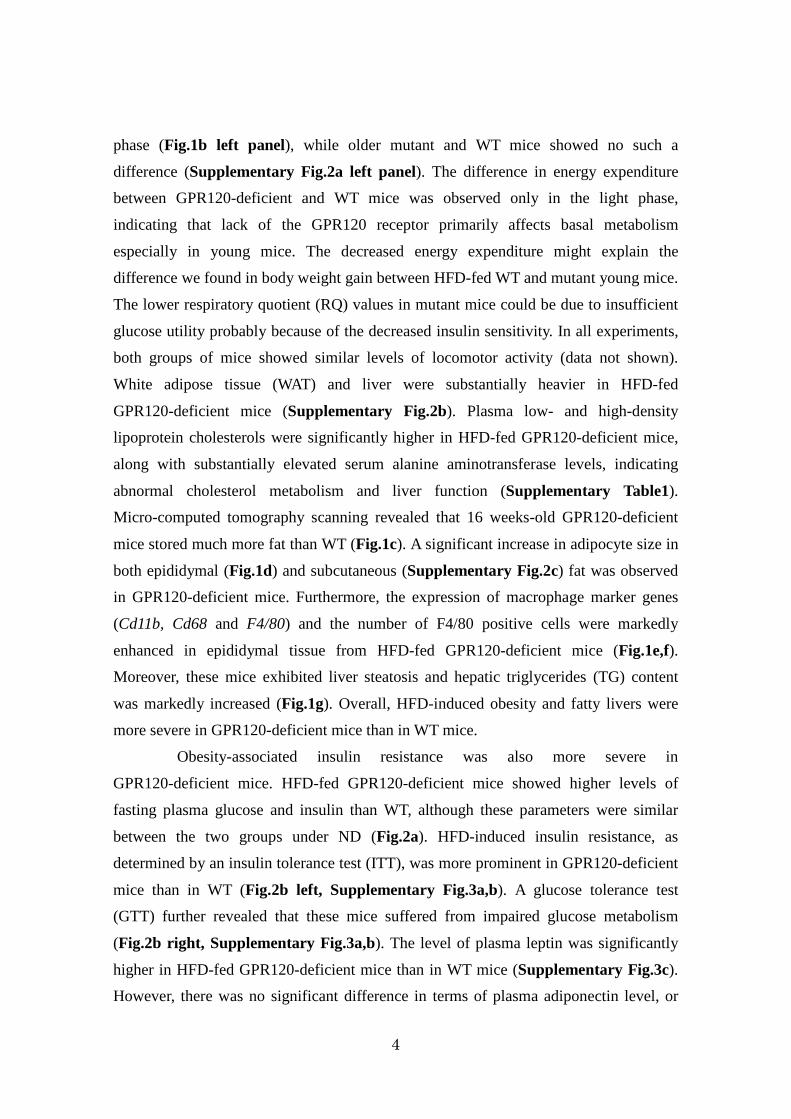
Obesity-associated insulin resistance was also more severe in
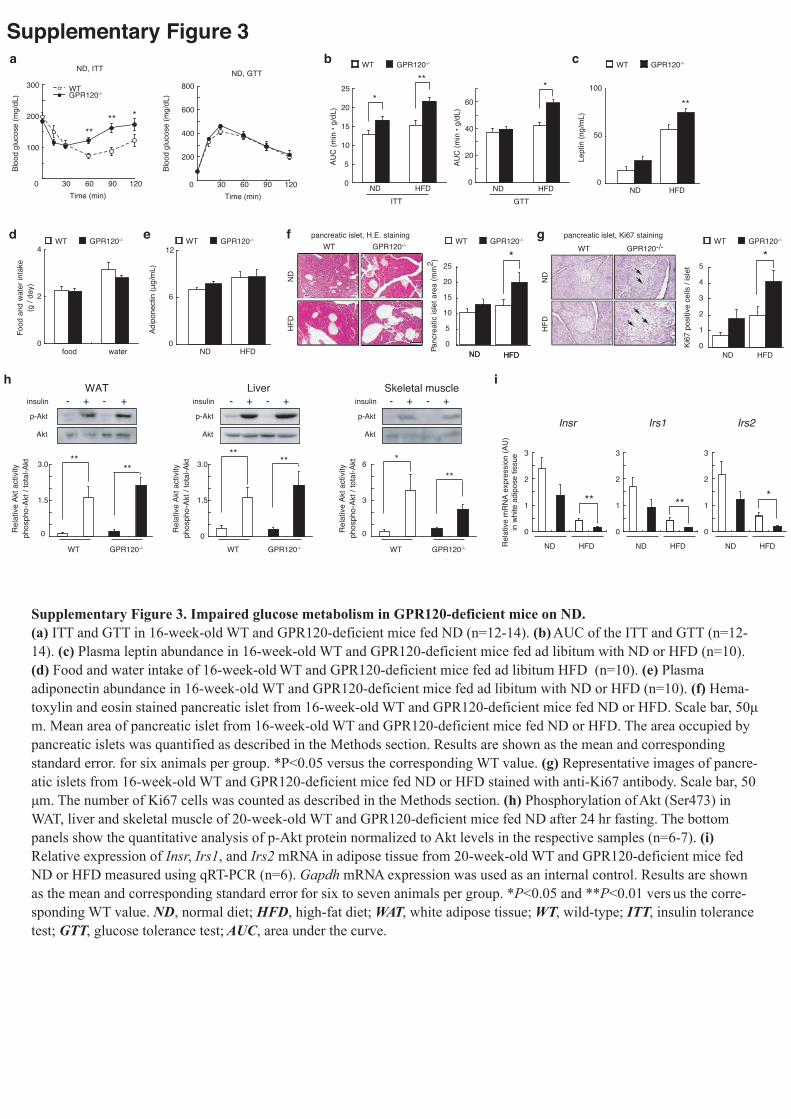
GPR120-deficient mice. HFD-fed GPR120-deficient mice showed higher levels of
fasting plasma glucose and insulin than WT, although these parameters were similar
between the two groups under ND (Fig.2a). HFD-induced insulin resistance, as
determined by an insulin tolerance test (ITT), was more prominent in GPR120-deficient
mice than in WT (Fig.2b left, Supplementary Fig.3a,b). A glucose tolerance test
(GTT) further revealed that these mice suffered from impaired glucose metabolism
(Fig.2b right, Supplementary Fig.3a,b). The level of plasma leptin was significantly
higher in HFD-fed GPR120-deficient mice than in WT mice (Supplementary Fig.3c).
However, there was no significant difference in terms of plasma adiponectin level, or

5
food intake, between the two groups (Supplementary Fig.3d,e). HFD-fed
GPR120-deficient mice showed a marked increase in the size of islets and Ki67 positive
cells, suggesting adaptive enlargement of the b-cell mass in response to insulin
resistance17,18 (Supplementary Fig.3f,g). Moreover, we observed markedly reduced
peripheral insulin sensitivity in tissues from HFD-fed GPR120-deficient mice (Fig.2c).
Insulin was shown to induce the phosphorylation of Akt (on Ser473) in WAT, liver and
skeletal muscle, with similar intensities in ND-fed WT and GPR120-deficient mice
(Supplementary Fig.3h). Consistent with the insulin resistance reported above,
HFD-fed GPR120-deficient mice exhibited loss of insulin-induced Akt phosphorylation
in WAT and the liver.
In order to determine the molecular basis of the metabolic changes in WAT
and livers of GPR120-deficient mice, we performed gene expression analyses. We
identified approximately 700 differentially expressed genes in WAT between HFD-fed
GPR120-deficient and WT mice (Supplementary Fig.4a). Connectivity mapping of
these genes showed that pathways relating to insulin signaling and adipocyte
differentiation were depressed, while those related to inflammation were enhanced in
HFD-fed GPR120-deficient mice (Supplementary Fig.4b). Quantitative real-time PCR
(qRT-PCR) analysis confirmed the down-regulation of insulin signaling-related genes
(Insr, Irs1, Irs2), adipocyte differentiation marker gene (Fabp4), and lipogenesis-related
gene (Scd1) in the epididymal fat from HFD-fed GPR120-deficient mice (Fig.2d,
Supplementary Fig.3i). We identified approximately 100 differentially expressed genes
in the liver between HFD-fed GPR120-deficient and WT mice (Supplementary Fig.5).
Notably, lipogenesis-related genes (Scd1 and Me1), and a fatty acid transporter gene
(Cd36), were significantly up-regulated in livers from GPR120-deficient mice.
Quantitative RT-PCR analysis confirmed up-regulation of Scd1 in the liver of
GPR120-deficient mice (Fig.2d). Western blot analysis confirmed down-regulation of
IRb, IRS1, and SCD1 in adipose tissue (Fig.2e), but down-regulation of IRS1 and IRS2
and up-regulation of SCD1 in the livers (Fig.2f) of HFD-fed GPR120-deficient mice.
Hence, insulin signaling-related molecules were down-regulated by the lack of GPR120
in both adipose tissue and the liver. However, the expression of SCD1, the rate-limiting
enzyme in the biosynthesis of monounsaturated fatty acids, was down-regulated in
adipose tissue, but up-regulated in the livers of HFD-fed GPR120-deficient mice.
Furthermore, the expression of Scd1 and several adipogenic genes14,19 (Pparg, Fabp4

6
and Srebf1) was suppressed in mouse embryonic fibroblast (MEF)-derived adipocytes
from GPR120-deficient mice, indicating that GPR120 is required for normal
adipogenesis, as previously reported in differentiating 3T3-L1 adipocytes depleted of
endogenous GPR120 by siRNA14 (Fig.2g,h).
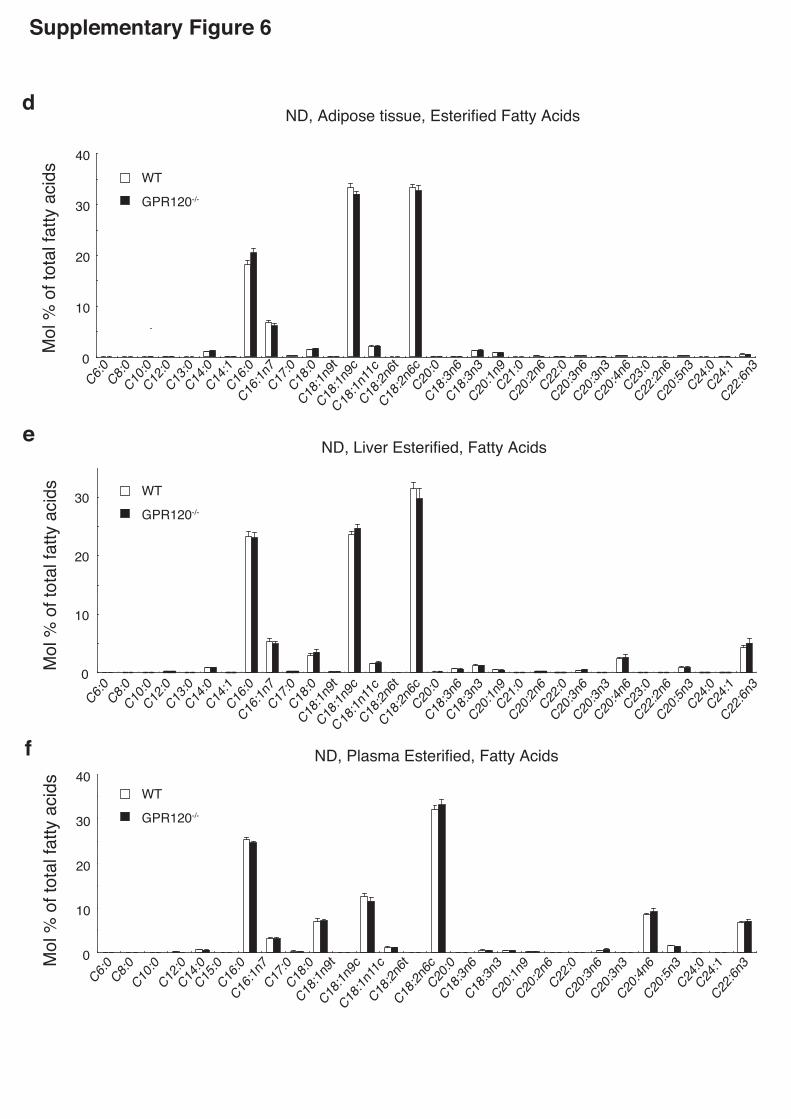
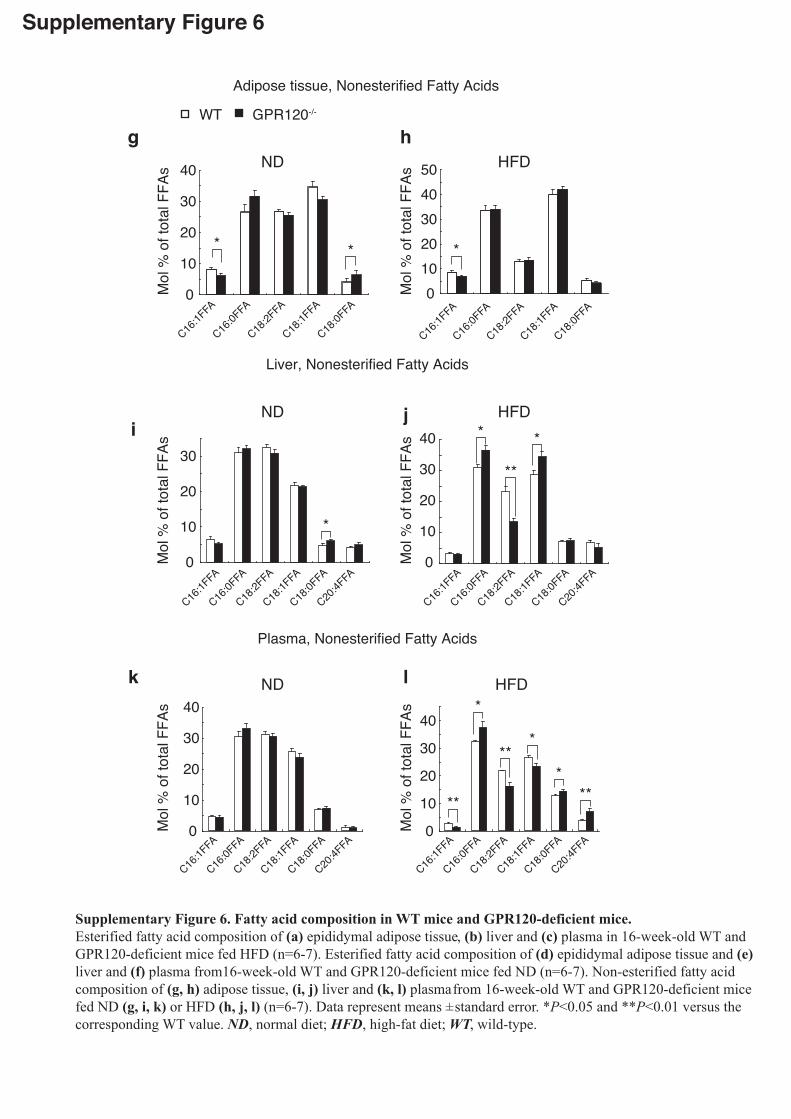
To determine the effects of altered lipogenesis upon lipid composition in
GPR120-deficient mice, we performed lipidomics analysis in WAT, livers and plasma.
Significant changes of major lipid clusters were observed (Supplementary Fig.6).
Notably, the hepatic concentration of oleate (C18:1n9c) was significantly higher in
HFD-fed GPR120-deficient mice than WT mice. The ratio of C18:1/C18:0, an indicator
of SCD1 enzyme activity20-23, was markedly enhanced in livers from HFD-fed
GPR120-deficient mice than WT (Fig.2i). Moreover, the levels of C16:1n7 palmitoleate,
which has been recently recognized as a lipid hormone4, in WAT and plasma were
significantly lower in HFD-fed GPR120-deficient mice compared with WT (Fig.2j). In
particular, lower levels of C16:1n7 palmitoleate were detected even in WAT of ND-fed
GPR120-deficient mice (Fig.2j), which appears to be in good accordance with the
suppressed Scd1 expression and the reduced SCD1 desaturation index
(C16:1/C16:0)20-23 (Fig.2k,l). Lipidomics analysis clearly illustrated dysregulated
lipogenesis in GPR120-deficient mice, and showed the reduced production of lipid
hormone C16:1n7 palmitoleate4. Furthermore, to determine whether the enhanced
hepatic lipogenesis in GPR120-deficient mice is due to the reduced levels of C16:1n7
palmitoleate, we examined the effect of C16:1n7 palmitoleate treatment on hepatic Scd1
expression. A 6-hour infusion of TG-palmitoleate markedly lowered the enhanced
hepatic Scd1 expression in GPR120-deficient mice (Fig.2m). Together, the reduced
C16:1n7 palmitoleate may explain the systemic metabolic disorders observed in
GPR120-deficient mice on HFD, as palmitoleate has been proposed as a bioactive lipid
by which adipose tissue communicates with distant organs (such as liver) and regulates
systemic metabolic homeostasis4. The present study showed that dysfunction of
GPR120 can be underlying mechanism for the diet-associated obesity and
obesity-related metabolic disorders in mouse.
The mice data prompted us to assess the potential contribution of GPR120 to
the development of obesity and its metabolic complications in humans. First, the
expression levels of GPR120 in both subcutaneous (SC) and omental (OM) adipose
tissues as well as in liver samples were compared between lean and obese subjects.
7
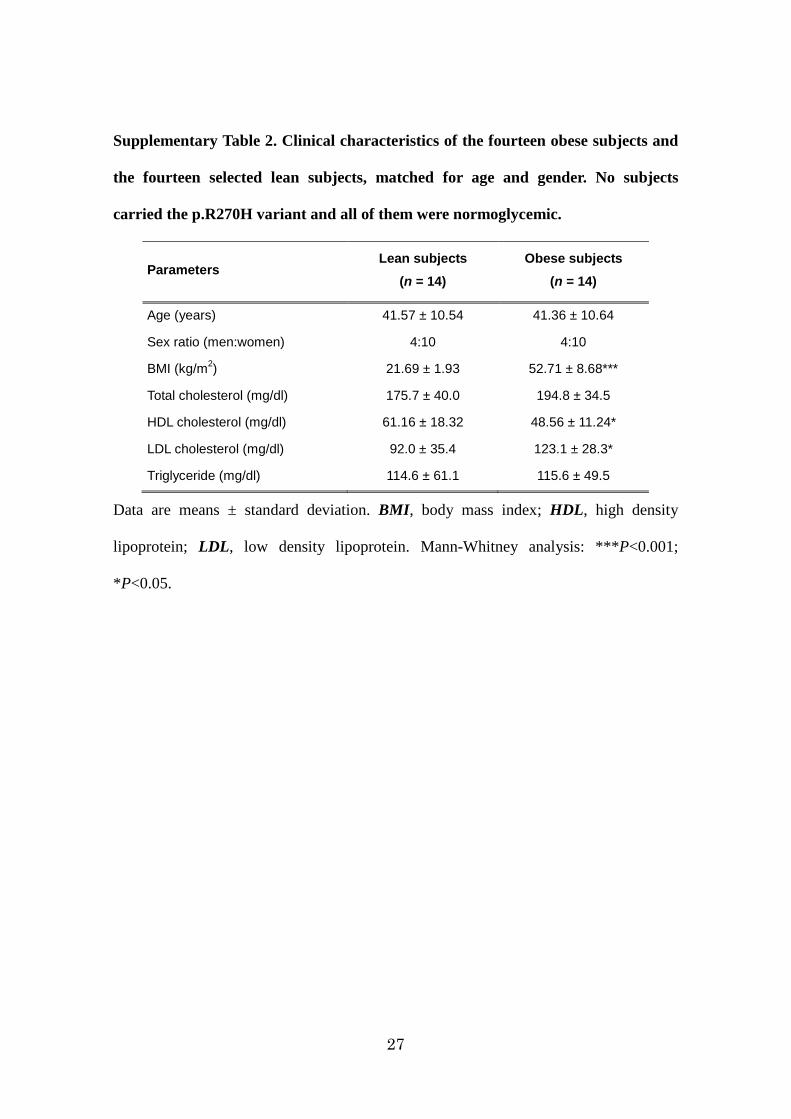
Normoglycemic obese patients and lean individuals (n=14 in each group) were matched
for age and gender (Supplementary Table2). As previously described5,14, we confirmed
that GRP120 is barely expressed in the liver of either lean or obese subjects (data not
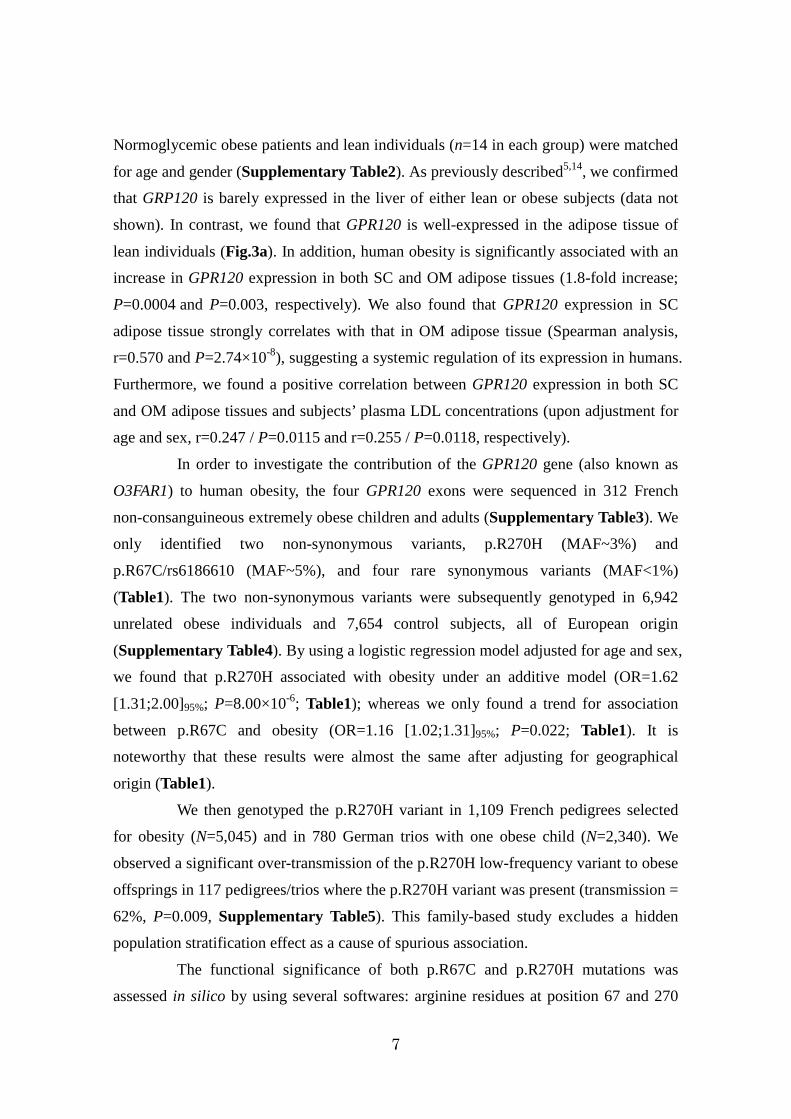
shown). In contrast, we found that GPR120 is well-expressed in the adipose tissue of
lean individuals (Fig.3a). In addition, human obesity is significantly associated with an
increase in GPR120 expression in both SC and OM adipose tissues (1.8-fold increase;
P=0.0004 and P=0.003, respectively). We also found that GPR120 expression in SC
adipose tissue strongly correlates with that in OM adipose tissue (Spearman analysis,
r=0.570 and P=2.74×10⁻⁸), suggesting a systemic regulation of its expression in humans.
Furthermore, we found a positive correlation between GPR120 expression in both SC
and OM adipose tissues and subjects’ plasma LDL concentrations (upon adjustment for
age and sex, r=0.247 / P=0.0115 and r=0.255 / P=0.0118, respectively).
In order to investigate the contribution of the GPR120 gene (also known as
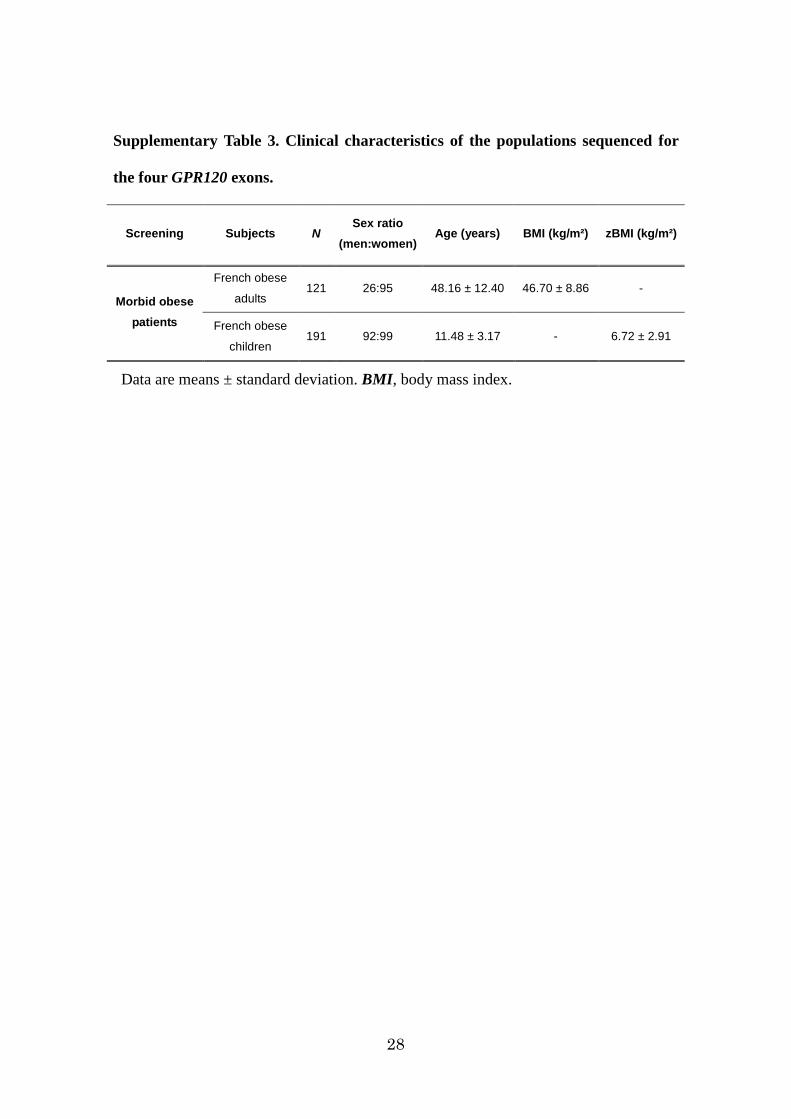
O3FAR1) to human obesity, the four GPR120 exons were sequenced in 312 French
non-consanguineous extremely obese children and adults (Supplementary Table3). We
only identified two non-synonymous variants, p.R270H (MAF~3%) and
p.R67C/rs6186610 (MAF~5%), and four rare synonymous variants (MAF<1%)
(Table1). The two non-synonymous variants were subsequently genotyped in 6,942
unrelated obese individuals and 7,654 control subjects, all of European origin
(Supplementary Table4). By using a logistic regression model adjusted for age and sex,
we found that p.R270H associated with obesity under an additive model (OR=1.62
[1.31;2.00]95%; P=8.00×10⁻⁶; Table1); whereas we only found a trend for association
between p.R67C and obesity (OR=1.16 [1.02;1.31]95%; P=0.022; Table1). It is
noteworthy that these results were almost the same after adjusting for geographical
origin (Table1).
We then genotyped the p.R270H variant in 1,109 French pedigrees selected
for obesity (N=5,045) and in 780 German trios with one obese child (N=2,340). We
observed a significant over-transmission of the p.R270H low-frequency variant to obese
offsprings in 117 pedigrees/trios where the p.R270H variant was present (transmission =
62%, P=0.009, Supplementary Table5). This family-based study excludes a hidden
population stratification effect as a cause of spurious association.
The functional significance of both p.R67C and p.R270H mutations was
assessed in silico by using several softwares: arginine residues at position 67 and 270
8
presented a high evolutionary conservation pattern among mammals and the two amino
acid substitutions were predicted to be potentially damaging (Supplementary Table6). To examine the influences of the two non-synonymous variants on GPR120 function in
vitro, we assessed each receptor ability to mobilize [Ca2+]i in response to the
endogenous agonist α–linolenic acid (ALA). We found that ALA induced [Ca2+]i
responses in T-REx 293 cells expressing either WT or p.R67C receptor in a
dose-dependent manner, whereas ALA-induced [Ca2+]i responses in cells expressing
p.R270H were significantly lower (P=1.6×10⁻⁵) than those in cells expressing WT at
concentrations above 10µM ALA (Fig.3b). We further examined the functional ability
of the mutated receptors to secrete GLP-1 from human intestinal NCI-H716 cells, as
this cell line lacks GPR120 expression and it can secrete GLP-1 in a regulated manner5.
ALA induced secretion of GLP-1 in NCI-H716 cells expressing either WT (P=0.004) or
p.R67C (P=3.2×10⁻⁵) receptor, but not in NCI-H716 expressing p.R270H mutant
(P=0.96) (Fig.3c). Efficiency of transfection for each GPR120 variant receptor was
confirmed to be almost the same (data not shown). In order to examine the effect of the
p.R270H variant on the WT receptor signaling, we analyzed the [Ca2+]i dose-response
curves after the transfection of an empty vector, WT receptor plasmid, or p.R270H
mutated plasmid into T-REx 293 cells expressing WT GPR120. The transfection of the
p.R270H mutated plasmid suppressed dose-response curves, and maximal ALA-induced
[Ca2+]i response was significantly decreased (P=0.004; Fig.3d). Furthermore, to assess
the effect more quantitatively, we analyzed [Ca2+]i dose-response curves in T-REx 293
cells stably expressing bicistronic WT/WT, WT/p.R270H or p.R270H/WT receptors
(Fig.3e upper panel). Almost equal levels of receptor protein expression in each cell
line were confirmed by flow cytometry analysis (Fig.3e lower left panel). Compared
with cells expressing WT/WT receptor, the [Ca2+]i dose-response curves obtained in
cells expressing either WT/p.R270H or p.R270H/WT receptor were markedly
suppressed, and maximal ALA-induced [Ca2+]i response was significantly decreased
(P=1.2×10⁻⁵; Fig.3e lower right panel). These findings suggest that the p.R270H
variant which significantly associated with obesity has an inhibitory effect on GPR120.
The p.R270H mutant lacks the ability to transduce long-chain FFA signal, contrary to
the p.R67C mutant which did not associate with obesity.
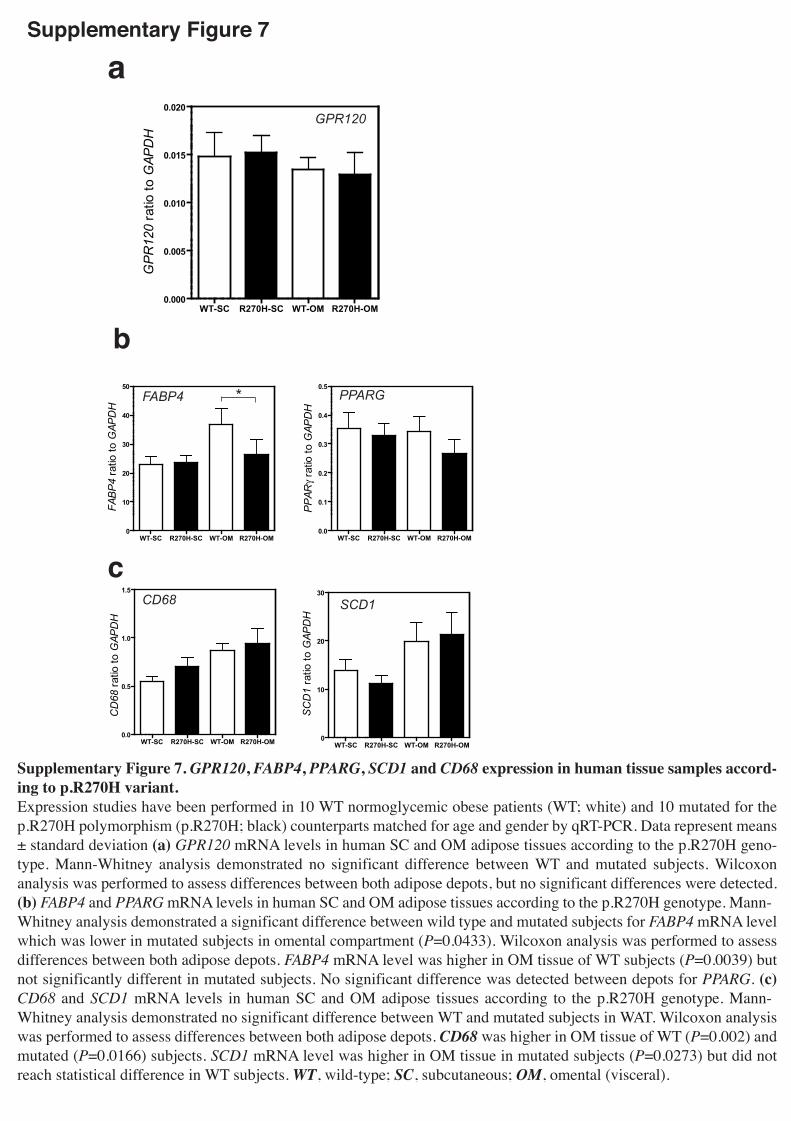
In order to analyze whether being a p.R270H variant carrier may impact on
GPR120 expression in the adipose tissue, samples from p.R270H carriers versus
9
non-carriers obese patients were quantified for GPR120 expression. Two hundred and
thirty-eight obese normoglycemic patients from the ABOS cohort were already
genotyped for the p.R270H variant. Ten subjects heterozygous for the p.R270H variant
were matched for age, gender and BMI with ten non carrier (WT) obese normoglycemic
patients (Supplementary Table7). The expression of GPR120 was similar between
p.R270H carriers and WT subjects, both in subcutaneous and omental adipose tissues
(Supplementary Fig.7a) suggesting that the presence of the functionally deleterious
mutation has no primary or secondary effect on gene expression in fat depots. The
adipogenesis marker PPARG, the lipogenesis-related factor SCD1 and the macrophage
marker CD68 were found similarly well-expressed in the adipose tissues of WT and
p.R270H carrier patients (Supplementary Fig.7b,c). Nevertheless, the expression of
the fatty acid binding protein FABP4 in omental adipose tissue was significantly lower
in p.R270H carriers compared to WT individuals (28% decrease; P=0.043),
(Supplementary Fig.7b).
In conclusion, we provide here for the first time convincing evidence for a
role of the lipid sensor GPR120 in obesity in both mice and humans. Given GPR120
role as a physiologic integrator of the environment (especially the fatty diet), these data
provide new insight about the molecular mechanisms by which the Westernized diet
may contribute to early onset obesity and associated complications including non
alcoholic steatohepatitis (NASH). It also brings some understanding of the metabolic
effects of the w-3 FAs which are often proposed as food supplements. This may open
novel avenues of research for drug development in the treatment of obesity, lipid
metabolism abnormalities and liver diseases, since FFA-sensing receptors represent
attractive drug targets.
METHODS SUMMARY GPR120-deficient mice were generated by deleting Gpr120 exon 1. All animal
procedures and euthanasia were reviewed by the local animal care committee approved
by local government authorities. Blood analysis, extraction and detection of mRNA and
proteins, and immunohistochemical analysis, were performed following standard
protocols as described previously5,24-26. Details of antibodies, primers and probes are
given in the Methods section. The level of significance for the difference between data
sets was assessed using the Student’s t-test. Analysis of variance followed by Tukey’s
10
test was used for multiple comparisons.
In human, GPR120 expression in liver and in both OM and SC adipose tissues was
assessed by quantitative RT-PCR (Taqman), in lean and obese subjects from the ABOS
cohort. The four GPR120 exons were sequenced in 312 French extremely obese
subjects following a standard Sanger protocol. The two identified non-synonymous
variants (p.R270H and p.R67C/rs6186610) were subsequently genotyped in a large
European obesity case-control study (Ncases=6,942/ Ncontrols=7,654), by High Resolution
Melting (HRM) and TaqMan, respectively. Association between obesity status and each
variant was assessed using a logistic regression adjusted for age and gender, and then
for age, gender and geography origin, under an additive model. The consequences of
both identified non-synonymous variants on GPR120 function ([Ca2+]i response and
GLP-1 secretion) were assessed in vitro. The human study protocol was approved by
the local ethics committee, and participants from all of the studies signed an informed
consent form.
METHODS
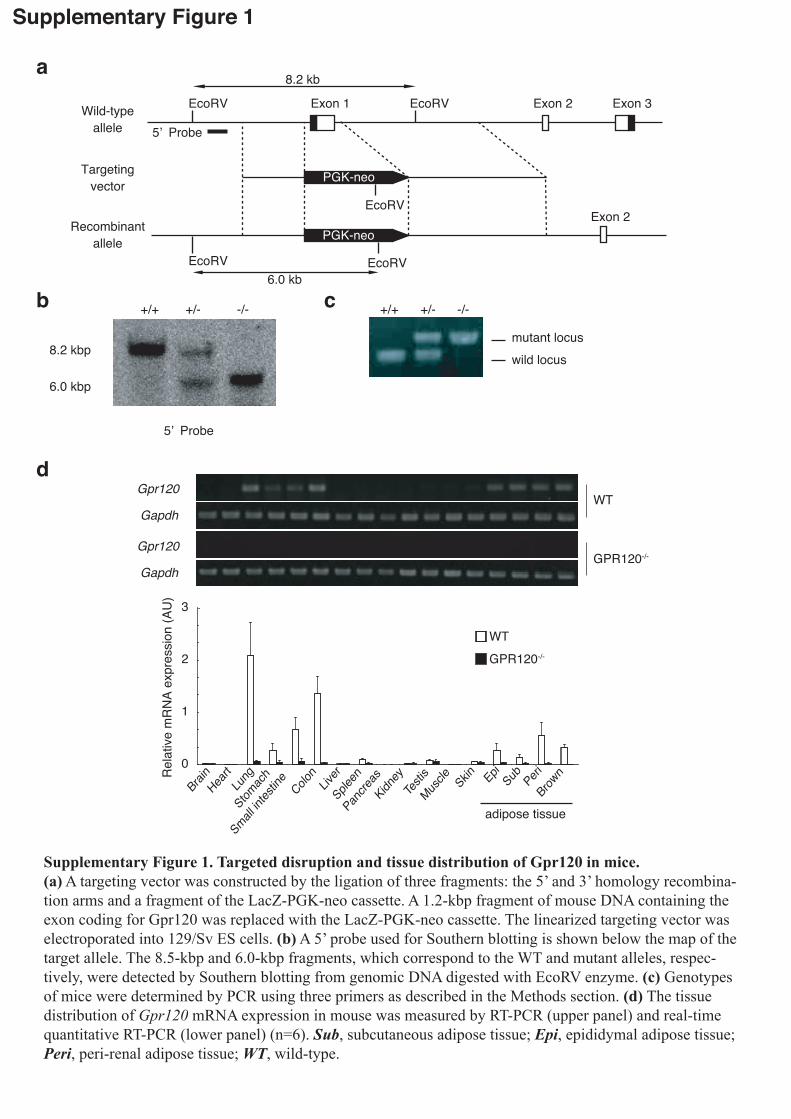
Generation and genotyping of GPR120-deficient mice. GPR120-deficient mice on a
mixed C57Bl/6 /129 background were generated by homologous recombination. Exon 1
of the Gpr120 gene was replaced with a PGK-neo cassette (Supplementary Fig.1).
Animals. Mice were housed under a 12hr light-dark cycle and given regular chow, MF
(Oriental Yeast Co., Ltd.). For HFD studies, 5-week-old male mice were placed on a
58Y1 diet (PMI Nutrition International) for a total period of 11 weeks. The methods
used for animal care and experimental procedures were approved by the Animal Care
Committee of Kyoto University.
Indirect calorimetry. Twenty-four hr energy expenditure and respiratory quotient (RQ)
were measured by indirect calorimetry, using an open-circuit calorimeter system
(MK-5000RQ, Muromachi Kikai Co. Ltd.). RQ is the ratio of the carbon dioxide
production to the oxygen consumption (VO2). Energy expenditure was calculated as the
product of calorific value of oxygen (3.815 + 1.232 × RQ) and VO2. Locomotor activity
was measured by using an infrared ray passive sensor system (Supermex, Muromachi
Kikai Co. Ltd.).

11
Histology and immunohistochemistry. Epididymal adipose and pancreatic tissues
were fixed in 10% neutral-buffered formalin, embedded in paraffin, and sectioned at
5mm. Hematoxylin and eosin (H&E) staining was performed using standard techniques.
In order to measure diameter of adipocytes and area of pancreatic islets, the diameters
of 100 cells from five sections from each group were measured using NIH Image
software. More than 10 fields were examined, islet area was traced and total islet area
was calculated and expressed as the average score. Liver tissues were embedded in
OCT compound (Sakura Finetech) and snap-frozen in liquid nitrogen. Tissue sections
were stained with oil red O (Sigma-Aldrich) for lipid deposition using standard
methods.
Triglyceride (TG) content assay. In order to determine the TG content of liver, tissue
was homogenized with 1/2.5/1.25 (vol/vol) 0.5M acetic acid/methanol/chloroform. The
mixture was shaken and 1.25 volumes of chloroform added. The mixture was shaken
overnight, and then 1.25 volumes of 0.5M acetic acid added. After centrifugation at
1,500g for 10min, the organic layer was collected, dried and resuspended in 100%
isopropyl alcohol. Measurements were conducted using TG E-test Wako (Wako).
Glucose tolerance and insulin tolerance tests. Glucose tolerance assays were
performed on 24hr-fasted mice. After baseline glucose values were individually
established using One Touch Ultra (LifeScan), each mouse was given an intraperitoneal
(i.p.) injection of 1.5mg glucose/g body weight. Insulin tolerance was conducted using
the same glucometer. After baseline glucose values were established, mice were given
human insulin (0.75mU/g i.p. Sigma-Aldrich). Clearance of plasma glucose was
subsequently monitored at 15, 30, 60, 90 and 120min post-injection.
Immunoblot analysis. For insulin stimulation, 5U of insulin (Sigma-Aldrich) was
injected via the inferior vena cava. Five minutes later, samples of liver, skeletal muscle
or WAT were dissected and immediately frozen in liquid nitrogen. Immunoblot analysis
were performed as described previously5,24. Anti-IRS1 (Millipore), anti-IRS2
(Millipore), anti-SCD1 (Santa Cruz Biotechnology), anti-IRb anti-Akt (Cell Signaling
12
Technology), anti-pAkt (Cell Signaling Technology) and anti-b-actin (Sigma-Aldrich) antibodies were used as the primary antibody.
Mouse gene expression analysis. Total RNA was extracted from tissue or cells using
ISOGEN (Nippon Gene). Quantitative RT-PCR and microarray analysis were performed
as described previously24,26. Briefly, genome-wide mRNA expression profiles were
obtained by microarray analysis with the Affymetrix GeneChip Mouse 430 2.0 Array,
according to the manufacturer’s instructions. We used the robust multi-array analysis
(RMA) expression measure that represents the log transformation of intensities
(background corrected and normalized) from the GeneChips27. Functional associations
between differentially expressed genes were analyzed using Ingenuity Pathways
Analysis (version 4.0, Ingenuity Systems). The microarray data are available from the
Gene Expression Omnibus (GEO, http://www.ncbi.nlm.nih.gov/geo/) with the accession
number 32095.
Micro-computed tomography (micro-CT) scanning. Images were obtained using a
micro-CT system (SHIMADZU ClairvivoCT) with a high-resolution flat panel detector.
The maximum resolution of this modality was less than 40mm. The measurement
condition of the scanner was assumed to be cylindrical field of view (FOV) of the
section view of 65.3mm and the trans-axial view of 300mm. The x-ray source was
biased at 60keV with the anode current set to 160mA. CT images were analyzed with
Osirix software.
Fatty acid composition of epididymal WAT, liver and plasma. Esterified and
non-esterified fatty acid composition was measured by gas chromatography. Briefly, in
order to analyze esterified fatty acid, epididymal adipose tissue (20-25mg), liver
(25-30mg), and plasma (100ml) samples were snap-frozen in liquid nitrogen and
homogenized in 4ml of 0.5N KOH-Methanol. Samples were then boiled at 100°C for
30min to hydrolyze. Total lipids in each sample homogenate were then extracted with
hexane, followed by trans-esterification of fatty acids with the boron
trifluoride-methanol at 100°C for 15min. Methylated fatty acids were then extracted
with hexane and analyzed using a GC-2010AF gas chromatograph (SHIMADZU). For
the analysis of non-esterified fatty acid, epididymal adipose tissue (10-15mg), liver
13
(10-15mg), and plasma (100ml) samples were snap-frozen in liquid nitrogen and
homogenized in a mixture of 1.2ml water, 3ml methanol and 1.5ml chloroform. Total
lipids in each sample homogenate were extracted with a mixture of 1.2ml of water and
1.2ml of chloroform, followed by silylation of fatty acids with
N,O-Bis(trimethylsilyl)trifluoroacetamide with 1% Trimethylchlorosilane
(BSTFA-TMCS) at 100°C for 60min. Silylated fatty acids were then extracted with
hexane and analyzed using a GC-2010AF gas chromatograph (SHIMADZU).
Mouse embryonic fibroblast (MEF) adipogenesis assay. In order to prepare MEFs,
we minced 13.5-days post-coital mouse embryos and digested them with trypsin. Cells
were collected and cultured in modified Eagle’s medium (a-MEM; supplemented with
10% fetal bovine serum (FBS), 50U/ml penicillin and 50mg/ml streptomycin). We
induced confluent MEFs to undergo adipogenic differentiation by incubating them first
for 2 days with 10mg/ml insulin, 250nM dexamethasone and 0.5mM
isobutylmethylxanthine (Sigma-Aldrich). We measured cellular triglyceride content
with Triglyceride E-test Wako (Wako).
Lipid Infusion. Intralipid solution with 2mM triglycerides:palmitoleate was prepared
using a previously described protocol4. Briefly, lipids were dissolved in a solvent
containing 5% glycerol and 0.72% phosphocholine in 0.9% saline and sonicated
repeatedly. Lipids stayed in suspension for 1 week and had to be vortexed well before
loading the syringe and tubing to prevent clogging. Before lipid infusion, mice were
anesthetized, and an indwelling catheter was inserted in the left internal jugular vein.
After overnight fasting, lipids were infused at a rate of 500ml/kg/hr for 6hr. At the end
of the infusion, tissues were collected.
Statistical analysis of GPR120-deficient mouse study. The level of significance for
the difference between data sets was assessed using the Student’s t-test. Analysis of
variance followed by Tukey’s test was used for multiple comparisons. Data were
expressed as means ± standard error. P<0.05 was considered to be statistically
significant.
Human study population. The study protocol was approved by all local ethics
14
committees and an informed consent was obtained from each subject before
participating in the study, in accordance with the Declaration of Helsinki principles. For
children younger than 18 years, an oral consent was obtained and parents provided
written informed consent. All subjects were of European origin.
Human gene expression analysis. We used liver, SC and OM adipose tissue samples
from the ABOS (‘Atlas Biologique de l’Obésité Sévère’) cohort (ClinicalGov
NCT01129297), a cohort study conducted in the ‘Département de Chirurgie Générale et
Endocrinienne’ (Lille CHRU)28. Total RNA was extracted from the tissues using
RNeasy protect Mini Kit (QIAGEN) and quantified by absorbance in nm at A260/A280
in a PerkinElmer spectrophotometer. Human GPR120, FABP4, PPARG, CD68 and
SCD1 mRNA levels were quantified by reverse transcription reaction followed by real
time quantitative RT-PCR. Quantitative assessment of human mRNA expression was
performed using TaqMan Gene Expression Assays (Hs01111664_m1: GPR120 and
Hs99999905_m1: GAPDH; Hs00609791_m1: FABP4; Hs00234592_m1: PPARG;
Hs00154355_m1: CD68; Hs01682761_m1: SCD1; Applied Biosystems) with Applied
Biosystems 7900HT Fast Real-Time PCR System. As an internal control for potential
housekeeper reference variability, gene transcript levels were normalized to GAPDH
reference housekeeper transcript level. The mean of triplicate cycle thresholds (CTs) of
the target was normalized to the mean of triplicate CTs of the reference internal
housekeeper genes using the formula: 2^(CT(GAPDH) - CT(target)) which yielded a relative
target-to-reference transcript concentration value, as a fraction of reference transcript.
Samples for which the CT was above 35 were excluded from the analysis.
GPR120 exons sequencing. We sequenced the four GPR120 exons in 312 obese
patients including 121 French obese adults and 191 French obese children who were
recruited by the CNRS-UMR8199 unit and the Department of Nutrition of Paris Hotel
Dieu Hospital. GPR120 (or O3FAR1) is located on human chromosome 10q23.33 and
encodes a 377-amino-acid protein (NCBI NM_181745.3 and NP_859529). PCR
conditions and primers sequences are available upon request. Fragments were
bidirectionally sequenced using the automated 3730xl DNA Analyzer (Applied
Biosystems). Electrophoregram reads were assembled and analysed using the Variant
15
Reporter software (Applied Biosystems). The location of each variant is displayed by
base numbers counting from the ATG-translation initiation codon according to the
Human Genome Variation Society nomenclature for the description of sequence
variations. The position of mutations was indicated according to the human genome
build NCBI36/hg18.
Genotyping of both p.R270H and p.R67C/rs6186610 variants. We genotyped the
two non-synonymous variants in 6,942 unrelated obese subjects and in 7,654 control
subjects, all of European descent. Genotyped populations are described in
Supplementary Table4. The set of obese subjects included: 516 unrelated French obese
children who were recruited by the CNRS-UMR8199 unit or Toulouse Children’s
Hospital29; 332 Italian obese children from Verona30 or Rome31; 170 Finnish obese
adolescents from the Northern Finland Birth Cohort 1986 (NFBC1986) cohort32; 1,164
unrelated French obese adults from the ABOS cohort28 or recruited by the
CNRS-UMR8199 unit and the Department of Nutrition of Paris Hotel Dieu Hospital29;
2,514 Belgian obese patients from the outpatient obesity clinic at the Antwerp
University Hospital33; 1,736 Swiss obese subjects which were recruited after gastric
surgery in Zurich34; and 510 Greek obese subjects recruited in the Hippokration
Hospital of Thessaloniki or in the Second Department of Internal Medicine of the
Hospital of Alexandroupolis35. The set of control subjects included: 422 Italian lean
children from Verona30; 4,639 Finnish lean adolescents from the NFBC1986 cohort32;
1,976 French lean adults from the D.E.S.I.R (Data from the Epidemiological Study on
the Insulin Resistance syndrome) prospective study36 and from the Haguenau study37;
148 Belgian lean subjects from Antwerp Hospital33; and 469 Greek lean individuals
recruited by medical examination centers of Thessaloniki35. The 1,109 French pedigrees
selected for obesity have been recruited by the CNRS-UMR819938, and the 780 German
childhood obesity trios have been recruited at the Universities of Marburg and Essen39.
The p.R270H variant was genotyped using the LightCycler 480 High Resolution
Melting (HRM) Master kit (Roche), following the manufacturer’s protocol. Genotyping
of p.R67C/rs6186610 was performed using a custom TaqMan assay according to the
manufacturer’s instructions (Applied Biosystems). Allelic discrimination was performed
using Applied Biosystems 7900HT Fast Real-Time PCR System and SDS 2.3 software.
For both variants, genotype success rate was at least 95% and no deviation (P>0.05)
16
from Hardy-Weinberg equilibrium was observed in any of the examined populations.
Phenotyping. The 90th and 97th BMI percentiles were used as thresholds for childhood
overweight and obesity, respectively, according to the recommendations of the
European Childhood Obesity Group study in local reference populations40,41. Adult
subjects were defined as normal (BMI<25kg/m²), overweight (25≤BMI<30kg/m²), and
obese (BMI≥30kg/m²) according to the International Obesity Task Force
recommendations.
In silico analysis of both p.R270H and p.R67C variants. Phylogenetic conservation
of part of GPR120 containing each non-synonymous variant was assessed using UCSC
genome browser (Vertebrate Multiz Alignment & Conservation), based on a
phylogenetic hidden Markov model, phastCons42. To predict possible impact of both
amino acid substitutions on the structure and function of GPR120, we used several
softwares: 1/ PolyPhen (Polymorphism Phenotyping) web-based program43,44; 2/
PANTHER (Protein ANalysis THrough Evolutionary Relationships)45; 3/ SIFT (Sorting
Intolerant From Tolerant) algorithm46; 4/ SNAP (Screening for Non-Acceptable
Polymorphisms) software47; and 5/ PMUT web-based program48.
Plasmid construction. FLAG-human GPR120/pcDNA5/FRT/TO plasmid was
constructed by ligated GPR120 cDNA into the multicloning site of the mammalian
expression vector pcDNA5/FRT/TO (Invitrogen) with the N-terminal FLAG tag. Point
mutation for constructing the FLAG-human GPR120 p.R67C/pcDNA5/FRT/TO and
FLAG-GPR120 p.R270H/pcDNA5/FRT/TO was carried out using the following
primers; p.R67C (sense: 5’-ggtgctggtggcgTgccgacgacgcc-3’; anti-sense:
5’-ggcgtcgtcggcAcgccaccagcacc-3’) and p.R270H (sense:
5’-agccaccagatccAcgtgtcccagcaggac-3’; anti-sense:
5’-gtcctgctgggacacgTggatctggtggct-3’). All constructs were confirmed by DNA
sequencing.
Cell lines and cell culture. Flp-In T-REx-293 (T-REx 293) cells (Invitrogen) were used
to develop inducible and stable cell lines T-REx GPR120 (WT, p.R270H or p.R67C).
T-REx 293 cells were routinely cultured in Dulbecco’s modified Eagle’s medium

17
(DMEM) (Sigma) supplemented with 10% FBS, 100µg/ml zeocin (Invitrogen), and
10µg/ml blasticidin S (Funakoshi). T-REx 293 cells were transfected with
FLAG-GPR120 (WT, p.R270H or p.R67C)/pcDNA5/FRT/TO using Lipofectamine
Reagent (Invitrogen) and selected with DMEM, which had been supplemented with
10% FBS, 10µg/ml blasticidin S, and 100µg/ml hygromycin B (Gibco BRL). GPR120
protein expression was induced by adding 10µg/ml of doxycycline hyclate (Dox)
(Sigma) for 48hr. Human NCI-H716 cells were obtained from the American Type
Culture Collection (Manassas). Cells were grown in suspension in Roswell Park
Memorial Institute (RPMI) 1640 medium supplemented with 10% FBS, 100IU/ml
penicillin, and 100µg/ml streptomycin.
[Ca2+]i response analysis. Cells were seeded at a density of 2×10⁵ cells/well on
collagen-coated 96-well plates, incubated at 37°C for 21hr, and then incubated in
Hanks’ Balanced Salt Solution (HBSS, pH7.4) containing Calcium Assay Kit
Component A (Molecular Devices) for 1hr at room temperature. α-Linolenic acid
(ALA) used in the fluorometric imaging plate reader (FLIPR, Molecular Devices) assay
were dissolved in HBSS containing 1% DMSO and prepared in another set of 96-well
plates. These plates were set on the FLIPR, and mobilization of [Ca2+]i evoked by
agonists was monitored.
Transfection. Cells were seeded into 3.5cm dish at a density of 1×10⁶ cells before
transfection. NCI-H716 cells were transfected with 5µg of each plasmid using
Lipofectamine 2000 (Invitrogen) according to the manufacturer's protocol. At 24hr
post-transfection, transfection of each FLAG-tagged each construct was confirmed by
anti-FLAG FACS analysis. Then, the cells were re-seeded in 24-well culture plates
coated with Matrigel matrix (BD Biosciences) at a density of approximately 3×10⁵ cells
per well for the secretion studies. To test the effect of variant receptors on ALA-induced
[Ca2+]i response of WT receptor, T-REx 293 cells expressing Dox-inducible
FLAG-GPR120 WT were seeded into 15cm dish at a density of 2×10⁷ cells before
transfection. Cells were then transfected with 32µg of each plasmid (empty vector, WT
and p.R270H GPR120) using Lipofectamine 2000 (Invitrogen) according to the
manufacturer's protocol. At 24hr post-transfection, cells were re-seeded at a density of
2×10⁵ cells/well on collagen-coated 96-well plates and treated with 10µg/ml of Dox,
18
then at 48hr post-transfection ALA-induced [Ca2+]i response was monitored.
GLP-1 secretion analysis. Cells were serum-starved with FBS-free DMEM for 3hr,
washed with HBSS, and incubated for 2hr at 37°C in 0.3ml FBS-free DMEM
containing DMSO (negative control), 1µM phorbol 12-myristate 13-acetate (PMA;
positive control), or 100µM ALA. Supernatants were collected and active GLP-1
concentration in the supernatant was determined by enzyme immunoassay using GLP-1
(Active) ELISA Kit (Millipore).
Flow cytometry analysis. Anti-Flag (Sigma, St. Louis, MO) and anti-HA (Roche, Indianapolis, IN) antibodies
were used for staining. Data were acquired and analyzed on FACSCalibur with
CellQuest software (Becton Dickinson, Franklin Lakes, New Jersey)
Statistical analysis of human study. We assessed the effect of both non-synonymous
variants (p.R270H and p.R67C) on obesity using a logistic regression adjusted for age
and gender, and then for age, gender and geography, under an additive model, by using
R software (version 2.12). Adjustment for geography was achieved so as to reflect a
North-South gradient between the six different countries of origin of the study
participants. An ordinal variable was created and coded: 1 for Finland, 2 for Belgium, 3
for France and Switzerland, 4 for Italy and 5 for Greece. The latter variable was added
as a covariate in logistic regression model.
Data analysis for [Ca2+]i response was performed using Igor Pro (WaveMetrics).
Significant differences between expression among WT and heterozygous groups, and
among lean and obese WT subjects were assessed using non-parametric Mann-Whitney
analysis (GraphPad Prism 5 software).
19
REFERENCES 1. Nunez, E.A. Biological complexity is under the 'strange attraction' of
non-esterified fatty acids. Prostaglandins Leukot Essent Fatty Acids 57, 107-110
(1997).
2. Haber, E.P., et al. Pleiotropic effects of fatty acids on pancreatic beta-cells. J
Cell Physiol 194, 1-12 (2003).
3. Itoh, Y., et al. Free fatty acids regulate insulin secretion from pancreatic beta
cells through GPR40. Nature 422, 173-176 (2003).
4. Cao, H., et al. Identification of a lipokine, a lipid hormone linking adipose tissue
to systemic metabolism. Cell 134, 933-944 (2008).
5. Hirasawa, A., et al. Free fatty acids regulate gut incretin glucagon-like peptide-1
secretion through GPR120. Nat Med 11, 90-94 (2005).
6. Steneberg, P., Rubins, N., Bartoov-Shifman, R., Walker, M.D. & Edlund, H. The
FFA receptor GPR40 links hyperinsulinemia, hepatic steatosis, and impaired
glucose homeostasis in mouse. Cell Metab 1, 245-258 (2005).
7. Wang, J., Wu, X., Simonavicius, N., Tian, H. & Ling, L. Medium-chain fatty
acids as ligands for orphan G protein-coupled receptor GPR84. J Biol Chem 281,
34457-34464 (2006).
8. Ichimura, A., Hirasawa, A., Hara, T. & Tsujimoto, G. Free fatty acid receptors
act as nutrient sensors to regulate energy homeostasis. Prostaglandins Other
Lipid Mediat 89, 82-88 (2009).
9. Maslowski, K.M., et al. Regulation of inflammatory responses by gut
microbiota and chemoattractant receptor GPR43. Nature 461, 1282-1286 (2009).
10. Ahmed, K., et al. An autocrine lactate loop mediates insulin-dependent
inhibition of lipolysis through GPR81. Cell Metab 11, 311-319 (2010).
11. Oh da, Y., et al. GPR120 is an omega-3 fatty acid receptor mediating potent
anti-inflammatory and insulin-sensitizing effects. Cell 142, 687-698 (2010).
12. Hara, T., Hirasawa, A., Ichimura, A., Kimura, I. & Tsujimoto, G. Free fatty acid
receptors FFAR1 and GPR120 as novel therapeutic targets for metabolic
disorders. J Pharm Sci 100, 3594-3601 (2011).
13. Kimura, I., et al. Short-chain fatty acids and ketones directly regulate
sympathetic nervous system via G protein-coupled receptor 41 (GPR41). Proc
Natl Acad Sci U S A 108, 8030-8035 (2011).
20
14. Gotoh, C., et al. The regulation of adipogenesis through GPR120. Biochem
Biophys Res Commun 354, 591-597 (2007).
15. Tanaka, T., et al. Free fatty acids induce cholecystokinin secretion through
GPR120. Naunyn Schmiedebergs Arch Pharmacol 377, 523-527 (2008).
16. Miyauchi, S., et al. Distribution and regulation of protein expression of the free
fatty acid receptor GPR120. Naunyn Schmiedebergs Arch Pharmacol 379,
427-434 (2009).
17. Kido, Y., et al. Tissue-specific insulin resistance in mice with mutations in the
insulin receptor, IRS-1, and IRS-2. J Clin Invest 105, 199-205 (2000).
18. Bernal-Mizrachi, E., Wen, W., Stahlhut, S., Welling, C.M. & Permutt, M.A. Islet
beta cell expression of constitutively active Akt1/PKB alpha induces striking
hypertrophy, hyperplasia, and hyperinsulinemia. J Clin Invest 108, 1631-1638
(2001).
19. Hosooka, T., et al. Dok1 mediates high-fat diet-induced adipocyte hypertrophy
and obesity through modulation of PPAR-gamma phosphorylation. Nat Med 14,
188-193 (2008).
20. Ntambi, J.M., et al. Loss of stearoyl-CoA desaturase-1 function protects mice
against adiposity. Proc Natl Acad Sci U S A 99, 11482-11486 (2002).
21. Gutierrez-Juarez, R., et al. Critical role of stearoyl-CoA desaturase-1 (SCD1) in
the onset of diet-induced hepatic insulin resistance. J Clin Invest 116, 1686-1695
(2006).
22. Jeyakumar, S.M., et al. Fatty acid desaturation index correlates with body mass
and adiposity indices of obesity in Wistar NIN obese mutant rat strains
WNIN/Ob and WNIN/GR-Ob. Nutr Metab (Lond) 6, 27 (2009).
23. Brown, J.M., et al. Combined therapy of dietary fish oil and stearoyl-CoA
desaturase 1 inhibition prevents the metabolic syndrome and atherosclerosis.
Arterioscler Thromb Vasc Biol 30, 24-30 (2010).
24. Ichimura, A., Ruike, Y., Terasawa, K., Shimizu, K. & Tsujimoto, G.
MicroRNA-34a inhibits cell proliferation by repressing mitogen-activated
protein kinase kinase 1 during megakaryocytic differentiation of K562 cells. Mol
Pharmacol 77, 1016-1024 (2010).
25. Hara, T., et al. Novel selective ligands for free fatty acid receptors GPR120 and
GPR40. Naunyn Schmiedebergs Arch Pharmacol 380, 247-255 (2009).
21
26. Sun, Q., et al. Structure-activity relationships of GPR120 agonists based on a
docking simulation. Mol Pharmacol 78, 804-810 (2010).
REFERENCES (for METHODS)
27. Gautier, L., Cope, L., Bolstad, B.M. & Irizarry, R.A. affy--analysis of
Affymetrix GeneChip data at the probe level. Bioinformatics 20, 307-315
(2004).
28. Poulain-Godefroy, O., Lecoeur, C., Pattou, F., Fruhbeck, G. & Froguel, P.
Inflammation is associated with a decrease of lipogenic factors in omental fat in
women. Am J Physiol Regul Integr Comp Physiol 295, R1-7 (2008).
29. Meyre, D., et al. Genome-wide association study for early-onset and morbid
adult obesity identifies three new risk loci in European populations. Nat Genet
41, 157-159 (2009).
30. Morandi, A., et al. The Q121 variant of ENPP1 may protect from childhood
overweight/obesity in the Italian population. Obesity (Silver Spring) 17, 202-206
(2009).
31. Buzzetti, R., et al. PPAR-gamma2 Pro12Ala variant is associated with greater
insulin sensitivity in childhood obesity. Pediatr Res 57, 138-140 (2005).
32. Jarvelin, M.R., et al. Ecological and individual predictors of birthweight in a
northern Finland birth cohort 1986. Paediatr Perinat Epidemiol 11, 298-312
(1997).
33. Peeters, A., et al. Variants in the FTO gene are associated with common obesity
in the Belgian population. Mol Genet Metab 93, 481-484 (2008).
34. Steffen, R., Potoczna, N., Bieri, N. & Horber, F.F. Successful multi-intervention
treatment of severe obesity: a 7-year prospective study with 96% follow-up.
Obes Surg 19, 3-12 (2009).
35. Rouskas, K., et al. Association between BBS6/MKKS gene polymorphisms,
obesity and metabolic syndrome in the Greek population. Int J Obes (Lond) 32,
1618-1625 (2008).
36. Balkau, B. [An epidemiologic survey from a network of French Health
Examination Centres, (D.E.S.I.R.): epidemiologic data on the insulin resistance
syndrome]. Rev Epidemiol Sante Publique 44, 373-375 (1996).
22
37. Jaquet, D., Collin, D., Levy-Marchal, C. & Czernichow, P. Adult height
distribution in subjects born small for gestational age. Horm Res 62, 92-96
(2004).
38. Meyre, D., et al. R125W coding variant in TBC1D1 confers risk for familial
obesity and contributes to linkage on chromosome 4p14 in the French
population. Hum Mol Genet 17, 1798-1802 (2008).
39. Jarick, I., et al. Novel common copy number variation for early onset extreme
obesity on chromosome 11q11 identified by a genome-wide analysis. Hum Mol
Genet 20, 840-852 (2011).
40. Poskitt, E.M. Defining childhood obesity: the relative body mass index (BMI).
European Childhood Obesity group. Acta Paediatr 84, 961-963 (1995).
41. Rolland-Cachera, M.F., et al. Body Mass Index variations: centiles from birth to
87 years. Eur J Clin Nutr 45, 13-21 (1991).
42. Siepel, A., et al. Evolutionarily conserved elements in vertebrate, insect, worm,
and yeast genomes. Genome Res 15, 1034-1050 (2005).
43. Ramensky, V., Bork, P. & Sunyaev, S. Human non-synonymous SNPs: server
and survey. Nucleic Acids Res 30, 3894-3900 (2002).
44. Sunyaev, S., et al. Prediction of deleterious human alleles. Hum Mol Genet 10,
591-597 (2001).
45. Thomas, P.D., et al. PANTHER: a library of protein families and subfamilies
indexed by function. Genome Res 13, 2129-2141 (2003).
46. Kumar, P., Henikoff, S. & Ng, P.C. Predicting the effects of coding
non-synonymous variants on protein function using the SIFT algorithm. Nat
Protoc 4, 1073-1081 (2009).
47. Bromberg, Y., Yachdav, G. & Rost, B. SNAP predicts effect of mutations on
protein function. Bioinformatics 24, 2397-2398 (2008).
48. Ferrer-Costa, C., et al. PMUT: a web-based tool for the annotation of
pathological mutations on proteins. Bioinformatics 21, 3176-3178 (2005).
23
ACKNOWLEDGEMENTS
We are indebted to all subjects who participated in these studies. In Japan, the study was
supported in part by research grants from the Japan Society for the Promotion of
Science, the Ministry of Education, Culture, Sports, Science and Technology of Japan,
the Japan Science and Technology Agency and the “Funding Program for
World-Leading Innovative R&D on Science and Technology (FIRST Program),”
initiated by the Council for Science and Technology Policy. A.I. is a fellow supported
by the Japan Society for the Promotion of Science. A.B. is a fellow supported by the EU
funded EUROCHIP consortium. In France, the study was supported by ‘le Conseil
Régional Nord Pas de Calais / FEDER’ and the ‘Agence Nationale de la Recherche’
(Programme de Recherche en Nutrition et Alimentation, SensoFAT). NFBC1986
received financial support from the Academy of Finland, University Hospital of Oulu
(Finland), University of Oulu (Finland), the European Commission (EURO-BLCS,
Framework 5 award QLG1-CT-2000-01643), and the Medical Research Council
(G0500539, G0600705, PrevMetSyn/SALVE). We thank ABOS consortium and
CIC-CCPPRB (Lille CHRU) team for their help in samples handling and clinical data
collection. We are grateful to Marianne Deweirder and Frederic Allegaert for human
DNA bank management.
CONFLICT OF INTEREST STATEMENT The authors declare that they have no competing financial interests.
AUTHOR CONTRIBUTIONS A.I. A.H. O.P-G. and A.B. are equally contributing first authors. G.T. and P.F. conceived
the mouse and human project, respectively. A.I., A.H., A.B., P.F. and G.T. drafted the
manuscript. O.P-G., H.C., D.M. and I.W. reviewed/edited the manuscript and
contributed to discussion. A.H. and G.T. designed the mouse research. A.I., A.H., K.I.
and G.T. created Gpr120 mutant mice. A.I., A.H., A.K., T.H., I.K., T-a.K., K.A., M.T.,
K.O, N.L. and G.T. conducted biochemical and histochemical analyses for the mouse
study. A.I. and A.H. performed bioinformatic analysis for the mouse study. L.Y. and C.L.
performed the statistical analyses, and A.B. contributed to statistical analyses for the
human study. O.P-G. and I.W. designed the human expression gene study. A.L.
performed the human expression gene study. H.C. and S.V. performed GPR120

24
sequencing and variants genotyping, respectively. P.B., M.T., C.M., A.M., R.B., P.E.,
M-R.J., W.VH., L.VG., F.H., B.B., C.L-M., K.R., A.K. and F.P. contributed to
cohort-study samples and researched data.

25
Table 1. List of identified variants in GPR120 exons and association between p.R67C/rs6186610 or p.R270H non-synonymous
variants and obesity.
Variants Nucleotide
change Chr10
position MAF1
MAF2
(controls/ N = 7,654)
MAF2 (cases/
N = 6,942)
Adjustment: age and gender
Adjustment: age, gender and geography
OR [95%CI] P-value OR [95%CI] P-value
Mis
sens
e
Varia
nts
p.R67C/ rs6186610
C>T 95,316,666 0.05 0.043 0.055 1.16
[1.02;1.31] 0.022
1.13 [1.00;1.28]
0.060
p.R270H G>A 95,337,031 0.03 0.013 0.024 1.62
[1.31;2.00] 8.00×10⁻⁶
1.58 [1.28;1.95]
2.17×10⁻⁵
Syno
nym
ous
Varia
nts
p.V38V G>A 95,316,581 0.0016 - - - - - -
p.S192S G>A 95,325,846 0.0016 - - - - - -
p.V243V C>T 95,328,938 0.0016 - - - - - -
p.S264S G>A 95,337,014 0.0016 - - - - - -
Variant position was indicated according to the human genome build NCBI36/hg18. Association between p.R67C/rs6186610 or
p.R270H variants and obesity was assessed by using a logistic regression adjusted for age/gender or for age/gender/geography, under an
additive model. Chr, chromosome; MAF1, minor allele frequency in sequencing data set (N = 312 extremely obese individuals); MAF2,
minor allele frequency in the large obesity case-control genotyping data set; OR, odds ratio; CI, confidence interval.
26
Supplementary Table 1. Biochemical analyses of WT and GPR120-deficient mice fed a normal diet (ND) or a high-fat diet
(HFD).
Parameters ND HFD
WT (n = 5) GPR120-/- (n = 5) P-value WT (n = 15) GPR120-/- (n = 13) P-value
Total protein (g/dl) 4.4 ± 0.19 4.86 ± 0.08 0.190 5.11 ± 0.12 4.95 ± 0.08 0.324
A/G ratio 1.74 ± 0.08 1.74 ± 0.06 0.527 1.51 ± 0.06 1.57 ± 0.06 0.445
Albumin (mg/dl) 2.8 ± 0.15 3.08 ± 0.09 0.062 3.05 ± 0.1 3.02 ± 0.05 0.755
Bilirubin (mg/dl) 0.06 ± 0.01 0.05 ± 0.01 0.883 0.06 ± 0 0.04 ± 0 0.034
Triglyceride (mg/dl) 27.6 ± 7.16 22.4 ± 2.66 0.593 62.4 ± 9.04 49.08 ± 4.25 0.216
Phospholipid (mg/dl) 164.6 ± 21.27 164.6 ± 5.52 0.882 224.13 ± 12.93 258.62 ± 10.32 0.052
Nonesterified fatty acid (μEQ/l) 556.8 ± 108.63 403 ± 50.38 0.202 886.27 ± 76.52 911.31 ± 65.95 0.809
HDL cholesterol (mg/dl) 56 ± 7.83 55.6 ± 2.2 0.790 58.55 ± 4.23 71.5 ± 3.24 0.027
LDL cholesterol (mg/dl) 4.2 ± 0.65 5.2 ± 0.22 0.076 11 ± 2.27 17.9 ± 1.7 0.027
Total cholesterol (mg/dl) 85.8 ± 11.58 89 ± 1.52 0.553 130.87 ± 9.87 167.31 ± 8.94 0.012
Aspartate aminotransferase (AST) (IU/l) 164.8 ± 42.78 85.8 ± 14.14 0.124 124.2 ± 13.03 145.85 ± 20.19 0.364
Alanine aminotransferase (ALT) (IU/l) 23.2 ± 7.24 32.4 ± 8.12 0.402 53.8 ± 12.52 131 ± 25.9 0.009
Data are means ± standard error. HDL, high density lipoprotein; LDL, low density lipoprotein
27
Supplementary Table 2. Clinical characteristics of the fourteen obese subjects and
the fourteen selected lean subjects, matched for age and gender. No subjects
carried the p.R270H variant and all of them were normoglycemic.
Parameters Lean subjects
(n = 14) Obese subjects
(n = 14)
Age (years) 41.57 ± 10.54 41.36 ± 10.64
Sex ratio (men:women) 4:10 4:10
BMI (kg/m2) 21.69 ± 1.93 52.71 ± 8.68***
Total cholesterol (mg/dl) 175.7 ± 40.0 194.8 ± 34.5
HDL cholesterol (mg/dl) 61.16 ± 18.32 48.56 ± 11.24*
LDL cholesterol (mg/dl) 92.0 ± 35.4 123.1 ± 28.3*
Triglyceride (mg/dl) 114.6 ± 61.1 115.6 ± 49.5
Data are means ± standard deviation. BMI, body mass index; HDL, high density
lipoprotein; LDL, low density lipoprotein. Mann-Whitney analysis: ***P<0.001;
*P<0.05.
28
Supplementary Table 3. Clinical characteristics of the populations sequenced for
the four GPR120 exons.
Screening Subjects N Sex ratio
(men:women) Age (years) BMI (kg/m²) zBMI (kg/m²)
Morbid obese patients
French obese
adults 121 26:95 48.16 ± 12.40 46.70 ± 8.86 -
French obese
children 191 92:99 11.48 ± 3.17 - 6.72 ± 2.91
Data are means ± standard deviation. BMI, body mass index.
29
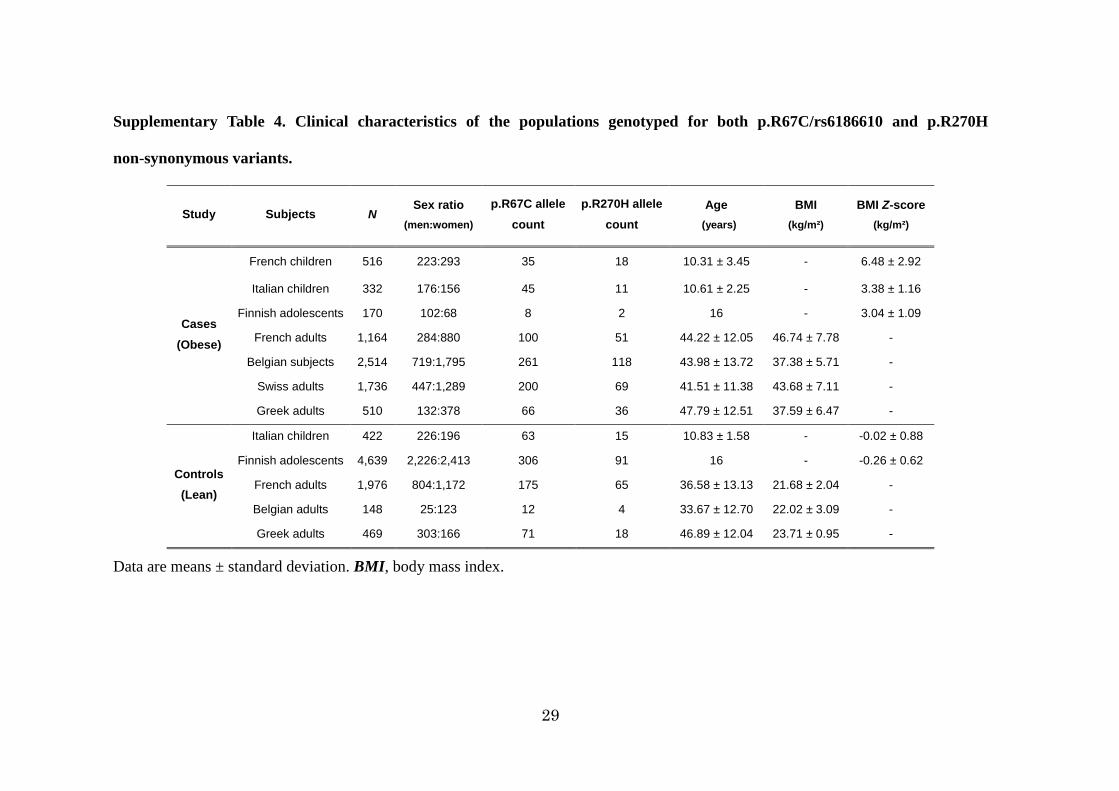
Supplementary Table 4. Clinical characteristics of the populations genotyped for both p.R67C/rs6186610 and p.R270H
non-synonymous variants.
Study Subjects N Sex ratio
(men:women) p.R67C allele
count p.R270H allele
count Age
(years)
BMI (kg/m²)
BMI Z-score (kg/m²)
Cases (Obese)
French children 516 223:293 35 18 10.31 ± 3.45 - 6.48 ± 2.92
Italian children 332 176:156 45 11 10.61 ± 2.25 - 3.38 ± 1.16
Finnish adolescents 170 102:68 8 2 16 - 3.04 ± 1.09
French adults 1,164 284:880 100 51 44.22 ± 12.05 46.74 ± 7.78 -
Belgian subjects 2,514 719:1,795 261 118 43.98 ± 13.72 37.38 ± 5.71 -
Swiss adults 1,736 447:1,289 200 69 41.51 ± 11.38 43.68 ± 7.11 -
Greek adults 510 132:378 66 36 47.79 ± 12.51 37.59 ± 6.47 -
Controls (Lean)
Italian children 422 226:196 63 15 10.83 ± 1.58 - -0.02 ± 0.88
Finnish adolescents 4,639 2,226:2,413 306 91 16 - -0.26 ± 0.62
French adults 1,976 804:1,172 175 65 36.58 ± 13.13 21.68 ± 2.04 -
Belgian adults 148 25:123 12 4 33.67 ± 12.70 22.02 ± 3.09 -
Greek adults 469 303:166 71 18 46.89 ± 12.04 23.71 ± 0.95 -
Data are means ± standard deviation. BMI, body mass index.
30
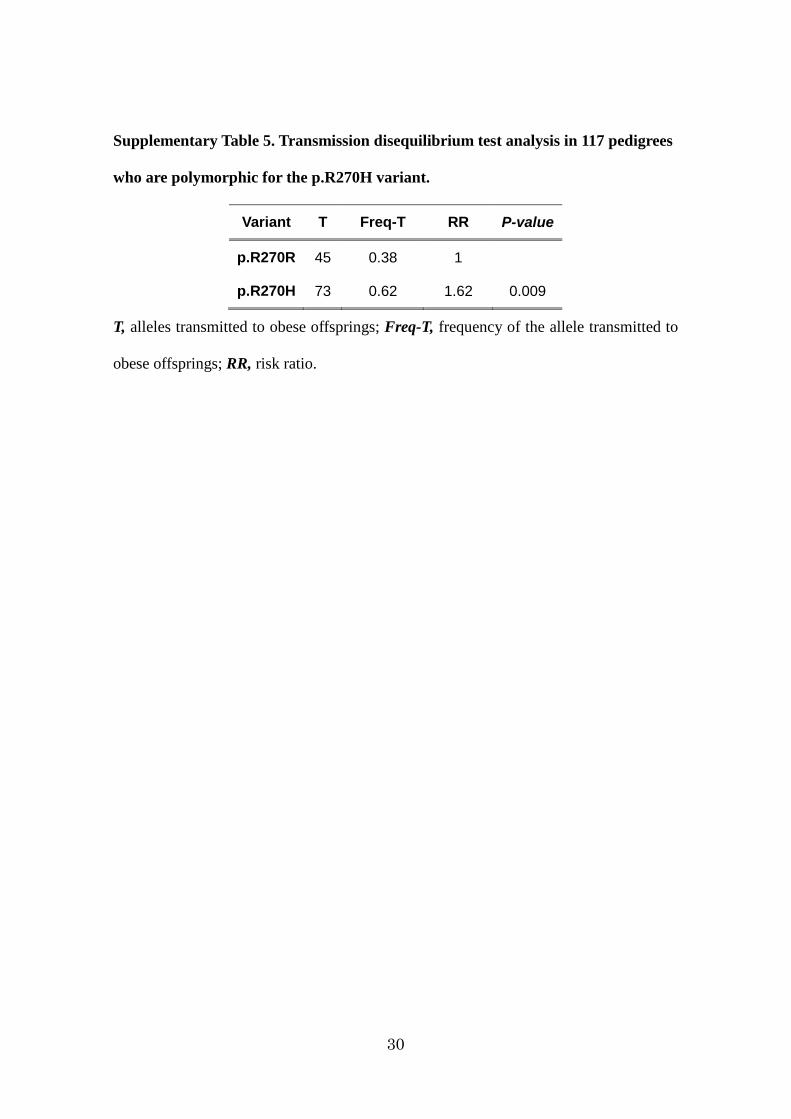
Supplementary Table 5. Transmission disequilibrium test analysis in 117 pedigrees
who are polymorphic for the p.R270H variant.
Variant T Freq-T RR P-value
p.R270R 45 0.38 1
p.R270H 73 0.62 1.62 0.009
T, alleles transmitted to obese offsprings; Freq-T, frequency of the allele transmitted to
obese offsprings; RR, risk ratio.
31
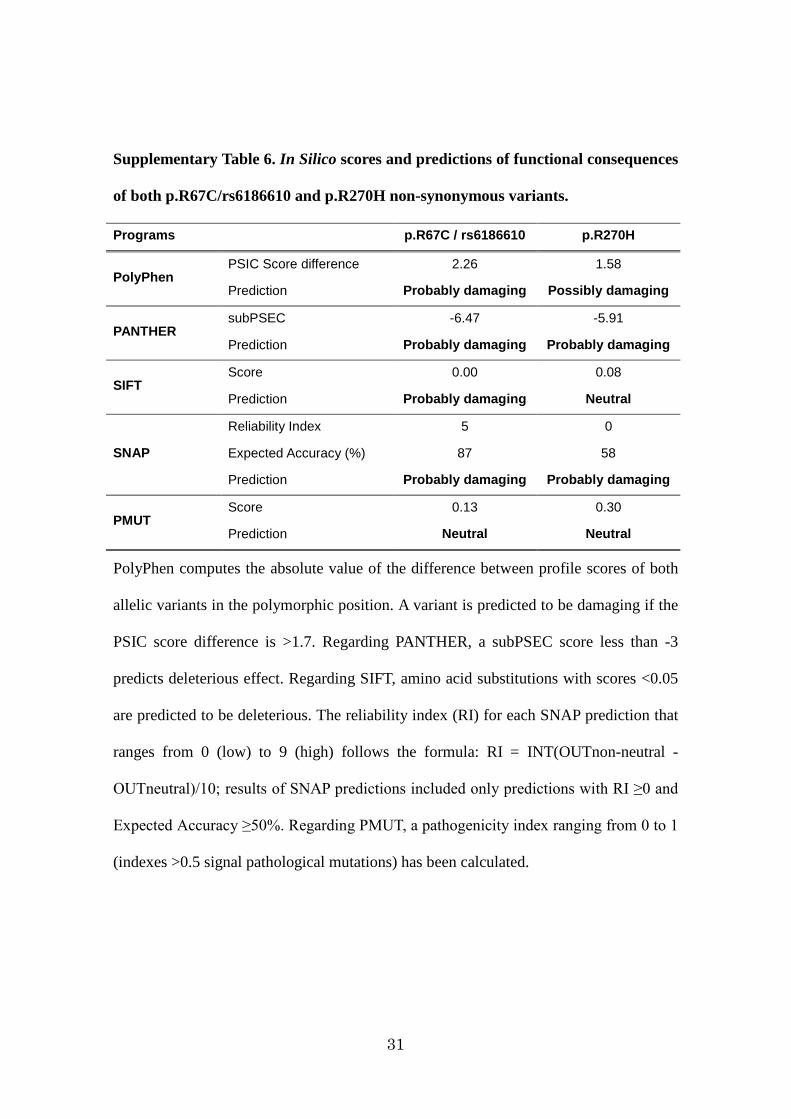
Supplementary Table 6. In Silico scores and predictions of functional consequences
of both p.R67C/rs6186610 and p.R270H non-synonymous variants.
Programs p.R67C / rs6186610 p.R270H
PolyPhen PSIC Score difference 2.26 1.58
Prediction Probably damaging Possibly damaging
PANTHER subPSEC -6.47 -5.91
Prediction Probably damaging Probably damaging
SIFT Score 0.00 0.08
Prediction Probably damaging Neutral
SNAP
Reliability Index 5 0
Expected Accuracy (%) 87 58
Prediction Probably damaging Probably damaging
PMUT Score 0.13 0.30
Prediction Neutral Neutral
PolyPhen computes the absolute value of the difference between profile scores of both
allelic variants in the polymorphic position. A variant is predicted to be damaging if the
PSIC score difference is >1.7. Regarding PANTHER, a subPSEC score less than -3
predicts deleterious effect. Regarding SIFT, amino acid substitutions with scores <0.05
are predicted to be deleterious. The reliability index (RI) for each SNAP prediction that
ranges from 0 (low) to 9 (high) follows the formula: RI = INT(OUTnon-neutral -
OUTneutral)/10; results of SNAP predictions included only predictions with RI ≥0 and
Expected Accuracy ≥50%. Regarding PMUT, a pathogenicity index ranging from 0 to 1
(indexes >0.5 signal pathological mutations) has been calculated.

32
Supplementary Table 7. Clinical characteristics of the 20 obese normoglycemic
individuals carrying or not the p.R270H variant in a heterozygous state [10
carriers of the p.R270H variants versus 10 ‘wild-type’ (WT) individuals]. All of
them where matched for age, gender and BMI.
Parameters p.R270H carriers
(n = 10) WT subjects
(n = 10)
Age (years) 37.8 ± 11.3 38.0 ± 10.9
Sex ratio (men:women) 2:8 2:8
BMI (kg/m2) 48.2 ± 4.6 45.4 ± 4.7
Total cholesterol (mg/dl) 182.0 ± 37.8 189.1 ± 28.3
HDL cholesterol (mg/dl) 39.1 ± 6.8 47.9 ± 9.5
LDL cholesterol (mg/dl) 113.4 ± 25.1 121.3 ± 24.7
Triglyceride (mg/dl) 149.5 ± 71.0 96.2 ± 27.3
Data are means ± standard deviation. BMI, body mass index; HDL, high density
lipoprotein; LDL, low density lipoprotein.

33
FIGURE LEGENDS
Figure 1. Obesity, hypertrophic adipocytes, accumulation of proinflammatory
macrophages and hepatic steatosis in HFD-fed GPR120-deficient mice.
(a) Body weight changes of WT and GPR120-deficient mice fed ND, HFD (n=36-47).
(b) Indirect calorimetry in HFD-fed mice. Energy expenditure and respiratory quotient
(RQ) (n=4-5). (c) Representative cross-sectional images of WT and GPR120-deficient
mice subjected to micro-CT analysis of in situ accumulation of fat. Fat depots are
demarcated (green) for illustration. (d) Hematoxylin and eosin stained epididymal WAT.
Scale bar, 100μm. Mean area of adipocytes (n=6). (e) Relative expression of Cd11b,
Cd68 and F4/80 mRNA in WAT (n=6). (f) Representative images of epididymal WAT
stained with anti-F4/80 antibody. Scale bar, 100μm. The number of F4/80 cells were
counted (n=6). (g) Oil Red O-stained liver. Scale bar, 50μm. Hepatic TG content after
24hr fasting (n=13). Data represent means ± s.e.m. *P<0.05 and **P<0.01 versus the
corresponding WT value. ND, normal diet; HFD, high-fat diet; WAT, white adipose
tissue; WT, wild-type; TG, triglyceride.
Figure 2. Impaired glucose metabolism, adipogenesis and lipogenesis in HFD-fed
GPR120-deficient mice.
(a) Fasting blood glucose and serum insulin levels (n=6-15). (b) Plasma glucose during
ITT (left panel) and GTT (right panel) (n=12-14). (c) Phosphorylation of Akt (Ser 473)
in WAT, liver and skeletal muscle after 24hr fasting (n=6-7). (d) Relative mRNA
expression of Fabp4 and Scd1 in WAT or Scd1 in liver (n=6). (e) Protein expression of
IRb, IRS1, IRS2, SCD1 and b-actin in WAT (f) Protein expression of IRS1, IRS2,
SCD1 and b-actin in liver (g) Oil Red O-staining and TG content of MEF-derived
34
adipocyte. Scale bar, 50mm. (h) Relative mRNA expression in MEF-derived adipocyte
(n=6). (i) The ratio of C18:1 to C18:0 in livers (n=6-8). (j) Non-esterified C16:1n7
palmitoleate in WAT and plasma (n=4-7). (k) The ratio of Scd1 mRNA expression in
liver and WAT (n=6-7). (l) The ratio of C16:1 to C16:0 in adipose tissues (n=6-8). (m)
Hepatic Scd1 mRNA expression in mice infused with vehicle or TG:palmitoleate for 6hr
(n=4-5). Data represent means ± s.e.m. *P<0.05 and **P<0.01 versus the corresponding
WT value. ND, normal diet; HFD, high-fat diet; WAT, white adipose tissue; WT,
wild-type; ITT, insulin tolerance test; GTT, glucose tolerance test; TG, triglyceride;
MEF, mouse embryonic fibroblast.
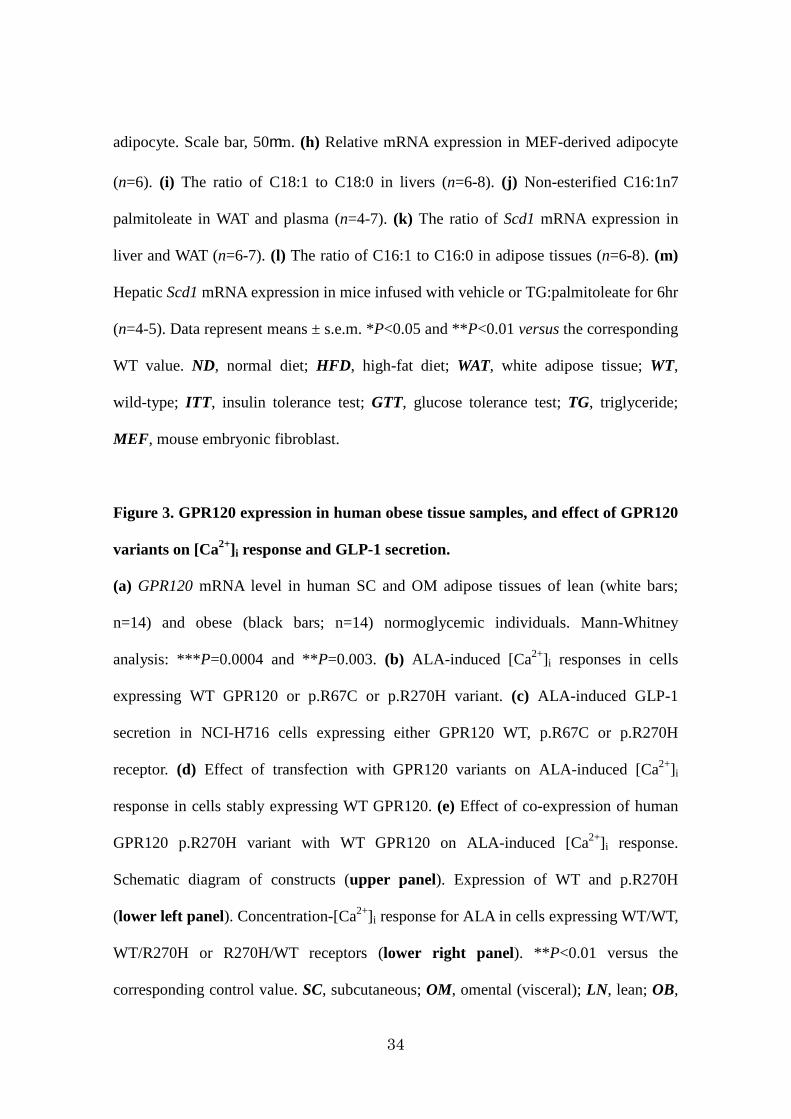
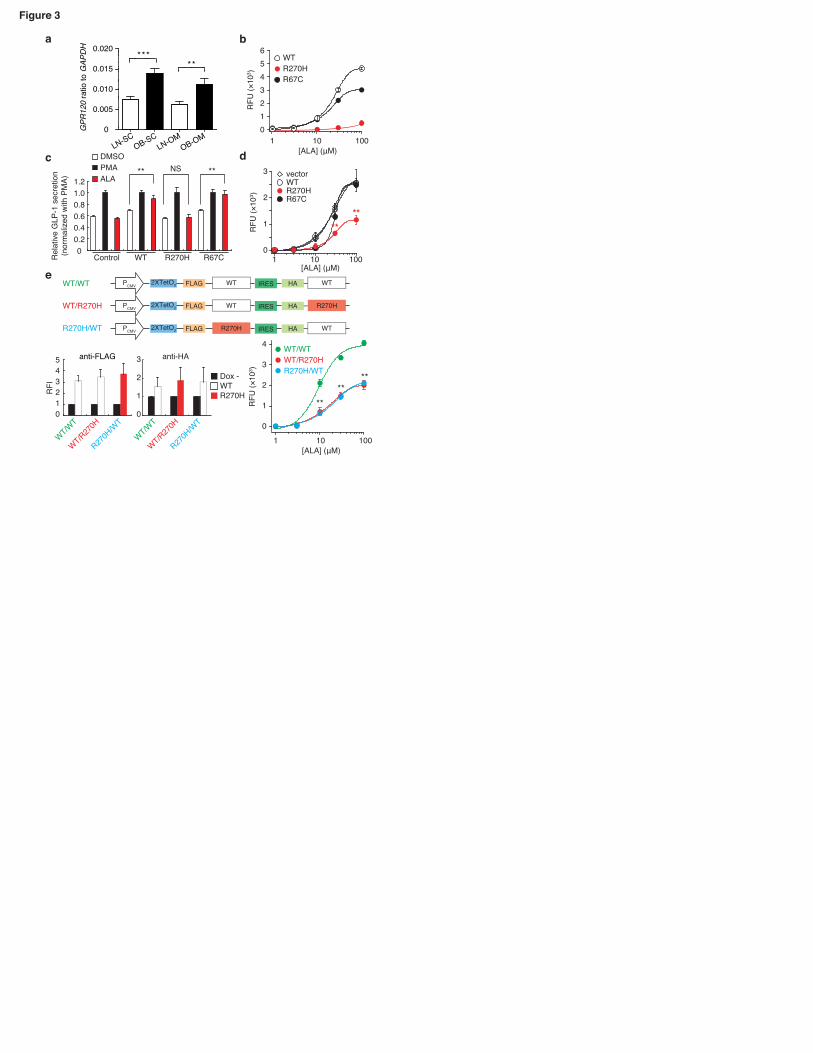
Figure 3. GPR120 expression in human obese tissue samples, and effect of GPR120
variants on [Ca2+]i response and GLP-1 secretion.
(a) GPR120 mRNA level in human SC and OM adipose tissues of lean (white bars;
n=14) and obese (black bars; n=14) normoglycemic individuals. Mann-Whitney
analysis: ***P=0.0004 and **P=0.003. (b) ALA-induced [Ca2+]i responses in cells
expressing WT GPR120 or p.R67C or p.R270H variant. (c) ALA-induced GLP-1
secretion in NCI-H716 cells expressing either GPR120 WT, p.R67C or p.R270H
receptor. (d) Effect of transfection with GPR120 variants on ALA-induced [Ca2+]i
response in cells stably expressing WT GPR120. (e) Effect of co-expression of human
GPR120 p.R270H variant with WT GPR120 on ALA-induced [Ca2+]i response.
Schematic diagram of constructs (upper panel). Expression of WT and p.R270H
(lower left panel). Concentration-[Ca2+]i response for ALA in cells expressing WT/WT,
WT/R270H or R270H/WT receptors (lower right panel). **P<0.01 versus the
corresponding control value. SC, subcutaneous; OM, omental (visceral); LN, lean; OB,

35
obese; WT, wild-type; RFU, relative fluorescence unit; RFI, relative fluorescence
intensity; NS, not significant.
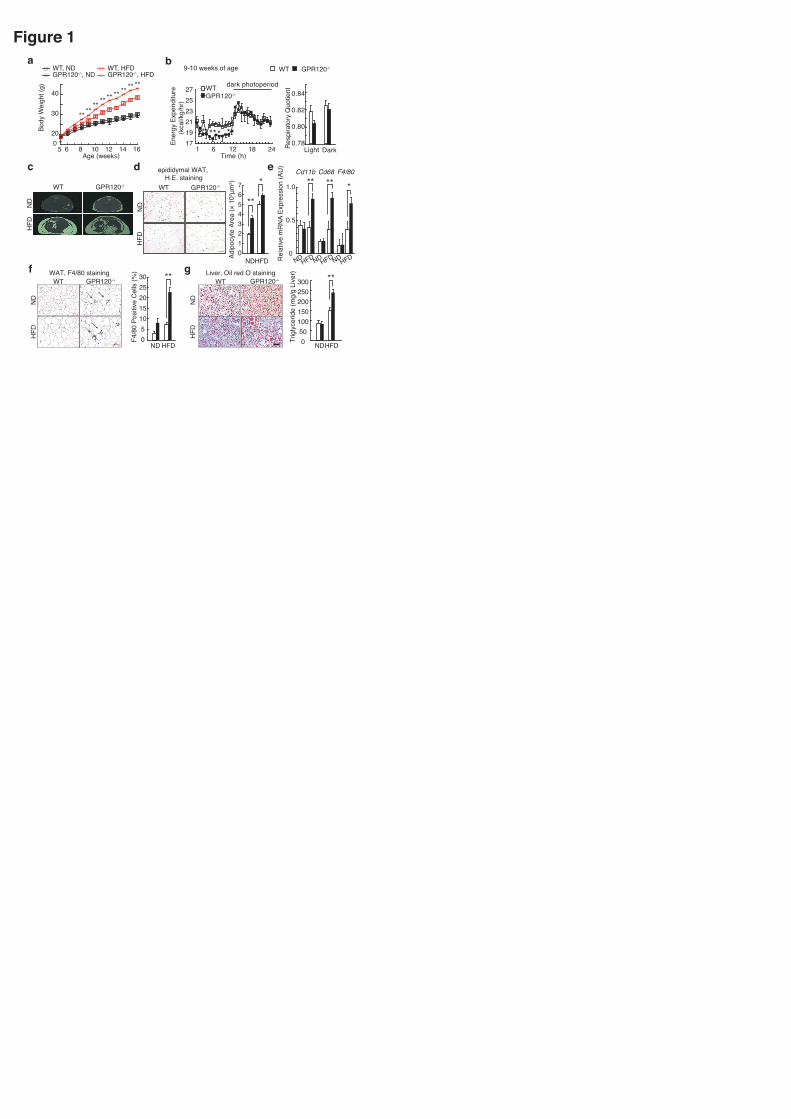
Figure 1
1 6 12 18 24Time (h)
b9-10 weeks of age
171921232527
Ener
gy E
xpen
ditu
re
(k
cal/k
g/hr
)
dark photoperiod
* *** *LightR
espi
rato
ry Q
uotie
nt 0.84
0.82
0.80
0.78Dark
WT GPR120-/-
WTGPR120-/-
c
ND
HFD
WT GPR120-/-
a
**
** **** ** ** ** ** **
5 6 8 10 12 14 16
20
30
40
0 ̃̃
WT, NDGPR120-/-, ND
WT, HFDGPR120-/-, HFD
Age (weeks)
Body
Wei
ght (
g)
01234567
HFDND
d
WT GPR120-/-
Adip
ocyt
e Ar
ea (×
103 μ
m2 )
**
*epididymal WAT,
H.E. staining
ND
HFD
Cd11b
0
0.5
1.0 **Cd68
**F4/80
*
e
Rel
ativ
e m
RN
A Ex
pres
sion
(AU
)
F4/8
0 Po
sitiv
e C
ells
(%)
ND HFD
**302520151050
WAT, F4/80 stainingf
ND
HFD
WT GPR120-/-
050100150200250300
Trig
lyce
ride
(mg/
g Li
ver) **Liver, Oil red O stainingg
ND
HFD
WT GPR120-/-
NDHFD
NDHFDNDHFDNDHFD
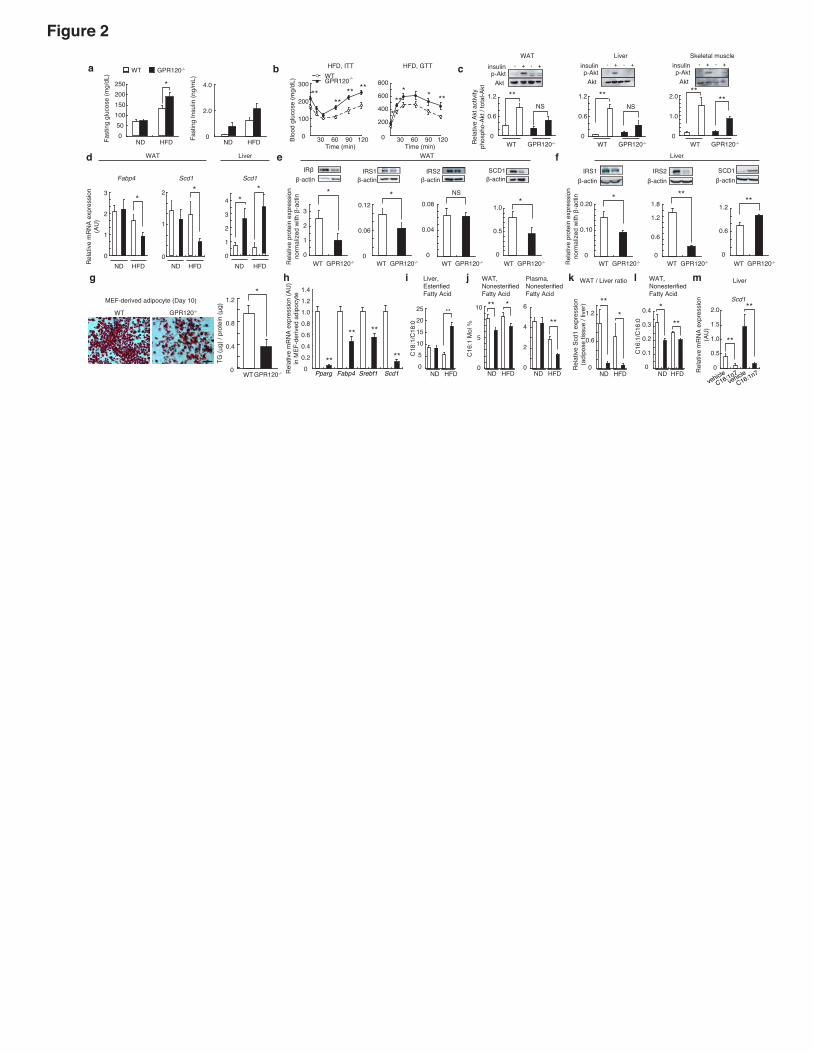
Figure 2
a
050100150200250
Fast
ing
gluc
ose
(mg/
dL)
*
0
2.0
4.0
Fast
ing
Insu
lin (n
g/m
L)
cb
***
* * **
0
200
400
600
800
HFD, GTTWTGPR120-/-
30 60 90 120
******
**
0
100
200
300
HFD, ITT
Time (min)
Bloo
d gl
ucos
e (m
g/dL
)
i
C18
:1/C
18:0
ND HFD0
5
10
15
20
25 **
Liver, EsterifiedFatty Acid
k
*
Rel
ativ
e Sc
d1 e
xpre
ssio
n(a
dipo
se ti
ssue
/ liv
er)
0
0.6
1.2**
ND HFD
WAT / Liver ratio
TG (μ
g) /
prot
ein
(μg)
0
0.4
0.8
1.2*
MEF-derived adipocyte (Day 10)
g
HFDND HFDND 30 60 90 120Time (min)
**NS
0
0.6
1.2
WT GPR120-/-Rel
ativ
e Ak
t act
ivity
phos
pho-
Akt /
tota
l-Akt
WATinsulinp-Akt
Akt
- -+ +
**NS
Liver
0
0.6
1.2
WT GPR120-/-
insulinp-Akt
Akt
- -+ +
****
0
1.0
2.0
Skeletal muscle
WT GPR120-/-
insulinp-Akt
Akt
- -+ +
e WAT
0
1
2
3
*β-actin
IRβ
Rel
ativ
e pr
otei
n ex
pres
sion
norm
aliz
ed w
ith β
-act
in
WT GPR120-/-0
0.06
0.12*
β-actinIRS1
WT GPR120-/-0
0.04
0.08
NS
β-actinIRS2
WT GPR120-/-
f Liver
0
0.6
1.2
1.8**
β-actinIRS2
WT GPR120-/-
Fabp4
*
1
2
0
3
Rel
ativ
e m
RN
A ex
pres
sion
(AU
)
Scd1
0
1
2 *
WAT
Scd1
**
0
1
2
3
4
Liverd
HFDND HFDND HFDND0
0.10
0.20*
β-actinIRS1
WT GPR120-/-Rel
ativ
e pr
otei
n ex
pres
sion
norm
aliz
ed w
ith β
-act
in
0
0.5
1.0*
β-actinSCD1
WT GPR120-/-
**
0
0.6
1.2
β-actinSCD1
WT GPR120-/-
WT GPR120-/-
00.20.40.60.81.01.21.4
Rel
ativ
e m
RN
A ex
pres
sion
(AU
)in
MEF
-der
ived
adi
pocy
te
**
** **
**
h
Pparg Fabp4 Srebf1 Scd1
C16
:1 M
ol %
WAT,NonesterifiedFatty Acid
5
10
0
** *
ND HFD
j
**
2
4
6
0ND HFD
Plasma,NonesterifiedFatty Acid
0
0.1
0.2
0.3
0.4
C16
:1/C
16:0
ND HFD
*
**
l WAT,NonesterifiedFatty Acid
**
**
0
0.5
1.0
1.5
2.0
m
Rel
ativ
e m
RN
A ex
pres
sion
(AU
)
Scd1
Liver
vehiclevehicle
C16:1n7C16:1n7
WT GPR120-/-
WT GPR120-/-
Rel
ativ
e G
LP-1
sec
retio
n(n
orm
aliz
ed w
ith P
MA)
Control WT R270H R67C
DMSO
ALAPMA NS ****
00.20.40.60.81.01.2
c
Figure 3
b
[ALA] (μM)
6543210
100101
WTR270HR67C
e
**
[ALA] (μM)100101
4
3
2
1
0
WT/WTWT/R270HR270H/WT
012345
0
1
2
3
RFI
TW/TW
H072R/TW
TW/H072R
TW/TW
H072R/TW
TW/H072R
Dox -WTR270H
d
1 10 100[ALA] (μM)
vectorWT
R67CR270H
****
3
2
1
0
0
0.005
0.010
0.015
0.020***
**
a
****
GPR
120
ratio
to G
APD
H
LN-SCOB-SC
OB-OMLN-OM
RFU
(×10
3 )R
FU (×
103 )
RFU
(×10
3 )
anti-HAanti-FLAG
PCMV IRES2XTetO2 FLAG HAWT WTWT/WT
PCMV IRES2XTetO2 FLAG HAWT R270HWT/R270H
PCMV IRES2XTetO2 FLAG HAR270H WTR270H/WT
0.75
0.76
0.77
0.78
0.79
0.8
0.81
0.82


![ib-biology-roundtable.wikispaces.com · Web view[3] The gene for GPR120 protein is located on Chromosome 10. The alleles for GPR120 protein from 312 extremely obese adults and children](https://img.pdfslide.net/doc/110x75/5ae89c827f8b9a8b2b903475/ib-biology-view3-the-gene-for-gpr120-protein-is-located-on-chromosome-10-the.jpg)