Embed Size (px)
Citation preview

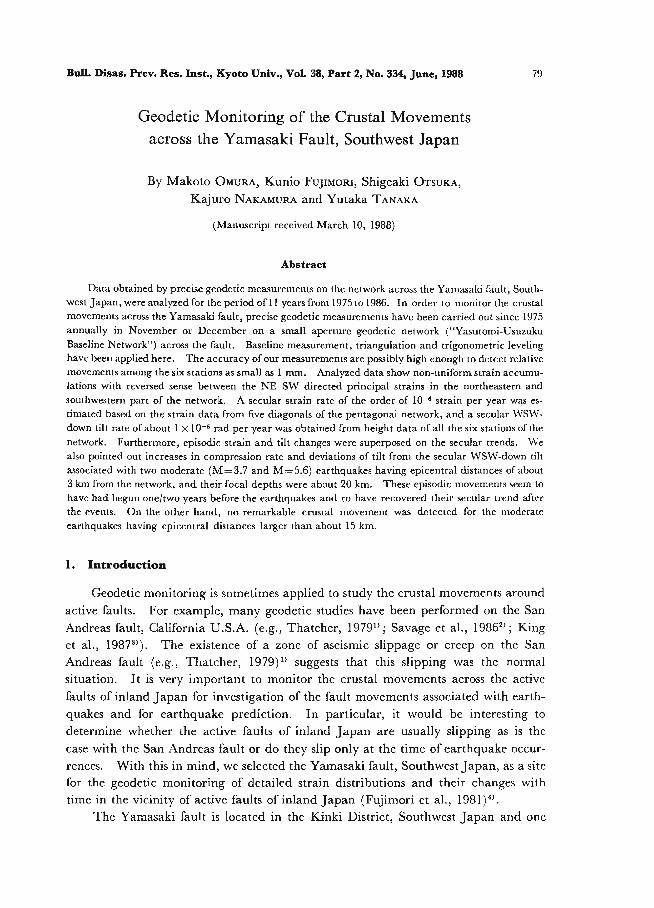
Title Geodetic Monitoring of the Crustal Movements across theYamasaki Fault, Southwest Japan
Author(s) OMURA, Makoto; FUJIMORI, Kunio; OTSUKA, Shigeaki;NAKAMURA, Kajuro; TANAKA, Yutaka
Citation Bulletin of the Disaster Prevention Research Institute (1988),38(2): 79-97
Issue Date 1988-06
URL http://hdl.handle.net/2433/124952
Right
Type Departmental Bulletin Paper
Textversion publisher
Kyoto University
Bull. Disas. Prey. Res. Inst., Kyoto Univ., Vol. 38, Part 2, No. 334, June, 1988 79
Geodetic Monitoring of the Crustal Movements
across the Yamasaki Fault, Southwest Japan
By Makoto OMURA, Kunio FujimoRi, Shigeaki OTSUKA, Kajuro NAKAMURA and Yutaka TANAKA
(Manuscript received March 10, 1988)
Abstract
Data obtained by precise geodetic measurements on the network across the Yamasaki fault, South-west Japan, were analyzed for the period of 11 years from 1975 to 1986. In order to monitor the crustal movements across the Yamasaki fault, precise geodetic measurements have been carried out since 1975 annually in November or December on a small aperture geodetic network ("Yasutomi-Usuzuku Baseline Network") across the fault. Baseline measurement, triangulation and trigonometric leveling have been applied here. The accuracy of our measurements are possibly high enough to detect relative movements among the six stations as small as 1 mm. Analyzed data show non-uniform strain accumu-lations with reversed sense between the NE—SW directed principal strains in the northeastern and southwestern part of the network. A secular strain rate of the order of 10-6 strain per year was es-timated based on the strain data from five diagonals of the pentagonal network, and a secular WSW-down tilt rate of about 1 x 10⁻⁵ rad per year was obtained from height data of all the six stations of the network. Furthermore, episodic strain and tilt changes were superposed on the secular trends. We also pointed out increases in compression rate and deviations of tilt from the secular WSW-down tilt associated with two moderate (M=3.7 and M=5.6) earthquakes having epicentral distances of about 3 km from the network, and their focal depths were about 20 km. These episodic movements seem to have had begun one/two years before the earthquakes and to have recovered their secular trend after the events. On the other hand, no remarkable crustal movement was detected for the moderate earthquakes having epicentral distances larger than about 15 km.
1. Introduction
Geodetic monitoring is sometimes applied to study the crustal movements around active faults. For example, many geodetic studies have been performed on the San
Andreas fault, California U.S.A. (e.g., Thatcher, 1979" ; Savage et al., 19862' ; King et al., 19873'). The existence of a zone of aseismic slippage or creep on the San Andreas fault (e.g., Thatcher, 1979)" suggests that this slipping was the normal situation. It is very important to monitor the crustal movements across the active faults of inland Japan for investigation of the fault movements associated with earth-
quakes and for earthquake prediction. In particular, it would be interesting to determine whether the active faults of inland Japan are usually slipping as is the case with the San Andreas fault or do they slip only at the time of earthquake occur-rences. With this in mind, we selected the Yamasaki fault, Southwest Japan, as a site for the geodetic monitoring of detailed strain distributions and their changes with time in the vicinity of active faults of inland Japan (Fujimori et al., 1981)4'.
The Yamasaki fault is located in the Kinki District, Southwest Japan and one

80 M. OMURA, K. FUJIMORI, S. OTSUKA, K. NAKAMURA and Y. TANAKA
of the major active faults in Japan with left-lateral offset. It trends about 80 km in
length to the NW-SE direction (Fig. 1). According to geological and geomorpho-logical studies, its mean slip rate is estimated to be 0.3 mm per year (The Research Group for Active Faults, 1980)". Geophysical studies such as continuous observation of crustal movements and our geodetic measurement commenced in 1975 to study the
properties of the fault together with microearthquake observation being continued from 1964 (Oike and Kishimoto, 1976)6'. By analyzing data obtained from con-tinuous observation of crustal movements, Oike (1977)" showed a close relation of the fault slip to the seismicity around the fault. According to the preliminary results of the observations, this area was selected as a test-field for the Japanese Earthquake Prediction Program in 1977. Thus, other various geophysical and geochemical
observations were added and have been continuing in this field (Kishimoto, 19818' ; Koizumi et al., 1985").
In order to monitor the crustal movements across the Yamasaki fault, a centered
pentagonal geodetic network was established in 1975 (Fujimori et al., 1981)". The baseline measurement, triangulation and trigonometric leveling of the network have being carried out annually in November or December since then. The accuracy of the measurements is possibly high enough to detect relative movements among the
stations as small as 1 mm, as will be discussed later. We analyzed the results for the period of 11 years from 1975 to 1986 and found a
remarkable non-uniform strain accumulation in the network. We also investigated
36° N 0 50 km
' at, - 11U , '4?:DV1
Vat "4;file 0 -a ,v4e...r wailkora,4*,
t4, r' nyorf .
35 - YAMASAKI FAULT , YASUTOMI /SYSTEM FAU LT OC1
\ I r.PRP 4 \ ah
t;H400m
H � 1000 m _
,eifsee
134°135° 136°E
Fig. 1. Map of the northern part of the Kinki District, Southwest Japan. Open circle indicates the Yasutomi-Usuzuku Baseline Network. Solid lines show main active faults.

Geodetic Monitoring of the Crustal Movements across the Yamasaki Fault, Southwest Japan 81
the behaviors of crustal strain and tilt associated with two moderate earthquakes which occurred near the network. The nature of the changes in the strain and tilt of the network was found alike for both earthquakes.
2. Network and Measurements
2.1 Plan for the measurement
At the time of the initial planning of this study, the slip rate of the major active inland fault of Japan, including the Yamasaki fault, was estimated to be about 1 mm/yr (Matsuda, 1976)'°'. Subsequent reestimations, however, have modified the value to about 0.3 mm/yr (The Research Group for Active Faults, 1980)5'. In order to understand the nature of the relative movement across the Yamasaki fault, we planned to detect it over the course of several years. If the measurements are accurate enough to determine the relative positions of the stations with an error limit of 1 mm, then the relative movement will be determined within about 5 years. To achieve this accuracy, the following methods were applied.
(1) Baseline measurement with several invar baseline tapes. (2) Triangulation and trigonometric leveling with a Wild T3 theodolite.
Baseline measurements with several baseline tapes enabled us to determine the length of the baseline with a standard error of the mean, hereinafter referred to as "S .E.M.", of less than 0.1 mm.
As to the setting of the limit of angle measurements in triangulation and trigono-metric leveling, we used the simple relationship between the error in an angle measure-ment 40 and the consequent error in position 41 (in the normal direction to the
sighting line), which is expressed as,
41=1 tan 40140 (1)
where 1 is the length of a sighting line. If the maximum limit of 41 is set as 1 mm, the limits of 40 is 2".1 for 1=100 m, and 0".7 for 1=300 m. Since we established our network with 1=75-300 m by using the Wild T3 theodolite, the condition of the accuracy was sufficiently fulfilled.
2.2 Yasutomi-Usuzuku baseline network
The site of the network was selected considering the following conditions :
(1) The offset of linear topographic features is remarkable at the site. (2) A centered pentagonal network with sides as long as 300 m is possible to
be constructed.
(3) The site is closely located to the Yasutomi station, that is a tunnel for continuous observation of crustal movements (Oike, 1977)7).
With the aid of several geoscientists, we set up a network in July 1975 across the Yasutomi fault segment of the Yamasaki fault system (Fig. 1) . The network was named "Yasutomi-Usuzuku Baseline Network", hereinafter referred to as "the
82 M. OMURA, K. FUJIMORI, S. OTSUKA, K. NAKAMURA and Y. TANAKA
network" in the present paper. Furthermore, we mean the Yasutomi fault segment of the Yamasaki fault system when referring to "Yamasaki fault" in the present paper.
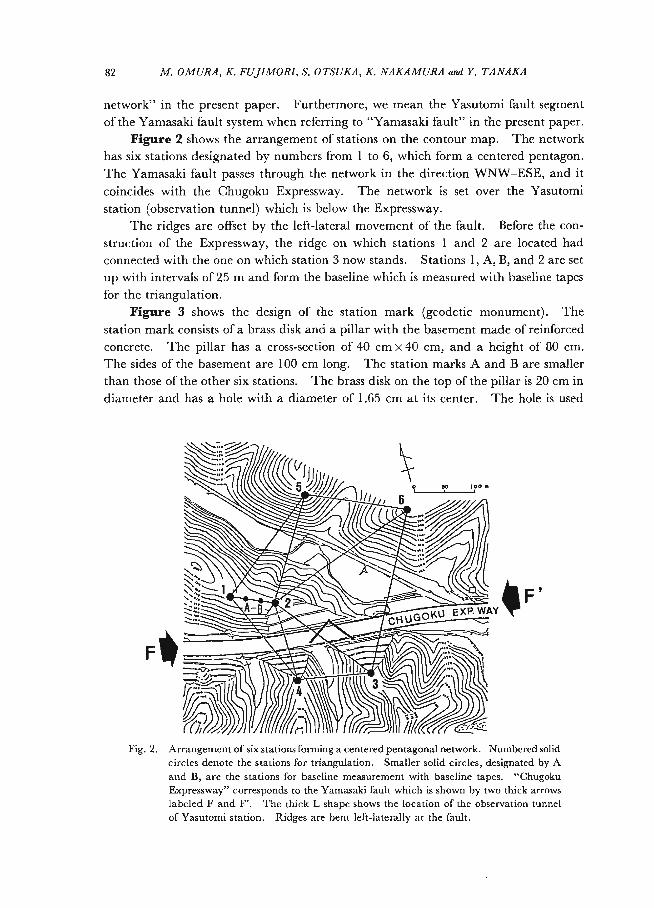
Figure 2 shows the arrangement of stations on the contour map. The network has six stations designated by numbers from 1 to 6, which form a centered pentagon. The Yamasaki fault passes through the network in the direction WNW-ESE, and it coincides with the Chugoku Expressway. The network is set over the Yasutomi station (observation tunnel) which is below the Expressway.
The ridges are offset by the left-lateral movement of the fault. Before the con-struction of the Expressway, the ridge on which stations 1 and 2 are located had connected with the one on which station 3 now stands. Stations 1, A, B, and 2 are set up with intervals of 25 m and form the baseline which is measured with baseline tapes for the triangulation.
Figure 3 shows the design of the station mark (geodetic monument). The station mark consists of a brass disk and a pillar with the basement made of reinforced
concrete. The pillar has a cross-section of 40 cm x 40 cm, and a height of 80 cm. The sides of the basement are 100 cm long. The station marks A and B are smaller than those of the other six stations. The brass disk on the top of the pillar is 20 cm in diameter and has a hole with a diameter of 1.65 cm at its center. The hole is used
I\-- --:::,------;R1 \'.-.'::1t9))//
j4.//i050100. i^... ,...4..,„,.., .....4. ,.., _.
,
\-- 4111114, , 5: ,
N'r• AVirk A'-'^ :- ::...z\s.z...... . Ah...._ s",
eii.,:ir,...\\....St......_. ^.,:i------s!411111Mrtio.-.dli F .... .....:-. A-; "sty eiffi ^KU E XP.WAY .----:: --. 51110101%-iNgleCHUG'-' -.. ..- -„
,. -.-"--ir-Alik,, _ -....../ 11410,4W435Wi- F *7-ill'ir n :.":-- _,—..-----.-IIhbi.,
i1"1(&3'-----\ ./-'l4.11 n) d77 ) ) ik Fig. 2. Arrangement of six stations forming a centered pentagonal network. Numbered solid
circles denote the stations for triangulation. Smaller solid circles, designated by A
and B, are the stations for baseline measurement with baseline tapes. "Chugoku
Expressway" corresponds to the Yamasaki fault which is shown by two thick arrows
labeled F and F'. The thick L shape shows the location of the observation tunnel
of Yasutomi station. Ridges are bent left-laterally at the fault.

Geodetic Monitoring of the Crustal Movements across the Yamasaki Fault, Southwest Japan 83
loo o r (7 a)
1. 659s
ono
14- t (3 0)
2 0 or
_1 5)
V // unit:cm
Fig. 3. Sketches showing the design of the station mark (geodetic monument). The station consists of a pillar made of reinforced concrete, and a brass disk on its top. The
smaller dimensions in parentheses are those of the station mark for station A and B (Fig. 2).
for positioning of instruments. A brass ball is attached at the bottom of the instru-ment and fits into the hole to provide exact positioning with an accuracy of over
0.1 mm. An astronomical observation and traverse survey were carried out to connect
station 1 with Mitsumori third-order triangulation station (34°59'31".045N, 134°37' 21".203E) which is situated about 1.5 km northeast of the network, established by the Geographical Survey Institute. The latitude and longitude of station 1 were then determined. The height of station 1 was determined by the first-order leveling by connecting to a bench mark for the Expressway construction. The position of station 1 thus determined is as follows.
Latitude 34°58'48".298N Longitude 134°36'49".893E
Height 187.9843 m
We assumed this position to be fixed during the course of our study.
2.3 Methods applied to the measurements
The baseline measurements were carried out for the line connecting station 1 and

84 M. OMURA, K. FUJIMORI, S. OTSUKA, K. NAKAMURA and Y. TANAKA
2, hereinafter referred to as "line(1-2)". The procedure for this measurement followed that of the primary triangulation. Four or three invar baseline tapes were
used, and at least two of them were examined by an official organization for surveying, Nippon Sokuryo Kyokai ( Japanese Association of Surveyors), before the yearly
measurement.
The S.E.M. for the baseline measurement did not exceed 0.1 mm for line(1-2) which is 75 m long (Tables 1(a) and 1(b)).
Horizontal and vertical angles were measured with a Wild T3 theodolite. We
prepared special targets (Fig. 4) for achieving the requisite precision for our triangu- lation. Targets of three different sizes were used depending on the distances. As
angle measurements were done at night to avoid flickering of the target images, each target was illuminated with a small lamp.
We applied the method of measuring the neighboring angles proposed by
Table 1(a). Adjusted coordinates and line lengths of 1975 December 1975
Station Lat. Long. Misclosure 1 34° 58' 48" .298 N 134° 36' 49" .893 E AW1 -0" .37
Adjusted Coordinates W2 -1 .68
Station x(m) [SEM] (mm) y(m) [SEM] (mm) z(m) [SEM] (mm) W3 -0 .32 W4 -0 .05
1 0.00000 [-1 0.00000 [-] 187.98430 [-] W5 -1 .59 2 -30.86715 [0.11] 68.03712 [0.05] 183.24478 [0.27] around the station 2
3 -191.63790 [0.76] 189.01715 [0.55] 202.88889 [0.52] WO -1" .79 4 -166.33451 [0.60] 70.01452 [0.27] 185.40080 [0.43] S.E.M. of
5 129.33489 [0.59] 166.75244 [0.57] 198.63671 [0.53] baseline(1-2) 6 56.12160 [0.19] 321.60525 [1.09] 214.95306 [0.63] 0.024 mm
Adjusted length Measured length Line S [SEM] s ds=S-s
5 M mm mm MM MM
a (1-2) 74.711.65 [0.01] 711.65 0.00 h 6 ,II,
________ b (1-4) 180.469.40 [0.56] 469.69 -0.29 iv c (2-4) 135.481.79 [0.61] 481.90 -0.11 1a4Mw.r456Ig d (3-4) 121.663.01 [0.72] 662.94 +0.07
e (2-3) 201.204.88 [0.87] 205.74 -0.86bW3 O e f
f (3-6) 281.006.01 [0.86] 007.24 -1.23
W2 g (2-6) 268.074.32 [1.09] 075.55 -1.23 h (5-6) 171.288.00 [0.96] 288.68 -0.68 4 3
i (2-5) 188.173.88 [0.77] 174.78 -0.90
j (1-5) 211.030.54 [0.77] 031.90 -1.36
Station 1 and azimuth(1-6) were assumed to be fixed in calculation. "SEM" indicates the Standard Error of the Mean. The SEM does not exceed 1.1 mm in adjusted coordinates. "Measured length" is
the length calculated using unadjusted data. The inset shows the layout of the lines.

Geodetic Monitoring of the Crustal Movements across the Yamasaki Fault, Southwest Japan 85
Table 1 (b). Adjusted coordinates and line lengths of 1986
November 1986 -
,
Station Lat. Long. Misclosure
1 34° 58' 48" .298 N 134° 36' 49" .893 E PWI +0" .51
Adjusted Coordinates W2 -0 .47
- Station x(m) [SEM] (mm) y(m) [SEM] (mm) z(m) SEM (mm)W30 .60 W4 -0 .85 1 0.00000 [-] 0.00000 [-] 187.98430 [-] W5 -1 .56
2 -30.86331 [0.08] 68.03837 [0.04] 183.24428 [0.31] around the station 2
3 -191.63220 [0.46] 189.01537 [0.39] 202.89030 [0.59] WO +0" .04
4 -166.33087 [0.37] 70.01129 [0.20] 185.40154 [0.49] S.E.M. of 5 129.33406 [0.34] 166.75145 [0.41] 198.63954 [0.60] baseline(1-2)
6 56.12059 [0.12] 321.59947 [0.68] 214.95711 [0.72] 0.031 mm
Adjusted length Measured length Line S [SEM] s ds=S -s
5 m mm mm mm mm
a (1-2) 74.711.20 [0.01] 711.20 0.00 ji ,vh
w3....______61 b (1-4) 180.464.79 [0.36] 464.91 -0.12 j
c (2-4) 135.481.92 [0.38] 482.25 -0.33 1i4C1<ii,..K9 d (3-4) 121.664.00 [0.50]664.75 -0.75WI2
e (2-3) 201.201.56 [0.54] 202.62-1.06 b c e f
f (3-6) 280.998.20 [0.53] 1.000.02 -1.82 W: g (2-6) 268.066.10 [0.68] 067.50 -1.40 h (5-6) 171.283.74 [0.63] 284.44 -0.70 3
i (2-5) , 188.168.73 [0.48] 169.27 -0.54
j (1-5) 211.029.25 [0.50] 030.28 -1.03
The results are shown in the same manner as in Table 1(a).
!
AK Will :60/
W
911'
,Fig. 4.Sketchesshowing printedthefilm.howing theidetsignofthetAsthe
target.The
targetpattern
measurements were done at night, it is illumi-
nated with a small lamp from behind.
filCil
!
1\ I. as cm

86 M. OMURA, K. FUJIMORI, S. OTSUKA, K. NAKAMURA and Y. TANAKA
Table 2. Tolerances on errors and misclo- sures adopted
Difference of "Observation difference" _< 2"
Difference of "Double angle" < 3"
Error of closure around a station
1".6 for three directions
2".1 for five directions
Error of closure of a triangle
V.5 for the longest side length < 150 m
V.0 for the longest side length > 150 m
Side condition < 1 mm
Eight set of measurements are performed for an angle, changing origins on the horizontal
circle for each set. Each set provides two values Af and As measured in the first and the second
position of the telescope, respectively. Thus eight values of "Observation difference (Ai —As)" and "Double angle (Ard-As)" are obtained for the angle. In the table, differences between a maxi-
mum and a minimum in eight values of (Af —AO and (Ar+As) are described as Difference of
"Observation difference" and Difference of "Double angle" , respectively.
Dragomir et al. (1982)"' for horizontal angle measurements. Table 2 shows the tolerances adopted.
The tilt of the each station mark was also measured to confirm the stability of the station mark.
3. Accuracy of the measurements
3.1 Horizontal position
The data obtained were adjusted by means of the least square method. The
assumption made in calculation was that station 1 and azimuth(1-6) were fixed. The results obtained in 1975 and 1986 are shown in Tables 1(a) and 1(b), respectively.
The S.E.M. does not exceed 1.1 mm in adjusted coordinates. The results obtained in other years have almost the same S.E.M. as those in 1975 and 1986.
3.2 Relative height
Vertical angles were measured on both ends of the lines. Adjustments were then made by means of the least square method. Assumptions made in calculations
were :
(1) The height of station 1 would not changed during the period of measure-

Geodetic Monitoring of the Crustal Movements across the Yamasaki Fault, Southwest Japan 87
ment.
(2) The coefficient of refraction was not constant each year, so that it should be regarded as an unknown parameter.
The heights determined with reference to station 1 are shown in Tables 1(a)
and 1(b). Since the S.E.M. for the determined height are less than 1 mm, except by the less constrained measurement in June 1984, it is plausible that a change in height
exceeding 1 mm is significant.
4. Secular changes of crustal movements
4.1 Strain changes
Strain changes were calculated for each line, based on the line lengths determined
75176[77178i 79030i 811821831840351861
1-2
1-3
1-4
1-5
1-6
2-3
2-5
2-6
3-.5 3-6
4-5 4-6 5-6
2-4
3-4 ext. 1-56
cont.
Fig. 5. Secular strain changes of each line. The lines are represented by the two terminal station numbers hyphenated (viz., 1-2, 1-3, etc.). The error bars represent a S.E.M.
on either side of the plotted point.

88 M. OMURA, K. FUJIMORI, S. OTSUKA, K. NAKAMURA and K TANAKA
in December 1975. Figure 5 shows the strain changes obtained; the lines are
represented by two terminal station numbers hyphenated (viz., 1-2, 1-3, etc.). The S.E.M. for most plots for either side are about 3 micro-strains (10-6) on an average, and they never exceeded 5 micro-strains. Therefore, secular strain accumulations in
most lines are concluded as real. The centered pentagon was then divided into five triangles as shown in Fig. 6
and the strain tensors in the horizontal plane were determined for each triangle in the period of about 11 years from December 1975 to November 1986. Figure 6 shows the strain tensors in the network.
The distribution of strain tensors provided some understanding of the properties of the strain accumulation in the network as follows:
(1) The axes of principal strains trend to NE—SW and NW—SE directions in most parts of the network.
(2) Strain distribution is remarkably non-uniform in the network. Principal strains in the NE—SW direction reverse their senses from extensional in the south-
western part (triangles A 142 and A243) into contractive in the northeastern part
(triangles A236 and A265). (3) The rates of strain accumulation are several micro-strains per year. They
1988 - 1975 4. (5)
.211mm "4
4 1 'kb i
. ........- .0 .(6) ,..-. , -' • 4.1 ----ti
1 7'.
I
1
(.I ) • 0.0-0! -S.%
--".-:Q2 1111100.
-46.5
,,,.... - ,
... -
10., (4) • —extension 0.7 _ / .0 • (3) ---- contraction 5 0 m
1.4
Fig. 6. Strain tensors in the network for the period from 1975 to 1986. Numbers attached to the middle of the line show the length change (the positive value corresponds to
extension). Underlined numbers nearby the stations indicate the height changes of the station (the positive value corresponds to upheaval). Dash-dotted line denotes
the trace of the Yarnasaki fault. It is noticed that the strain distribution is not uniform in the pentagon and the the northeastern part of the network relatively
upheaved.

Geodetic Monitoring of the Crustal Movements across the Yamasaki Fault, Southwest Japan 89
75 76 77 78 79 80 81 82 83 84 85 86 Dec. Dec. Dec. Nov. Nov. Nov. Nov. Nov. Nov. Nov. Nov. Nov 70-00 I
I I I I i I 1 I I I I
( 015634) s..
, '•, / a1554)
".
..
1:) 2563) \ i ------ ----- . ‘•,
\
01234) ,
..,
,,
•.,
105 extension contraction
Fig. 7. Annual strain rates and accumulated strains (right) for a pentagon (top) and each
quadrilateral in the network. The strains for the pentagon were calculated based on the strain changes of five diagonals.
are about ten times greater than the ordinary rates found in Japan (Nakane, 1973)12'. It is noted in Fig. 5 that the transient coherent strain changes are apparent in
most lines. Based on strain changes in each line, annual strain rates are calculated in various parts of the network as shown in Fig. 7. Non-uniform strain accumulation
is also remarkable here. The length of line (1-2) was measured as the base for the triangulation. Figure 8
shows the length changes of line(1-2) and its divided segments. Comparing Fig. 5 with Fig. 8, it can be noted that the length change of segment(1-B) correlates with
strain changes of most of the lines. Figure 9 shows that the strain accumulation in segment(1-B) has close relation with the dilatation determined from the data of the five diagonals of the pentagon(1-5-6-3-4). The estimated dilatations from the strains along five diagonals are considered to have smaller strain errors caused by instability of station marks than those from the strains along shorter lines of the net-
work. Furthermore, the length of segment(1-B) was measured with the baseline tapes correctly calibrated referring to standard scales by Nippon Sokuryo Kyokai. Thus it is plausible that the rate changes in estimated dilatation is real.
4.2 Heights and tilt changes
Figure 10 shows the change in height of respective stations with reference to station 1. The S.E.M. of most data points determined by measurements each fall are about 0.5 min on an average, with one exception of 1 mm. The S.E.M. for the data obtained by the less constrained measurement in June 1984 are about 2 times

90 M. OMURA, K. FUJIMORI, S. OTSUKA, K. NAKAMURA and Y. TANAKA
751761771781 79180,8 1182,8318 418518 61
1 -A
A -B
8-2
1 B
1 - 2 ext.
I 1 mm cont.
1 A B 2 D -- ^4-1015°E 25 25 25 m
Fig. 8. Secular length changes of line(I-2) and its segments. Arrangement of stations in line(1-2) is shown in inset. Open circles denote the values determined by the
measurement on June 1984, in a week after the earthquake of M=5.6 on May 30, 1984. The line(1-2) and its segments were measured with several baseline tapes.
The S.E.M. of all points plotted are smaller than the closed circle.
75,761 771 78, 79,80, 81,82,83, 84 ,135,86, 10-6
0 E
I ° -2- -3- STRAIN
10-5 Z
>- -1 LU > -2-
DILATATION tn
Fig. 9. Secular strain change of segment(1-B) (top) and areal dilatation change (bottom) estimated from strain data of five diagonals of pentagon(1-5-6-3-4).
larger on average than those calculated each fall. The movements of stations 5 and 6 show that the northeastern part of the network upheaved relative to the southwestern
part in the period concerned. Assuming that a uniform tilt movement of the network causes relative height
changes of stations, the amount of tilt Tin azimuth A can be expressed as
T= To cos(A —210) (2)
where To is the amount of the maximum tilt and Ao is its azimuth (Miyabe, 1931)13'.

Geodetic Monitoring of the Crustal Movements across the Yamasaki Fault, Southwest Japan 91
7 517 617 717 817 21800 10218318 4i8s18 61 .7
1 -.---s. • o •---4.—• I 1 rnm do.
2 + —/-1----4-4.---"k-jr.,,_._.4
1
3 . .—7-7---'—''-'5'\'#/
4
f f+\,i._47\7
5
6 "Nir
Fig. 10. Height change of respective stations with reference to station 1. Station 1 was assumed to be fixed. The error bars represent a S.E.M. on either side of the plotted
point. Open circles are the same as in Fig. 8. Long error bars of the open circles are due to less constrained measurement on June 1984.
H rad. I986-1975 20 • •
. . 10 . . .
I-- • -J 0 —N .. • N I-
AO • • • . •
• • -20 •
Fig. 11. The tilt determination of the network. Relationship between the amount of tilt and its azimuth can be expressed by a sinusoidal curve based on Eq. (2).
By assigning two stations arbitrarily, the amount of tilt in the azimuth the two stations
define was calculated. For all combinations of two stations, the tilt T and the azimuth A were obtained. The maximum tilt was then determined from Eq. (2), by means of the least square method. Figure 11 shows the example of the tilt deter-mination of the network. It was estimated that the maximum tilt of WSW-down amounts to about 11 micro-radians (10-6 rad) for the period of about 11 years. This sense of the tilt shows that higher topography in the network upheaved against the lower one. This is consistent with the Quaternary movement of the Yamasaki fault,

92 M. OMURA, K. FUJIMORI, S. OTSUKA, K. NAKAMURA and Y. TANAKA
757677787980818283848586 JI1111111111
10-5
SE-1- • lin 2-
-3- STRAIN
I •
10.5 MAX. SHEAR
1- I
0
1- -1 - 111
Z", -2--
>- 4 -3- DILATATION U.14
> x
PRINCIPAL STRAIN AXES , •
s./
10-5 • contraction
VECTOR DIAGRAM of TILT
M3.7
Ndown
1 0 5 75
83 82
7 •07
86 78 4f .? 76
81 80 855p rad. 84 79 Nov.
M5.6
Fig. 12. From top to bottom, secular strain change of segment(1-B), maximum shear strain change, areal dilatation change, accumulated strains, and vector diagram of tilt
are shown. In the upper part, vertical dash-dotted lines mark the time of occur- rences of moderate earthquakes having the epicentral distances about 3 km. Fur-
thermore, open squares in the vector diagram indicate the time of occurrences of the moderate earthquakes and thick arrows point toward the epicenters of them.

Geodetic Monitoring of the Crustal Movements across the Yamasaki Fault, Southwest Japan 93
as inferred by the geological and geomorphological studies (The Research Group for Active Faults, 1980) 5) .
Annual tilt rates were calculated applying the method described above. The vector diagram of tilt is drawn at the bottom of Fig. 12.
5. Crustal movements associated with moderate earthquakes
Comparing figures in Fig. 12, simultaneous changes in the rates of the strain and the tilt accumulations were found to be associated with two moderate earthquakes. The epicentral distances of two moderate earthquakes are about 3 km from the net-work, and their focal depths were about 20 km. The epicenters and magnitudes were determined by the Tottori Microearthquake Observatory of Disaster Prevention Research Institute, Kyoto University
The occurrences of the two moderate earthquakes of M = 3.7 on Sept. 30, 1977, and M=5.6 on May 30, 1984, are shown in Fig. 12 by dash-dotted lines and open squares in the upper figure showing strain changes and in the vector diagram of tilt, respectively. In the vector diagram, the azimuths toward the epicenters are indicated
by two arrows with the number representing the magnitude of each earthquake. Interesting common patterns in the strain and tilt changes associated with the two
earthquakes are as follows:
(1) One/two years before the earthquake occurrence : (a) The compressive rate increased in the dilatation.
(b) The tilt movement deviated from its secular trend. It is expected from this result that upheaval would be observed towards the
direction of the epicenter of the forthcoming earthquake.
(2) On the occurrence of the earthquake: (a) The rate in the areal strain turned its sense from compressive to
dilatational.
(b) The deviated tilt recovered rapidly to its previous secular trend. In contrast, no remarkable crustal movement was detected for moderate earth-
quakes having epicentral distances larger than about 15 km in the period from 1979 to 1980. The shear strain changes were not affected so much by the earthquakes, and showed uneventful, gradual accumulation.
6. Discussion
The tendency for the adjusted line lengths to be shorter than the actual measure-ment was noticed every year (Tables 1(a) and 1(b)). This tendency might be related to a possibility that values of the angles included in triangle A 125 were found slightly less than their true values. This possibility was inferred from the fact that the misclosure for A 125 ("W5" in Tables 1(a) and 1(b) ) usually showed negative values amounting to about 1".5 on an average. Our angle measurements might have

94 M. OMURA, K. FUJIMORI, S. 0 TSUKA, K. NAKAMURA and Y. TANAKA
been affected by lateral refraction along the sighting line(1-5) due to surrounding topography. We, however, consider that the yearly differences of adjusted line
lengths have not been heavily influenced by the presence of such a common optical
phenomenon and that the measurements were able to detect the relative movements of the stations with an accuracy as small as 1 mm.
Even if we perform the geodetic measurements with high accuracy, instability of the station marks prevents us from monitoring the actual crustal movements. Fur-thermore, the topographic and the meteorological influences on the local deformation of the crust disturb the estimation of tectonic crustal movements. Unfortunately, the network has only six stations, and measurements are carried out but once a year. Therefore, it is impossible to eliminate all the disturbances from the observed crustal movements. However, the seasonal disturbances can greatly be reduced if the measurements are performed in the same season every year, as we did in the present study. Thus for our investigation, such undesired disturbances had little effect on the result. Estimated mean strain rate (of the order of 10-6 per year) in the network is about ten times greater than the ordinary rate estimated by the geodetic method in Japan
(of the order of 10-7 per year; Nakane, 1973)12'. The large strain rate of the order of 10-6 per year and sense reversal of secular strains in one direction were also observed
with extensometers in the tunnel across the Otsuki fault, Kobe city, Southwest Japan
(Otsuka et al., 1982)14'. The peculiar circumstance of the tunnel across the Otsuki fault is that it runs in the fractured zone of the fault (Tanaka et al., 1972)15'. Con-sidering the similarity of strains observed at the Yamasaki and the Otsuki fault, we inferred that a possible cause of unusual strain in the network is an intrinsic behavior
of the fractured material in the vicinity of the fault. According to the result of Magneto-Telluric Sounding, the Yamasaki fault has a low resistivity zone of about 1 km width, which inferred to be the fractured zone (Handa and Sumitomo, 1979)16'. This electromagnetic result seemed to support the possibility that the network is situated in the fractured zone.
Since the above mentioned results were obtained for the particular period from 1975 to 1986, and for the particular site across the Yamasaki fault, further studies are
very necessary at various faults, as well as at the present site, for better understanding.
7. Concluding remarks
In order to monitor the crustal movements across the Yamasaki fault, Southwest
Japan, precise geodetic measurements have been carried out since 1975 annually in November or December on a small aperture geodetic network ("Yasutomi-Usuzuku Baseline Network") across the fault. The measurements of the baseline, triangulation and trigonometric leveling could detect relative station movements as small as 1 mm. Data obtained for the period of 11 years from 1975 to 1986 has been analyzed. Some
properties of crustal movements in the network across the Yamasaki fault for the

Geodetic Monitoring of the Crustal Movements across the Yamasaki Fault, Southwest Japan 95
period of 11 years are as follows : (1) The strain distribution in the network is remarkably non-uniform. In
particular, sense reversal between the NE—SW directed principal strains in the northeastern part and in southwestern part of the network is remarkable.
(2) Based on the strain data from the five diagonals of the pentagonal network, a secular strain rate of the order of 10-6 strains per year was estimated. This strain rate is about ten times greater than the ordinary rate estimated by the geodetic method in Japan.
(3) The secular WSW-down tilt rate of about 1 X 10⁻⁶ rad per year was obtained from height data of all six stations of the network. The sense of the secular tilt shows that higher topography in the network upheaved against the lower one. This is consistent wits the Quaternary movement of the Yamasaki fault, as inferred by
geological and georpotphological studies. (4) The episodic changes superposed on the secular trends of crustal movements
were found associated with two moderate earthquakes which occurred close to the network. Increases in compression rate and deviations of tilt from the secular WSW-
dowp tilt were pointed out associated with two moderate (M=3.7 and M=5.6) earthquakes having epicentral distances of about 3 km from the network. The
deviated tilts toward the opposite sides of the epicenters of forthcoming earthquakes were obtained. These episodic movements seemed to begin one/two years before the earthquakes and to recover their secular trend after the earthquakes. However, no remarkable crustal movement was detected for the moderate earthquakes having epicentral distances larger than about 15 km. On the other hand, the shear strain changes were not affected so much by the earthquakes, and showed gradual accumu-lation.
(5) The inferred crustal movements of the Yamasaki fault (the Yasutomi fault segment of the Yamasaki fault system) around the network is summarized as follows : Ground in the network has been compressed and tilted toward WSW-direction secularly. Moreover, episodic crustal movements superposed on the secular trend
are influenced by the crustal activity such as earthquakes in the close vicinity of the network.
(6) The cause of unusual strain rate and its distribution observed here is quite obscure. We, however, infer that a possible cause of unusual strain in the network is a general behavior of the fractured material in the vicinity of the fault, through the similarity of strains observed here and in the other fractured zone of the Otsuki fault. Further studies are very necessary for the physical interpretations of observed crustal movements.
Acknowledgements
These measurements were supported financially by the Ministry of Education, Science and Culture, Japan.

96 M. OMURA, K. FUJIMORI, S. OTSUKA, K. NAKAMURA and Y. TANAKA
The authors are indebted to the authorities concerned of Yasutomi-cho, Hyogo Prefecture and Japan Expressway Corporation, for allowing us to establish the net-work and providing kind support for our measurements. The authors are also indebted to the Tottori Microearthquake Observatory of Disaster Prevention Research
Institute, Kyoto University for providing the seismic informations. The authors express their sincere thanks to Mr. Kazuo Iwasaki of Geological Survey of Japan
(formerly) and Mr. Eiji Saito of Geological Survey of Japan, for their laborious help and guidance in the geodetic measurements. The authors also express their sincere thanks to Dr. Kazuo Huzita of Osaka City University (formerly), Dr. Arata Sugimura of Kobe University (formerly), Dr. Yoshimichi Kishimoto of Kyoto University, Dr. Toshihiro Kakimi, and Dr. Yoshihiro Kinugasa of the Geological Survey of
Japan, for their precious support for the site selection of the network. The authors are thankful to Mr. Usaburo Magari for his production of supplementary devices of the instruments. The authors acknowledge the members of "Research Group for the Yamasaki Fault" and those of Geophysical Institute, Faculty of Science, Kyoto Uni-versity, for their kind support in the measurements and helpful discussions.
The numerical calculations were carried out with computer systems at the Data Processing Center, Kyoto University.
References
1) Thatcher, W.: Systematic Inversion of Geodetic Data in Central California, J. Geophys. Res., Vol. 84, No. B5, 1979, pp. 2283-2295.
2) Savage, J.C., W.H. Prescott, and Guohua Gu: Strain Accumulation in Southern California, 1973-1984, J. Geophys. Res., Vol. 91, No. 137, 1986, pp. 7455-7473.
3) King, N.E., P. Segall, and W. Prescott: Geodetic Measuremens Near Parkfield, California, 1959-1984, J. Geophys. Res., Vol. 92, No. 133, 1987, pp. 2747-2766.
4) Fujimori, K., K. Nakamura, Y. Tanaka, S. Otsuka, E. Saito, and K. Iwasaki: A Precise Geodetic Survey at the Yasutomi-Usuzuku Base Line Net across the Yamasaki Fault, J. Geod. Soc. Jpn.,
Vol. 27, No. 4, 1981, pp. 317-319. 5) The Research Group for Active Faults: Active Faults in Japan, the University of Tokyo Press,
Tokyo, 1980, pp. 238-239 (in Japanese). 6) Oike, K. and Y. Kishimoto: The Yamasaki Fault as a Test-Field for the Earthquake Prediction,
Proc. Earthquake Prediction Research Symposium(1976), 1976, pp. 83-90 (in Japanese). 7) Oike, K.: Seismic Activities and Crustal Movements at the Yamasaki Fault and Surrounding
Regions in the Southwest Japan, J. Phys. Earth, Vol. 25, Suppl., 1977, pp. S31-S41. 8) Kishimoto, Y.: On Precursory Phenomena Observed at the Yamasaki Fault, Southwest Japan,
as a Test-field for Earthquake Prediction, Earthquake Prediction-An International Review, Maurice Ewing Series 4, American Geophysical Union, Washington, D.C., 1981, pp. 510-516.
9) Koizumi, N., R. Yoshioka, and Y. Kishimoto: Earthquake Prediction by means of Change of Chemical Composition in Mineral Spring Water, Geophys. Res. Lett., Vol. 12, No. 8, 1985,
pp. 510-513. 10) Matsuda, T.: Active Faults and Earthquakes-the Geological Aspect, Mem. Geol. Soc. Jpn,
Vol. 12, 1976, pp. 15-32 (in Japanese). 11) Dragomir, V.C., D.N. Ghitäu, M.S. Mihailescu, and M.G. Rotaru: Theory of the Earth's
Shape, Developments in Solid Earth Geophysics 13, Elsevier, Amsterdam, 1982, p. 300. 12) Nakane, K.: Horizontal Tectonic Strain in Japan (II), J. Geod. Soc. Jpn., Vol. 19, No. 4, 1973,
pp. 200-208 (in Japanese).

Geodetic Monitoring of the Crustal Movements across the Yamasaki Fault, Southwest Japan 97
13) Miyabe, N.: Blocks in the Earth's Crust and their Movements. Part I., Bull. Earthq. Res. Inst., Vol. 9, 1931, pp. 256-270.
14) Otsuka, S., Y. Tamura, K. Fujimori, and Y. Tanaka: Crustal Deformations Observed at the Rokko-Tsurukabuto Observation Station (1), J. Geod. Soc. Jpn., Vol. 28, No. 3, 1982, pp. 134-
151 (in Japanese). 15) Tanaka, Y., M. Hayashi, M. Kato, M. Koizumi, and K. iluzita: Continuous Observation of
Crustal Deformations in a Fracture Zone of Rokko Fault System (Preliminary Report), Annuals, Disas. Prey. Res. Inst., Kyoto Univ., No. 15B, 1972, pp. 15-28 (in Japanese).
16) Handa, S. and N. Sumitomo: MT Sounding Around Active Fault by Using Natural Electro- magnetic Noises in the ELF Range —Yamasaki Fault—, Earth Science Report of College of
Liberal Arts and Sciences, Kyoto Univ. (Tsukumo Earth Science), No. 14, 1979, pp. 21-31 (in
Japanese).