Embed Size (px)
Citation preview
Cavitating flow features in a water-jet pump under different upstream conditionsRenfang Huang1, An Yu1, Bin Ji2, Jiajian Zhou3, Zhihong Zhai3, Xianwu Luo1
ISROMAC 2016
International Symposium on
Transport Phenomena and
Dynamics of Rotating Machinery
Hawaii, Honolulu
April 10-15, 2016
AbstractTurbulent cavitating flows in a water-jet mixed-flow pump were investigated by using the k- SST turbulence model and a cavitation model based on mass transport equation to give an insight into cavitating features under different upstream conditions. Both the hydraulic and cavitation characteristics predicted by the present numerical method agree well with the available experimental results. The numerical results depict that the cavity in the pump firstly occurs at the blade leading edge close to blade tip, and then grows both downstream and toward the impeller hub. With cavitation development, sheet cavities expand along the impeller shroud, and are likely to block the flow passage under the critical cavitation condition. Besides, the thrust of the water-jet pump is enhanced gradually during cavitation evolution, but the hydraulic performance of the diffuser remains unchanged. The hydraulic loss at the impeller suction surface increases with secondary flows and Boundary Vorticity Flux (BVF) peak during cavitation, which is located at the vapor-liquid interface, especially near the blade tip.
KeywordsCavitating flow—Water-jet pump—Mixed-flow pump—Numerical simulation
1Department of Thermal Engineering, Tsinghua University, Beijing 100084, China2Department of Mechanical Engineering, Wuhan University, Wuhan, China3Marine Design and Research Institute of China, Shanghai, China*Corresponding author: [email protected]
INTRODUCTIONNowadays, more and more interest has been attracted by the water-jet propulsion which has a variety of advantages such as less vibration, low noise, high efficiency, etc. in the specified speed range [1, 2]. In recent years, the water-jet propulsion has been rapidly developed and widely used in the marine field, which is expected to be the potential technology against the propeller due to the improvement in the progress of pump design, manufacture and fabrication [3]. Many scholars [4-7] have investigated the water-jet propulsion in different ships using the computational fluid dynamics (CFD) method or the model test according to the procedure proposed by the ITTC Water-jet Performance Prediction Specialist Committee [8, 9]. Kandasamy et al. [4, 5], and Tahara et al. [6] optimized the water-jet propulsion high speed ships using both the simulation-based design method and model test. Bulten et al. [7] studied a water-jet propulsion system, and provided a reference for other researchers.
Up to now, many studies focused on the propulsion system optimization and characteristic prediction without considering cavitation in the water-jet pump. In fact, cavitation is inevitable when the water-jet pump is operated at a high speed which may result in pressure fluctuation, noise and erosion [10, 11]. Thus, good cavitation performance as well as high hydrodynamic efficiency is considered as the necessary criterion to design and evaluate a water-jet pump.
In general, experiments and numerical simulation are very useful tools to evaluate the pump performance. Until now, compared with the long-time period and huge investment of the experiment, numerical simulation has been wide-spread used due to the progress of computer technology, which can provide a basic understanding for the evaluation and improvement of hydraulic machines [12-15].
In this paper, the turbulent cavitating flows in a water-jet mixed-flow pump was investigated under different upstream conditions by solving Reynolds Averaged Navier-Stokes (RANS) equations and a cavitation model [16]. Based on the calculated results, cavitating flow features were further discussed.
1. Geometrical parameters of the water-jet pumpThe water-jet mixed-flow pump is composed of a 6-blade impeller, a 7-blade diffuser, an inlet flow channel and an outlet flow channel. The pump was designed with flow coefficient of =0.183 at the rotational speed of n=1450 r/min.
The meridional schematic diagram for the water-jet pump is shown in Figure 1 with geometrical parameters listed in Table 1. The Reynolds number Re, is 2.47×10⁶, and the blade tip clearance relative to the impeller diameter is 0.86×10⁻³.

Figure 1. Meridional schematic diagram for the pump
Table 1. Geometrical parameters for the impeller
Parameters Symbols ValuesBlade width ratio at the inlet b1/D2 0.318Blade width ratio at the exit b2/D2 0.247Blade inlet diameter at the tip D1/D2 0.856Blade inlet diameter at the hub D1h/D2 0.245Blade exit diameter at the hub D2h/D2 0.604Hub ratio Dh/D2 0.209Blade tip clearance c/D2 0.86e-3
2. Numerical method
2.1 Governing equations and cavitation modelA homogenous assumption is used to solve the cavitation flow, where the liquid and vapor are considered as a mixture, and share the same velocity. The mixture flow can be described by the Reynolds Averaged Navier-Stokes (RANS) equations as follows:
(1)
(2)where p, u are the pressure and velocity; m, m are density and dynamic viscosity of the mixture, and defined as follows:
(3)
(4)where subscript v, l represent the vapor and liquid, respectively.
The k-SST turbulence model is adopted to obtain highly accurate predictions of flow separation under adverse pressure gradients thanks to its consideration of the turbulent shear stress.
The cavitation is modeled by mass transfer equation:
(5)wherev, v respectively represent the vapor phase density
and volume fraction. The source terms and are derived from the cavitation model [17].
Then, the Rayleigh-Plesset equation is applied to solve the source terms and control vapor generation and condensation.
(6)
(7)To obtain the interphase mass transfer rate, four model
parameters are given as follows: bubble radius Rnuc = 1 m, the nucleation volume fraction rnuc = 510-4, the evaporation coefficient Fvap = 50 and the condensation coefficient Fcond = 0.01.
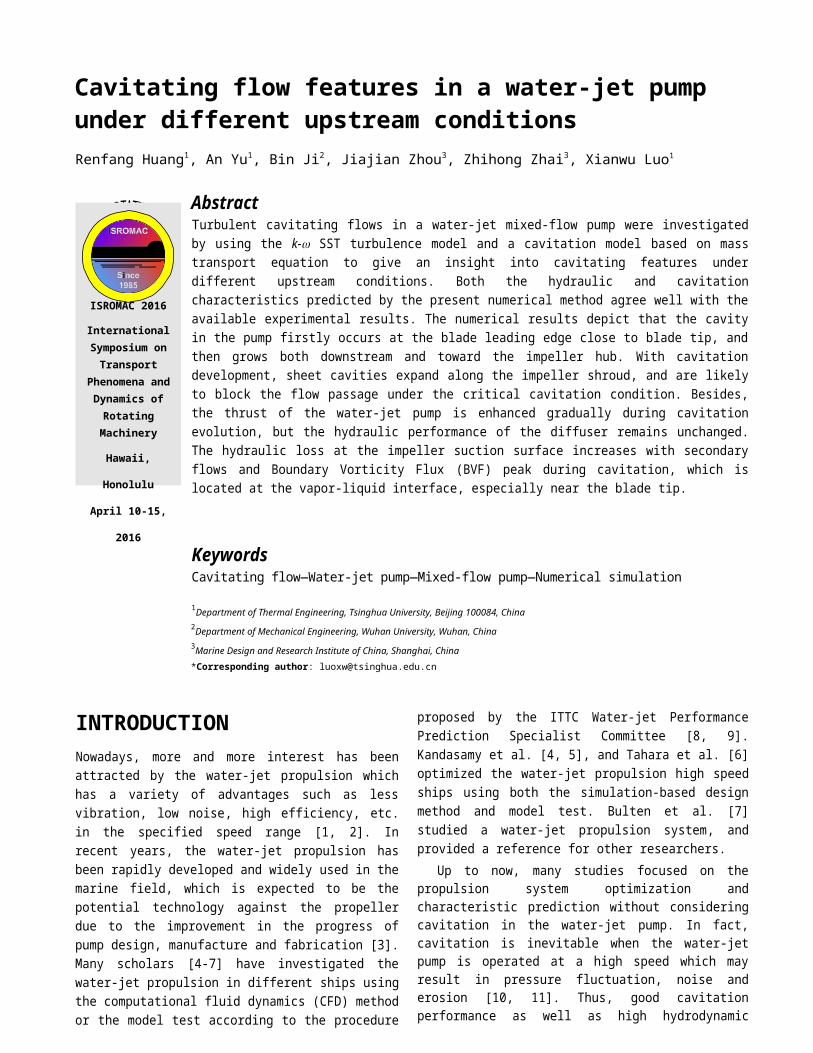
2.2 Mesh generation and independence testIn this study, one blade-to-blade flow channel are considered for simulation. The computational domain is divided into the suction pipe, the outlet pipe, the impeller and the diffuser. Two interfaces are set in the suction and outlet pipe to monitor the total pressure. The structured hexahedral mesh is applied to obtain accurate simulation results. The topological structure and mesh point distribution are the same in different models. What is more, mesh around the impeller blade are refined to satisfy the requirements for the turbulence model with the Yplus ranging from 4 to 90 in Figure 2.
Figure 3 shows the mesh indepandence test for mesh generation. Note that the pump head coefficient and efficiency are more sensitive to the mesh density of diffuser than that of impeller. When the mesh quantity in impeller and diffuser reach 400,000 respectively, the pump head coefficient and efficiency remain unchanged. Therefore, 460,000 in impeller and 400,000 in diffuser is decided as the final mesh scheme with considering the computing resources.
(a)
(b)Figure 2. (a) Computation domainand (b) Yplus distribution at
the impeller blade (left: suction surface (SS); right: presure surface (PS))
SS PS
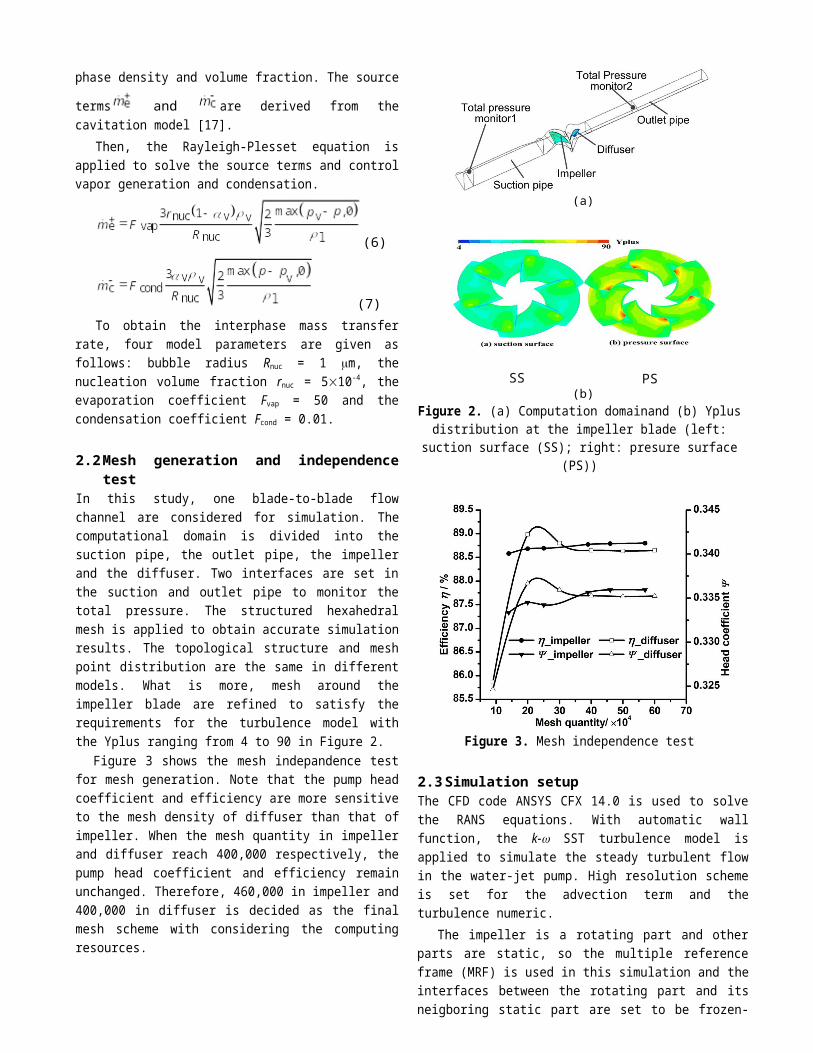
Figure 3. Mesh independence test
2.3 Simulation setupThe CFD code ANSYS CFX 14.0 is used to solve the RANS equations. With automatic wall function, the k- SST turbulence model is applied to simulate the steady turbulent flow in the water-jet pump. High resolution scheme is set for the advection term and the turbulence numeric.
The impeller is a rotating part and other parts are static, so the multiple reference frame (MRF) is used in this simulation and the interfaces between the rotating part and its neigboring static part are set to be frozen-rotor under steady condition.
For boundary conditions, the mass flow rate is given at the outlet plane based on the mass equilibrium. The total pressure is applied at the inlet plane and gradually reduced when cavitation develops. All solid walls are set as the non-slip wall condition.
3. RESULTS AND DISCUSSION
Figure 4 shows the characteristic curves of the pump. The calculation results are marked as “cal.”, and the experimental results are marked as “exp.”. The results demonstrates that the calculated head coefficients agree well with the experimental data although the calculated efficiency is always a little higher than that by experiments. When the water-jet pump is operated at the design point with flow coefficient =0.183 and rotational speed n=1450 r/min, the head coefficient is 0.33 in calculation and 0.31 in experiment, and the efficiency is 0.89 in calculation and 0.83 in experiment. This discrepancy in efficiency is reasonable due to the fact that the efficiency in numerical simulation is the hydraulic efficiency, the effects of the mechanical and volumetric losses of the pump are not considered.
Net Positive Suction Head (NPSH) is usually used to describe the cavitation performance for pumps. The definition of NPSH is shown subsequently:
(8)where pt is the total pressure at the inlet plane in Figure 2.
Thoma’s cavitation number i.e. is a dimensionless
cavitation performance parameter, and can be defined as the following:
(9)where H is the pump head at the design point.
The critical NPSH, i.e., NPSHc, is defined as the NPSH value when the pump head drops 3% from its original value without cavitation.
Figure 5 shows cavitation characteristics, where both the numerical and experimental results are included for comparison. The critical cavitation number is 0.36 predicted by calculation and 0.49 by experiment.There is a difference in predicting cavitation characteristics by present numerical method since many factors in experiments, such as gas in local water and water temperature, can’t be taken into account. However, the simulation shows the same tendency of cavitation effects on pump performance as the experiment does.
Usually, the marine water-jet propulsion vessel is required to move at the desirable speed, so the thrust is an important performance for the water-jet pump. Figure 6 shows the thrust T and vapor volume under different cavitation conditions with flow coefficient =0.183 and rotational speed n=1450 r/min. The thrust firstly slightly changes and then increases in a jump near the critical cavitation condition. Table 2 presents the mass-averaged velocity at the inlet plane, impellet outlet plane and diffuser outlet plane to analyze the pump thrust T=Q(V2z.diffuser- Vin). As the inlet velocity Vin is basicaly constant, the axial velocity at the diffuser outlet planeV2z.diffuser
directly affects the thrust. It is indicated that the hydraulic performance of the diffuser hardly changes with cavitation development, and the thrust is essentially connected with cavitating flows in impeller.
Cavitation evolution in impeller is shown in Figure 7. Cavity illustrated by iso-surface of vapor volume fraction=0.1 firstly occurs at the blade leading edge and close to the blade tip, then grows both downstream and toward the impeller hub. When cavitation number is 0.43, the maximum cavity extends to 2/3 blade length with scattered cavities attaching to the impeller shroud before the blade inlet. Gradually, the scattered cavities develop into sheet cavities surrounding the shroud and extend toward the blade-to-blade passage under the critical cavitation condition.
Figure 4. Characteristic curves for the pump (n=1450 r/min)

Figure 5. Cavitation performance (=0.183, n=1450 r/min)
Figure 6.Thrust and vapor volume under different cavitation conditions (=0.183, n=1450 r/min)
Table2. Inlet velocity Vin, axial velocity at the impeller outlet plane V2z.impeller
and axial velocity at the diffuser outlet plane V2z.diffuser under different cavitation conditions
Vin (m/s) V2z.impeller (m/s) V2z.diffuser (m/s)0.89 6.30 6.75 10.270.43 6.30 6.76 10.280.36 6.30 6.84 10.40
Figure 7.Cavitation evolution with iso-surface of vapor volume fraction=0.1 (=0.183, n=1450 r/min)
Figure 8. Secondary flow contours and streamlines at impeller suction surface under different cavitation conditions
(=0.183, n=1450 r/min)
Figure 9. BVF contours and streamlines at impeller suction surface under different cavitation conditions
(=0.183, n=1450 r/min)
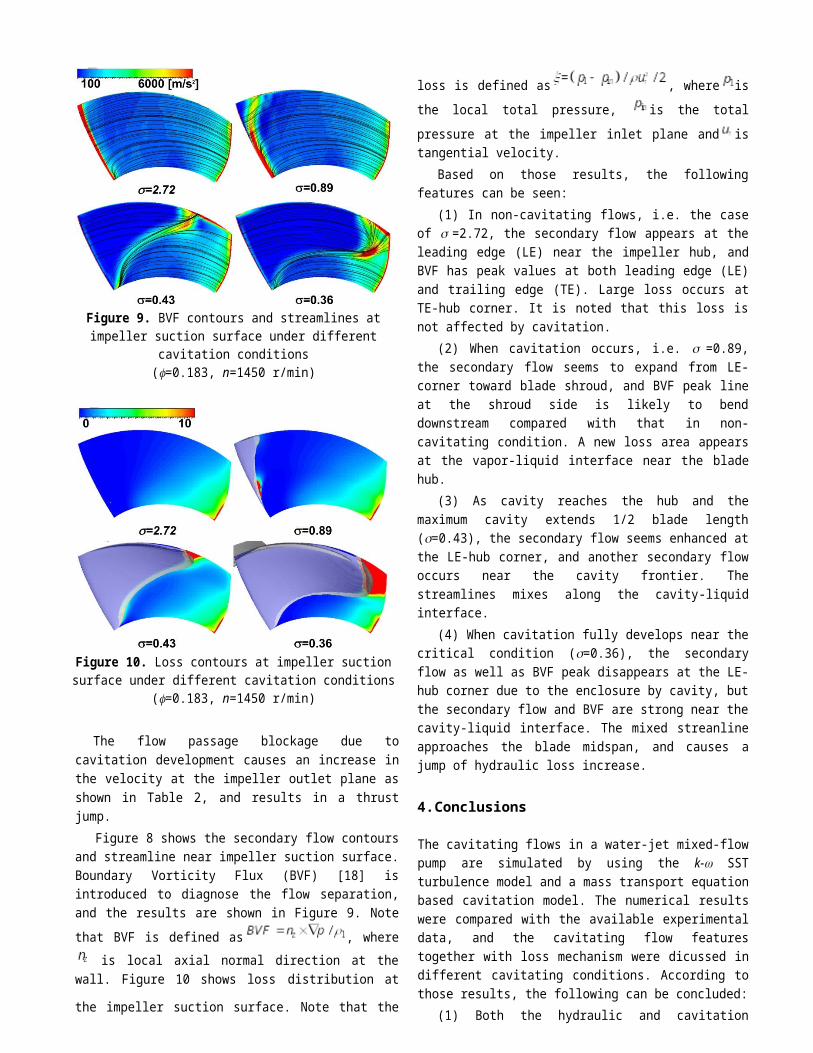
Figure 10. Loss contours at impeller suction surface under different cavitation conditions
(=0.183, n=1450 r/min)
The flow passage blockage due to cavitation development causes an increase in the velocity at the impeller outlet plane

as shown in Table 2, and results in a thrust jump.Figure 8 shows the secondary flow contours and
streamline near impeller suction surface. Boundary Vorticity Flux (BVF) [18] is introduced to diagnose the flow separation, and the results are shown in Figure 9. Note that
BVF is defined as , where is local axial normal direction at the wall. Figure 10 shows loss distribution
at the impeller suction surface. Note that the loss is defined
as , where is the local total pressure,
is the total pressure at the impeller inlet plane and is tangential velocity.
Based on those results, the following features can be seen:
(1) In non-cavitating flows, i.e. the case of =2.72, the secondary flow appears at the leading edge (LE) near the impeller hub, and BVF has peak values at both leading edge (LE) and trailing edge (TE). Large loss occurs at TE-hub corner. It is noted that this loss is not affected by cavitation.
(2) When cavitation occurs, i.e. =0.89, the secondary flow seems to expand from LE-corner toward blade shroud, and BVF peak line at the shroud side is likely to bend downstream compared with that in non-cavitating condition. A new loss area appears at the vapor-liquid interface near the blade hub.
(3) As cavity reaches the hub and the maximum cavity extends 1/2 blade length (=0.43), the secondary flow seems enhanced at the LE-hub corner, and another secondary flow occurs near the cavity frontier. The streamlines mixes along the cavity-liquid interface.
(4) When cavitation fully develops near the critical condition (=0.36), the secondary flow as well as BVF peak disappears at the LE-hub corner due to the enclosure by cavity, but the secondary flow and BVF are strong near the cavity-liquid interface. The mixed streanline approaches the blade midspan, and causes a jump of hydraulic loss increase.
4. Conclusions
The cavitating flows in a water-jet mixed-flow pump are simulated by using the k- SST turbulence model and a mass transport equation based cavitation model. The numerical results were compared with the available experimental data, and the cavitating flow features together with loss mechanism were dicussed in different cavitating conditions. According to those results, the following can be concluded:
(1) Both the hydraulic and cavitation performance were reasonably predicted by the present numerical method. Thus, the numerical method is suitbale for the cavitating flow analysis in a water-jet pump.
(2) The thrust of water-jet pump increases gradually with cavitation development since the flow velocities in impeller as well as jet velocities increased. However, hydraulic performance of the diffuser hardly change due to cavitation development.
(3) Cavity in the pump firstly occurred at the blade
leading edge near the blade tip, and then grew both downstream and toward the impeller hub. For cavitation at the critical condition, sheet cavities expand along the impeller shroud, extend toward the blade-to-blade flow passage, and cause the flow passage blockage.
(4) Secondary flows as well as BVF peak cause no loss at the leading edge under non-cavitation condition. Loss at the TE-hub corner is not affected by cavitation and partially results from the BVF peak at TE.
(5) As cavitation develops, hydraulic loss at the impeller suction surface increases along with secondary flows and BVF peak, which is located at the vapor-liquid interface, especially near the blade tip.
ACKNOWLEDGMENTSThis work was financially supported by the National Natural Science Foundation of China (Project Nos. 51376100, 51306018 and 51536008), and State Key Laboratory for Hydroscience and Engineering (Project Nos. 2015-E-03 and 2014-KY-05).
NOMENCLATUR
b1 Blade width at the impeller inletb2 Blade width at the impeller exitBVF Boundary Vorticity Flux, =nzp/l
c Blade tip clearanceD1 Blade inlet diameter at the tipD1h Blade inlet diameter at the hubD2 Blade exit diameter at the tipD2h Blade exit diameter at the hubDh Hub diameterFcond Condensation coefficient, =0.01Fvap Evaporation coefficient, =50H Pump head
Vaporization term
Condensation termNPSH Net Positive Suction Headn Rotational speed, =1450 r/minnz Local axial normal direction at the wallp Static pressurepin Total pressure at the impeller inlet planepl Local total pressurept Total pressure at the inlet monitored planePS Pressure surfacernuc Nucleation volume fraction,=5×10⁻⁴
Re Reynolds number, =2.47×10⁶
Rnuc Bubble radius, =1 umSS Suction surfaceT Pump thrust, =Q(V2z.diffuser - Vin)u VelocityVin Inlet velocityuT Tangential velocityV2z.diffuserAxial velocity at the diffuser outlet planeV2z.impeller Axial velocity at the impeller outlet planev Vapor volume fraction Pump efficiencym Homogeous dynamic viscosity Loss, =l Density of the liquid waterm Densityof the homogenous phase
v Density of the vapor phase Thoma’s cavitation number, =NPSH/H Flow coefficient Head coefficient
REFERENCES[1] M. Kandasamy, W. He, T. Takai, Y. Tahara, D.
Peri,E. Campana, W. Wilsonand F. Stern.Optimization of water-jet propelled high speed ships—JHSS and Delft Catamaran.11th international conference on fast sea transportation, FAST. 2011.
[2] J. Carlton.Marine propellers and propulsion.Butterworth-Heinemann, 2012.
[3] T. Takai,M. Kandasamyand F. Stern.Verification and validation study of URANS simulations for an axial water-jet propelled large high-speed ship.Journal of marine science and technology,16(4):434-447, 2011.
[4] M. Kandasamy,D. Peri,Y. Tahara,W. Wilson, M. Miozzi, S. Georgiev, E. Milanov, E. Campanaand F. Stern. Simulation based design optimization of water-jet propelled Delft catamaran.Int. Shipbuilding Progress, 60(1):277-308, 2013.
[5] M. Kandasamy,S. Georgiev,E. Milanovand F. Stern. Numerical and experimental evaluation of water-jet propelled delft catamarans. FAST, Hawaii, USA, 2011.
[6] Y. Tahara,T. Hino,M. Kandasamy,W. Heand F. Stern. CFD-based multiobjective optimization of water-jet propelled high speed ships.Proc. FAST11, Hawaii, USA, 2011.
[7] N. W. H. Bulten. Numerical analysis of a water-jet propulsion system. PhD thesis, Eindhoven University of Technology, 2006.
[8] T. T. Van. Report of the specialist committee on validation of water-jet test procedures. Proc. ITTC24, 2005.
[9] K. Kim,S. R. Turnock,J. Ando,P. Becchi, E. Korkut, A. Minchew, E. Y. Semionicheva, S. H. Van and W. X. Zhou.The propulsion committee: final report and recommendations to the 25th ITTC. Proc. ITTC25, 2008.
[10] R. F. Huang, B. Ji, X. W. Luo, Z. H. Zhai, and J. J. Zhou. Numerical investigation of cavitation-vortex interaction in a mixed-flow waterjet pump. Journal of Mechanical Science and Technology, 29(9): 3707-3716, 2015.
[11] X. W. Luo, B. Ji and H. Y. Xu. Design and optimization for fluid machinery.Tsinghua UniversityPress, 2012.
[12] X. W. Luo, Y. Zhang, J. Q. Peng,H. Y. Xuand W. P. Yu. Impeller inlet geometry effect on performance improvement for centrifugal pumps.Journal of Mechanical Science and Technology, 22(10):1971-1976, 2007.
[13] B. Ji, X. W. Luo, X. Wang, X. X. Peng, Y. L. Wu and H. Y. Xu. Unsteady numerical simulation of cavitating turbulent flow around a highly skewed model marine propeller.Journal of Fluids
Engineering, 133(1):011102, 2011.[14] X. W. Luo, Y. Zhang, J. Q. Peng and H. Y. Xu.Effect
of impeller inlet geometry on centrifugal pump cavitation performance.Journal of Tsinghua University (Science and Technology), 05:836-839, 2008.
[15] B. Ji, X. W. Luo, X. X. Peng, Y. L. Wuand H. Y. Xu.Numerical analysis of cavitation evolution and excited pressure fluctuation around a propeller in non-uniform wake.International Journal of Multiphase Flow, 43:13-21, 2012.
[16] X. W. Luo, W. Wei,B. Ji, Z. B. Pan,W. C. Zhou and H. Y. Xu. Comparison of cavitation prediction for a centrifugal pump with or without volute casing. Journal of Mechanical Science and Technology, 27(6):1643-1648, 2013.
[17] P.J.Zwart, A.G.Gerber andT.Belamri. A two-phase flow model for predicting cavitation dynamics, Proceedings of the fifth international conference on multiphase flow, Yokohama, Japan, 2004.
[18] J. Wu, H. Maand M. Zhou. Vorticity and vortex dynamics. Springer, 2006.


![Title - ISROMAC 17-ISIMet 2isromac-isimet.univ-lille1.fr/upload_dir/finalpaper/220... · Web viewPajaczkowski et al. [11] used the FSI approach in transient simulations of hydrodynamic](https://img.pdfslide.net/doc/110x75/60c05b2a6242e07805505207/title-isromac-17-isimet-2isromac-web-view-pajaczkowski-et-al-11-used-the-fsi.jpg)