Embed Size (px)
Citation preview
1
1
Title: Selection for cuticular melanism reveals immune function and life-history trade-2
offs in Spodoptera littoralis 3
4
Authors: S.C. Cotter1,2
, Myatt, J.P.1,3
, Benskin, C.M.H.1. & Wilson, K.
1 5
6
Addresses: 7
1. Department of Biological Sciences, Lancaster Environment Centre, Lancaster 8
University, Lancaster LA1 4YQ, UK. 9
2. Current address: Department of Zoology, University of Cambridge, Downing Street, 10
Cambridge, CB2 3EJ, UK 11
3. Current address: School of Biosciences, The University of Birmingham, Edgbaston, 12
Birmingham, B15 2TT, UK 13
14
Corresponding author: Dr. Sheena Cotter, Department of Zoology, University of 15
Cambridge, Downing Street, Cambridge, CB2 3EJ, UK. Tel: +44 (0)1223 331861, Fax: +44 16
(0)1223 336676. Email: [email protected] 17
18
Running title: Melanism, immunity and life-history trade-offs in S. littoralis 19

2
1
3
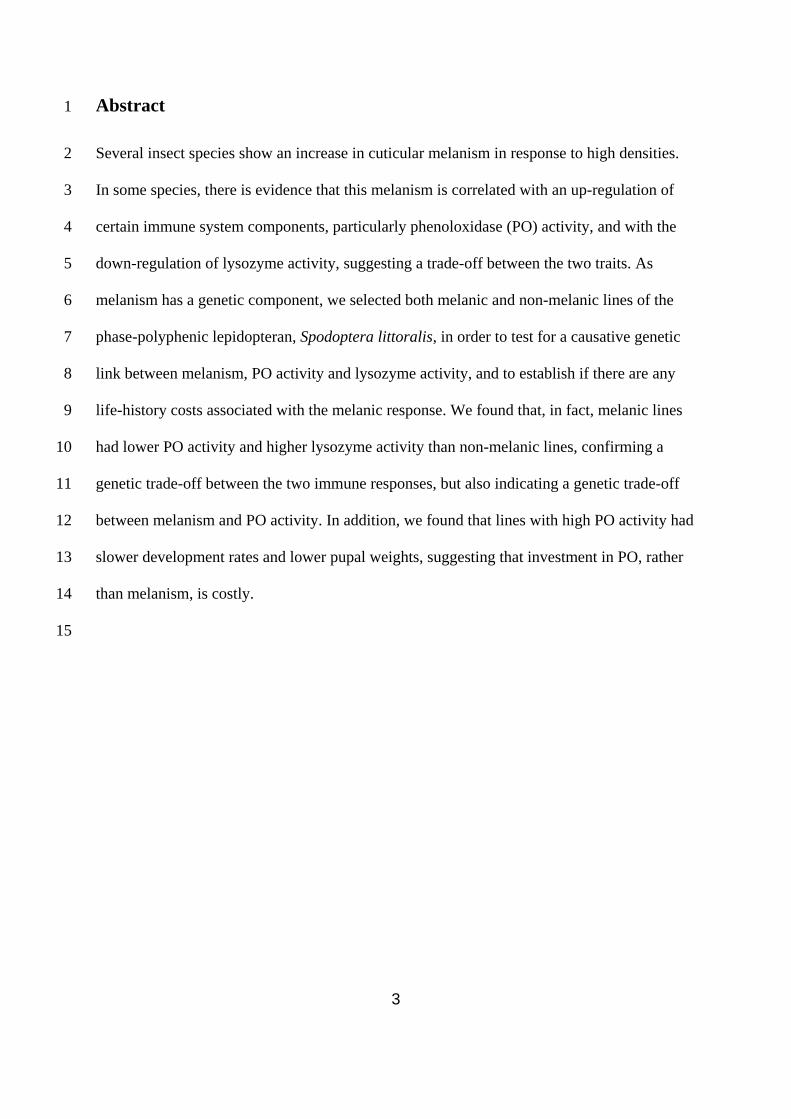
Abstract 1
Several insect species show an increase in cuticular melanism in response to high densities. 2
In some species, there is evidence that this melanism is correlated with an up-regulation of 3
certain immune system components, particularly phenoloxidase (PO) activity, and with the 4
down-regulation of lysozyme activity, suggesting a trade-off between the two traits. As 5
melanism has a genetic component, we selected both melanic and non-melanic lines of the 6
phase-polyphenic lepidopteran, Spodoptera littoralis, in order to test for a causative genetic 7
link between melanism, PO activity and lysozyme activity, and to establish if there are any 8
life-history costs associated with the melanic response. We found that, in fact, melanic lines 9
had lower PO activity and higher lysozyme activity than non-melanic lines, confirming a 10
genetic trade-off between the two immune responses, but also indicating a genetic trade-off 11
between melanism and PO activity. In addition, we found that lines with high PO activity had 12
slower development rates and lower pupal weights, suggesting that investment in PO, rather 13
than melanism, is costly. 14
15
4
Introduction 1
The use of colour is ubiquitous in the animal kingdom, with pigments such as melanin being 2
employed for a variety of purposes, including camouflage (Kettlewell 1973; Majerus 1998; 3
Hoekstra & Nachman 2003) warning colouration, usually in conjunction with contrasting 4
colours such as reds or yellows (Wiklund & Sillen-Tullberg 1985; Marples et al. 1994; 5
Kauppinen & Mappes 2003; Bezzerides et al. 2007); and in sexually-selected traits (Jarvi & 6
Bakken 1984; Moller 1988; Siva-Jothy 2000; Rosen & Tarvin 2006). In many cases, these 7
pigments appear to be used as signals of health or quality, the honesty of which can be 8
maintained only if the signal is costly to produce (Zahavi 1975; Sheldon & Verhulst 1996). 9
Melanin and its precursors also play a protective role against parasites in both vertebrates and 10
invertebrates (Söderhall & Ajaxon 1982; Montefiori & Zhou 1991; Nappi & Vass 1993; 11
Marmaras et al. 1996; Mackintosh 2001; Griffith et al. 2006), potentially creating a direct 12
link between the display and parasite resistance (e.g. Kose & Møller 1999). 13
In insects, melanin and its precursors are used directly in the immune system. Phenoloxidase 14
(PO), a key enzyme in the synthesis of melanin, is found in the haemolymph, midgut and 15
cuticle. It is thought to be involved in non-self recognition, as well as the encapsulation of 16
larger organisms, and so plays a crucial role in the insect immune response (Ashida & Brey 17
1995; Ashida & Brey 1997; Wilson et al. 2001; Cotter et al. 2004a). Melanin itself also has 18
chemical properties that may inhibit fungal growth (Söderhall & Ajaxon 1982; St. Leger et al. 19
1988). 20
In a number of insect species, melanin is deposited in the cuticle in response to increasing 21
population density, resulting in density-specific morphs or phases. The archetypal density-22
5
dependent phase polyphenic species, the desert locust, Schistocerca gregaria, undergoes a 1
number of morphological, physiological and behavioural changes in response to increasing 2
population density, one of which is the melanisation of the cuticle. However, this 3
phenomenon also occurs in a number of orthopteran, lepidopteran and phasmid species 4
(Wilson & Cotter 2008 and references therein). The adaptive function of melanism in the 5
high density phase has not been categorically established, but there is strong evidence to 6
suggest that it is associated with increased investment in the immune system. The density-7
dependent prophylaxis (DDP) hypothesis posits that as many parasites are transmitted in a 8
positively density-dependent fashion, and investment in the immune system is assumed to be 9
costly, it would be beneficial for individuals to use the density of conspecifics as a cue to the 10
risk of parasitism and to tailor investment in immune function accordingly (Wilson & Reeson 11
1998). 12
Previous studies on several phase polyphenic lepidopteran species have found that the high-13
density or melanic phase is more resistant to viruses (Kunimi & Yamada 1990; Goulson & 14
Cory 1995; Reeson et al. 1998), entomopathogenic fungi (Mitsui & Kunimi 1988; Wilson et 15
al. 2001) and parasitoids (Wilson et al. 2001). Similarly, both melanic mealworm beetles 16
(Barnes & Siva-Jothy 2000) and high-density desert locusts (Wilson et al. 2002) were found 17
to be more resistant to an entomopathogenic fungus than their non-melanic or low-density 18
counterparts. 19
The changes that occur in the immune system that underlie this change in susceptibility to 20
parasites are less clear, but there is evidence that in high-density phenotypes there is an 21
increase in either PO activity (Reeson et al. 1998; Wilson et al. 2001; Cotter et al. 2004a), 22
encapsulation ability (Cotter et al. 2004a), haemocyte density (Wilson et al. 2002) and/or 23
6
lysozyme-like antibacterial activity (Wilson et al. 2002). However, in most cases, not all 1
immune traits are simultaneously up-regulated and, indeed, there is evidence from the phase 2
polyphenic lepidopteran Spodoptera littoralis, for a trade-off between PO activity and 3
lysozyme-like antibacterial activity (Cotter et al. 2004a; Cotter et al. 2004b), suggesting that 4
all immune function traits cannot be simultaneously upregulated. 5
Despite the wealth of evidence that melanism is associated with increased immune function 6
in species that show a melanic response to high densities, it is still unclear if this relationship 7
is simply correlational or if there is a causative link. To test this, we selected for both 8
melanism and non-melanism (paleness) in the phase polyphenic lepidopteran, Spodoptera 9
littoralis (the Egyptian cotton leaf worm). We have shown previously that although melanism 10
is triggered by high densities, it also has a strong additive genetic component, with some 11
families becoming melanic at low densities and others remaining pale at high densities 12
(Cotter et al. 2004b; Lee & Wilson 2006). We then asked the following questions: 13
1. Does selection for melanism result in changes in immune system traits, such as PO 14
activity and lysozyme-like antibacterial activity? 15
2. Is there evidence for a trade-off between PO activity and lysozyme-like antibacterial 16
activity within or across selected lines? 17
3. Are there life-history costs associated with selection for melanism? 18
From our previous finding that high density, melanic individuals had high PO activity but 19
low lysozyme activity, we predicted that if melanism was directly linked to the immune 20
system, then melanic selected lines would show increased PO activity and decreased 21
antibacterial activity, with pale lines showing the reverse trend. Following this, we also 22
7
predicted that, in the absence of parasitism, melanic lines would show a fitness cost compared 1
to pale lines, as investment in immunity should be costly. 2
3
Methods 4
Spodoptera littoralis culture 5
The Spodoptera littoralis culture was established from eggs collected near Alexandria in 6
Egypt in 2002, and high numbers were maintained at each generation to reduce inbreeding. 7
At the start of the selection experiment, the colony had been reared using single pair mating 8
for 18 generations with over 150 pairs established each generation. Larvae were reared singly 9
from the 2nd
instar on a semi-artificial wheatgerm diet in 25 ml polypots (Cotter 2002). 10
11
Selection regime 12
At the beginning of the selection experiment, two replicate groups of 200 larvae were 13
selected from the colony, placed in individual polypots and reared in one of two incubators 14
under a 12:12 light:dark regime at 25°C until the final instar. In the middle of the final instar, 15
just prior to the wandering phase (where larvae cease feeding and start to look for a place to 16
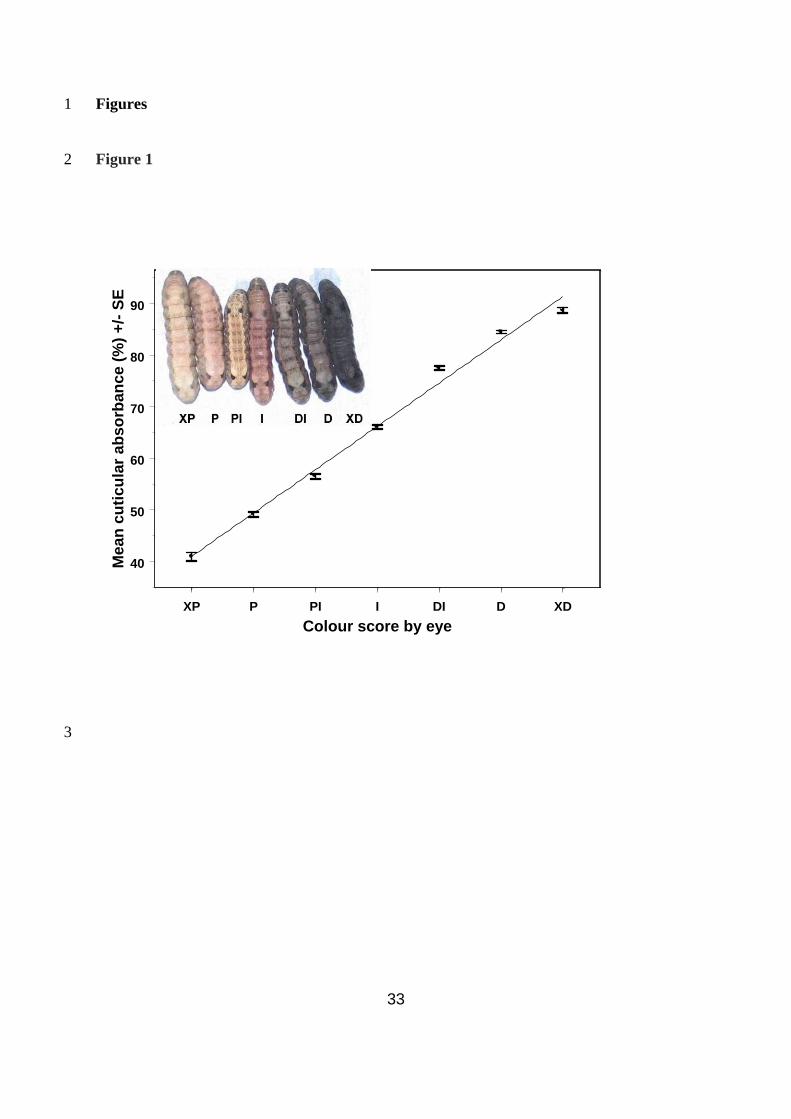
pupate) larvae were numbered, weighed and colour-scored by eye, which involved placing 17
them into one of seven categories: extra pale, pale, pale intermediate, intermediate, dark 18
intermediate, dark and extra dark (inset, Figure 1). For each replicate, the 100 darkest larvae 19
were assigned to the dark line (1D – dark line, replicate 1, 2D – dark line replicate 2) and the 20
100 palest larvae were assigned to the pale line (1P – pale line, replicate 1, 2P – pale line 21
8
replicate 2). Emerging moths were mated in groups of 10 males and 10 females in breeding 1
chambers with access to sucrose solution and tissue paper for egg laying. Approximately 100 2
adults in each replicate were allowed to breed each generation. 3
Generations 1 – 4: 400 larvae were set up per line each generation, larvae were colour scored 4
by eye in the final instar and the 25% darkest (1D and 2D) or 25% palest (1P and 2P) were 5
selected to breed. Generations 5 – 11: 600 larvae were set up per line each generation, larvae 6
were colour-scored by eye in the final instar and the 20% darkest (1D and 2D) or 20% palest 7
(1P and 2P) were selected to breed. At generation 12, selection was relaxed but as the colour 8
of the larvae began to slip back towards that of larvae in the control line, a 50% selection 9
pressure was re-instituted at generation 14 and maintained thereafter. 10
In generations 0, 7, 11 and 12, larvae were additionally colour-scored using an Avaspec-2048 11
fibre optic spectrometer with an AvaLight-HAL tungsten halogen light source (Avantes, 12
Eerbeek, The Netherlands). Measurements were taken using a 2-mm diameter bifurcated 13
fibre optic probe that was positioned at a 90° angle to the integument surface of each insect 14
(Lee & Wilson 2006). A cylindrical plastic tube was attached to the probe in order to 15
maintain a constant distance of 2 mm from the sample. A late final-instar S. littoralis 16
caterpillar with extremely conspicuous pale colouration was used to set the white standard 17
reference, while the dark standard was established by eliminating light from the probe. These 18
standards allowed the quantification of the relative paleness of a sample compared with the 19
white standard reference, which was expressed as an absorbance value (%). Thus, 0% 20
absorbance was equivalent paleness to the white standard, while 100% absorbance was 21
equivalent to the dark standard. Triplicate absorbance values were recorded at 575 nm 22
9
wavelength for each larva along the dorsal midline of the cuticle. The repeatability of this 1
technique was high (r = 0.86 +/- 0.009, n = 530, 3 measurements per individual). 2
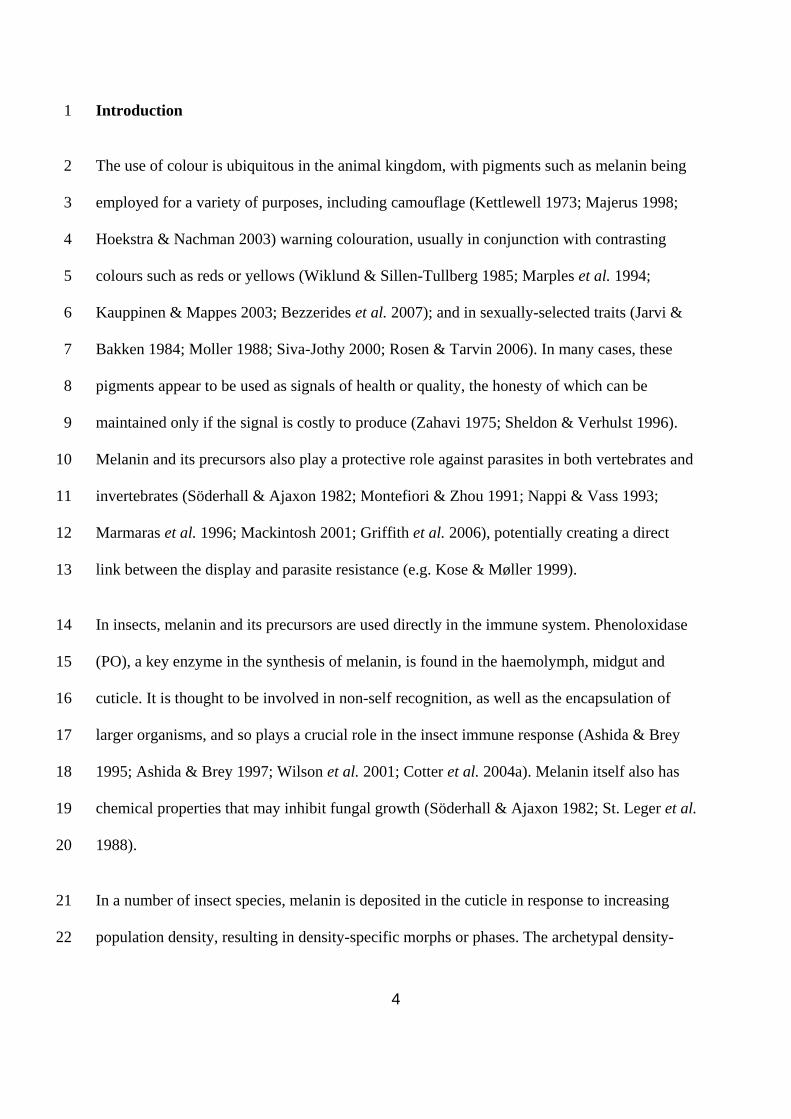
The correlation between the qualitative categorical colour score and the quantitative 3
spectrometer score was found to be extremely strong (r = 0.81, t503 = 30.93, P < 0.001, Fig. 1), 4
therefore the qualitative scores were changed to the mean spectrometer score for that 5
category to allow the response to selection to be quantified more easily. 6
7
Haemolymph sampling 8
All immune function data were collected from larvae during generation 12; 100 larvae were 9
sampled for each line. After colour-scoring, larvae were weighed and a haemolymph sample 10
was taken from each individual by piercing the final proleg with a fine needle and collecting 11
the haemolymph in an Eppendorf tube. All of the samples were then frozen at -80C until 12
they were to be measured. After the haemolymph was sampled, larvae were returned to their 13
polypots to pupate. 14
15
Phenoloxidase assay 16
Haemolymph PO was measured using a modified version of the method described in Cotter 17
& Wilson (2002). In brief, 8 l of haemolymph were added to 400 l of ice-cold phosphate 18
buffered saline (pH 7.4) in a plastic Eppendorf tube and vortexed. PO activity was assayed 19
spectrophotometrically with dopamine as a substrate. This assay involved adding 100 l of 4 20
10
mM dopamine to 100 l of the buffered haemolymph and incubating duplicate samples of the 1
mixture on a temperature-controlled VERSAmax tuneable microplate reader (Molecular 2
Devices Corporation, Sunnyvale, CA, USA) at 25C. PO activity was expressed as the 3
change in absorbance over the first 10 minutes, which is during the linear phase of the 4
reaction. 5
6
Protein assay 7
Protein was measured using the BioRad protein assay kit with BSA as the protein standard. 8
Two replicates of 5 l of the haemolymph/PBS mixtures were used to measure the protein in 9
each sample. Absorption was measured on a temperature-controlled VERSAmax tuneable 10
microplate reader (Molecular Devices Corporation, Sunnyvale, CA, USA) at 600 nm. 11
12
Lysozyme-like antibacterial activity 13
Lytic activity against the bacterium, Micrococcus lysodeikticus (Sigma) was determined 14
using a lytic zone assay. Agar plates containing 12 ml of 1 % agar with 5 mg per ml freeze-15
dried M. lysodeikticus were prepared as described in Kurtz et al (2000). For each plate, 20 16
holes with a diameter of 2 mm were punched in the agar and 1 l of haemolymph was placed 17
in each well, two replicates per sample. The plates were incubated at 33ºC for 18 hours then 18
photographed using a Polaroid DMC digital camera and the diameter of the clear zones 19
calculated using Image Pro Plus software (Media Cybernetics, Silver spring, MD, USA). 20
11
Standard curves were obtained using a serial dilution of hen egg white lysozyme (BDF). 1
Concentration of “hen egg white lysozyme equivalents” was then calculated. 2
3
Life history traits 4
Life history data were collected from larvae during generations 12 and 16. In generation 12, 5
pupation date, pupal weight, emergence date and sex were recorded for each individual. 6
However, these individuals had been wounded and had lost blood during haemolymph 7
sampling which may have affected subsequent life history measurements. Therefore, the 8
same life-history data were collected from non-sampled individuals during generation 16. 9
10
Statistical analyses 11
The realized heritability for cuticular melanism was calculated for each line by plotting the 12
mean colour score for each generation against the cumulative selection differential. The 13
expected selection differential was calculated as the deviation of the mean cuticular colour of 14
the selected individuals in each generation from the population mean before selection. This 15
was then summed each generation to give the cumulative selection differential. The realised 16
heritability (h2) was then calculated from the slope of the regression of mean colour score (R) 17
against the cumulative selection differential (S), as h2 = R/S (Falconer & Mackay 1996). 18
The effects of selection on the immune function traits, haemolymph protein levels, larval 19
weight and life history traits were analysed using REML mixed models in Genstat 10. 20
Selection experiment data are typically analysed either by comparing line means (e.g. 21
12
Armitage & Siva-Jothy 2005; Schwarzenbach & Ward 2006), or by using an ANOVA/ 1
REML approach including selection lines and replicates as factors in the model (eg (Evans et 2
al. 2006; Vermeulen & Bijlsma 2006; McKean & Nunney 2008). Whilst both approaches are 3
valid, we chose to use a REML-based analysis so that we could look at additional sex and 4
condition effects on immune function and life history traits. Replicate was included as a 5
random effect with Line, Sex and Line-nested-within-Replicate included as fixed effects. For 6
the immune function and protein traits, two sets of models were examined, either with 7
Weight included as a covariate or without to account for the effects of condition on immune 8
function investment. For all models, if there was a significant effect of Line nested within 9
Replicate, data were analysed for each replicate separately. To examine correlations between 10
the measured traits, Pearson’s correlation coefficients were calculated using S-Plus 7. 11
12
Results 13
Response to selection and realised heritability of cuticular melanism 14
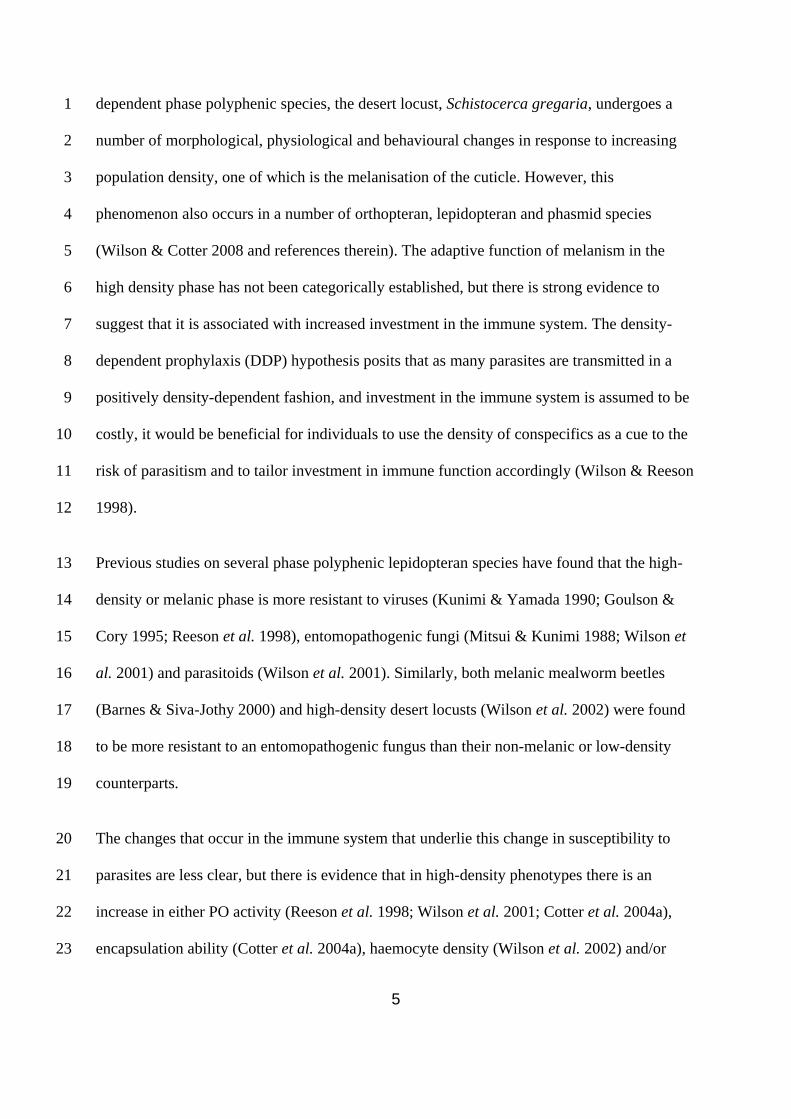
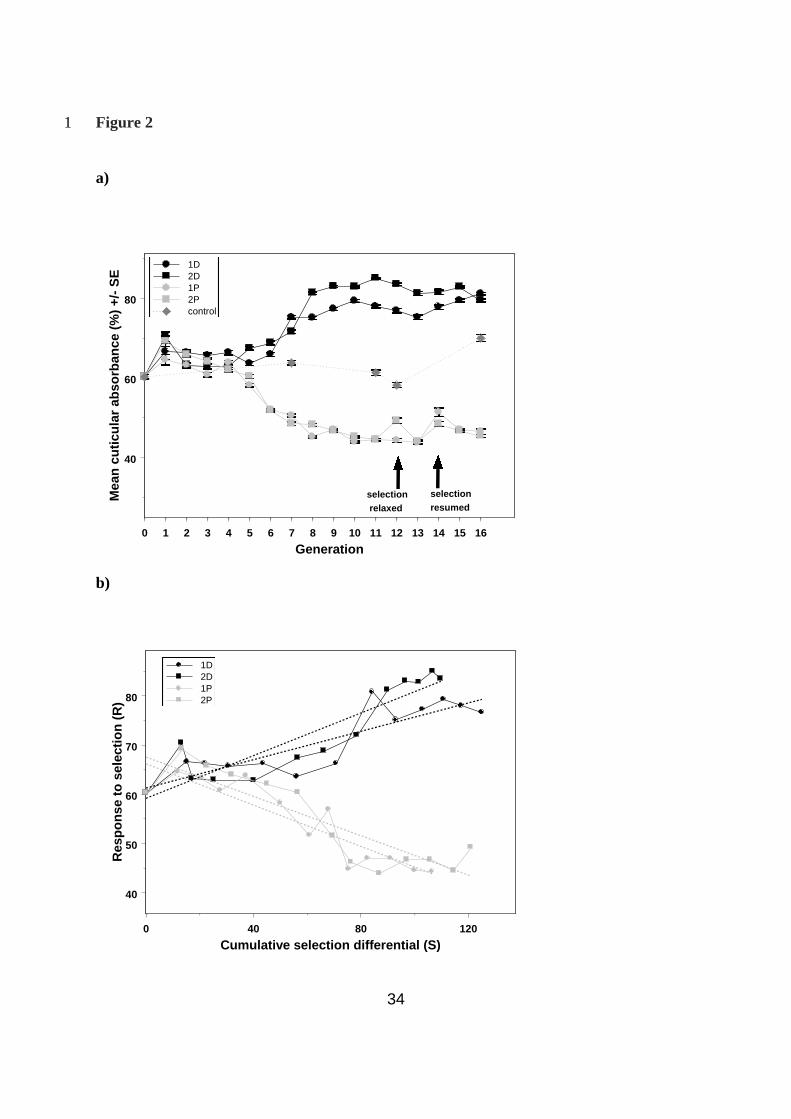
For the first four generations of selection, the response in cuticular colour was minimal. The 15
two pale lines did seem to get steadily paler, albeit at a very slow rate, but the dark lines 16
showed no obvious response to selection (Fig. 2a). After generation 5, the selection 17
differential was increased from 25% to 20%, which seemed to result in a much greater 18
response in all four of the selected lines (Fig. 2a). Relaxation of selection at generation 12 19
resulted in the mean colour of all lines starting to slip back towards the controls, suggesting 20
that both paleness and darkness are in some way costly to maintain. 21
13
The regression of cumulative selection differential on response was highly significant for 1
each of the lines (1D, slope + SE = 0.14 + 0.02, F1,11 = 33.97, P <0.001; 2D, slope + SE = 2
0.22 + 0.03, F1,11 = 51.69, P <0.001; 1P, slope + SE = 0.21 + 0.03, F1,11 = 51.44, P <0.001; 3
2P, slope + SE = 0.20 + 0.03, F1,11 = 35.71, P <0.001; Fig. 2b) giving heritability estimates 4
(h2 + SE) for cuticular melanism in each of the lines as 0.14 + 0.02 (1D), 0.22 + 0.03 (2D), 5
0.21 + 0.03 (1P) and 0.20 + 0.03 (2P). 6
7
Effect of selection on condition and immune function traits 8
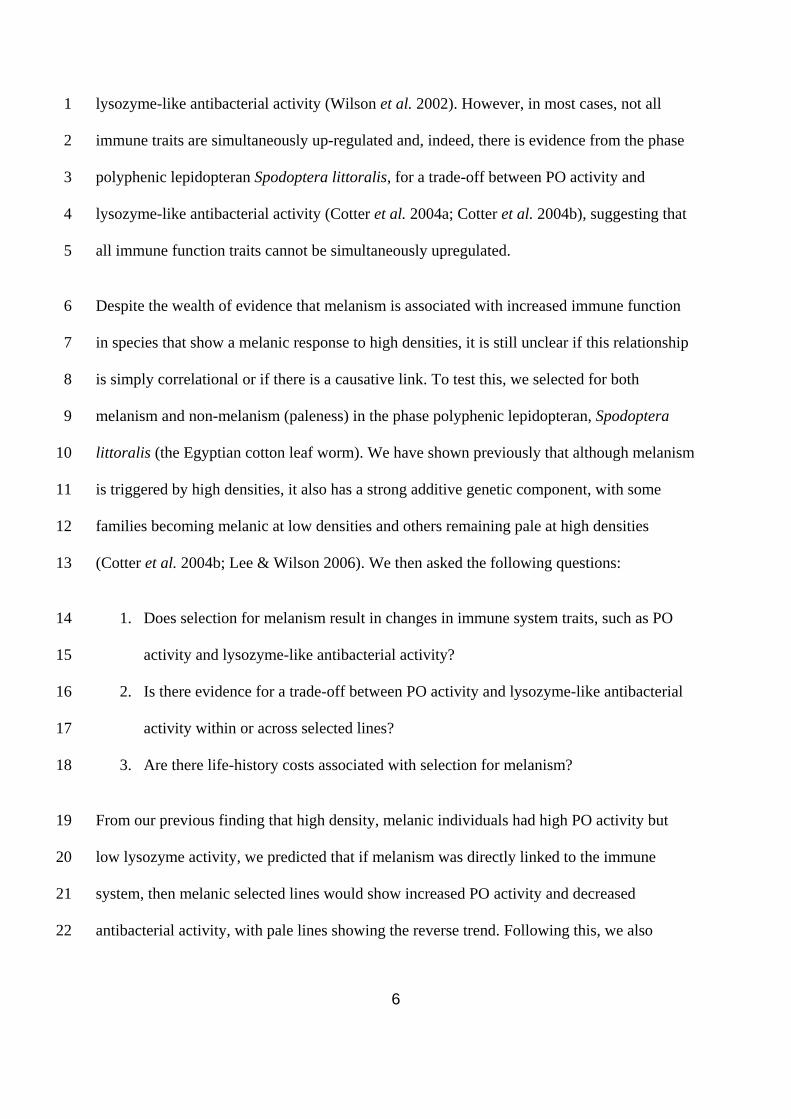
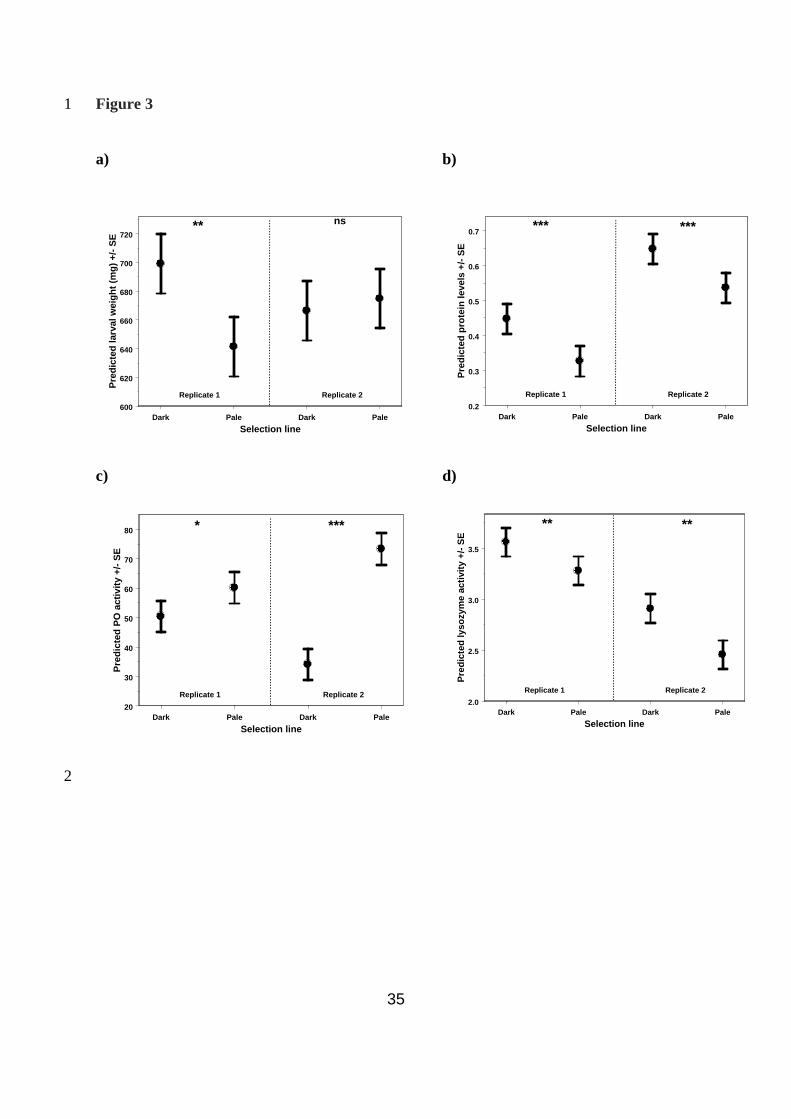
Larval weight: Selection for cuticular melanism had a significant effect on larval weight. 9
There was a significant replicate by line interaction (Wald statistic χ2
2 = 8.10, P = 0.019); 10
when analysed separately, dark lines were heavier than pale lines in replicate 1 only (replicate 11
1: Wald statistic χ2
1 = 9.18, P = 0.003; replicate 2: Wald statistic χ2
1 = 0.34, P = 0.562, Fig. 12
3a). 13
Haemolymph protein levels: Selection for cuticular melanism had a significant effect on 14
protein levels in the haemolymph. Dark lines had significantly higher haemolymph protein 15
levels than pale lines (Wald statistic χ2
1 = 14.37, P < 0.001, Fig 3b). There was no interaction 16
between replicate and line and so the term was removed from the model (Wald statistic χ2
2 = 17
0.62, P = 0.734). There was a significant positive effect of larval weight on protein levels 18
(Wald statistic χ21 = 26.61, P < 0.001), but again the inclusion of larval weight in the model 19
did not change the trends but the difference between the lines was reduced (Wald statistic χ21 20
= 11.31, P < 0.001). 21
14
Female larvae had significantly higher protein levels than male larvae, both with the inclusion 1
of weight in the model (Wald statistic χ2
1 = 16.92, P < 0.001) and without it (Wald statistic 2
χ2
1 = 21.24, P < 0.001). 3
Phenoloxidase activity: Selection for cuticular melanism had a significant effect on PO 4
activity in the haemolymph. Pale lines had significantly higher PO activity than dark lines 5
(Wald statistic χ21 = 41.92, P < 0.001). Although, there was a significant replicate by line 6
interaction (Wald statistic χ2
2 = 15.04, P < 0.001), when analysed separately, pale lines had 7
higher PO activity than dark lines in both replicates, but the effect was much more 8
pronounced in replicate 2 (replicate 1: Wald statistic χ2
1 = 3.92, P = 0.047; replicate 2: Wald 9
statistic χ2
1 = 49.11, P < 0.001, Fig. 3c) 10
There was a significant negative effect of larval weight on PO activity (Wald statistic χ2
1 = 11
13.23, P < 0.001). The inclusion of larval weight in the model did not change the trends but 12
the difference between the lines was reduced. The interaction between replicate and line was 13
still significant (Wald statistic χ2
2 = 19.72, P < 0.001). In replicate 2, pale larvae had higher 14
PO activity than dark larvae (Wald statistic χ2
1 = 51.19, P < 0.001), but in replicate 1 the 15
inclusion of weight in the model made the difference between the lines non-significant (Wald 16
statistic χ2
1 = 1.41, P = 0.237). 17
Female larvae had significantly higher PO activity than male larvae both with the inclusion of 18
weight in the model (Wald statistic χ2
1 = 7.33, P = 0.007), and without it (Wald statistic χ21 = 19
4.74, P = 0.03). 20
21
15
Lysozyme activity: Selection for cuticular melanism also had a significant effect on lysozyme-1
like antibacterial activity in the haemolymph. There was no interaction between replicate and 2
line and so the term was removed from the model (Wald statistic χ2
2 = 4.36, P = 0.113). Dark 3
lines had significantly higher lysozyme activity than pale lines (Wald statistic χ2
1 = 7.89, P = 4
0.005, Fig 3d). There was also a significant positive effect of larval weight on lysozyme 5
activity (Wald statistic χ21 = 6.52, P = 0.011). As for PO activity, the inclusion of larval 6
weight in the model did not change the trends but the difference between the lines was 7
reduced (Wald statistic χ2
1 = 6.67, P = 0.01). 8
Female larvae had significantly higher lysozyme activity than male larvae, both with the 9
inclusion of weight in the model (Wald statistic χ2
1 = 5.60, P = 0.018) and without it (Wald 10
statistic χ2
1 = 6.68, P = 0.01). 11
12
Effect of selection on life history traits 13
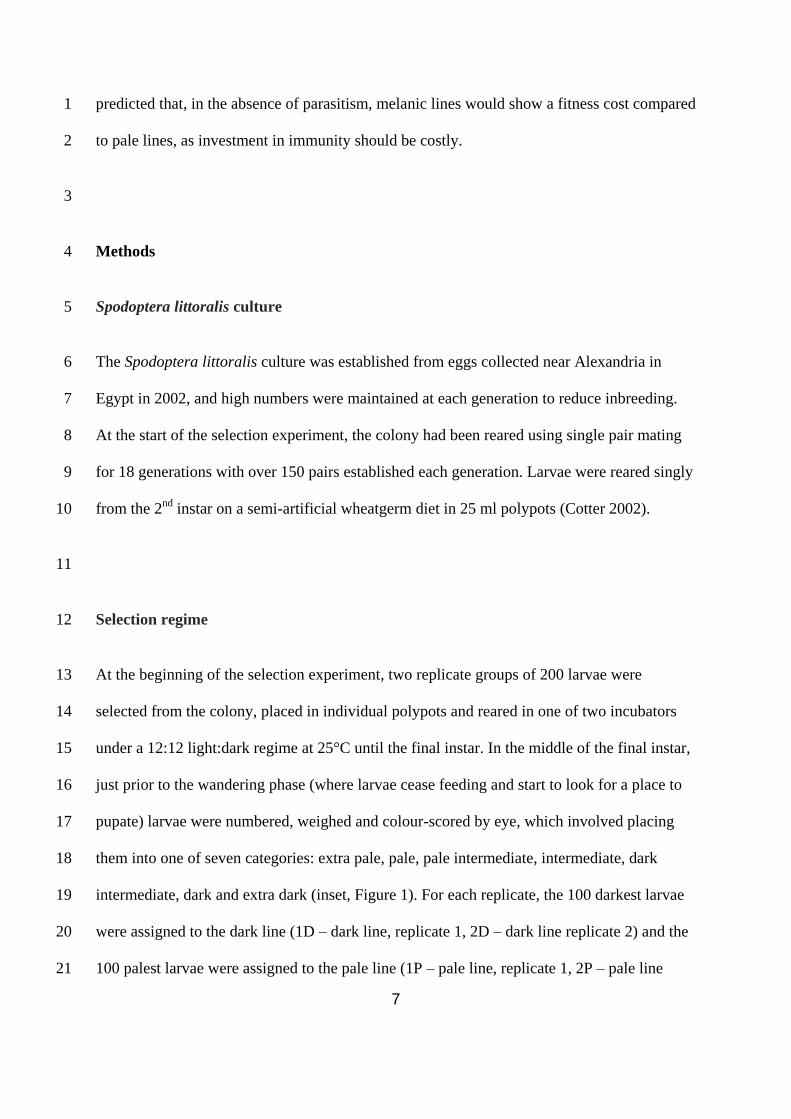
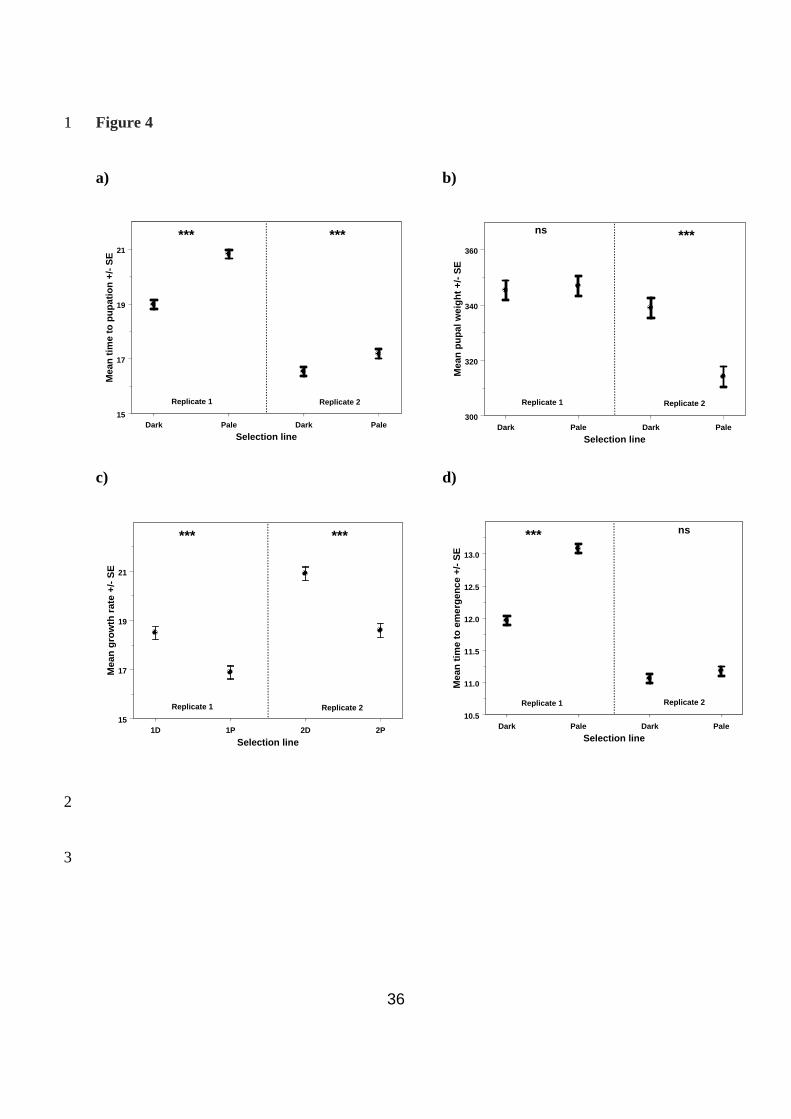
Time to pupation: Selection for cuticular melanism had a significant effect on the time spent 14
in the larval stage from egg hatching to pupation (Wald statistic χ2
1 = 117.66, P < 0.001). The 15
interaction between replicate and line was significant (Wald statistic χ2
2 = 26.77, P < 0.001), 16
but in both replicates pale larvae took longer to pupate than dark larvae (replicate 1: Wald 17
statistic χ2
1 = 114.84, P < 0.001; replicate 2: Wald statistic χ21= 17.37, P < 0.001, Fig. 4a). 18
Sex was also significant, with females taking slightly longer to pupate than males (females 19
18.65 + 0.12, males 18.10 + 0.12 days; Wald statistic χ2
1 = 21.33, P < 0.001). 20
21
16
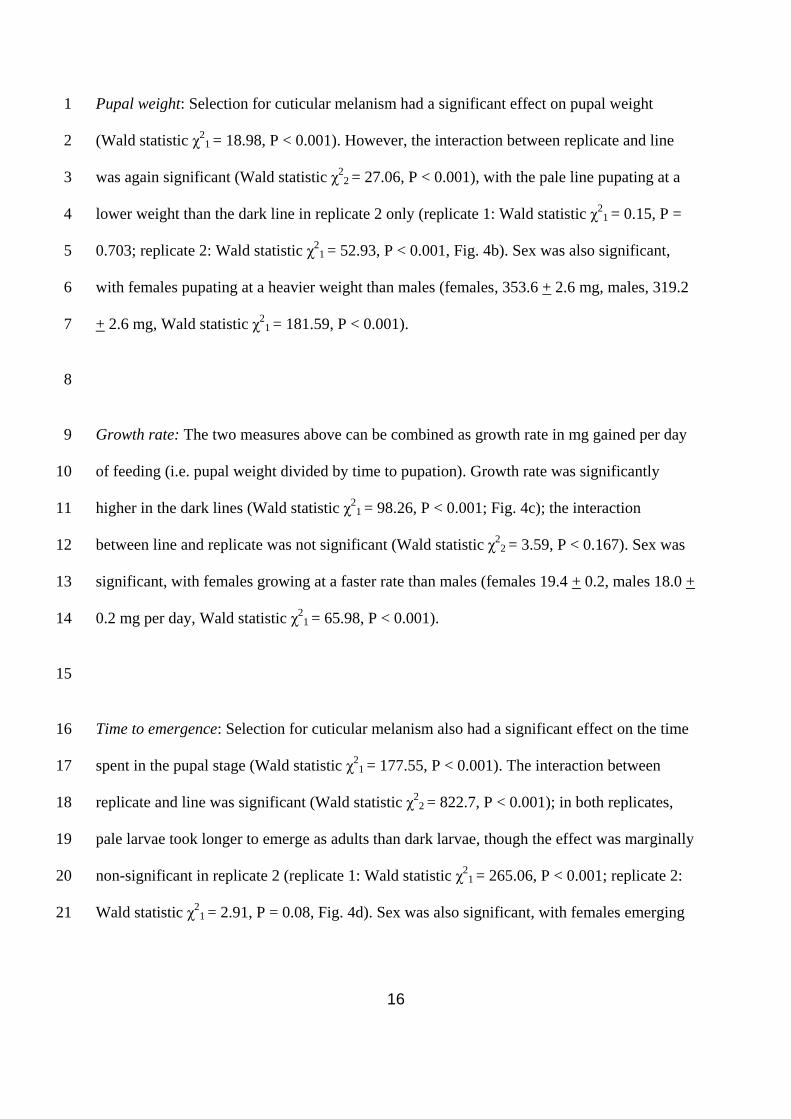
Pupal weight: Selection for cuticular melanism had a significant effect on pupal weight 1
(Wald statistic χ21 = 18.98, P < 0.001). However, the interaction between replicate and line 2
was again significant (Wald statistic χ2
2 = 27.06, P < 0.001), with the pale line pupating at a 3
lower weight than the dark line in replicate 2 only (replicate 1: Wald statistic χ2
1 = 0.15, P = 4
0.703; replicate 2: Wald statistic χ2
1 = 52.93, P < 0.001, Fig. 4b). Sex was also significant, 5
with females pupating at a heavier weight than males (females, 353.6 + 2.6 mg, males, 319.2 6
+ 2.6 mg, Wald statistic χ2
1 = 181.59, P < 0.001). 7
8
Growth rate: The two measures above can be combined as growth rate in mg gained per day 9
of feeding (i.e. pupal weight divided by time to pupation). Growth rate was significantly 10
higher in the dark lines (Wald statistic χ2
1 = 98.26, P < 0.001; Fig. 4c); the interaction 11
between line and replicate was not significant (Wald statistic χ2
2 = 3.59, P < 0.167). Sex was 12
significant, with females growing at a faster rate than males (females 19.4 + 0.2, males 18.0 + 13
0.2 mg per day, Wald statistic χ2
1 = 65.98, P < 0.001). 14
15
Time to emergence: Selection for cuticular melanism also had a significant effect on the time 16
spent in the pupal stage (Wald statistic χ2
1 = 177.55, P < 0.001). The interaction between 17
replicate and line was significant (Wald statistic χ2
2 = 822.7, P < 0.001); in both replicates, 18
pale larvae took longer to emerge as adults than dark larvae, though the effect was marginally 19
non-significant in replicate 2 (replicate 1: Wald statistic χ2
1 = 265.06, P < 0.001; replicate 2: 20
Wald statistic χ2
1 = 2.91, P = 0.08, Fig. 4d). Sex was also significant, with females emerging 21
17
more than a day earlier than males (females: 11.13 + 0.05; males: 12.51 + 0.05 days; Wald 1
statistic χ2
1 = 726.01, P < 0.001). 2
3
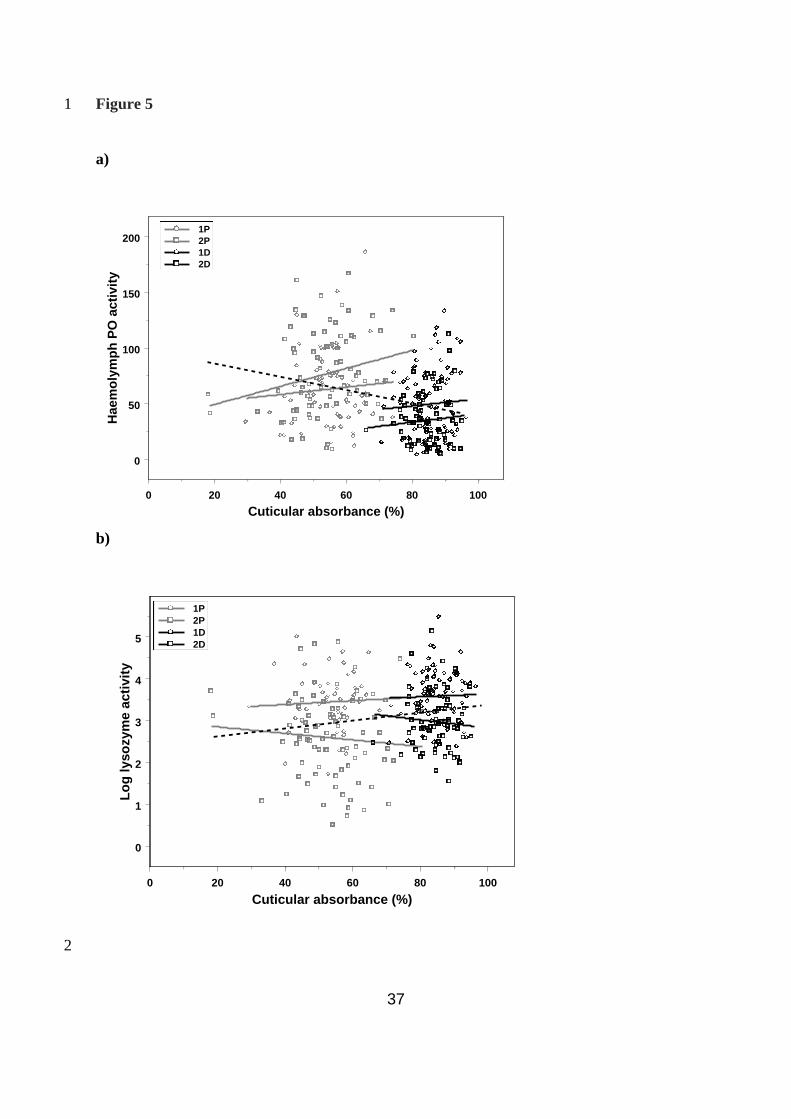
Relationship between cuticular melanism and immunity within and across lines 4
Melanism and haemolymph PO: Previous work on this species has shown positive 5
correlations between haemolymph PO activity and cuticular melanism, which led us to 6
predict that selection for melanism would result in increased levels of haemolymph PO 7
activity. As we have shown the opposite result here, we examined the relationship both 8
within and across lines to understand better the effects of selection on these traits. Using a 9
mixed-model analysis, as before but including melanism (i.e. larval cuticular absorbance) as a 10
covariate in the model, there was again a significant interaction between replicate and line 11
(Wald statistic χ22 = 15.75, P < 0.001). However, in both replicates, with line included in the 12
model, there was a significant positive effect of larval melanism on PO activity (replicate 1: 13
Wald statistic χ2
1 = 3.77, P = 0.05; replicate 2: Wald statistic χ2
1 = 6.18, P = 0.014), whilst 14
across all data the relationship was negative (r = -0.31, t303 = -5.56, P <0.001; Fig. 5a). 15
Melanism and lysozyme: Although the overall correlation between melanism and lysozyme-16
like antibacterial activity was positive, (r = 0.18, t282 = 3.08, P = 0.002; Fig. 5b), there was no 17
significant relationship between melanism and lysozyme activity within lines (Wald statistic 18
χ2
1 = 0.27, P = 0.606). 19
20
Discussion 21
18
Selection for both increased and decreased levels of cuticular melanism was successful, with 1
significant divergence between the lines occurring by the fifth generation. The realised 2
heritability estimates ranged from 0.14 to 0.22, which is slightly lower than previous 3
estimates obtained for this species using sib-analysis (0.36 + 0.08; Cotter et al. 2004b) and 4
parent-offspring regression (0.18 - 0.30; Lee & Wilson 2006). Nonetheless, it confirms the 5
finding that variation in melanism in this species has both additive genetic and environmental 6
components. We then considered whether melanism was directly related to immune function 7
by examining immune traits in the selected lines. We found that there was a causative 8
relationship between melanism and immunity, as selection for both paleness and darkness 9
resulted in a correlated response to selection in both PO activity and lysozyme-like 10
antibacterial activity. In addition, we found that there were life-history costs associated with 11
melanism (and investment in PO activity), as decreased melanism (and high PO activity) 12
were correlated with a slower development time, lower growth rate and slower time to adult 13
emergence. 14
Due to the physiological relationship between PO activity and melanin (Cotter et al. 2004a), 15
we predicted that selection for melanism would result in increased haemolymph PO activity. 16
Contrary to our prediction, we found that haemolymph PO activity was higher in the pale-17
selected lines. As before, we found that the correlation between PO activity and melanism 18
was positive within lines, but across lines the correlation was negative. This pattern is typical 19
of a situation where variation in resource acquisition is greater than variation in resource 20
allocation (van Noordwijk & de Jong 1986), and so generates positive phenotypic 21
correlations between traits; individuals with higher levels of resources can afford to invest in 22
both haemolymph PO and cuticular melanism, whereas those with fewer resources have 23
19
lower levels of both. Only when we consider the relationship across selected lines is the 1
trade-off between the two traits (melanism and PO activity) revealed. 2
The mechanism driving this trade-off is unclear, however one possibility is a trade-off 3
between the manufacture of granular and haemolymph PO. Granular PO, which is 4
biochemically distinct from haemolymph PO, is synthesised in the epidermis and transported 5
to the cuticle, and has been shown to be responsible for cuticular melanisation in the tobacco 6
hornworm, Manduca sexta (Hiruma & Riddiford 1988). It is possible that the requirement for 7
large amounts of granular PO in the dark-selected lines results in a shortage of the necessary 8
amino acids or copper required for the manufacture of haemolymph PO. A previous study 9
with mealworm beetles found that selection for melanism resulted in increased haemolymph 10
PO activity, suggesting that the mechanisms controlling cuticular melanism may be different 11
in the two species (Armitage & Siva-Jothy 2005). 12
We also predicted that pale lines would have increased lysozyme activity due to the negative 13
genetic and phenotypic correlations previously found between lysozyme and PO activity in 14
this species (Cotter et al. 2004a; Cotter et al. 2004b). In fact, lysozyme activity was higher in 15
the dark lines. However, this pattern of PO activity levels being higher and lysozyme activity 16
levels being lower in the pale lines than in the dark lines, concurs with our previous finding 17
of a genetic trade-off between these two traits (Cotter et al. 2004b). 18
Protein levels in the haemolymph could be considered as a measure of condition (Cotter et al. 19
2004a; Cotter et al. 2008), and have also been shown to be correlated with resistance to 20
bacterial infection in crickets (Adamo 2004). Haemolymph protein levels followed the same 21
pattern as lysozyme activity, being higher in the dark than the pale selected lines. This 22
suggests that dark larvae are in better condition than pale larvae, and that, in conjunction with 23
20
the lysozyme levels, they would be better able to resist bacterial infection. However, 1
condition alone cannot account for the differences in immune function, as inclusion of weight 2
in the models had no effect on the observed patterns, with the exception of PO levels in 3
replicate 1, where the difference between the lines became marginally non-significant. 4
Selection for cuticular melanism also revealed life-history trade-offs, with pale larvae taking 5
longer to pupate, having a slower growth rate and taking longer to emerge as adults than dark 6
larvae. Larval and pupal weight were lower in pale larvae in one replicate only, it is possible 7
therefore that this difference was simply due to drift. Our prediction was that dark lines 8
would pay this life-history cost, as we assumed that it would be that dark larvae that invested 9
more heavily in haemolymph PO activity. However, the results do confirm the prediction that 10
investment in haemolymph PO activity carries life-history costs. There are several 11
possibilities for the nature of these costs; as PO is manufactured in haemocytes, investment in 12
PO activity might require the production of additional haemocytes, which would require 13
additional resources. Another possibility is that, due the cytotoxic nature of the intermediates 14
produced during PO activation, it is necessary to store PO in its inactive form, proPO, which 15
is maintained by proteinase inhibitors (Nappi & Vass 1993; Cerenius & Soderhall 2004). 16
Investment in high levels of both PO and these proteinase inhibitors could be costly in terms 17
of protein resources, which would otherwise be used for growth. It is worth noting that 18
without the PO data, it may appear that selection for and against melanism had simply 19
resulted in high- and low-quality lines respectively; i.e., that melanic larvae were equivalent 20
to Spitze’s “superfleas” (Spitze 1991; Reznick et al. 2000). Our results therefore emphasise 21
the importance of measuring multiple traits when looking for fitness costs (Reznick et al. 22
2000). 23
21
In addition, it is worth noting that whilst larvae weren’t subject to predation in the lab, 1
melanic lines may experience predation costs in the field. Armyworms typically feed on 2
green foliage and highly melanic individuals would suffer increased conspicuousness against 3
this background. Previous studies have shown that conspicuous melanic colouration can 4
increase the risk of predation in the field (but see Wilson 2000). For example, Svensson & 5
Friberg (Svensson & Friberg 2007) found evidence for selection on melanic wing patch 6
colour and size in Calopteryx spp. that had been subject to predation by birds, and melanic 7
Daphnia morphs of were shown to be subject to greater predation by trout than transparent 8
morphs (Saegrov et al. 1996). Increased activity levels previously reported in melanic larvae 9
may also increase their risk of predation (Hodjat, 1970). Furthermore, increased activity and 10
melanism are both associated with increased dopamine levels in Drosophila, the metabolism 11
of which is a major source of reactive oxygen species, thought to contribute to early 12
senescence (Vermeulen & Bijlsma 2006). Indeed, a recent study in yellow dung flies found 13
that lines selected for high PO levels showed reduced longevity under starvation conditions, 14
possibly due to a concomitant increase in the PO substrate dopamine ((Schwarzenbach & 15
Ward 2006). A further examination of these potential costs is an interesting area for future 16
research. 17
An interesting additional finding was that, relative to males, females had higher levels of both 18
PO and lysozyme activity, higher protein levels, faster growth rate and heavier pupal weight. 19
This mirrors results from other insect species showing that females tend to invest more 20
heavily in the immune system than males, possibly due to higher reproductive success being 21
attained through longevity in females than males ((Rolff 2002), and references therein). 22
22
In conclusion, it appears that larval melanism is causally linked to immune function 1
investment in this species but, contrary to our expectation, that PO in the haemolymph is 2
traded-off against melanin in the cuticle, though the mechanism behind this trade-off is 3
currently unknown. Selection for melanism confirms the trade-off within the immune system 4
previously reported from this species ( Cotter et al. 2004a; Cotter et al. 2004b), and also 5
identified in other insect species based on negative phenotypic correlations between PO and 6
lysozyme activity (Moret & Schmid-Hempel 2001; Moret & Siva-Jothy 2003; Rantala & 7
Kortet 2003). Indeed, a recent study using Trichoplusia ni larvae found that the inclusion of 8
non-pathogenic bacteria in the diet resulted in the up-regulation of lysozyme activity, but a 9
down-regulation of PO activity (Freitak et al. 2007). Furthermore, examination of gene 10
expression in the midguts of these larvae found that several antibacterial genes were up-11
regulated, including lysozyme, but that PO inhibiting enzyme was also up-regulated, which 12
presumably accounted for the reduction in haemolymph PO levels. Thus, there is growing 13
evidence that this potential trade-off may occur across several insect taxa. 14
Selection also revealed life-history trade-offs that were not apparent when examining genetic 15
correlations between traits (Cotter et al. 2004b). Melanism occurs in this species in response 16
to population density and is associated with parasite resistance (Wilson et al. 2001), its 17
facultative expression suggesting that it is costly. In this study, we have shown that rather 18
than melanism itself, it is investment in PO and haemolymph protein that is costly, resulting 19
in a slower growth rate and later emergence. There is evidence from this species that larvae in 20
the high-density, gregarious phenotype forage on different host plants to those exhibiting the 21
solitarious phenotype (Simmonds & Blaney 1986). It is possible, therefore, that by 22
preferentially feeding on protein-rich plants, the high-density larvae may be able to 23
23
ameliorate these costs (Lee et al. 2006). Future studies examining the role of diet in the 1
modulation of the costs of the immune response would be informative. 2
3
Acknowledgements 4
We would like to thank Kwang Pum Lee for assistance at the beginning of the project and 5
Esmat Hegazi for supplying the larvae used to establish the colony. 6
7
24
References 1
Adamo, S. A. 2004. Estimating disease resistance in insects: phenoloxidase and lysozyme-2
like activity and disease resistance in the cricket, Gryllus texensis. J. Insect Physiol. 3
50: 209-216. 4
Armitage, S. A. O. & Siva-Jothy, M. T. 2005. Immune function responds to selection for 5
cuticular colour in Tenebrio molitor. Heredity 94: 650-656. 6
Ashida, M. & Brey, P. T. 1995. Role of the integument in insect defense - prophenoloxidase 7
cascade in the cuticular matrix. Proc. Natl. Acad. Sci. U. S. A. 92: 10698-10702. 8
Ashida, M. & Brey, P. T. 1997. Recent advances in research on the insect prophenoloxidase 9
cascade. In: Molecular mechanisms of immune responses in insects (P.T. Brey & D. 10
Hultmark, eds). pp. 135-172. Chapman and Hall, London. 11
Barnes, A. I. & Siva-Jothy, M. T. 2000. Density-dependent prophylaxis in the mealworm 12
beetle Tenebrio molitor L (Coleoptera: Tenebrionidae): cuticular melanization is an 13
indicator of investment in immunity. Proc. R. Soc. Lond. Ser. B-Biol. Sci. 267: 177-14
182. 15
Bezzerides, A. L., McGraw, K. J., Parker, R. S. & Husseini, J. 2007. Elytra color as a signal 16
of chemical defense in the Asian ladybird beetle Harmonia axyridis. Behav. Ecol. 17
Sociobiol. 61: 1401-1408. 18
Cerenius, L. & Soderhall, K. 2004. The prophenoloxidase-activating system in invertebrates. 19
Immunol. Rev. 198: 116-126. 20
Cotter, S. C. 2002. Trade-offs in insect disease resistance. PhD Thesis, Institute of Biological 21
Sciences. University of Stirling. 22
25
Cotter, S. C., Beveridge, M. & Simmons, L. W. 2008. Male morph predicts investment in 1
larval immune function in the dung beetle, Onthophagus taurus. Behav. Ecol. 19: 2
331-337. 3
Cotter, S. C., Hails, R. S., Cory, J. S. & Wilson, K. 2004a. Density-dependent prophylaxis 4
and condition-dependent immune function in Lepidopteran larvae: a multivariate 5
approach. J. Anim. Ecol. 73: 283-293. 6
Cotter, S. C., Kruuk, L. E. B. & Wilson, K. 2004b. Costs of resistance: genetic correlations 7
and potential trade-offs in an insect immune system. J. Evol. Biol. 17: 421-429. 8
Cotter, S. C. & Wilson, K. 2002. Heritability of immune function in the caterpillar 9
Spodoptera littoralis. Heredity 88: 229-234. 10
Evans M.R., Roberts M.L., Buchanan K.L. & Goldsmith A.R. 2006. Heritability of 11
corticosterone response and changes in life history traits during selection in the zebra 12
finch. J.Evol. Biol., 19: 343-352 13
Falconer, D. S. & Mackay, T. F. C. 1996. Introduction to Quantitative Genetics, 4th ed. 14
Longman Group Ltd. 15
Freitak, D., Wheat, C. W., Heckel, D. G. & Vogel, H. 2007. Immune system responses and 16
fitness costs associated with consumption of bacteria in larvae of Trichoplusia ni. 17
BMC Biol. 5. 18
Goulson, D. & Cory, J. S. 1995. Responses of Mamestra brassicae (Lepidoptera, Noctuidae) 19
to crowding - interactions with disease resistance, color phase and growth. Oecologia 20
104: 416-423. 21
Griffith, S. C., Parker, T. H. & Olson, V. A. 2006. Melanin- versus carotenoid-based sexual 22
signals: is the difference really so black and red? Anim. Behav. 71: 749-763. 23
26
Hiruma, K. & Riddiford, L. M. 1988. Granular phenoloxidase involved in cuticular 1
melanisation in the tobacco hornworm: regulation of its synthesis in the epidermis by 2
juvenile hormone. Dev. Biol. 130: 87-97. 3
Hoekstra, H. E. & Nachman, M. W. 2003. Different genes underlie adaptive melanism in 4
different populations of rock pocket mice. Mol. Ecol. 12: 1185-1194. 5
Jarvi, T. & Bakken, M. 1984. The function of the variation in the breast stripe of the great tit 6
(Parus major). Anim. Behav. 32: 590-596. 7
Kauppinen, J. & Mappes, J. 2003. Why are wasps so intimidating: field experiments on 8
hunting dragonflies (Odonata: Aeshna grandis). Anim. Behav. 66: 505-511. 9
Kettlewell, H. B. D. 1973. The Evolution of Melanism. Clarendon Press, Oxford. 10
Kose, M. & Møller, A. P. 1999. Sexual selection, feather breakage and parasites: the 11
importance of white spots in the tail of the barn swallow (Hirundo rustica). Behav. 12
Ecol. Sociobiol. 45: 430-436. 13
Kunimi, Y. & Yamada, E. 1990. Relationship of larval phase and susceptibility of the 14
armyworm, Pseudaletia separata Walker (Lepidoptera, Noctuidae) to a nuclear 15
polyhedrosis virus and a granulosis virus. Appl. Entomol. Zoolog. 25: 289-297. 16
Kurtz, J., Wiesner, A., Gotz, P. & Sauer, K. P. 2000. Gender differences and individual 17
variation in the immune system of the scorpionfly Panorpa vulgaris (Insecta: 18
Mecoptera). Dev. Comp. Immunol. 24: 1-12. 19
Lee, K. P., Cory, J. S., Wilson, K., Raubenheimer, D. & Simpson, S. J. 2006. Flexible diet 20
choice offsets protein costs of pathogen resistance in a caterpillar. Proc. R. Soc. Lond. 21
Ser. B-Biol. Sci. 273: 823-829. 22
Lee, K. P. & Wilson, K. 2006. Melanism in a larval Lepidoptera: repeatability and heritability 23
of a dynamic trait. Ecol. Entomol. 31: 196-205. 24
27
Mackintosh, J. A. 2001. The antimicrobial properties of melanocytes, melanosomes and 1
melanin and the evolution of black skin. J. Theor. Biol. 211: 101-113. 2
Majerus, M. E. N. 1998. Melanism: Evolution in Action Oxford University Press, Oxford 3
Marmaras, V. J., Charalambidis, N. D. & Zervas, C. G. 1996. Immune response in insects: 4
The role of phenoloxidase in defense reactions in relation to melanization and 5
sclerotization. Arch. Insect Biochem. Physiol. 31: 119-133. 6
Marples, N. M., Vanveelen, W. & Brakefield, P. M. 1994. The relative importance of color, 7
taste and smell in the protection of an aposematic insect Coccinella septempunctata. 8
Anim. Behav. 48: 967-974. 9
McKean K.A. & Nunney L. 2008. Sexual selection and immune function in Drosophila 10
melanogaster. Evolution, 62: 386-400 11
Mitsui, J. & Kunimi, Y. 1988. Effect of larval phase on susceptibility of the armyworm, 12
Pseudaletia separata Walker (Lepidoptera, Noctuidae) to an entomogeneous 13
Deuteromycete, Nomuraea rileyi. Jpn. J. Appl. Entomol. Zool. 32: 129-134. 14
Moller, A. P. 1988. Badge size in the house sparrow Passer domesticus - Effects of 15
intrasexual and intersexual selection. Behav. Ecol. Sociobiol. 22: 373-378. 16
Montefiori, D. C. & Zhou, J. Y. 1991. Selective antiviral activity of synthetic soluble L-17
Tyrosine and L-Dopa melanins against human-immunodeficiency-virus in vitro. 18
Antiviral Res. 15: 11-26. 19
Moret, Y. & Schmid-Hempel, P. 2001. Entomology - Immune defence in bumble-bee 20
offspring. Nature 414: 506-506. 21
28
Moret, Y. & Siva-Jothy, M. T. 2003. Adaptive innate immunity? Responsive-mode 1
prophylaxis in the mealworm beetle, Tenebrio molitor. Proc. R. Soc. Lond. Ser. B-2
Biol. Sci. 270: 2475-2480. 3
Nappi, A. J. & Vass, E. 1993. Melanogenesis and the generation of cytotoxic molecules 4
during insect cellular immune-reactions. Pigm. Cell. Res. 6: 117-126. 5
Rantala, M. J. & Kortet, R. 2003. Courtship song and immune function in the field cricket 6
Gryllus bimaculatus. Biol. J. Linnean Soc. 79: 503-510. 7
Reeson, A. F., Wilson, K., Gunn, A., Hails, R. S. & Goulson, D. 1998. Baculovirus resistance 8
in the noctuid Spodoptera exempta is phenotypically plastic and responds to 9
population density. Proc. R. Soc. Lond. Ser. B-Biol. Sci. 265: 1787-1791. 10
Reznick, D., Nunney, L. & Tessier, A. 2000. Big houses, big cars, superfleas and the costs of 11
reproduction. Trends Ecol. Evol. 15: 421-425. 12
Rolff, J. 2002. Bateman's principle and immunity. Proc. R. Soc. Lond. Ser. B-Biol. Sci. 269: 13
867-872. 14
Rosen, R. F. & Tarvin, K. A. 2006. Sexual signals of the male American goldfinch. Ethology 15
112: 1008-1019. 16
Saegrov H., Hobaek A. & LabeeLund J.H. 1996. Vulnerability of melanic Daphnia to brown 17
trout predation. J.Plankton Res., 18: 2113-2118. 18
Schwarzenbach G.A. & Ward P.I. 2006. Responses to selection on phenoloxidase activity in 19
yellow dung flies. Evolution, 60: 1612-1621. 20
Sheldon, B. C. & Verhulst, S. 1996. Ecological immunology: costly parasite defences and 21
trade-offs in evolutionary ecology. Trends Ecol. Evol. 11: 317-321. 22
29
Simmonds, M. S. J. & Blaney, W. M. 1986. Effects of rearing density on development and 1
feeding behavior in larvae of Spodoptera exempta. J. Insect Physiol. 32: 1043-1053. 2
Siva-Jothy, M. T. 2000. A mechanistic link between parasite resistance and expression of a 3
sexually selected trait in a damselfly. Proc. R. Soc. Lond. Ser. B-Biol. Sci. 267: 2523-4
2527. 5
Söderhall, K. & Ajaxon, R. 1982. Effect of quinones and melanin on mycelial growth of 6
Aphanomyces spp and extracellular protease of Aphanomyces astaci a parasite on 7
crayfish. J. Invertebr. Pathol. 39: 105-109. 8
Spitze, K. 1991. Chaoborus predation and life-history evolution in Daphnia pulex - temporal 9
pattern of population diversity, fitness, and mean life-history. Evolution 45: 82-92. 10
St. Leger, R. J., Cooper, R. M. & Charnley, A. K. 1988. The effect of melanization of 11
Manduca sexta cuticle on growth and infection by Metarhizium anisopliae. J. 12
Invertebr. Pathol. 52: 459-470. 13
Svensson E.I. & Friberg M. 2007. Selective predation on wing morphology in sympatric 14
damselflies. Am. Nat., 170: 101-112 15
van Noordwijk, A. J. & de Jong, G. 1986. Acquisition and allocation of resources - their 16
influence on variation in life-history tactics. Am. Nat. 128: 137-142. 17
Vermeulen C.J. & Bijlsma R. 2006. Changes in genetic architecture during relaxation in 18
Drosophila melanogaster selected on divergent virgin life span. J. Evol. Biol., 19: 19
216-227 20
Wiklund, C. & Sillen-Tullberg, B. 1985. Why distasteful butterflies have aposematic larvae 21
and adults, but cryptic pupae - evidence from predation experiments on the monarch 22
and the European swallowtail. Evolution 39: 1155-1158. 23
30
Wilson, K. & Cotter, S. C. (2008) Density-dependent prophylaxis in insects. In: Insects and 1
Phenotypic Plasticity: Mechanisms and Consequences (T. N. Ananthakrishnan, & D. 2
W. Whitman, eds. pp. 137-176, Science Publishers Inc., Plymouth, UK. 3
Wilson, K., Cotter, S. C., Reeson, A. F. & Pell, J. K. 2001. Melanism and disease resistance 4
in insects. Ecol. Lett. 4: 637-649. 5
Wilson, K. & Reeson, A. F. 1998. Density-dependent prophylaxis: Evidence from 6
Lepidoptera- baculovirus interactions? Ecol. Entomol. 23: 100-101. 7
Wilson, K., Thomas, M. B., Blanford, S., Doggett, M., Simpson, S. J. & Moore, S. L. 2002. 8
Coping with crowds: Density-dependent disease resistance in desert locusts. Proc. 9
Natl. Acad. Sci. U. S. A. 99: 5471-5475. 10
Zahavi, A. 1975. Mate selection - a selection for a handicap. J. Theor. Biol. 53: 205-214. 11
12
13
14
15
16
17
31
1
Figure legends 2
3
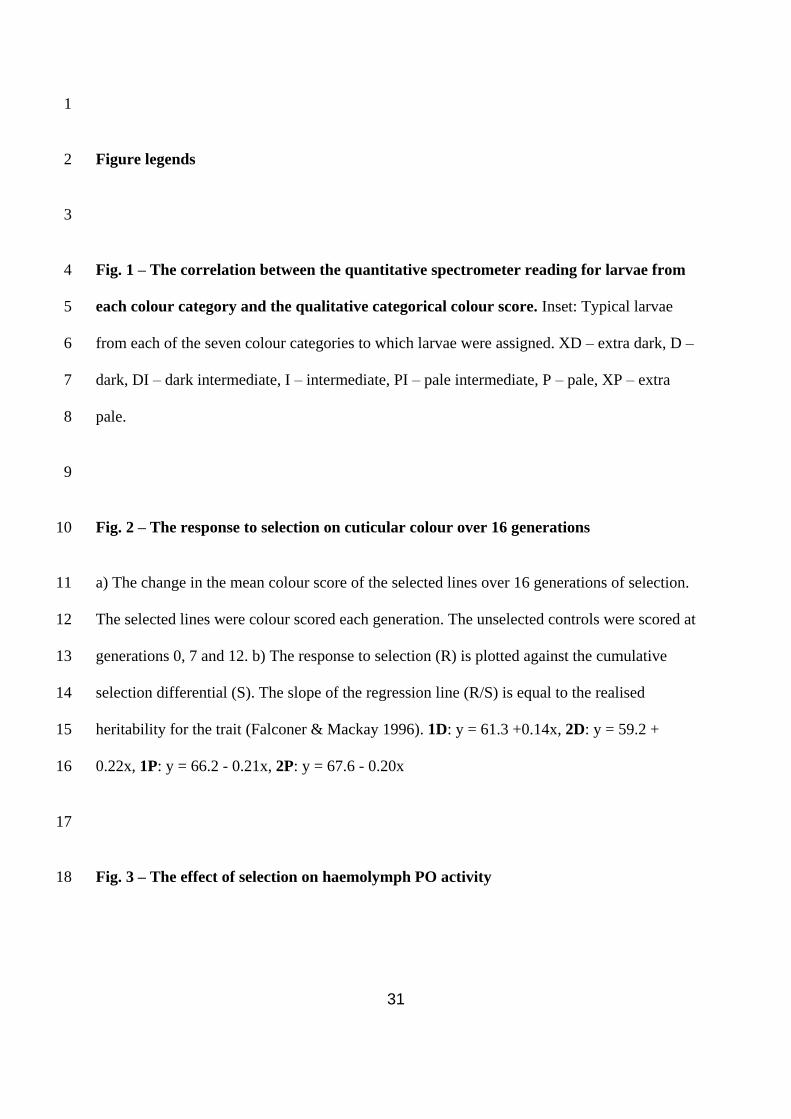
Fig. 1 – The correlation between the quantitative spectrometer reading for larvae from 4
each colour category and the qualitative categorical colour score. Inset: Typical larvae 5
from each of the seven colour categories to which larvae were assigned. XD – extra dark, D – 6
dark, DI – dark intermediate, I – intermediate, PI – pale intermediate, P – pale, XP – extra 7
pale. 8
9
Fig. 2 – The response to selection on cuticular colour over 16 generations 10
a) The change in the mean colour score of the selected lines over 16 generations of selection. 11
The selected lines were colour scored each generation. The unselected controls were scored at 12
generations 0, 7 and 12. b) The response to selection (R) is plotted against the cumulative 13
selection differential (S). The slope of the regression line (R/S) is equal to the realised 14
heritability for the trait (Falconer & Mackay 1996). 1D: y = 61.3 +0.14x, 2D: y = 59.2 + 15
0.22x, 1P: y = 66.2 - 0.21x, 2P: y = 67.6 - 0.20x 16
17
Fig. 3 – The effect of selection on haemolymph PO activity 18
32
The predicted mean values from the REML model for each of the four selected lines, without 1
larval weight included as a covariate: a) larval weight; b) haemolymph protein levels; c) 2
haemolymph PO activity; and d) lysozyme. *** P < 0.001, * P < 0.05, ns P > 0.05 3
Fig. 4 – Life history traits in the selected lines 4
The predicted mean values from the REML model for each of the four selected lines: a) time 5
to pupation in days; b) pupal weight in mg; c) growth rate in mg per day; and d) time to 6
emergence in days. Comparisons in each case were made within each replicate. *** P < 0.001, 7
ns P > 0.05 8
9
Fig. 5 – The correlation between cuticular melanisation and immune function traits. 10
a) The correlation between haemolymph PO levels and cuticular melanisation both within 11
(solid lines) and across lines (dotted line) and b) the correlation between lysozyme activity 12
and cuticular melanisation both within (solid lines) and across lines (dotted line). 13
14
33
Figures 1
Figure 1 2
XP P PI I DI D XD
Colour score by eye
40
50
60
70
80
90
Mean
cu
ticu
lar
ab
so
rban
ce (
%)
+/-
SE
3
34
Figure 2 1
a)
0 1 2 3 4 5 6 7 8 9 10 11 12 13 14 15 16
Generation
40
60
80
Mean
cu
ticu
lar
ab
so
rban
ce (
%)
+/-
SE
1D
2D
1P
2P
control
selection
relaxed
selection
resumed
b)
0 40 80 120
Cumulative selection differential (S)
40
50
60
70
80
Resp
on
se t
o s
ele
cti
on
(R
)
1D
2D
1P
2P
35
Figure 3 1
a)
Dark Pale Dark Pale
Selection line
600
620
640
660
680
700
720
Pre
dic
ted
larv
al
we
igh
t (m
g)
+/-
SE
Replicate 1 Replicate 2
** ns
b)
Dark Pale Dark Pale
Selection line
0.2
0.3
0.4
0.5
0.6
0.7
Pre
dic
ted
pro
tein
levels
+/-
SE
Replicate 1 Replicate 2
*** ***
c)
Dark Pale Dark Pale
Selection line
20
30
40
50
60
70
80
Pre
dic
ted
PO
acti
vit
y +
/- S
E
* ***
Replicate 1 Replicate 2
d)
Dark Pale Dark Pale
Selection line
2.0
2.5
3.0
3.5
Pre
dic
ted
lyso
zym
e a
cti
vit
y +
/- S
E
**
Replicate 1 Replicate 2
**
2
36
Figure 4 1
a)
Dark Pale Dark Pale
Selection line
15
17
19
21
Me
an
tim
e t
o p
up
ati
on
+/-
SE
*** ***
Replicate 1 Replicate 2
b)
Dark Pale Dark Pale
Selection line
300
320
340
360
Me
an
pu
pa
l w
eig
ht
+/-
SE
ns***
Replicate 1 Replicate 2
c)
1D 1P 2D 2P
Selection line
15
17
19
21
Me
an
gro
wth
rate
+/-
SE
*** ***
Replicate 2Replicate 1
d)
Dark Pale Dark Pale
Selection line
10.5
11.0
11.5
12.0
12.5
13.0
Me
an
tim
e t
o e
me
rgen
ce +
/- S
E
*** ns
Replicate 1 Replicate 2
2
3
37
Figure 5 1
a)
0 20 40 60 80 100
Cuticular absorbance (%)
0
50
100
150
200
Haem
oly
mp
h P
O a
cti
vit
y
1P
2P
1D
2D
b)
0 20 40 60 80 100
Cuticular absorbance (%)
0
1
2
3
4
5
Lo
g l
yso
zym
e a
cti
vit
y
1P
2P
1D
2D
2