Embed Size (px)
Citation preview

Title of the presentation2 linesLocation, Date, Author
2018Q1 Revenues
Paris – April 26th, 2018

2© Capgemini 2018. All rights reserved |2018 Q1 Revenues | April 26th, 2018
Disclaimer
This presentation may contain forward-looking statements, Such statements may include projections, estimates, assumptions,statements regarding plans, objectives, intentions and/or expectations with respect to future financial results, events, operationsand services and product development, as well as statements, regarding future performance or events. Forward-lookingstatements are generally identified by the words “expects”, “anticipates”, “believes”, “intends”, “estimates”, “plans”, “projects”,“may”, “would” “should” or the negatives of these terms and similar expressions. Although Capgemini’s management currentlybelieves that the expectations reflected in such forward-looking statements are reasonable, investors are cautioned that forward-looking statements are subject to various risks and uncertainties (including without limitation risks identified in Capgemini’sRegistration Document available on Capgemini’s website), because they relate to future events and depend on futurecircumstances that may or may not occur and may be different from those anticipated, many of which are difficult to predict andgenerally beyond the control of Capgemini. Actual results and developments may differ materially from those expressed in,implied by or projected by forward-looking statements. Forward-looking statements are not intended to and do not give anyassurances or comfort as to future events or results. Other than as required by applicable law, Capgemini does not undertake anyobligation to update or revise any forward-looking statement.
This presentation does not contain or constitute an offer of securities for sale or an invitation or inducement to invest in securitiesin France, the United States or any other jurisdiction.

3© Capgemini 2018. All rights reserved |2018 Q1 Revenues | April 26th, 2018 © 2018 Capgemini. All rights reserved.
PaulHERMELIN
4© Capgemini 2018. All rights reserved |2018 Q1 Revenues | April 26th, 2018
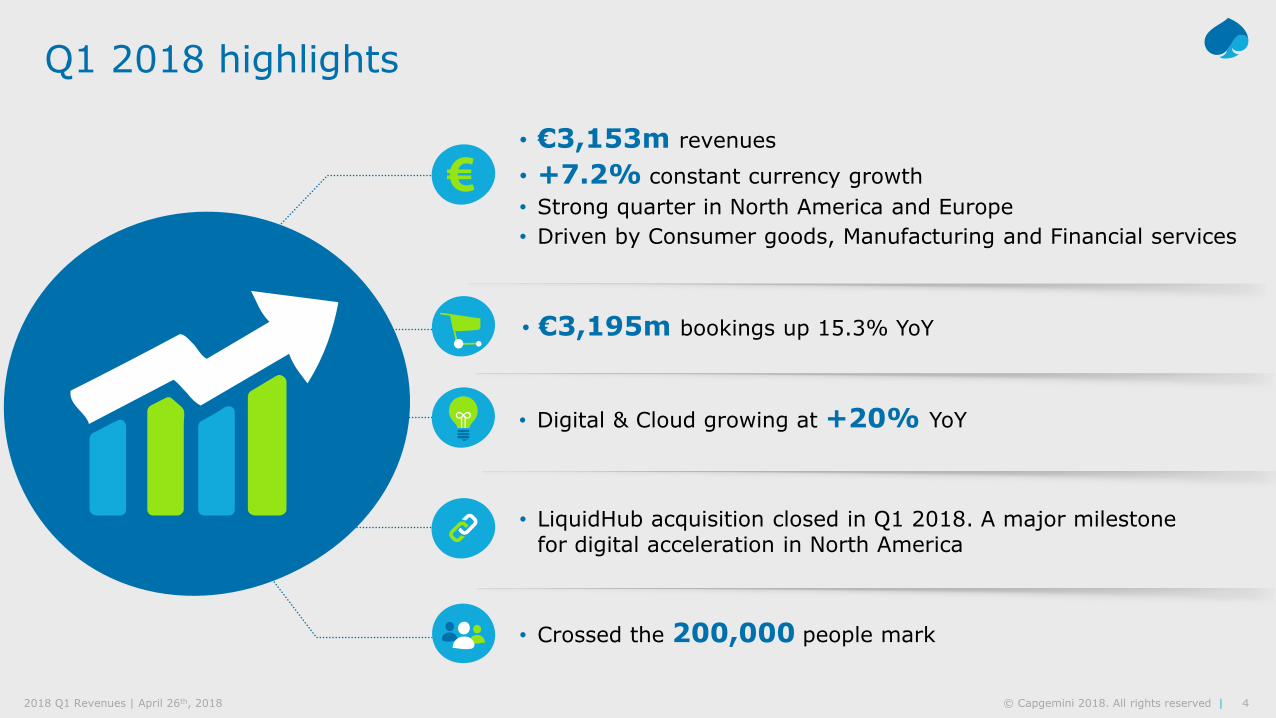
Q1 2018 highlights
• €3,153m revenues• +7.2% constant currency growth• Strong quarter in North America and Europe• Driven by Consumer goods, Manufacturing and Financial services
• €3,195m bookings up 15.3% YoY
• LiquidHub acquisition closed in Q1 2018. A major milestone for digital acceleration in North America
• Digital & Cloud growing at +20% YoY
• Crossed the 200,000 people mark
5© Capgemini 2018. All rights reserved |2018 Q1 Revenues | April 26th, 2018
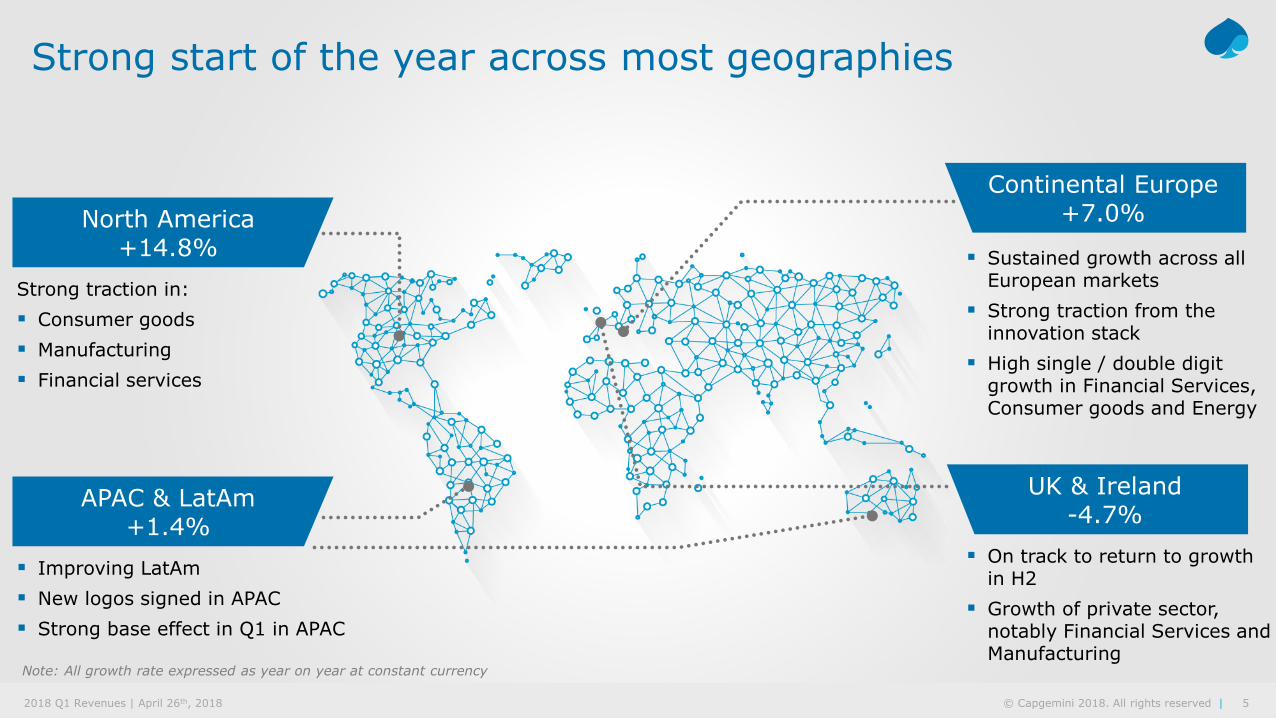
Strong start of the year across most geographies
Strong traction in: Consumer goods Manufacturing Financial services
North America+14.8%
Improving LatAm New logos signed in APAC Strong base effect in Q1 in APAC
APAC & LatAm+1.4%
Sustained growth across all European markets
Strong traction from the innovation stack
High single / double digit growth in Financial Services, Consumer goods and Energy
Continental Europe+7.0%
On track to return to growth in H2
Growth of private sector, notably Financial Services and Manufacturing
UK & Ireland -4.7%
Note: All growth rate expressed as year on year at constant currency

6© Capgemini 2018. All rights reserved |2018 Q1 Revenues | April 26th, 2018
Innovation fuels growth across the whole portfolio
Front-end business digitalization driving SFDC commerce and marketing
Chief Marketing Officer as key client Sell through business
S/4 HANA
Pipeline tripled year on year
1/3 of the SAP pipeline
Automotive, Retail, transportation and Utilities
Artificial Intelligence
Rising demand across all sectors: Energy - Pipeline defect tracking CPRD - Online competition tracker Public sector - Fraud detection Over 500 AI customer deployments
Opportunities across sectors with a proliferation of uses cases:• Insurance - security event analysis• High Tech - incident management
Double digit efficiency gain for clients
eCommerce & MarketingAutomation
Strong dynamic in PLM in Aerospace, Automotive, Medical and Energy
Good traction in industrial assets digitalization
Digital manufacturing
7© Capgemini 2018. All rights reserved |2018 Q1 Revenues | April 26th, 2018
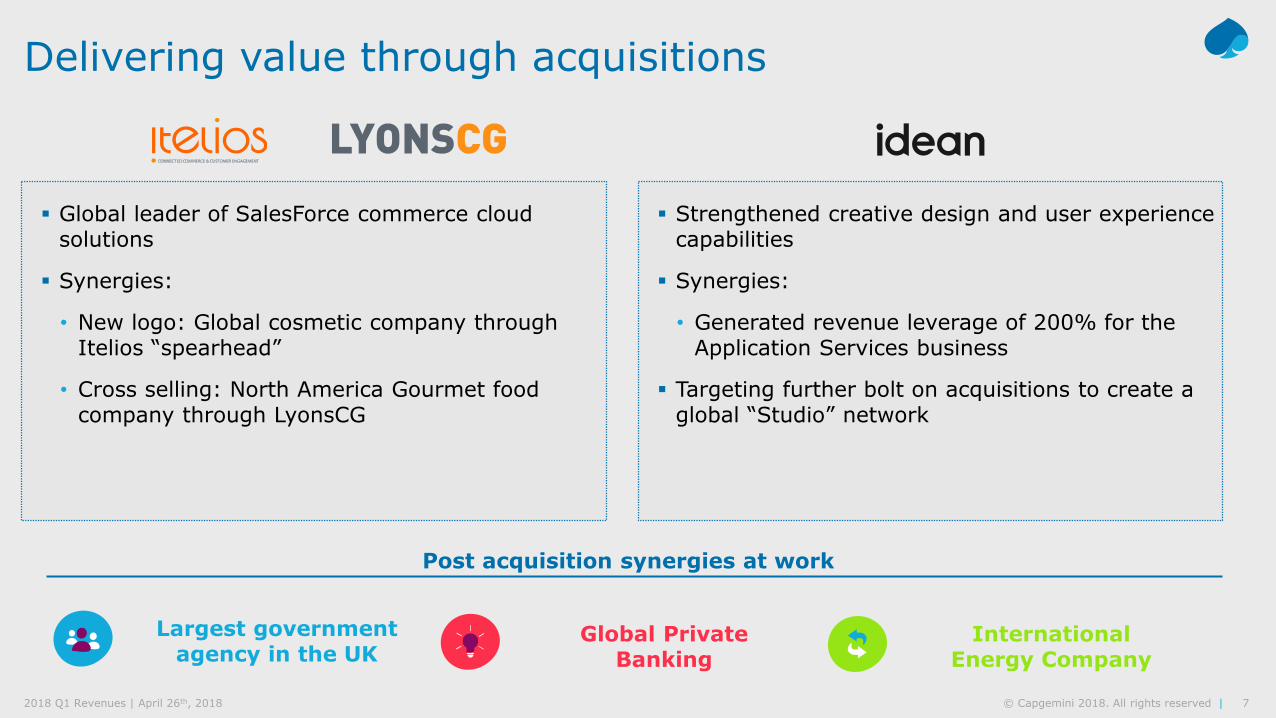
Delivering value through acquisitions
Global leader of SalesForce commerce cloud solutions
Synergies:
• New logo: Global cosmetic company through Itelios “spearhead”
• Cross selling: North America Gourmet food company through LyonsCG
Strengthened creative design and user experience capabilities
Synergies:
• Generated revenue leverage of 200% for the Application Services business
Targeting further bolt on acquisitions to create a global “Studio” network
Post acquisition synergies at work
Largest government agency in the UK
Global Private Banking
International Energy Company

8© Capgemini 2018. All rights reserved |2018 Q1 Revenues | April 26th, 2018
Q1 brings new logos & strong digital and cloud expansion
New logos Significant new wins in Digital and Cloud
Large US credit card
brand
Global Aerospace & Defense leader
Nordic financial services group
Global retailer
Top Ten Global Oil Company
Global HealthcareProvider
Top global commercial real estate
services firm

9© Capgemini 2017. All rights reserved |2017 Full Year Results | February 15th, 2018 © 2018 Capgemini. All rights reserved.
AimanEZZAT

10© Capgemini 2018. All rights reserved |2018 Q1 Revenues | April 26th, 2018
Year-on-Year
Q1 2018
Organic + 6.1%
Group scope +1.1pt
Constant currency + 7.2%
currencies -6.0pt
Reported + 1.2%
Revenues Quarterly Evolution
▐ Revenues in EUR millions
▐ Constant currency growth YOY (in %)
Restated IFRS 15a
Constant currency growth
+7.2% YoY
Revenues under IFRS 15
Currency impact
USD
GBPBRLCAD
others
3,116 3,1642,997
3,248 3,153
Q1 2017 Q2 2017 Q3 2017 Q4 2017 Q1 2018
+2.8% +3.3% +3.4% +6.2% +7.2%
(a) In this presentation, 2017 revenues and revenue growth rates are restated for IFRS 15 unless otherwise stated.The reconciliation between published and IFRS 15 revenues is provided in the appendix to the press release.

11© Capgemini 2018. All rights reserved |2018 Q1 Revenues | April 26th, 2018
Q1 2018 Revenues by Main Geography
North America
Rest of Europe
France
UK & Ireland
APAC & LATAM Q1 2017 Q1 2018
(in €m) (in €m) Reported ConstantCurrency
North America 961 960 -0.1% +14.8%
UK & Ireland 417 386 -7.3% -4.7%
France 662 698 +5.4% +5.4%
Rest of Europe 831 888 +6.9% +8.3%
APAC & LATAM 245 221 -10.1% +1.4%
TOTAL 3,116 3,153 +1.2% +7.2%
RevenuesQ1 2018
Year-on-Year
31%
28%
22%
12%
7%
12© Capgemini 2018. All rights reserved |2018 Q1 Revenues | April 26th, 2018
0%0%0%0%
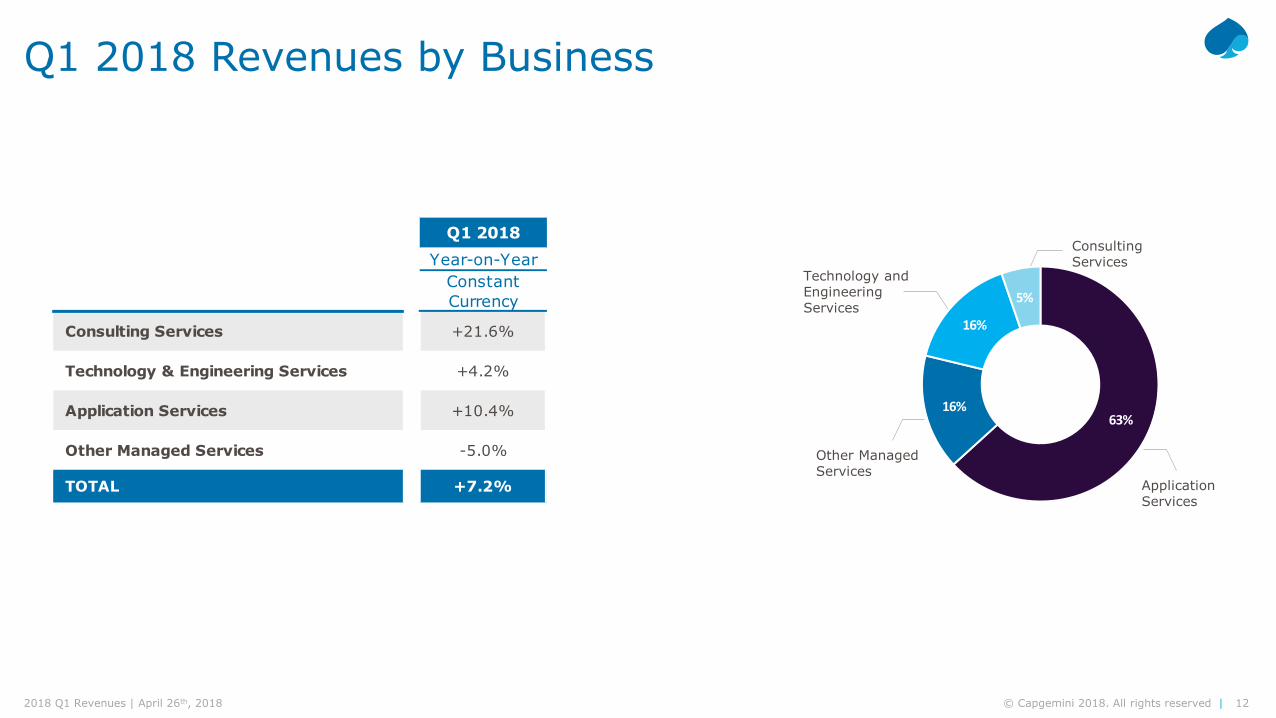
Q1 2018 Revenues by Business
Technology and Engineering Services
Other Managed Services
Consulting Services
Application Services
Constant Currency
Consulting Services +21.6%
Technology & Engineering Services +4.2%
Application Services +10.4%
Other Managed Services -5.0%
TOTAL +7.2%
Q1 2018Year-on-Year
63%16%
16%
5%
13© Capgemini 2018. All rights reserved |2018 Q1 Revenues | April 26th, 2018
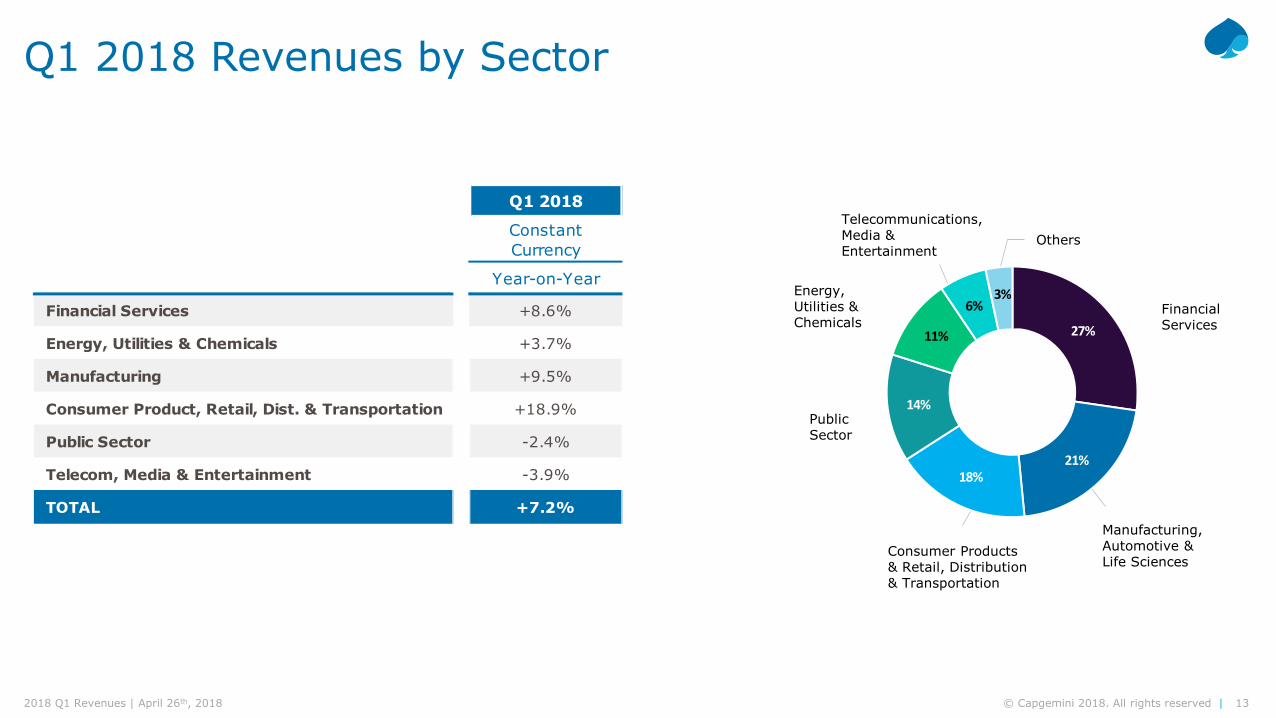
Q1 2018 Revenues by Sector
Financial Services
Manufacturing, Automotive & Life Sciences
Consumer Products & Retail, Distribution & Transportation
Public Sector
Energy, Utilities & Chemicals
Telecommunications, Media & Entertainment
Others
Q1 2018
Constant Currency
Year-on-Year
Financial Services +8.6%
Energy, Utilities & Chemicals +3.7%
Manufacturing +9.5%
Consumer Product, Retail, Dist. & Transportation +18.9%
Public Sector -2.4%
Telecom, Media & Entertainment -3.9%
TOTAL +7.2%
27%
21%18%
14%
11%
6%3%

14© Capgemini 2018. All rights reserved |2018 Q1 Revenues | April 26th, 2018
Bookings Evolution
▐ Bookings (in EUR million)
▐ Constant currency growth YOY (in %)
3,001
3,388
2,700
3,801
3,195
Q1 2017 Q2 2017 Q3 2017 Q4 2017 Q1 2018
-3.2% +4.8% -1.0% +1.4% +15.3%
as reported (i.e. non IFRS 15)

15© Capgemini 2018. All rights reserved |2018 Q1 Revenues | April 26th, 2018
Headcount Evolution
Workforce in global production centers:
+4.1%YoY
57% of total
AttritionQ1 2018 vs. Q1 2017
Headcount EvolutionMarch 2017 to March 2018
195,800 195,799 200,370 203,400
Mar. 2017 Net variationoffshore
Net variationonshore
Mar. 2018
+4,600 +3,000
+3.9%Attrition Q1 2017 Q1 2018 Year-on-Year
variation
Consulting Services 18.0% 19.4% +1.4pt
Technology and Engineering Services 17.6% 18.9% +1.3pt
Application Services 14.3% 15.7% +1.4pt
Other Managed Services 16.5% 20.0% +3.5pt
TOTAL 15.3% 17.2% +1.9pt

16© Capgemini 2018. All rights reserved |2018 Q1 Revenues | April 26th, 2018
Appendix

17© Capgemini 2018. All rights reserved |2018 Q1 Revenues | April 26th, 2018
Non-GAAP measures▐ Organic growth, or like-for-like growth, in revenues is the growth rate calculated at constant Group scope and exchange rates. The
Group scope and exchange rates used are those for the published fiscal year. Exchange rates for the published fiscal year are also used tocalculate growth at constant exchange rates.
▐ Operating margin is one of the Group’s key performance indicators. It is equal to revenues less operating expenses. It is calculatedbefore “Other operating income and expenses” which include amortization of intangible assets recognized in business combinations, thecharge resulting from the deferred recognition of the fair value of shares granted to employees (including social security contributions andemployer contributions), and non-recurring revenues and expenses, notably impairment of goodwill, negative goodwill, capital gains orlosses on disposals of consolidated companies or businesses, restructuring costs incurred under a detailed formal plan approved by theGroup’s management, the cost of acquiring and integrating companies acquired by the Group, including earn-outs comprising conditionsof presence, and the effects of curtailments, settlements and transfers of defined benefit pension plans.
▐ Organic free cash flow is calculated based on items in the Statement of Cash Flows and is equal to cash flow from operations lessacquisitions of property, plant, equipment and intangible assets (net of disposals) and adjusted for flows relating to the net interest cost.
18© Capgemini 2018. All rights reserved |2018 Q1 Revenues | April 26th, 2018
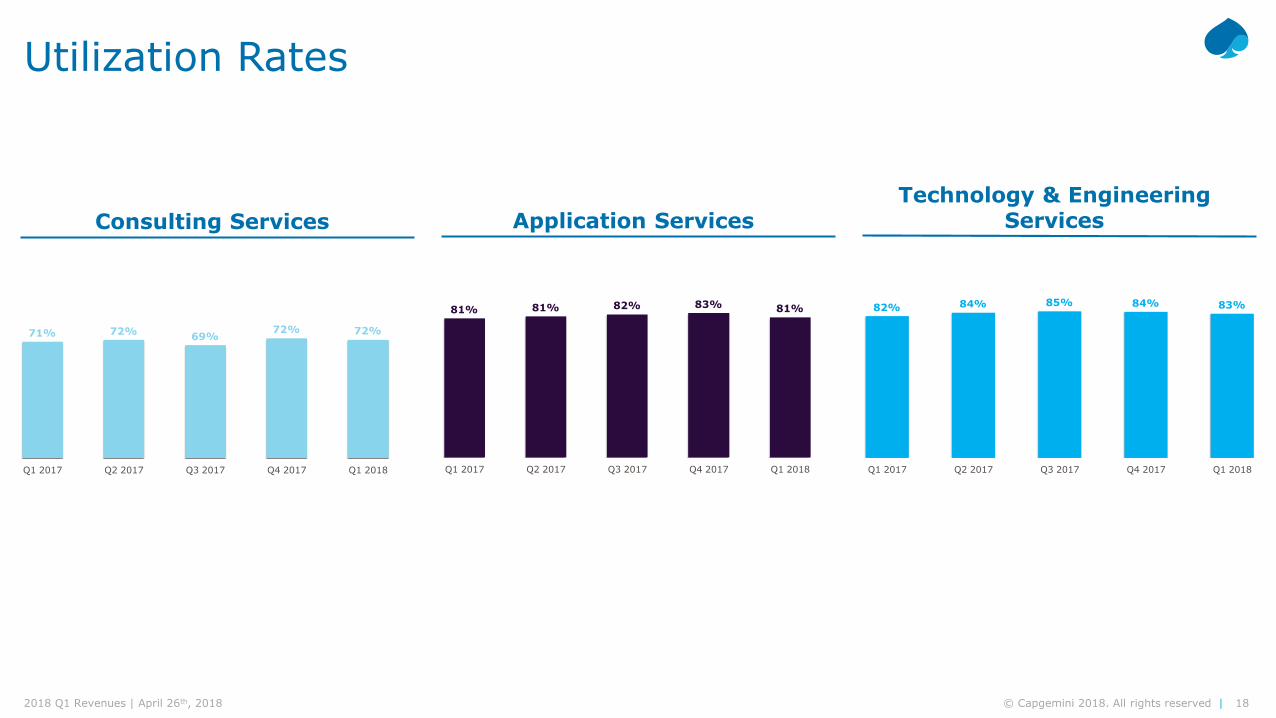
Consulting Services
Utilization Rates
Application ServicesTechnology & Engineering
Services
71% 72% 69%72% 72%
Q1 2017 Q2 2017 Q3 2017 Q4 2017 Q1 2018
81% 81% 82% 83% 81%
Q1 2017 Q2 2017 Q3 2017 Q4 2017 Q1 2018
82% 84% 85% 84% 83%
Q1 2017 Q2 2017 Q3 2017 Q4 2017 Q1 2018
A global leader in consulting, technology services and digital transformation,Capgemini is at the forefront of innovation to address the entire breadth of clients’opportunities in the evolving world of cloud, digital and platforms. Building on itsstrong 50-year heritage and deep industry-specific expertise, Capgemini enablesorganizations to realize their business ambitions through an array of services fromstrategy to operations. Capgemini is driven by the conviction that the business valueof technology comes from and through people. It is a multicultural company of200,000 team members in over 40 countries. The Group reported 2017 globalrevenues of EUR 12.8 billion.
About Capgemini
Learn more about us at
www.capgemini.com
This message contains information that may be privileged or confidential and is the property of the Capgemini Group.Copyright © 2017 Capgemini. All rights reserved.
Biraud, VincentHead of Investor [email protected]+33 1 4754 5087
Schmitt, MarineSenior Investor Relations [email protected]+33 1 4754 5082
People matter, results count.