Embed Size (px)
Citation preview

This is a post-peer-review, pre-copy edited version of an article published in Social Science Research. The definitive publisher-authenticated version is available at https://doi.org/10.1016/j.ssresearch.2019.03.008
1

TITLE PAGE:The growing American health penalty:
International trends in the employment ofolder workers with poor health
Ben Baumberg Geiger1, René Böheim2 and Thomas Leoni31 Corresponding author is BBG; correspondence details are [email protected]; School of Social Policy, Sociology & Social Research, University of Kent, UK; 2 WU Vienna University of Business and
Economics, [email protected], Austrian Institute of Economic Research, CESifo, JKU Linz, IZA; 3 Austrian Institute of Economic Research, [email protected].
Abstract: Many countries have reduced the generosity of sickness and disability programs
while making them more activating – yet few studies have examined how employment rates
have subsequently changed. We present estimates of how employment rates of older
workers with poor health in 13 high-income countries changed 2004-7 to 2012-15 using
HRS/SHARE/ELSA data. We find that those in poor health in the USA have experienced a
unique deterioration: they have not only seen a widening gap to the employment rates of
those with good health, but their employment rates fell per se. We find only for Sweden (and
possibly England) signs that the health employment gap shrank, with rising employment but
stable gaps elsewhere. We then examine possible explanations for the development in the
USA: we find no evidence it links to labor market trends, but possible links to the USA’s lack
of disability benefit reform and wider economic trends.
Word count: 9918 words excluding abstract, keywords
Acknowledgements: This work was supported by UK Economic & Social Research Council (ESRC) [grant number ES/K009583/1].
Keywords: Employment, health, disability, welfare, social security, panel data
Note: all figures can be printed in grayscale.
2

The growing American health penalty:International trends in the employment of
older workers with poor health
Abstract: Many countries have reduced the generosity of sickness and disability programs
while making them more activating – yet few studies have examined how employment rates
have subsequently changed. We present estimates of how employment rates of older
workers with poor health in 13 high-income countries changed 2004-7 to 2012-15 using
HRS/SHARE/ELSA data. We find that those in poor health in the USA have experienced a
unique deterioration: they have not only seen a widening gap to the employment rates of
those with good health, but their employment rates fell per se. We find only for Sweden (and
possibly England) signs that the health employment gap shrank, with rising employment but
stable gaps elsewhere. We then examine possible explanations for the development in the
USA: we find no evidence it links to labor market trends, but possible links to the USA’s lack
of disability benefit reform and wider economic trends.
3

1. Introduction
Since the 1980s, many high-income countries have seen a rise in disability benefit
recipiency rates, often accompanied by a fall in the employment rates of older workers with
ill-health (OECD, 2003, OECD, 2010, Whitehead, et al., 2009). In response to these trends,
policymakers in many countries have reformed sickness and disability benefits programs,
reducing their coverage and generosity and making them more ‘activating’ (i.e. increasing
their focus on return-to-work; see Figure 1 below). It has been assumed that these reforms
will lead to improved employment rates for those with poor health relative to the rest of the
population – yet almost no research has directly examined what has happened to these
employment rates across time and place, and none have done this while taking steps to
measure ‘health’ consistently over time.
Figure 1: Trends in sickness and disability programs in selected countries, 1990 to 2012.
Source: authors’ calculations based on OECD (2003, 2010) and Böheim & Leoni (2018). Each scale is based on 10 sub-components ranging from 0 to 5, with a
4

maximum of 50 points – see further detail in section 2.2 (‘Institutional measures’) and Online Appendix A8.
This is not an idle question, because it is unclear if the reforms will translate into improved
relative employment rates for those in poor health, even if we ignore the partial overlap
between poor health (as operationalized in research) and disability benefit receipt (Croda, et
al., 2015). There is convincing evidence from natural experiments that reduced disability
benefits eligibility leads to increased employment (e.g. de Jong, et al., 2011, Staubli, 2011) –
although the effects that are found are often ‘relatively small’ (Koning and van Sonsbeek,
2017), and not all studies find any effects per se (Barr, et al., 2016, Tanaka, et al., 2016).
Moreover, the overall long-term impact of these complex reforms is more ambiguous. For
example, one form of activation is mandatory back-to-work planning (with the threat of
sanctions), but the few existing randomized trials of mandatory interviews for disabled
people show null or even negative effects on employment (Geiger, 2017). More broadly, van
der Wel, et al. (2012) argue that benefit generosity is intrinsically linked within policy
‘regimes’ to social investment strategies that raise employment, and that it is therefore those
countries with a combination of generous benefits and encompassing measures to support
labor market (re-)integration that perform best.
Moreover, whatever the results of disability benefits reform in itself, trends in the relative
employment of those in poor health may be outweighed by other factors, such as the
business cycle (Benitez-Silva, et al., 2010) or other social security changes (Erosa, et al.,
2012). Foremost amongst these are labor market factors; for example, part-time work
(Jones, 2007, OECD, 2010:52) and job adjustments (Franche, et al., 2005) are crucial for
the employment of those with poor health. It is difficult for older workers with health problems
to find their way back into employment once they have lost their job, particularly once they
receive a disability benefit (Burkhauser, et al., 2014, OECD, 2003:59). Hence the retention of
5

existing workers may be a much more important influence on relative employment rates than
the recruitment of disability benefit claimants.
In this paper, we examine employment trends of older workers in poor health across 13 high-
income countries from the early 2000s to the mid-2010s. We show that most countries have
seen stable relative employment of those with poor health, alongside improving absolute
employment levels. However, the USA is an exception: we find that the relative and absolute
employment of those in poor health deteriorated in the USA. A careful analysis of the micro-
data alongside wider macro-level indicators finds little evidence that this is due to trends in
part-time work, job tenure, or recruitment/retention. However, it may partly be due to the lack
of disability benefits reform and wider macroeconomic developments in the USA –
notwithstanding some complexities in interpretation. Before this, however, we begin by
reviewing existing studies and explaining why simple measures of health produce
untrustworthy trends, before describing how we construct a more trustworthy measure (using
the approach of Poterba, et al., 2013).
2. Methods and data
2.1 General approachThere is ample evidence that ill-health and disability reduce people’s chances of getting and
keeping work (Alavinia and Burdorf, 2008, Robroek, et al., 2013, e.g. Schuring, et al., 2007).
A few within-country trends and cross-national comparisons do exist (Baumberg, et al.,
2015, Geiger, et al., 2017), but all studies face a substantial methodological challenge,
because different types of people have different ways of reporting their health across
different times and places. For example, Jürges (2007) shows that differences in reporting
style explain a large share of the differences in self-reported health across European
countries. Indeed, health reporting is affected by both institutional characteristics (Angelini,
et al., 2011) and whether respondents are working or not (see Kalwij and Vermeulen, 2008
6

using SHARE data), making it difficult to interpret the few existing studies looking
comparatively at health and employment.
A variety of strategies have been proposed to deal with these issues (e.g. Jones, 2006,
Jürges, 2007). We use the approach suggested by Poterba, Venti, and Wise (2013) which is
based on a series of specific health indicators that are combined into a single measure of
latent health using principal component analysis (PCA). This index provides us with a fine-
grained unidimensional measure of health. Poterba, Venti, and Wise (2013) document that
this health index is strongly related to mortality, as well as being a good predictor of future
health events such as having a stroke. (In our analyses below, the health index is strongly
correlated with self-reported work-limiting disability.) This index and related approaches
have already been used in some influential comparisons, but the index has not been used
for analyzing health and employment over time. 1
Our analysis depends on the assumption that each of the specific health indicators (listed
below) is reported similarly over time within each country – it does not assume that these
indicators are reported similarly across countries; nor does it assume that general measures
of health are reported similarly within countries over time.
2.2 DataTo create the health index, we need high-quality comparative surveys of the general
population that include a battery of specific health measures. Few such surveys exist, and
like others (e.g. Poterba, et al., 2013), we therefore use three of the Global Ageing Datasets
(a series of multipurpose panel surveys with extensive health and employment data, based
on a common design): the USA Health and Retirement Study (HRS), the European Survey
of Health, Aging and Retirement (SHARE), and the English Longitudinal Survey of Ageing
1 Poterba et al use the index to underpin the latest phase of the National Bureau of Economic Research’s 12-country comparison of ‘Social Security Programs and Retirement around the World’ (Wise, 2017) – which has been described as “hands down the most influential use of international comparisons in economics” (Banks and Smith, 2012). The approach is also similar to the Item Response Theory-based approach of the World Disability Report (World Bank and WHO, 2011).
7

(ELSA). They provide uniquely detailed data on health and work that enable us to address
our question, but they have the drawback that they constrain us to the 50+ population. The
rest of this section focuses in turn on the sample, health variables, other variables, and our
analytical approach.
Sample
HRS, ELSA, and SHARE are longitudinal surveys of representative samples of several
countries’ populations aged 50+ (51+ in the case of HRS). HRS was the earliest of the
surveys and, after annual collection 1992-1996, has been collected bi-annually since. The
others began more recently and were based explicitly on the same model: ELSA has been
collected bi-annually since 2002; and SHARE was first collected in 2004, and then
approximately bi-annually since 2007 (with some variation by country). The surveys have
been extensively used for comparative research (e.g. Avendano, et al., 2009, Cieza, et al.,
2015, Crimmins, et al., 2010, Trevisan and Zantomio, 2016); we use the supplied survey
weights, and full sampling details are given in the cohort profiles (Börsch-Supan, et al., 2013,
Sonnega, et al., 2014, Steptoe, et al., 2013) and publicly accessible data documentation
(Beaumaster, et al., 2017, Bugliari, et al., 2016, Phillips, et al., 2017).
To investigate trends, we use the earliest and latest available pairs of waves (we use pairs of
waves in order to generate larger samples within the SHARE data), allowing us to construct
trends from 2004-7 to 2012-15. Some countries are only intermittently included in SHARE
over the study period, and we exclude countries for which the start/end sample sizes are too
small to produce meaningful estimates; we also exclude Israel for which wider disability
policy data are not available. Our resulting sample consists of Austria, Belgium, Denmark,
France, Germany, Greece, Italy, Netherlands, Spain, Sweden, and Switzerland. For HRS
and ELSA, we choose waves that overlap as closely with the SHARE waves; the resulting
field and interview dates of the ELSA, HRS, and SHARE surveys overlap almost completely,
as shown in Table 1 below.
8

9

HRS SHARE ELSA
Baselineperiod
Wave 7: 2004/05 Wave 1: 2004/05 Wave 2: 2004/05
Wave 8: 2006/07 Wave 2: 2006/07
Latestperiod
Wave 11: 2012/13 Wave 5: 2013 Wave 6: 2012/13
Wave 12: 2014/15 Wave 6: 2015 Wave 7: 2014/15
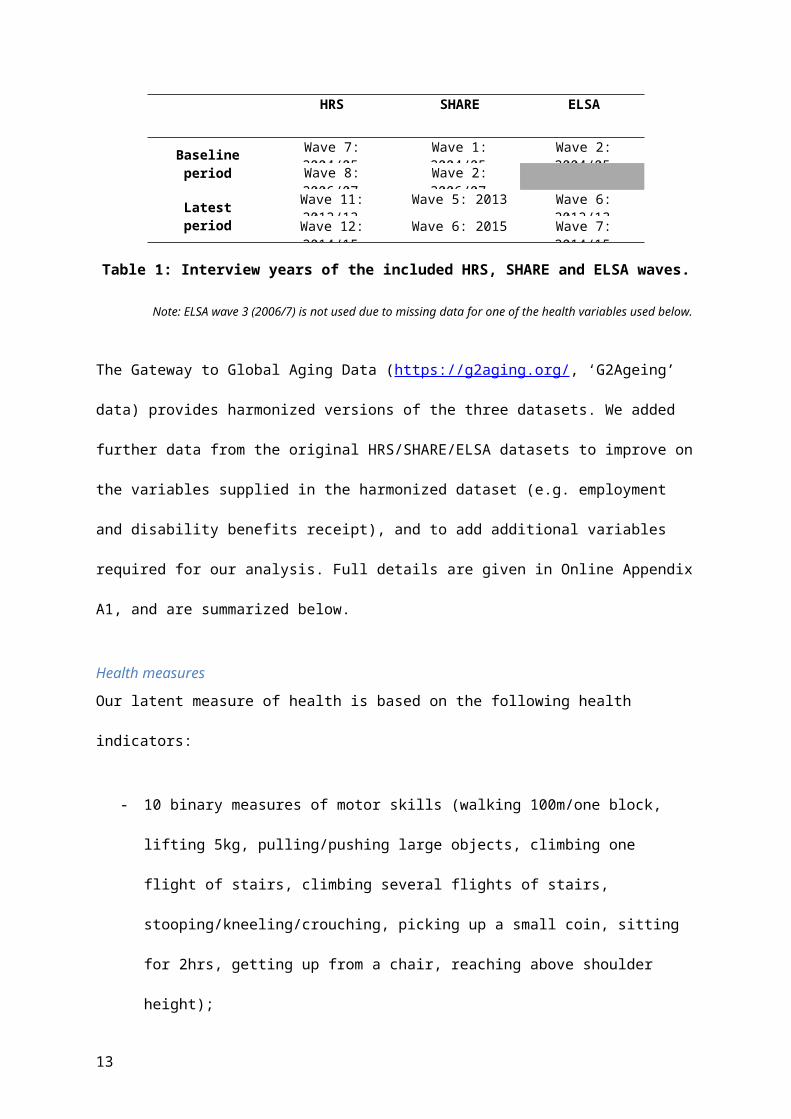
Table 1: Interview years of the included HRS, SHARE and ELSA waves.
Note: ELSA wave 3 (2006/7) is not used due to missing data for one of the health variables used below.
The Gateway to Global Aging Data (https://g2aging.org/, ‘G2Ageing’ data) provides
harmonized versions of the three datasets. We added further data from the original
HRS/SHARE/ELSA datasets to improve on the variables supplied in the harmonized dataset
(e.g. employment and disability benefits receipt), and to add additional variables required for
our analysis. Full details are given in Online Appendix A1, and are summarized below.
Health measures
Our latent measure of health is based on the following health indicators:
- 10 binary measures of motor skills (walking 100m/one block, lifting 5kg,
pulling/pushing large objects, climbing one flight of stairs, climbing several flights of
stairs, stooping/kneeling/crouching, picking up a small coin, sitting for 2hrs, getting up
from a chair, reaching above shoulder height);
- 2 measures of functional disability, one for any limitation in Activities of Daily Living
(ADLs), one for any limitation in Instrumental Activities of Daily Living (IADLs). The
former are basic and universal physical tasks such as eating, the latter are mixtures
of physical and cognitive competencies such as preparing a hot meal (Breeze and
Lang, 2006);
10

- 7 measures of self-reported doctor-diagnosed chronic diseases (high blood pressure,
stroke, diabetes/high blood sugar, chronic lung disease (excluding asthma), heart
problems, arthritis);
- 1 measure of fair/poor global self-reported health;
- 2 measures of non-optimal Body-Mass Index (BMI) – underweight and overweight –
based on self-reported height and weight in HRS & SHARE and measured height
and weight in ELSA;
- 2 measures of mental health, a scale measure treated as linear (CESD for
ELSA/HRS, Euro-D for SHARE), and a binary measure of poor mental health based
on the standard cut-off for the relevant scale measure.
Although the surveys are modelled on each other and the datasets are harmonized by
G2Ageing, in some instances the concordance between the SHARE, HRS, and ELSA data
is not perfect. Differences in terms of definition, construction or how the information was
elicited sometimes required additional data harmonization. In most instances, these
adaptations were minor and we do not expect that they have further implications for our
investigation. In some cases, however, the differences are more substantial, such as for the
measure of mental health. We focus on within-country comparability over time to ensure that
the measures are consistent within each country over time, but we do not assume that the
measures are equivalent between countries.
Other self-reported measures
The validity of our analysis depends on having a consistent employment measure over time
within each country. However, the employment variable in the G2Ageing harmonized data is
not comparable within SHARE over time; we therefore created a revised, more consistent
employment variable that is detailed in Online Appendix A1. In section 4 we also investigate
11

self-reported disability benefit receipt; again, we improve on the G2Ageing version and
create a more consistent, more precisely operationalized variable, in a series of steps that
are detailed in Online Appendix A1. Alongside this, we also use the G2Ageing variables on
work hours, tenure, age, and gender.
Institutional measures
Separately to our micro-level data, we consider aggregate-level trends in disability benefits
policy using the influential OECD policy scales, as shown in Figure 1 above. The OECD use
two policy indicators, each of them consisting of ten sub-dimensions measured according to
a predefined scale which ranges from zero to five points (OECD, 2010):
1. ‘Generosity’ (aka ‘Compensation’), for which higher scores indicate greater
generosity (including the coverage and level of disability benefits, the minimum
degree of incapacity needed for benefit and full benefit entitlement, the type of
medical and vocational assessment, as well as information on sickness benefits);
2. ‘Activation’ (aka ‘Integration’), for which higher scores mean a more active and
employment-oriented approach (including the complexity and consistency of benefits
and support systems, the degree of employer obligations towards their employees,
the timing and extent of vocational rehabilitation, and the existence of work incentives
for beneficiaries).
The OECD scores are only available for the period 1990 to 2007. We therefore use updated
scores provided by Scharle et al. (2015) and Böheim and Leoni (2018) that take into account
changes up to the year 2013.
2.3 Analytical approachInternational comparisons of older workers’ employment are complicated by differences in
retirement ages. One option is to restrict the analysis to a specific age group (e.g. 50-59 year
olds), but this would exclude an important segment of the workforce in countries with a high
statutory retirement age. Furthermore, this would not necessarily ensure comparability,
12
because the labor market situation of persons of the same age in different countries could
still be different depending on the time until statutory retirement. Since we are interested in
how far different countries integrate the least healthy parts of their workforce, we instead
focus on individuals who were between 50 and the respective statutory/regular pension age
in the country at the time of the survey.2
This leaves us with a sample of 148,293 observations for 65,171 individuals (of which
110,345 observations are in the baseline/latest periods; see Online Appendix A3 for sample
size per country/wave). While this is a large sample overall, the sample sizes for the SHARE
countries are often small (particularly when we restrict our analysis to single tertiles of the
health distribution), and we are therefore unable to stratify our analyses by gender in our
main analyses (although we do show gender-stratified results in sensitivity analyses; see
section 3.1 below). Incomplete data is generally low for all survey-waves with the exception
of HRS (particularly the earlier waves, primarily for mental health and certain ADL/mobility
limitations) and ELSA (for BMI, which required physical measurements and was only
undertaken at alternate waves), as shown in Online Appendix A2. We consider the role of
missing data in two sensitivity analyses, one of which excludes BMI to reduce missingness
in ELSA, the other of which performs a full multiple imputation analysis; this is described
below and in Online Appendix A4 (Tables A5 and A6).
The health index is generated using a PCA of the health variables listed above. We use the
first principal component, which represents the weighted average of the health indicators
(where the weights are chosen to maximize the proportion of the variance of the individual
health indicators that can be explained by the first principal component3). The first principal 2 For the US, we imputed information on the normal retirement age, differentiated by year of birth, as indicated by the U.S. Social Security Administration. For England, state pension ages by year of birth were taken from Government sources. For SHARE countries, retirement age is included at the individual level for those countries/respondents within the SHARE Job Panel dataset. We updated this information for all countries/respondents in our sample using the documentation provided by the OECD (Pensions at a Glance), the EU (Ageing Reports) and the MISSOC database; depending on the country, the statutory retirement age of an individual might depend on demographic characteristics such as gender and year of birth. Descriptive statistics on retirement ages by country-wave are given in Online Appendix A3.3 Using the STATA ‘pca’ routine, the eigenvectors are returned in orthonormal form, that is, uncorrelated and normalized.
13

component can be interpreted as a latent health index. In the PCA we use the population
aged 50 to 67 years and pool all waves to maximize sample size and to ensure that each
health indicator is consistently weighted over time. The PCA is however carried out
separately for each country, to avoid the assumption that measures are interpreted
identically cross-nationally (although as we show in Online Appendix A7, weightings in
practice are very similar across countries). We use this to construct percentile scores of
each individual’s position within the health distribution (within that country-wave); for most
analyses, we group the scores and consider those in the bottom tertile as being in ‘poor
health’ in that country. This creates equally-sized groups of those with relative poor health in
each wave, rather than differently-sized groups with similar absolute health.
To examine changes over time net of demographic change, we estimate the impact of health
on employment status, y ijk:
y ijt=β1healthijt+β2 country j+ β3 (healthijt∗country j )+β4 t+β5 (healthijt∗t )+β6 (countryijt∗t )+β7 (healthijt∗country j∗t )+β8ageijt+β9ageijt2 +β10 (ageijt∗country j )+β11(age ijt2∗country j )+ β12gender ijt+β13 (genderijt∗country j )+β14+ϵ ijt
where health indicates person i's rank in country j’s health distribution at time t.4 For the main
set of estimates, we distinguish between the tertiles of the health distribution (below, we also
use a finer distinction and use deciles). While our data are clustered, we are not interested in
partitioning the variance between the individual and the country-wave level, and the low
number of countries in our sample would likely lead to biased estimates in a multilevel
analysis (Bryan and Jenkins, 2016); we therefore account for clustering using cluster-robust
standard errors. We use these estimates to estimate the marginal effects of health which
form the basis for our discussion below.
It should be noted that sickness and disability policies (in interaction with other labor market
and social policies) impact a broad range of non-employment outcomes, such as the receipt 4 We pool observations over time rather than to estimate fixed-effects panel estimates. In our main analyses we use OLS which should produce effectively identical results to logit models (Hellevik, 2009) but are more easily interpretable and better-validated for certain multiple imputation analyses; however in sensitivity analyses we use logit models that produce effectively identical results (see Online Appendix 3).
14

of unemployment and other social security benefits, poverty rates, and well-being more in
general. A discussion of these interlinkages and possible outcomes goes beyond the scope
of the present paper and is left to future research.
3. Trends in the employment of persons with poor health
In all countries considered here, health is an important determinant of employment:
employment rates for those with poor health are considerably lower than those with better
health (see Online Appendix 4, Table A3). We estimate the gap in employment rates using
the model displayed above, controlling for the age-gender structure in each country and
period. The estimated gap between the bottom and top health tertiles ranges from 10.9%
(percentage points) in Switzerland 2012-15 to 41.9% in the USA 2012-5. Our main focus
here however is on changes over time. The trend in the employment gap from the start
(2004-7) to the end (2012-15) of this period is shown in Figure 2 below. (The accompanying
Table is given in Online Appendix A4, Table A4.)
For most countries, Figure 2 shows no evidence of a systematic change despite widespread
disability benefit policy reforms. However, there is some evidence of a systematic trend in
three countries. The evidence suggests that the gap decreased by 7.4% (95% confidence
interval (CIs) -13.6 to -1.3%) in Sweden. In contrast, there is evidence that there were sharp
deteriorations in the position of those with poor health in Austria (by 10.3%, 95% CI 0.8 to
19.4%) and in the USA (where the gap rose by 8.1%; 95% CI 4.8 to 11.4%).
15

Figure 2: Gap in employment rates between bottom vs. top health tertile – change from 2004-7 to 2012-15
Note: Rising health employment gap = an increase in the difference in employment rates between those in poor health vs. those in good health. Gaps are estimated controlling for age and gender.
These comparisons indicate how those in poor health fared relative to those with better
health. To see how they fared per se, we consider absolute changes in the employment rate
of those in poor health, shown in Figure 3 below. This shows a generally positive
development in most countries. We observe an increase in employment rates (after
controlling for demographic changes), although in some countries these shifts are not
statistically significant at conventional levels (and Greece experienced a slightly negative but
not statistically significant change). The greatest increase in the employment share of
workers with ill health took place in the Netherlands and Sweden, followed by Switzerland,
Belgium, and Italy. The general increase may well be the consequence of increasing labor
force participation of women (see also section 3.1 below), as well as labor market or
pensions policy changes.
16

The US, however, is an outlier. The development in US was unique as it was the only
country in our sample where both the relative and the absolute employment of older workers
with ill health declined. Although in Austria the employment gap rose (Figure 2 above), the
employment of those with poor health increased (Figure 3 below); the rising gap is because
this increase in employment was much smaller than for those in better health.
Figure 3: Change in absolute employment level of respondents, in bottom health tertile, 2004-7 to 2012-15.
Note: A positive value indicates higher employment rates over time for persons who were in the bottom third of the health distribution. Employment levels are estimated controlling for age and gender.
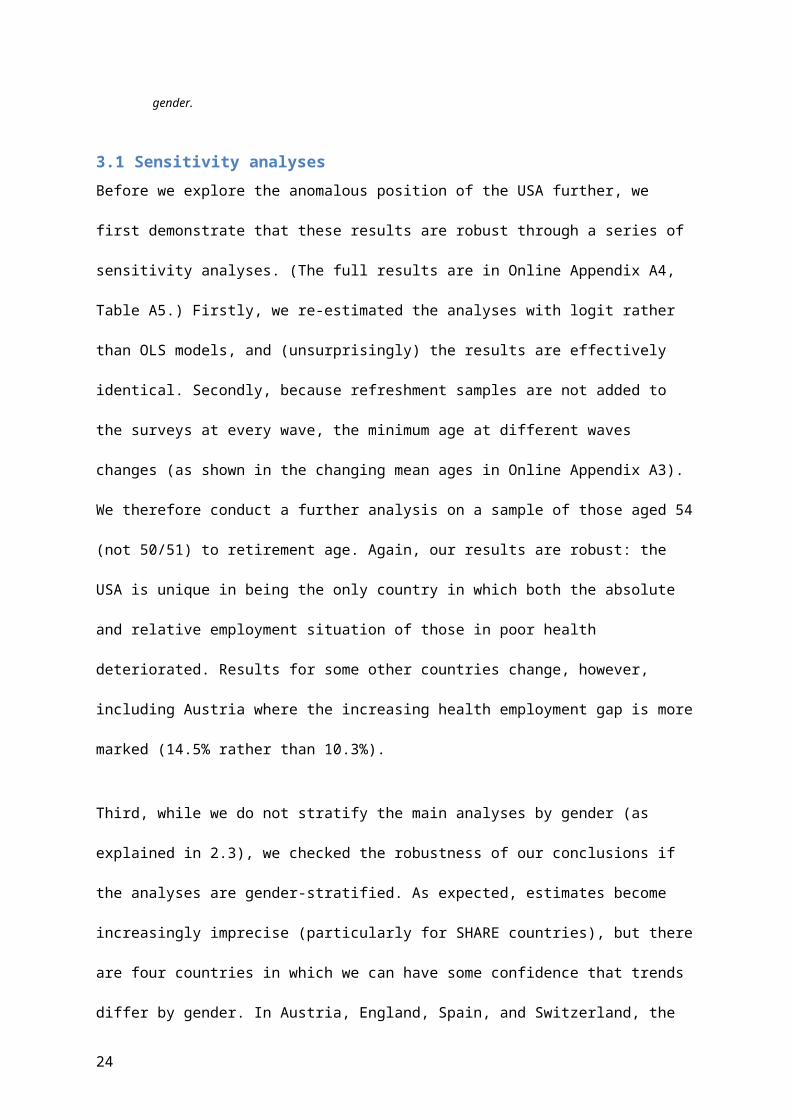
3.1 Sensitivity analysesBefore we explore the anomalous position of the USA further, we first demonstrate that
these results are robust through a series of sensitivity analyses. (The full results are in
Online Appendix A4, Table A5.) Firstly, we re-estimated the analyses with logit rather than
OLS models, and (unsurprisingly) the results are effectively identical. Secondly, because
refreshment samples are not added to the surveys at every wave, the minimum age at
different waves changes (as shown in the changing mean ages in Online Appendix A3). We
17

therefore conduct a further analysis on a sample of those aged 54 (not 50/51) to retirement
age. Again, our results are robust: the USA is unique in being the only country in which both
the absolute and relative employment situation of those in poor health deteriorated. Results
for some other countries change, however, including Austria where the increasing health
employment gap is more marked (14.5% rather than 10.3%).
Third, while we do not stratify the main analyses by gender (as explained in 2.3), we
checked the robustness of our conclusions if the analyses are gender-stratified. As
expected, estimates become increasingly imprecise (particularly for SHARE countries), but
there are four countries in which we can have some confidence that trends differ by gender.
In Austria, England, Spain, and Switzerland, the employment gap between those in poor and
better health becomes worse for women than men over this period, although the nature of
this varies by country (as shown in Online Appendix A4, Table A7). Our main results are
however robust: Sweden is unusual in having a decreasing (if imprecisely estimated) gap for
both men and women (although there may also be decreasing gaps among Spanish and
Swiss men), and the deterioration in both absolute and relative employment rates for those
with poor health in the US is both unique and consistent across men and women.
Our remaining sensitivity analyses deal with missing data. The greatest source for missing
data is BMI, particularly in England; we therefore re-run the analyses excluding BMI from our
latent health measure. As an alternative approach, we maintained our use of BMI but used a
multiple imputation analysis to account for missingness in all variables (for further details see
Online Appendix A4, Tables A5 and A6). These analyses had most impact on the results for
England: both sensitivity analyses suggested more positive trends, with the absolute
employment trend among those in poor health rising by 7.6-7.7% rather than 5.6%, and also
providing some suggestions that the health employment gap declined (by 4.4% (95% CI -
8.9% to 0.04%) in the multiple imputation analysis and 5.2% (-10.3% to -0.1% ) when
excluding BMI, compared to 3.2% (-8.6 to 2.3%) in the main analyses above). For Austria,
18

the sensitivity analyses confirm the main results about the changes in employment levels
and gaps, but some sensitivity analyses led to smaller and less precise coefficients for the
health-related employment gap. At the same time, these sensitivity analyses resulted in
larger and more precise coefficients for the absolute trend in employment among those in
poor health. Otherwise, however, the substantive conclusions of both sensitivity analyses
are identical to our main analyses.
3.2 Distribution of employment along the whole health distribution One advantage of having a fine-grained health index is that we can examine trends in
employment across the full distribution of health. Rather than comparing employment rates
by tertile of health, we treat health as continuous (using 10 deciles) and allow a flexible
(cubic) specification for the relationship between health and employment in each country-
wave, controlling for age and gender. Results for the countries with changing relative
employment rates are shown in Figure 4. (Remaining countries are shown in Online
Appendix A4, Figure A1.)
The analysis of the changes across the full health distribution reveals two main findings.
Firstly, it demonstrates once more that those with poor health have lower employment rates
than those with better health. However, we see that this effect is often concentrated in the
bottom half of the health distribution, such as in the US, Sweden, and England. In some
countries (e.g. England, and Switzerland in Online Appendix A4), the extent of this is such
that the employment shares are low for those at the bottom of the health distribution, but
once people have a certain level of health, their chances of being employed varies little with
improved health. In Austria, on the other hand, each change in health has a similar link to
employment across the health distribution.
Secondly, Figure 4 provides more detail about the deteriorating employment position of
those with poor health in the US. Along the entire health distribution, we do not find any
improvement in the chances of being employed – but there was a sharper fall in employment
19

rates for those in the bottom half of the health distribution. The increasing health-related
employment gap in Austria is different; here increases in employment rates are evident
along the whole health distribution, but only minor improvements occurred for those with the
poorest health. And in Sweden (and to a lesser extent in Germany and Switzerland; see
Online Appendix A4), the employment shares of those in the bottom half increased more-
than-proportionally over time. Between these extremes, we see countries which changed
little such as England who has the most stable relationship between health and employment
across waves.
Figure 4: Employment across the whole distribution of health, 2004-7 to 2012-15.
Note: Figures show the association between employment and a cubic function of health, controlling for age and gender.
4. Exploring trends using the HRS-SHARE-ELSA micro-data
We have seen that in many countries, employment among older working-age people has
increased – yet the health employment gap does not seem to have reduced in most
countries (Sweden being the solitary counter-example). In Austria and the USA, the situation
even deteriorated. In the remainder of the paper, we try to understand this by further
20

examining the rich micro-data of the ageing surveys.5 For ease of presentation, we focus on
a geographically and institutionally dispersed subsample of countries that show different
trends (Austria, Denmark, England, Germany, Italy, Sweden, Switzerland, and the US).
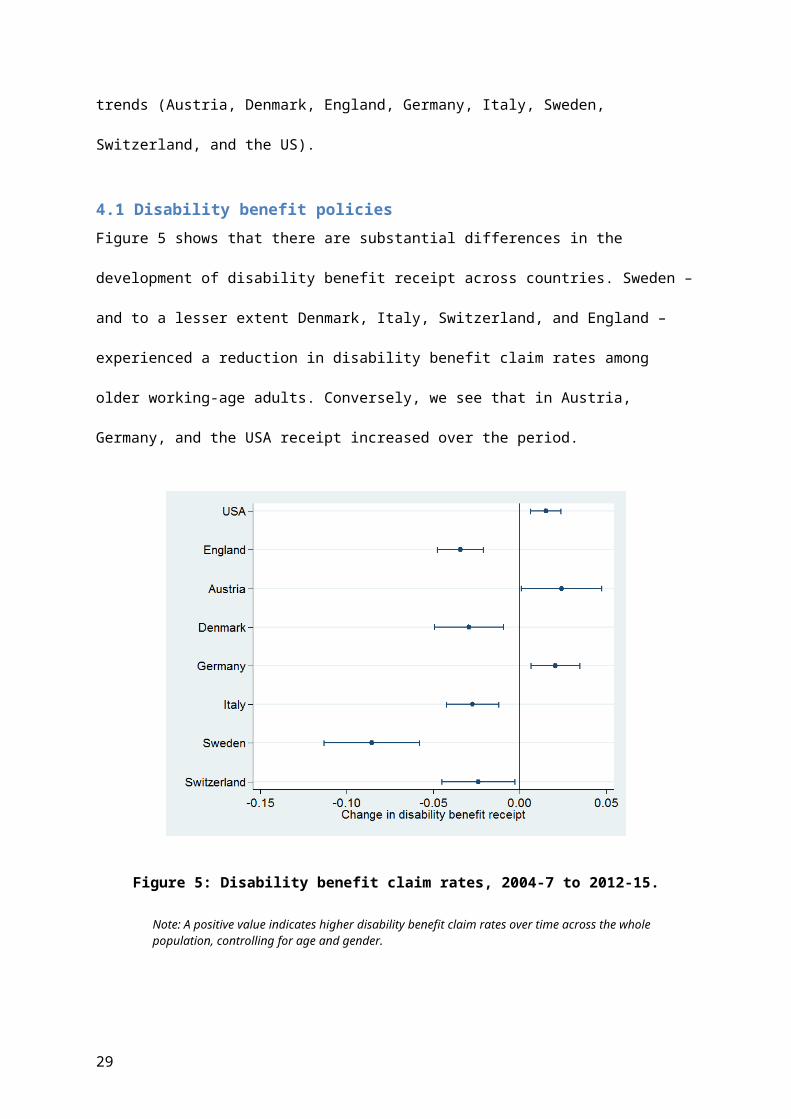
4.1 Disability benefit policiesFigure 5 shows that there are substantial differences in the development of disability benefit
receipt across countries. Sweden – and to a lesser extent Denmark, Italy, Switzerland, and
England – experienced a reduction in disability benefit claim rates among older working-age
adults. Conversely, we see that in Austria, Germany, and the USA receipt increased over the
period.
Figure 5: Disability benefit claim rates, 2004-7 to 2012-15.
Note: A positive value indicates higher disability benefit claim rates over time across the whole population, controlling for age and gender.
There is some overlap between the trends in employment rates and the trends in disability
benefit claim rates among those with poor health: both claims and the health-related
5 For this section only we use logit rather OLS models, because to the extent that OLS and logit models diverge, this will be particularly apparent for rare outcomes such as disability benefit receipt.
21

employment gap fall in Sweden, and both of these rise in the USA (and more tentatively in
Austria). However, this does not necessarily indicate a causal link from disability benefit
claims to non-employment. Moreover, there is not necessarily relationship between these
trends. The health-related employment gaps for Germany, Italy, Denmark, Switzerland, and
England have been effectively static, despite non-negligible changes – in contrasting
directions – in disability benefit receipt.
Further complexities around disability benefit receipt, work and health
One caveat on Figure 5 is that it considers the whole population, rather than just those in
poor health – and we have already noted that disability benefits are targeted at those in poor
health to differing extents in different countries (Croda, et al., 2015), notwithstanding the
incomplete observability of health/disability in the micro-data. In Online Appendix A5 (Figure
A2), we disaggregate the trend in disability benefit receipt by health. This emphasizes that
disability benefit trends are concentrated on those in poor health, but we nevertheless do
see small significant trends in disability benefit receipt among the top two health tertiles in
Denmark, Italy, Sweden (all showing declines), and Austria (showing a rise).
A further finding is that in some countries, there are non-negligible proportions of disability
benefit claimants who also work (even if this is prohibited in other countries) – this has been
briefly noted elsewhere (Hogelund, 2003:161, OECD, 2003 Chart 3.7), but nevertheless
seems to be ignored in wider policy debates. This illustrates a further possible break in the
disability benefit-employment link: if people who receive disability benefits are already
working, then any changes in their disability benefit receipt cannot make them more likely to
be in employment. We therefore split trends in disability benefit claim rates by claimant
working status and show the results in Online Appendix A5 (Figure A3). The trends for
simultaneously claiming and working are imprecisely estimated given the small numbers
involved in many countries, but it seems that some reforms target working claimants
differently to non-working claimants. For example, Denmark reduced the number of non-
22

working claimants while the number of employed claimants did not change, whereas
Sweden seems to have reduced the numbers of both types of claimants.
Policy, disability benefit receipt, and employment
We finally explore the role of disability benefits policy, rather than disability benefits receipt,
in the employment of persons with poor health. As we showed in Figure 1, many countries
have not only been reducing the generosity of their benefits, but have also been trying to
make them more activating. It is perhaps unsurprising that the majority of countries have
therefore seen a decline in disability benefit claims. Yet the USA and Austria stand out once
more here: the only country that has implemented weaker reforms than Austria is the USA,
whose policy in this area has been effectively static (for one discussion of the politics of this,
see Morris, 2016). While a comprehensive discussion of policy changes in the participating
countries would exceed the scope of this article, Online Appendix A8 provides further details
on salient reforms and reform trajectories 2000 to 2013, using both quantitative policy
indicators and qualitative information from the literature. It is noteworthythat the countries
where we observe more positive dynamics in the health employment gap (Sweden, and to a
lesser extent the UK and Switzerland) carried out major – albeit diverse – reforms around in
the middle of our observation period.
We should stress that these observations are not meant to substitute for more detailed policy
evaluations (such as those that we have cited above), but rather aim to complement such
evaluations by asking different questions of different data. We return to the relationship
between these different approaches in the Discussion below.
laborlabor4.2 Hours of workWhile part-time work is more common among workers with poor health (see Online
Appendix A5, Figure A4), there is little evidence that changes between part-time and full-
time work explain different trends across countries. Figure 6 displays trends in the
employment of workers with ill health, split by the number of regular working hours per week.
23
(The table is given in Online Appendix A5, Table A9.) The number of workers who work
fewer than 15 hours/week did not change in most countries in our sample, with the exception
of Germany (which saw greater rises in small part-time than in larger part-time or full-time
work). We do observe increases in the number of workers who worked between 15 and 29
hours/week in some countries, and a contrasting trend in Sweden. However, we generally
find that trends in employment are similar to trends in full-time work (30+ hours/week): they
generally rose (particularly in Sweden), but fell in the USA.
Figure 6: Change in work status, by hours worked 2004-5 to 2014-15, bottom health tertile.
Note: A positive value indicates rises in the particular working category (labelled on the y-axis), controlling for age and gender.
4.3 Transitions in/out of workWe previously suggested that the retention of workers with poor health might be much more
important for relative employment rates than the recruitment of disability benefit claimants.
There is also reason to believe that these will differ internationally, given evidence that there
are national cultures of human resource strategies and indeed of ‘employment regimes’
more broadly (Gallie, 2009).6 In this section, we therefore analyze if there is any evidence for
6 For example, employers in Denmark, Sweden, and the Netherlands have a greater propensity to use accommodation and development strategies than those in Germany, Italy, and Poland (Van Dalen, et al., 2014). Danish employers are particularly unlikely to use measures that favour labour market exit and, overall, situations
24
Not working
Working <16hrs/wk Working 30+hrs/wk
Working 16-29hrs/wk

country-specific changes in recruitment/retention patterns (potentially indicative of changing
human resource management cultures) that may partly explain the USA’s unique trajectory.
One way of examining this is through job tenure – the length of time that current workers
have been in their present job – to see whether those who have poor health have different
job retention probabilities. (The table is given in Online Appendix A5, Tables A10 and A11.)
We find only modest differences in tenure between persons with different health levels in
some countries, and no statistically significant differences in others (such as Belgium and
France). Much more pronounced, however, are differences across countries: workers in the
Anglo-Saxon countries have the shortest job tenures (an average of around 10 years per
older worker), noticeably lower than the Scandinavian countries (14 and 17 years in
Denmark and Sweden respectively), which are still below those in Central Europe and Italy
(ranging from 17 to 24 years). Yet while this is crucially important for understanding cross-
national differences at any one time, it does not seem to explain divergent trends: there is
little change over time in either overall or health-stratified job tenure, as shown in Figure 7
below.
in which firms experience recruitment problems were conducive to the implementation of accommodation and development strategies for the retention of older workers. Results for the Netherlands indicate also that – particularly in times of crisis – firms reduce the recruitment of older workers significantly, but that they also tend to make efforts to retain older workers and “spare” them from layoffs.
25

Figure 7: Change 2004-5 to 2014-15 in the tenure gap between the bottom health tertile and other health tertiles.
Note: A positive value indicates rises in tenure among those in poor health, controlling for age and gender.
An alternative way of investigating the relationship between employment and health is to
make use of the longitudinal structure of the data and examine labor market transitions
between waves; we focus on changes between the first pair of waves (2002-3 to 2004-5)
and the last pair of waves (2012-13 to 2014-15). If we first look at the recruitment rate (the
left-most columns of Table 2), we see that there have been relatively few changes in the
recruitment rate over time (there has been a sizeable drop in Switzerland, where at the same
time however baseline employment increased from 69.9% to 77.3%). What is most striking
about the retention rate is that it is much greater than the recruitment rate – across countries
people are consistently more likely to stay working than they are to move from non-work into
work. There are also several countries that have seen substantial increases in the retention
rate over time, namely Austria, Denmark, Germany, Sweden, and Italy.
26

Again, though, these do not provide clear explanations for the wider trends in employment
rates of those in poor health. We have seen that there were increases in absolute
employment rates of those in poor health over time, but this coexists with wide variation of
recruitment and retention trends. Moreover, the clearest difference between the USA and
other countries is in trends in the baseline employment rate. For most countries, the reason
that employment rates increased at the follow-up wave (i.e. that more people were working
in 2014/15 than 2006/7) is that employment was higher at the baseline wave (more people
were working in 2012/13 than in 2004/5), rather than because the wave-to-wave transition
rates changed noticeably. In the USA, in contrast, fewer people were working in 2012/13
than in 2004/5 – and it is this (rather than the slight declines in the recruitment and retention
rates) that drives their unique deterioration.
Recruitment rate1 Retention rate2 Baseline3
Country2004/52006/7
2012/32014/5
2004/52006/7
2012/32014/5
2004/52006/7
2012/32014/5
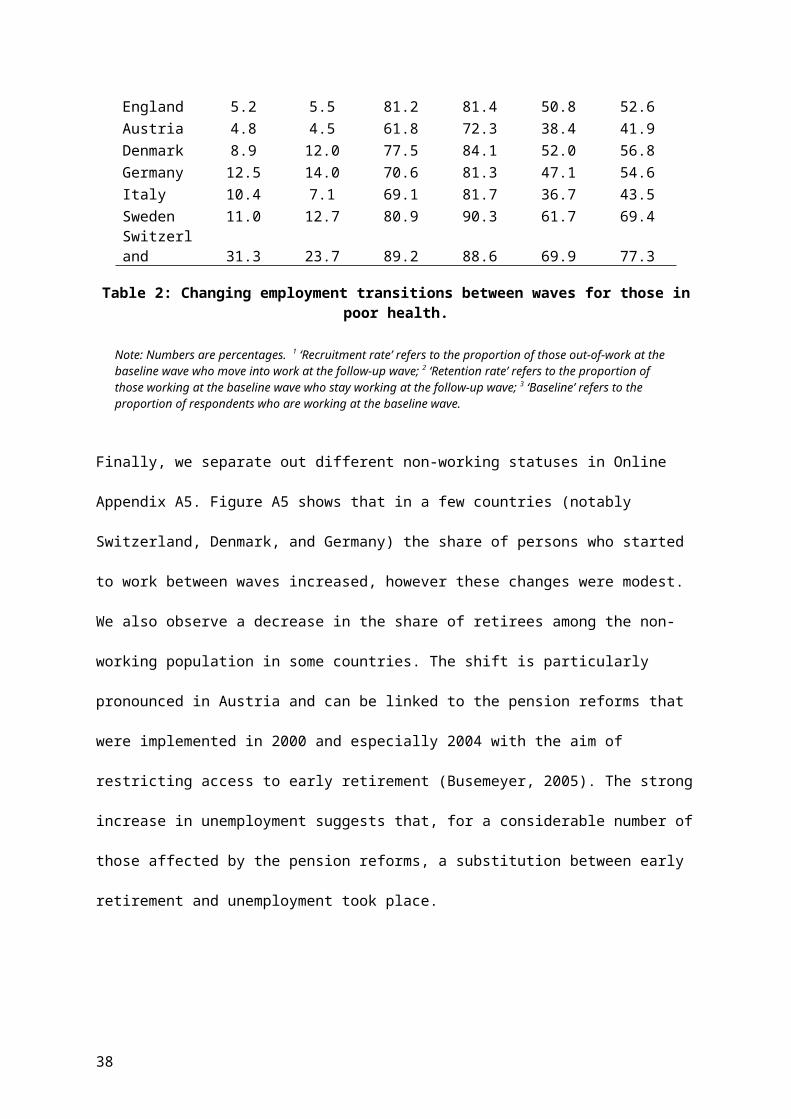
USA 7.0 6.1 80.1 78.9 47.9 38.3England 5.2 5.5 81.2 81.4 50.8 52.6Austria 4.8 4.5 61.8 72.3 38.4 41.9Denmark 8.9 12.0 77.5 84.1 52.0 56.8Germany 12.5 14.0 70.6 81.3 47.1 54.6Italy 10.4 7.1 69.1 81.7 36.7 43.5Sweden 11.0 12.7 80.9 90.3 61.7 69.4Switzerland 31.3 23.7 89.2 88.6 69.9 77.3
Table 2: Changing employment transitions between waves for those in poor health.
Note: Numbers are percentages. 1 ‘Recruitment rate’ refers to the proportion of those out-of-work at the baseline wave who move into work at the follow-up wave; 2 ‘Retention rate’ refers to the proportion of those working at the baseline wave who stay working at the follow-up wave; 3 ‘Baseline’ refers to the proportion of respondents who are working at the baseline wave.
Finally, we separate out different non-working statuses in Online Appendix A5. Figure A5
shows that in a few countries (notably Switzerland, Denmark, and Germany) the share of
persons who started to work between waves increased, however these changes were
modest. We also observe a decrease in the share of retirees among the non-working
27

population in some countries. The shift is particularly pronounced in Austria and can be
linked to the pension reforms that were implemented in 2000 and especially 2004 with the
aim of restricting access to early retirement (Busemeyer, 2005). The strong increase in
unemployment suggests that, for a considerable number of those affected by the pension
reforms, a substitution between early retirement and unemployment took place.
5. Exploring trends using contextual data
5.1 The economic recessionThis section considers how far our findings above can be explained through macroeconomic
trends, given that our period of study includes the Great Recession and its aftermath. In
Europe, the crisis had a longer duration than in the US, resulting in a ‘double-dip’ recession
in several countries, including Italy. As we can see in Table 2 below, in some countries the
overall employment rate in 2015 still compared unfavorably to 2008, and GDP levels were
either still below the pre-crisis level or had increased only modestly. Elsewhere in Europe
(particularly in Germany, Sweden, and the UK), the macroeconomic indicators provide a
more positive picture. Perhaps surprisingly, in all the countries included in our sample, the
employment rate of those aged 50-64 showed a more favorable development 2008-2015
than the overall employment rate, and in no country was the older working-age employment
rate lower in 2004 than 2015, reflecting a wider medium-term trend (Coile, 2015).
28
GDP1
(base year=100)Employment rate2
(15-64), %Employment rate3
(50-64), %2007-2015
2004-2015
2008-2015
2004-2015
2008-2015
2004-2015
USA 113.5 119.6 -2.2 -2.5 -0.6 1.6UK 109.3 116.2 1.2 1.1 4.1 5.5Austria 107.0 115.3 0.3 5.8 6.9 18.5Denmark 103.9 109.5 -4.4 -2.5 3.4 2.4Germany 112.2 116.2 3.9 9.7 9.6 20.1Italy 93.9 96.5 -2.3 -1.5 9.2 13.9Sweden 117.7 123.6 1.2 3.1 3.4 4.4Switzerland 115.0 124.6 -0.3 1.8 1.6 4.6
Table 3: Changes in macroeconomic indicators 2004 to 2015.
Notes: 1 GDP change refers to cumulative change since base year (indexing 2004 or 2007 values to 100); 2 Employment rate change refers to percentage point changes since base year (2004 or 2008; we use 2007 as the base year for GDP and 2008 for employment as there is a lag between GDP-based recession measures and employment consequences); 3 Employment rate for the United States refers to age 55-64 instead of 50-64. Source: European Commission annual macro-economic database (AMECO) Spring 2018, supplemented by OECD data for the US.
The crucial question, however, is the extent to how these trends relate to the employment of
those in poor health over the period considered here. Clearly we would expect absolute
employment rates among those in poor health to be related to economic conditions – it is for
example unsurprising that we see rising employment among those with poor health in
Sweden (or a decline for Greek men; see Online Appendix A6), given employment trends
overall. But for relative employment rates, the picture is more complex. There is an extensive
literature on the relationship of DI claims to economic conditions (Autor and Duggan, 2003,
Beatty, et al., 2000, Benitez-Silva, et al., 2010), which can crudely be summarized as
suggesting that worse economic conditions will hit those with poor health the hardest – as
Beatty et al put it, DI claims can be seen as ‘hidden unemployment’ to the extent that people
with poor health may be working in good times, but suffer from more health-selective
retention and recruitment policies in bad times.
However, employment rates among older workers in 2015 are generally higher than the pre-
recession level in 2008 (having more than recovered from any initial fall), a tendency that
29

becomes universal across the countries considered here when looking from 2004. This may
well represent increases in labor supply (prompted by financial need as pension ages rise
and pension payments fall) rather than trends in labor demand (Coile, 2015), but it is
nevertheless difficult to find evidence of a systematic decline in labor demand for older
workers that would increase health-related employment gaps. The only exception to this is
the US: although the American economy recovered quickly from the Great Recession and
was characterized by sustained growth and a steady decline in unemployment, in 2015 the
overall employment rate was still clearly below its 2008 and even 2004 level. The increasing
health-related employment gap may therefore be partly because those in poor health were
disproportionately affected by layoffs (as also suggested by Fogg, et al., 2010), although a
more recent analysis argues contrastingly that there is a longer-term downward trend that
predates the Great Recession (Livermore and Honeycutt, 2015).
Overall, for the US it is possible that macroeconomic developments partly explain the
deteriorating employment situation of those in in poor health. Beyond this, the evidence
suggests we must look beyond the effects of the crisis to explain trends in the employment
of workers with health problems.
5.2 The nature of workA further possibility is that health-related employment is influenced by trends in the nature of
work, given that those with poor health are more likely to be excluded from high-demands,
low-autonomy work (e.g. Baumberg, 2014, Johansson and Lundberg, 2004). The most
comprehensive comparative trend data source is the OECD Job Quality Database 2005-
2015, based primarily on the European Working Conditions Survey (EWCS) and
supplemented for non-European countries by a rescaled version of the International Social
Survey Programme (ISSP) survey, which the OECD finds correlates strongly with EWCS
(see OECD, 2014:111-113, 135-136).
30

The results are shown in Table 4 below. This shows that the main overall measure of work
quality – job strain – declined in nearly all of the countries studied here 2005-2015.
Moreover, the one exception is Sweden, which has seen a unique improvement in the
employment situation of those in poor health. Several caveats are needed here, including
that (i) quality of work among older workers shows slightly different patterns; (ii) there is an
implausibly large increase in physical demands in the US, which suggests that the ISSP may
be less reliable than EWCS; (iii) these trends do not fully align with those shown in the
European Social Survey – all of which are discussed further in Online Appendix A6.
Moreover, these measures do not encompass the full range of potentially relevant working
conditions. Nevertheless, there is no clear evidence that the changing nature of work
explains health-related employment trends in the countries we consider here.
CountryJob
strain1Job
autonomyLong hours
Inflexiblehours
Physicaldemands
Trend Trend Trend Trend TrendUSA -2.3 5.1 2.4 -2.3 2
UK -7.7 1.2 -0.1 -4.2 -1.5Austria -2.5 6.2 0.3 2.3 -1.4Denmark -5.0 3.1 -1.3 -3.2 -1.0Germany -16.3 4.3 -0.7 -15.9 -1.6Italy -6.0 -1.5 -0.4 -1.1 -5.1Sweden 2.3 -4.7 0.4 3.4 -0.2
Table 4: Trends in the quality of work 2005-2015.
Source: OECD Job Quality Database 2005-2015 based on the European Working Conditions Survey (US uses rescaled International Social Survey Programme data); no data are available for Switzerland. 1 Job strain is an OECD measure of high job demands (proxied by physical demands, long hours and inflexible hours) with low job resources (proxied by autonomy & learning opportunities, training & learning, and opportunity for career advancement); see OECD (2014) for details. 2 Physical demands trends in the USA seem implausible (a rise of 25.8%); see text/Online Appendix 6.
6. Conclusions
Employment trends among older workers with poor health
In many high-income countries, rising disability benefit recipiency and falling employment
rates (particularly among older workers with ill-health) since the 1980s prompted many
31

countries to reform their disability benefit systems and wider policies addressing workers
with health problems. These reforms generally reduced the generosity of benefits while
making them more activating (see Figure 1 above). Yet few studies have examined how
employment rates of older workers with poor health have changed across countries in
practice. We present new estimates of changing relative and absolute employment rates of
older workers (aged 50/51 to variable retirement ages) in 13 high-income countries from
2004-7 to 2012-15 using ELSA/SHARE/HRS data. In order to obtain a consistent measure of
health, we construct a latent health index from multiple specific health indicators using the
method suggested by Poterba, Venti, and Wise (2013).
We find that the USA is exceptional among the countries for which we have comparable
data: it has seen a unique deterioration in the employment position of older workers with ill-
health, compared to the other 12 countries we consider here. Not only did the gap between
the employment rates of those with poor health and good health increase in the USA (by
8.1%; 95% CI 4.8-11.4%), but the employment rates of those with poor health per se fell (by
4.5%, 95% CI 1.8-7.3%). In only one other country, Austria, did the health employment gap
increase (although this was not significant in all specifications), and in no other country did
the absolute employment rates of older workers with poor health fall. Indeed, in most
countries (with the exception of Greece) employment rates rose – even if these rising
employment rates were often similar to those among older workers in better health. Only in
Sweden (and possibly also England, as we find such evidence in some but not all
specifications) are there signs that the health employment gap fell over this period.
We note several limitations of our analysis. While the Poterba, Venti, and Wise (2013)
method for measuring ill-health does not require the assumption that survey respondents
interpret their general self-reported health consistently across time, it nevertheless requires
that they consistently interpret more specific health indicators over time. Although this
assumption is less strict and permits a substantial improvement on using a single general
32

health indicator, it should be borne in mind. However, we show that our results are generally
robust to a variety of sensitivity analyses (including a multiple imputation analysis to deal
with missing data).
The available data restrict our sample to older people; while ill-health is concentrated among
older workers, this may nevertheless conceal different trends among younger people with ill-
health. While this might cast doubt on the external validity of our results, there is evidence
that the disability employment gap in the US increased for the entire 16-64 age group, and
that people with disabilities were considerably more likely than others to experience
involuntary job loss 2007-13 (Mitra and Kruse, 2016). 7
Exploring these trends
In the second part of the paper, we analyzed possible explanations for these trends, firstly
using the HRS/ELSA/SHARE micro-data (to look at disability benefits recipiency, hours of
work, tenure and transitions in/out of work), and then using macro-data (to look at the
economic recession and wider trends in the nature of work). Our aim here was exploratory:
we were not conducting a full evaluation of e.g. disability benefit reforms in each country, but
rather a first search for candidate explanations among this set of key influences.
Looking first at disability benefits, we find Sweden saw falls in both employment gaps and
disability benefit recipiency, while the USA and possibly Austria saw rises in both. While
Sweden reformed both the generosity and activation of its disability benefits system, one of
the only countries that implemented fewer reforms than Austria is the USA, whose system is
effectively unchanged over this period (the only other example of this being Italy). However,
the trends diverged elsewhere. Health employment gaps were stable in Denmark, Germany,
Switzerland, and England, but disability benefit receipt rose in Germany and fell in the other
countries. Moreover, this stability in health employment gaps belies the substantial efforts in
7 2008-2018 data are from the historical tables of labor force statistics Table A-6 from the US Bureau of Labor Statistics, https://www.bls.gov/webapps/legacy/cpsatab6.htm [accessed 5/6/2018]; the standard US disability measure is based on any self-reported activity limitation/serious hearing difficulty/serious difficulty seeing. There is also a slight increase in the disability employment gap 2006-2010 in Livermore et al (2015).
33

all these countries to reform their disability benefits in the same direction as Sweden. Non-
negligible proportions of claimants also work in several countries, and clearly we cannot
expect a reduction in their benefit claims to improve employment.
We then used micro-data to examine trends in labor market factors relevant to the
employment of older workers in poor health: part-time work, job tenure, and recruitment and
retention. None of these appear likely candidate explanations for the USA’s exceptional
employment trend. Employment trends over time seem to be primarily driven by trends in
full-time work rather than shifts between other working categories (notwithstanding that
some countries did see significant trends in part-time work among older workers in poor
health). Despite considerable variations in job tenure between countries, there are few signs
of increasing/decreasing health gaps in job tenure over time. And while only some countries
have seen rises in the retention rate of older workers across survey waves (for
2012/3→2014/5 compared to 2004/5→2006/7), the main differences between the USA and
other countries in the follow-ups waves (2014/5 vs. 2006/7) are due to differences in the
baseline employment rates (in 2012/13 vs. 2004/5) rather than in the between-wave
transition probabilities.
Finally, we used wider macro-level indicators to explore whether the economic recession or
the changing nature of work were likely candidate explanations for trends in the employment
of people with health problems. Regarding the former, the overall employment rates among
older working-age people have increased 2004-2015 in all of the countries considered here,
which implies that declining labor market demand for older workers (particularly those in
poor health) is not responsible for the trends that we see. Moreover, while the extent of
these rising employment rates varies considerably, there is no clear link between the extent
of the rise and the health-related employment gap – although it is worth noting that the USA
has seen the weakest employment growth among older workers, and a declining
employment rate overall. Regarding the nature of work, job strain declined in nearly all of the
34
countries studied here 2005-2015; the one exception is Sweden, which has seen a unique
improvement in the employment situation of those in poor health. Again, there is therefore no
clear evidence that the changing nature of work explains health-related employment trends
in the countries we consider here.
Our aim here was exploratory – to provide robust new evidence on employment trends
among those in poor health across high-income countries, and to consider a variety of
possible explanations for what we find. Despite the adoption of sickness and disability
benefit program reform in most countries, there has not been a decline in the employment
gap between older workers in better vs. worse health in most countries. Our analysis here
suggests that further research should look at the role of disability benefit reform (for which
the USA is an outlier in its lack of reform) and wider macroeconomic trends (for which the
USA is an outlier in its wider decline in employment rates). Yet in neither case is it clear that
these will fully explain the pattern we find; neither reforms nor employment growth among
older workers have been sufficient to reduce the health-related employment gap in most
high-income countries.
Given the human and economic costs at stake, both the unique situation off the USA and the
wider persistence of health-related employment gaps deserve further attention. It should
also be noted that sickness and disability policies (in interaction with other labor market and
social policies) impact a broad range of non-employment outcomes, such as the receipt of
benefits, poverty rates, and well-being in general. The investigation of these interlinkages
provides a further avenue for future research.
Competing interests statement
The authors have no other competing interests to declare.
35

Acknowledgements
[Acknowledgements removed to preserve anonymity].
References
1. Alavinia, S.M., Burdorf, A., 2008. Unemployment and retirement and ill-health: a cross-sectional analysis across European countries. International archives of occupational and environmental health 82, 39-45.
2. Angelini, V., Cavapozzi, D., Paccagnella, O., 2011. Dynamics of reporting work disability in Europe. Journal of the Royal Statistical Society: Series A (Statistics in Society) 174, 621-638.
3. Autor, D.H., Duggan, M.G., 2003. The Rise In The Disability Rolls And The Decline In Unemployment. The Quarterly Journal of Economics 118, 157-205.
4. Avendano, M., Glymour, M.M., Banks, J., Mackenbach, J.P., 2009. Health Disadvantage in US Adults Aged 50 to 74 Years: A Comparison of the Health of Rich and Poor Americans With That of Europeans. American Journal of Public Health 99, 540-548.
5. Banks, J., Smith, J.P., 2012. International Comparisons in Health Economics: Evidence from Aging Studies. Annual Review of Economics 4, 57-81.
6. Barr, B., Taylor-Robinson, D., Stuckler, D., Loopstra, R., Reeves, A., Wickham, S., Whitehead, M., 2016. Fit-for-work or fit-for-unemployment? Does the reassessment of disability benefit claimants using a tougher work capability assessment help people into work? Journal of Epidemiology and Community Health 70, 452-458.
7. Baumberg, B., 2014. Fit-for-Work – or Work Fit for Disabled People? The Role of Changing Job Demands and Control in Incapacity Claims. Journal of Social Policy 43, 289-310.
8. Baumberg, B., Jones, M., Wass, V., 2015. Disability prevalence and disability-related employment gaps in the UK 1998–2012: Different trends in different surveys? Social Science & Medicine 141, 72-81.
9. Beatty, C., Fothergill, S., Macmillan, R., 2000. A Theory of Employment, Unemployment and Sickness. Regional Studies 34, 617-630.
10. Beaumaster, S., Chien, S., Lau, S., Lin, A., Phillips, D., Wilkens, J., Lee, J., 2017. Harmonized SHARE Documentation Version D.2, Gateway to Global Aging Data.
11. Benitez-Silva, H., Disney, R., Jiménez-Martín, S., 2010. Disability, capacity for work and the business cycle: an international perspective. Economic Policy 25, 483-536.
12. Böheim, R., Leoni, T., 2018. Sickness and disability policies: Reform paths in OECD countries between 1990 and 2014. International Journal of Social Welfare 27, 168-185.
13. Börsch-Supan, A., Brandt, M., Hunkler, C., Kneip, T., Korbmacher, J., Malter, F., Schaan, B., Stuck, S., Zuber, S., 2013. Data Resource Profile: The Survey of Health, Ageing and Retirement in Europe (SHARE). International Journal of Epidemiology 42, 992-1001.
14. Breeze, E., Lang, I., 2006. Physical functioning in a community context. In: Banks, J., and et al, (Eds.), Living in the 21st Century: older people in
36

England (The 2006 English Longitudinal Study of Ageing, Wave 3). Institute for Fiscal Studies, London, pp. 57-117.
15. Bryan, M.L., Jenkins, S.P., 2016. Multilevel Modelling of Country Effects: A Cautionary Tale. European Sociological Review 32, 3-22.
16. Bugliari, D., Campbell, N., Chan, C., Hayden, O., Hurd, M., Main, R., Mallett, J., McCullough, C., Meijer, E., Moldoff, M., Pantoja, P., Rohwedder, S., St.Clair, P., 2016. RAND HRS Data Documentation, Version P, RAND Center for the Study of Aging.
17. Burkhauser, R.V., Daly, M.C., McVicar, D., Wilkins, R., 2014. Disability benefit growth and disability reform in the US: lessons from other OECD nations. IZA Journal of Labor Policy 3, 1-30.
18. Busemeyer, M.R., 2005. Pension reform in Germany and Austria: system change vs. quantitative retrenchment. West European Politics 28, 569-591.
19. Cieza, A., Oberhauser, C., Bickenbach, J., Jones, R.N., Üstün, T.B., Kostanjsek, N., Morris, J.N., Chatterji, S., 2015. The English are healthier than the Americans: really? International Journal of Epidemiology, 229-238.
20. Coile, C.C., 2015. Economic determinants of workers' retirement decisions. Journal of Economic Surveys 29, 830-853.
21. Crimmins, E.M., Kim, J.K., Solé-Auró, A., 2010. Gender differences in health: results from SHARE, ELSA and HRS. European Journal of Public Health 21, 81-91.
22. Croda, E., Skinner, J., Yasaitis, L., Lindeboom, M., 2015. The Health of Disability Insurance Enrollees: An International Comparison.
23. de Jong, P., Lindeboom, M., van der Klaauw, B., 2011. Screening Disability Insurance Applications. Journal of the European Economic Association 9, 106-129.
24. Erosa, A., Fuster, L., Kambourov, G., 2012. Labor supply and government programs: A cross-country analysis. Journal of Monetary Economics 59, 84-107.
25. Fogg, N.P., Harrington, P.E., McMahon, B.T., 2010. The impact of the Great Recession upon the unemployment of Americans with disabilities. Journal of Vocational Rehabilitation 33, 193-202.
26. Franche, R.-L., Cullen, K., Clarke, J., Irvin, E., Sinclair, S., Frank, J., et al, 2005. Workplace-Based Return-to-Work Interventions: A Systematic Review of the Quantitative Literature. Journal of Occupational Rehabilitation 15, 607-631.
27. Gallie, D., 2009. Employment regimes and the quality of work. Oxford University Press, Oxford.
28. Geiger, B.B., 2017. Benefits conditionality for disabled people: Stylized facts from a review of international evidence and practice. Journal of Poverty and Social Justice 25, 107-128.
29. Geiger, B.B., van der Wel, K.A., Tøge, A.G., 2017. Success and failure in narrowing the disability employment gap: comparing levels and trends across Europe 2002–2014. BMC Public Health 17, 928.
30. Hellevik, O., 2009. Linear versus logistic regression when the dependent variable is a dichotomy. Quality & Quantity 43, 59-74.
31. Hogelund, J., 2003. In search of effective disability policy: comparing the developments and outcomes of the Dutch and Danish disability policies. Amsterdam Univ. Press, 2003, Amsterdam.
32. Johansson, G., Lundberg, I., 2004. Adjustment latitude and attendance requirements as determinants of sickness absence or attendance.
37
Empirical tests of the illness flexibility model. Social Science & Medicine 58, 1857-1868.
33. Jones, M.K., 2006. Is there employment discrimination against the disabled? Economics Letters 92, 32-37.
34. Jones, M.K., 2007. Does part-time employment provide a way of accommodating a disability? Manchester School 75, 695-716.
35. Jürges, H., 2007. True health vs response styles: exploring cross-country differences in self-reported health. Health Economics 16, 163-178.
36. Kalwij, A., Vermeulen, F., 2008. Health and labour force participation of older people in Europe: what do objective health indicators add to the analysis? Health Economics 17, 619-638.
37. Koning, P., van Sonsbeek, J.-M., 2017. Making disability work? The effects of financial incentives on partially disabled workers. Labour Economics 47, 202-215.
38. Livermore, G.A., Honeycutt, T.C., 2015. Employment and Economic Well-Being of People With and Without Disabilities Before and After the Great Recession. Journal of Disability Policy Studies 26, 70-79.
39. Mitra, S., Kruse, D., 2016. Are workers with disabilities more likely to be displaced? The International Journal of Human Resource Management 27, 1550-1579.
40. Morris, Z., 2016. Constructing the need for retrenchment: disability benefits in the United States and Great Britain. Policy & Politics 44, 609-626.
41. OECD, 2003. Transforming Disability into Ability: Policies to Promote Work and Income Security for Disabled People. OECD, Paris.
42. OECD, 2010. Sickness, Disability and Work: breaking the barriers. A synthesis of findings across OECD countries. OECD, Paris.
43. OECD, 2014. OECD Employment Outlook 2014. OECD Publishing, Paris.44. Phillips, D., Lin, Y.-C., Wight, J., Chien, S., Lee, J., 2017. Harmonized ELSA
Documentation, Version E, Gateway to Global Aging Data.45. Poterba, J., Venti, S., Wise, D.A., 2013. Health, education, and the
postretirement evolution of household assets. Journal of Human Capital 7, 297-339.
46. Robroek, S.J., Schuring, M., Croezen, S., Stattin, M., Burdorf, A., 2013. Poor health, unhealthy behaviors, and unfavorable work characteristics influence pathways of exit from paid employment among older workers in Europe: a four year follow-up study. Scandinavian journal of work, environment & health, 125-133.
47. Scharle, Á., Váradi, B., Samu, F., 2015. Policy convergence across welfare regimes: the case of disability policies, WWWforEurope Working Paper No. 76. WWWforEurope
48. Schuring, M., Burdorf, L., Kunst, A., Mackenbach, J., 2007. The effects of ill health on entering and maintaining paid employment: evidence in European countries. Journal of Epidemiology and Community Health 61, 597-604.
49. Sonnega, A., Faul, J.D., Ofstedal, M.B., Langa, K.M., Phillips, J.W.R., Weir, D.R., 2014. Cohort Profile: the Health and Retirement Study (HRS). International Journal of Epidemiology 43, 576-585.
50. Staubli, S., 2011. The impact of stricter criteria for disability insurance on labor force participation. Journal of Public Economics 95, 1223-1235.
51. Steptoe, A., Breeze, E., Banks, J., Nazroo, J., 2013. Cohort Profile: The English Longitudinal Study of Ageing. International Journal of Epidemiology 42, 1640-1648.
38

52. Tanaka, A., Lin, H.-C., Nguyen, H., 2016. Removing Disability Insurance Coverage: The Effects on Work Incentive and Occupation Choice, Department of Economics Working Paper 2016-37. University of Calgary, Canada.
53. Trevisan, E., Zantomio, F., 2016. The impact of acute health shocks on the labour supply of older workers: Evidence from sixteen European countries. Labour Economics 43, 171-185.
54. Van Dalen, H.P., Henkens, K., Wang, M., 2014. Recharging or retiring older workers? Uncovering the age-based strategies of European employers. The Gerontologist 55, 814-824.
55. van der Wel, K.A., Dahl, E., Thielen, K., 2012. Social Inequalities in "Sickness": Does Welfare State Regime Type Make a Difference? A Multilevel Analysis of Men and Women in 26 European Countries. International Journal of Health Services 42, 235-255.
56. Whitehead, M., Clayton, S., Holland, P., Drever, F., Barr, B., Gosling, R., Dahl, E., Van Der Wel, K.A., Westin, S., Burström, B., Nylen, L., Lundberg, O., Diderichsen, F., Thielen, K., Ng, E., Uppal, S., Chen, W.-H., 2009. Helping chronically ill or disabled people into work: what can we learn from international comparative analyses?, Final report to the Public Health Research Programme, Department of Health.
57. Wise, D.A., 2017. Social Security Programs and Retirement Around the World: The Capacity to Work at Older Ages. University of Chicago Press for the National Bureau of Economic Research (NBER), Chicago.
58. World Bank, WHO, 2011. World Report on Disability. World Health Organization (WHO), Geneva.
39