Embed Size (px)
Citation preview

a LA-U R-gQ- Approved for public release; distribution i s unlimited.
TlTL E:
AUTHOR(S):
SUBMITED TO:
Los Alamos
LCS/CINDER '90 ACCELERATOR TUNNEL ACTIVATION CALCULATIONS FOR THE APT 1700-MeV ACCELERATOR TUNNEL
J. D. Court, X-CI E.C. Snow, X-CI W.B. Wilson, T-2 E.J. Pitcher, APT-TPO
Submitted to 1998 Topical Meeting on Radiation Protection and Sheilding, April 20-24, 1998, Nashville TN
N A T I O N A L L A B O R A T O R Y Los Alamos National Laboratory, an affirmative actiodequal opportunity employer, is operated by the University of California for the U.S. Department of Energy under contract W-7405-ENG-36. By acceptance of this article, the publisher recognizes that the US. Government retains a nonexclusive, royalty-free license to publish or reproduce the published form of this contribution, or to allow others to do so, for US. Government purposes. The Los Alamos National Laboratory requests that the publisher identify this article as work performed under the auspices of the U.S. Department of Energy. The Los Alamos National Laboratory strongly supports academic freedom and a researcher's right to publish; as an Institution, however, the Laboratory does not endorse the viewpoint of a publication or guarantee its technical correctness.
Form No. 836 R5 ST 2629 10191
This report was prepared as an account of work sponsored by an agency of the United States Government. Neither the United States Government nor any agency thereof, nor any of their employees, makes any warranty, express or implied, or assumes any legal liability or responsibility for the accuracy, completeness, or use- fulness of any information, apparatus, product, or process disclosed, or represents that its use would not infringe privately owned rights. Reference herein to any spc- cific commercial product, process. or service by trade name. trademark, manufac- turer, or otherwise does not necessarily constitute or imply its endorsement, ream- mendzttion. or favoring by the United States Government or any agency thereof. The views and opinions of authors expressed herein do not necessarily state or reflect those of the United States Government or any agency thereof.

DISCLAIMER
Portions of this document may be illegible in electronic image products. Images are produced from the best available original document.

LCS/CINDER'90 ACCELERATOR TUNNEL ACTIVATION CALCULATIONS FOR THE APT 1700-MeV ACCELERATOR TUNNEL
John D. Court, Edward C. Snow, William B. Wilson, and Eric J. Pitcher
Abstract
Calculations have been done to determine the amount of activation in the linac components and tunnel air for the Accelerator Reduction of Tritium 1700-MeV super-conducting linac. Proton transport is accomplished through the use of the LAHET Code System. Particle production and depletion from proton and high-energy neutron reactions, calcu- lated in LAliET, as well as low-energy neutron fluxes calculated by MCNP, are passed to the radionuclide production code CINDER90 to determine the source terms at various times after irradiation. The upper limit on total air activation based on conservative assumptions, for the entire tunnel air volume, was found to be 4.77 Ci after a nine-month irradia- tion. This is reduced to 0.09 Ci after a 10-hour cooling off period. The total activation for the full l-km of beamline components was found to be less than 4 kCi, with the half-lives of the highest contributors ranging from 12 years to 2 minutes. This beamline component activation calculation was done for an irradiation time of 40 years, which is the an- ticipated lifetime of the super-conducting linac.
1. INTRODUCTION
The proposed Accelerator Production of Tritium (APT) accelerator will be a 1700-MeV super-conducting linac, ap- proximately l-km in length. Calculations have been done to determine tunnel component activation and radionuclide inventories in support of the APT Environmental Impact Statement (EIS).
The calculations were done using the LAHETm Code System (LCS)' to determine nuclide production rates and flux levels in the accelerator beamline components and tunnel air. These flux values were then passed to the CINDER'9OU code to determine activation, decay, and radionuclide inventories. Air activation was calculated after a nine-month irra- diation, as well as after several decay periods. This calculation provides a source term for the EIS loss of confinement accident (tunnel purge of normally activated air without delay). The beamline component activation calculation pro- vides radionuclide inventories for the shutdown and decommissioning of the accelerator after the proposed 40-year op- erational lifetime. This source term is also used for the EIS.
A detailed model of the accelerator beamline and tunnel was constructed for Monte Carlo calculations using the LCS. LAHET transports charged particles, and neutrons down to a cutoff energy of 20 MeV. All neutrons 20 MeV and below are then written to a source file for use in MOPd. The flux values in regions of interest are then tallied and used by CINDER'90 to determine radioisotope production and decay. The calculated values were then scaled to assume lO-nA/m beam spill over the full l-km linac length. Fourteen different material regions were used to identify the nu- clides with the highest activities after irradiation.
2. LAHET CODE SYSTEM
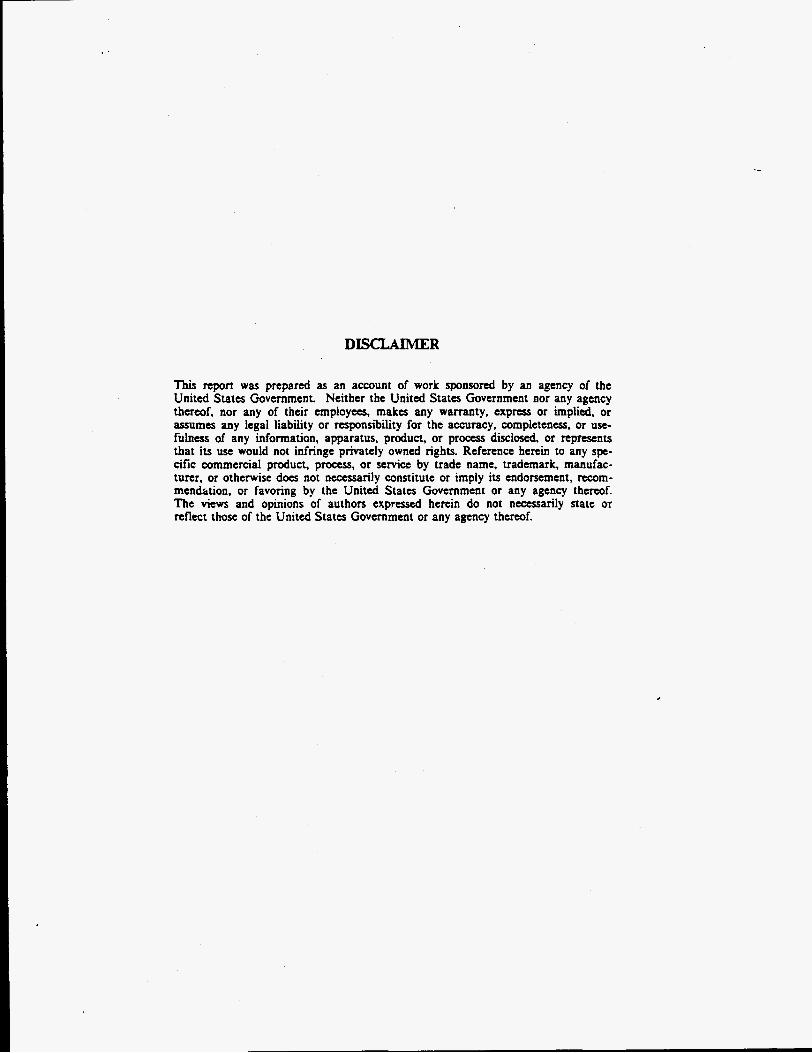
The LAHET Code System is a descendent of the HETC code5 originally developed at Oak Ridge National Labora- tory ( O W ) in the 1960's. Unless otherwise noted, the default settings, as reported in the LCS user's guide,' were used in the LAHET calculations in this report. The exceptions are shown in Table 1. In LAHET, with these settings, the Bertid model is used to simulate the intranuclear cascade phase. The multi-stage pre-equilibrium model' is then in- voked prior to the evaporation phase. The Dresnera evaporation model is used for the evaporation of nucleons from the excited nucleus, except for the case of light nuclei, when it is replaced by the Fermig breakup model. LAHET version 2.83'' was used, including the new neutron and proton elastic scattering treatment.
N LAHET and MCNP are trademarks of the Regents of the University of California, Los Alamos National Laboratory.
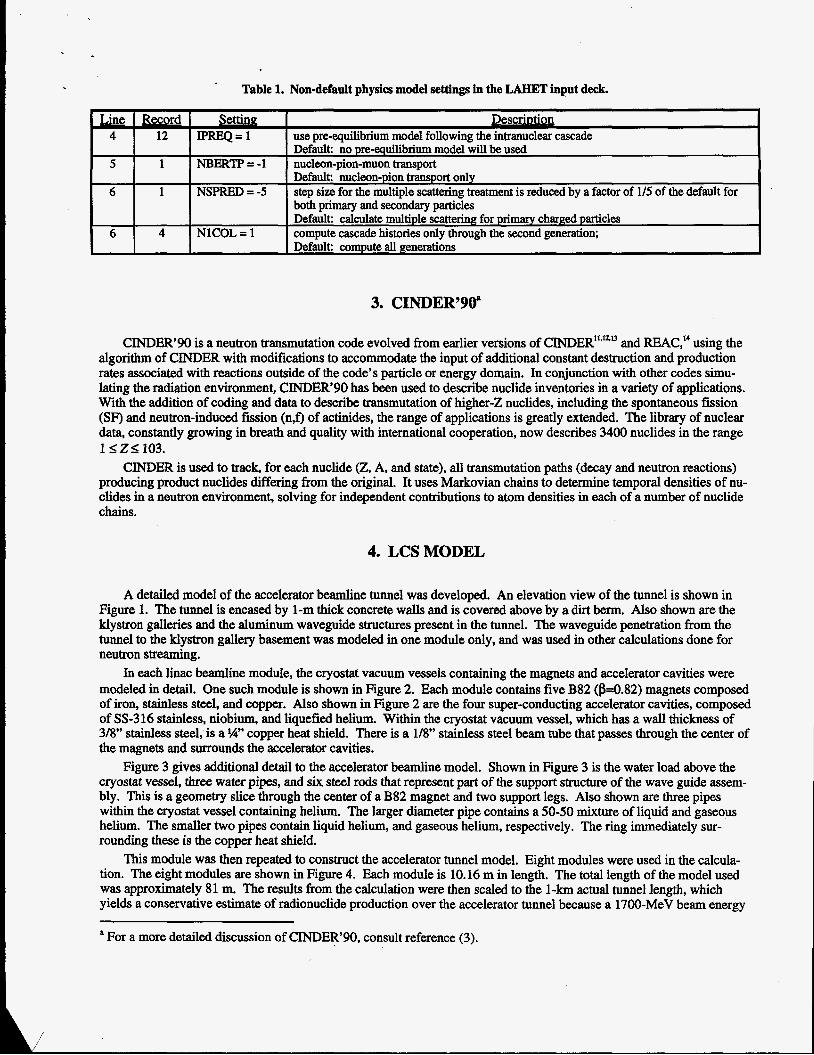
Table 1. Non-default physics model settings in the LAHET input deck.
3. CINDER’90’
CINDER’90 is a neutron transmutation code evolved from earlier versions of and REAC,” using the algorithm of CINDER with modifications to accommodate the input of additional constant destruction and production rates associated with reactions outside of the code’s particle or energy domain. In conjunction with other codes simu- lating the radiation environment, CINDER’90 has been used to describe nuclide inventories in a variety of applications. With the addition of coding and data to describe transmutation of higher-2 nuclides, including the spontaneous fission (SF) and neutron-induced fission (n,f) of actinides, the range of applications is greatly extended. The library of nuclear data, constantly growing in breath and quality with international cooperation, now describes 3400 nuclides in the range 1 < Z S 103.
producing product nuclides differing from the original. It uses Markovian chains to determine temporal densities of nu- clides in a neutron environment, solving for independent contributions to atom densities in each of a number of nuclide chains.
CINDER is used to track, for each nuclide (Z, A, and state), all transmutation paths (decay and neutron reactions)
4. LCSMODEL
A detailed model of the accelerator beamline tunnel was developed. An elevation view of the tunnel is shown in Figure 1. The tunnel is encased by 1-m thick concrete walls and is covered above by a dirt berm. Also shown are the klystron galleries and the aluminum waveguide structures present in the tunnel. The waveguide penetration from the tunnel to the klystron gallery basement was modeled in one module only, and was used in other calculations done for neutron streaming.
In each linac beamline module, the cryostat vacuum vessels containing the magnets and accelerator cavities were modeled in detail. One such module is shown in Figure 2. Each module contains five B82 (84.82) magnets composed of iron, stainless steel, and copper. Also shown in Figure 2 are the four super-conducting accelerator cavities, composed of SS-316 stainless, niobium, and liquefied helium. Within the cryostat vacuum vessel, which has a wall thickness of 318” stainless steel, is a W copper heat shield. There is a 1/8” stainless steel beam tube that passes through the center of the magnets and s m u n d s the accelerator cavities.
Figure 3 gives additional detail to the accelerator beamline model. Shown in Figure 3 is the water load above the cryostat vessel, three water pipes, and six steel rods that represent part of the support structure of the wave guide assem- bly. This is a geometry slice through the center of a B82 magnet and two support legs. Also shown are three pipes within the cryostat vessel containing helium. The larger diameter pipe contains a 50-50 mixture of liquid and gaseous helium. The smaller two pipes contain liquid helium, and gaseous helium, respectively. The ring immediately sur- rounding these is the copper heat shield.
This module was then repeated to construct the accelerator tunnel model. Eight modules were used in the calcula- tion. The eight modules are shown in Figure 4. Each module is 10.16 m in length. The total length of the model used was approximately 81 m. The results from the calculation were then scaled to the 1-km actual tunnel length, which yields a conservative estimate of radionuclide production over the accelerator tunnel because a 1700-MeV beam energy
* For a more detailed discussion of CINDER‘90, consult reference (3).
is used in the calculation. In reality, the beam energy is 1700 MeV only at the eni. of the 1-km path. The beam is trans- ported in the positive z-direction, entering module 7 first, then 6,5,4, etc. To eliminate end effects, only modules 2,3, and 4 were used for tallying purposes.
- - - a . I _ _
Figure 1. Elevation view of the MCNP geometry model.
I * \ 1
Figure 3. Detail of inner-tunnel components.
Figure 2. MCNP geometry plot of one accelerator beam- line module.
Figure 4. MCNP geometry plot of the LCS model show- ing the 8 modules. Each module is 10.16 m long.
5. CALCULATION
The CINDER90 activation calculation is independent of the problem geometry. CINDER90 only requires the volume of material, its density and cross sections, and the flux values for that volume of material. This is accomplished by dividing the model into separate regions containing different materials and computing the flux in those regions. Then those fluxes and volumes can be passed for the activatioddecay calculations. Table 2 shows the thirteen regions in the model for which activation calculations were done in CINDER’90. By convention, the regions are identified by the MCNP tally number of the flux tally in that region. Also included in the table are the material numbers associated with the region and a description of the type of component(s) contained in the region. These regions encompass all materials interior to the accelerator tunnel in modules 2,3, and 4. These are the modules in which the flux tallies have been com- puted. The locations of these modules were chosen to eliminate the end effects present in the truncated model of the 1- km long accelerator tunnel.

CINDER'90 reciives flux values from MCNP. Both LAHET and MCNF' use the same input geometries for their re- spective calculations. LAHET computes, and passes to CINDER90, the spallation product inventories from spallation events occurring in the regions of interest, the production of nuclides from neutron and proton induced reactions, as well as the depletion rate caused by alI charged particle reactions and neutron induced reactions. All charged particle trans- port is done in LAHET, as well as neutron transport of all neutrons above 20 MeV. LAHET first starts protons along a cylindrical surface located just inside the stainless-steel beam tube. This proton source consists of a cylinder of radius 7.95 cm, stretching from z = -5898 cm to z = 2395 cm, with protons launched in the positive z-direction at an angle of 1' with respect to the positive z-axis. These protons undergo spallation events in the beamline materials, causing spallation product and neutron production. These neutrons are transported in LAHET until they escape the model or downscatter to an energy of 20 MeV.
Table 2. Thirteen regions in the CINDERYO calculation. Volumes are in cubic centimeters.
Once a neutron's energy falls to 20 MeV or below, its vital statistics are written to a source file for use by MCNP. MCNP will begin transport of the neutron preserving its energy, position, and direction, and will transport until the neu- tron escapes the system or reaches a predetermined cutoff energy. MCNP tallies a track-length estimate of the flux in the regions of interest for later input into CINDER90. These flux tallies, calculated by MCNP, are time averaged over all cells in the tally regions containing the material of interest.
Figures 5 through 8 show flux maps of the accelerator tunnel region." These were done with special versions of MCNP and LAHET, which tally fluxes in rectangular arrays. Two 200x200 arrays were used for these tallies. For Fig- ures 5 and 7, the array was paallel to the xz-plane at y=O, and extended 1 m above and below the beam centerline. For Figures 6 and 8, the array was parallel to the xy-plane at z=O, and extended 1 m on each side of the A plane. The areas in which the highest fluxes occur are in the B82 magnets, where spallation neutron production is the primary source of neutrons in the accelerator tunnel. These magnets can be easily identified in both Figures 5 and 7 as the dark high-flux meas in the beamline. The two outer lines plot the inside edge of the tunnel and the two inner lies represent the outer limits of the cryostat vacuum vessel. In Figures 6 and 8, the outline of the tunnel walls, the waveguide port, three water pipes, the outer wall of the cryostat vacuum vessel, and the outer wall of the copper heat shield have been added for ref- erence. The streaming nature of the high-energy neutrons in Figures 5 and 6 can be contrasted with the almost homoge- neous nature of the low-energy neutrons in Figures 7 and 8.
MCNP gives flux values normalized to the total number of source protons. This allows the flux to be scaled with the current of the proton beam. For this calculation, an estimate of 10 nA/m was used for the beam current loss during normal operations. An example of the flux values passed from MCNP to CINDERPO is shown in Table 3. Table 3 shows the flux values calculated by MCNP for all air-containing regions in the accelerator tunnel. The fluxes are calcu- lated in 63-group format to correspond with the 63-group data libraries used by CINDER'90 in the calculation. Since MCNP has an energy limit of 20 MeV, the 20-25 MeV energy group flux is zero. All data passed to CINDER'BO for this group is passed in separate files from LAHET. A flux fde for each of the thirteen regions of interest, shown in Table 2, is passed from MCNP to CINDERPO.

$" Jw
0
-loo0
- 1 5 w
-2500
-3000
-3500
--.
Figure 5. Neutron flux for energies above 20 MeV. The tally array extends 1 m above and below the beam center- line.
-Ym
-1000
- 1 5 w
-m
-3Jw
--?
ern
%so0
so0
400
2w
0
-xKI
Figure 6. Neutron flux for energies above 20 MeV. Beam centerline is at (0,O). The array tallies 1 m on each side of the z=O plane.
#x ) -
400-
m -
0 -
-zw
4
Figure 7. Neutron flux for energies below 20 MeV. The tally array extends 1 m above and below the beam center- line.
Figure 8. Neutron flux for energies below 20 MeV. Beam centerline is at (0,O). The array tallies 1 m on each side of the z=O plane.
Irradiation and cooling times are input parameters to the CINDER'90 code. For this calculation, two irradiation times are important. For the air activation calculation, the most conservative result would come from air activated for the full 9-month operation of the accelerator. To determine deactivation and decommissioning (D&D) radiation levels for accelerator components, the full 40-year irradiation history is required. Therefore, a 9-month irradiation time was calculated, followed by several cooling times, up to three months, for air activation results. The irradiation then pro-
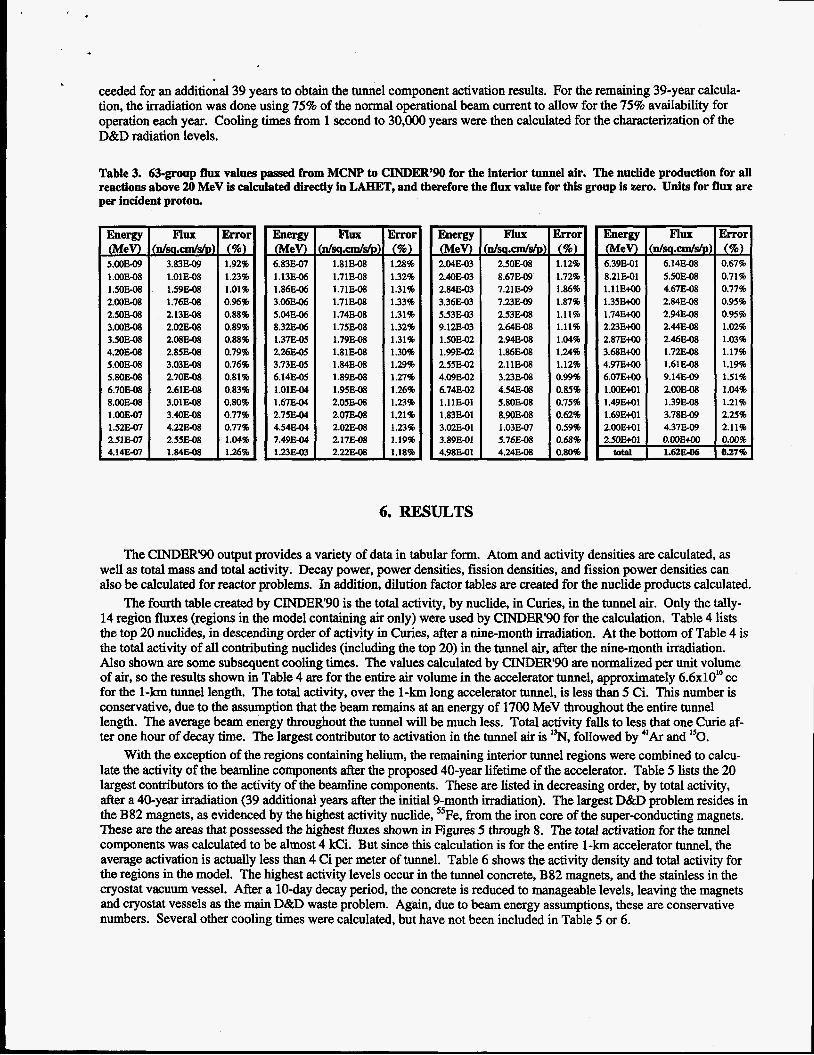
ceeded for an additional 39 years to obtain the tunnel component activation results. For the remaining 39-year calcula- tion, the irradiation was done using 75% of the normal operational beam current to allow for the 75% availability for operation each year. Cooling times from 1 second to 30,000 years were then calculated for the characterization of the D&D radiation levels.
Table 3. 63-group flux values passed from MCNP to CINDER'W for the interior tunnel air. The nuclide production for all reactions above 20 MeV is calculated directly in LAHET, and therefore the flux value for this group is zero. Units for flux are per incident proton.
EnergJr 0 5.00E-09 1.00E-08 1.503-08 2.00- 2.50- 3.00E-08 3.503-08
5.00E-08 5.80E-08 6.703-08 8.00E-08 1.OOF.47 1.52B-07 251E-07 4.14E-W
4 . 2 0 ~ ~ ~
-
Flux
3.83E-09 1.01E-08 1.59E-08 1.763-08 2.13E-08 2.02E-08 2.08E-08 285E-08 3.03E-08 270E-08 261E-08 3.01E-08 3.40E-08 4.223-08 2.55E-08 1.84-
dSq.cmldV, Errol m 1.92% 1.23% 1.01% 0.96% 0.88% 0.89% 0.88% 0.79% 0.76% 0.81% 0.83% 0.80% 0.77% 0.77% 1.04% 1.26% -
- Energy 0 6.83F.47 1.138-06 1.868-06 3.068-06 5.048-06 8.32&06 1.37E-05 226E-05 3.73E-05 6.143-05 1.01E-04 1.67E-04 2.756-04 4.546-04 7.49E-04 1.23E-03 -
Flux n/Sq.Un/s/P;
1.81E-08 l.7lE-08 1.71EO8 1.713-08 1.743-08 1.75E-08 1.793-08 1.81E-08 1.84E-08 1.89- 1.95E-08 2.05E-08 207E-08 2023-08 217E-08 2.22E-08
Errol m 1.28% 1.32% 1.31% 1.33% 1.31% 1.32% 1.31% 1.30% 1.29% 1.27% 1.26% 1.23% 1.21% 1.23% 1.19% 1.18% -
- Energy (MeV) 204E-03 2.40E-03 2.84E-03 3.36E-03 5.53E-03 9.12E-03 1.5oE-02 1.99E-02 25- 4.09E-02 6.74E-02 l.llE-O1 1.83E-01 3.02B-01 3.89E-01 4.98E-01 -
Flux n/sq.cmldp)
2.503-08 8.67E-09 7.21- 7.23H-09 253E-08 2.643-08 2.94E-08 1.863-08 2.11E-08 3.233-08 4.543-08 5.80E-08 8.90E-08 1.03E-07 5 . 7 6 W 4.24EO8
Error E L 1.12% 1.72% 1.86%
1.11% 1.11% 1.04% 1.24% 1.12% 0.99% 0.85% 0.75% 0.62% 0.59% 0.68% 0.80%
1.87%
-
- Energy 0 6.39E-01 8.21E-01 l.llE+oo 1.35- 1.74EWO 2.23EtW 2.87B+oo 3.68E+oo 4.97E+oo 6.07E+OO 1.00E+o1 1.49M1 1.69M1 200Eto1
Flux dSq.cmls/P,
6.14E-08 5.50E-08 4.67E-08 2.84E-08 2.94E-08 2.44E-08 2.46E-08 1.72E-08 1.61E-08 9.143-09 2.00E-08 1.39E-08 3.783-09 4.37- O.OO&OO 1623-06
Error 0 0.67% 0.71% 0.77% 0.95% 0.95% 1.02% 1.03% 1.17% 1.19% 1.51% 1.04% 1.21% 225% 2.11% 0.00% 0.27% - -
6. RESULTS
The CINDER90 output provides a variety of data in tabular form. Atom and activity densities are calculated, as well as total mass and total activity. Decay power, power densities, fission densities, and fission power densities can also be calculated for reactor problems. In addition, dilution factor tables are created for the nuclide products calculated.
The fourth table created by CINDER90 is the total activity, by nuclide, in Curies, in the tunnel air. Only the tally- 14 region fluxes (regions in the model containing air only) were used by CINDER90 for the calculation. Table 4 lists the top 20 nuclides, in descending order of activity in Curies, after a nine-month irradiation. At the bottom of Table 4 is the total activity of all contributing nuclides (including the top 20) in the tunnel air, after the nine-month irradiation. Also shown are some subsequent cooling times. The values calculated by CINDER90 are normalized per unit volume of air, so the results shown in Table 4 are for the entire air volume in the accelerator tunnel, approximately 6.6~10" cc for the 1-km tunnel length. The total activity, over the 1-km long accelerator tunnel, is less than 5 Ci. This number is conservative, due to the assumption that the beam remains at an energy of 1700 MeV throughout the entire tunnel length. The average beam energy throughout the tunnel will be much less. Total activity falls to less that one Curie af- ter one hour of decay time. The largest contributor to activation in the tunnel air is I%, followed by "Ar and "0.
With the exception of the regions containing helium, the remaining interior tunnel regions were combined to calcu- late the activity of the beamline components after the proposed 40-year lifetime of the accelerator. Table 5 lists the 20 largest contributors to the activity of the beamline components. These are listed in decreasing order, by total activity, after a 40-year irradiation (39 additional years after the initial 9-month irradiation). The largest D&D problem resides in the B82 magnets, as evidenced by the highest activity nuclide, "Fe, from the iron core of the super-conducting magnets. These are the areas that possessed the highest fluxes shown in Figures 5 through 8. The total activation for the tunnel components was calculated to be almost 4 kci. But since this calculation is for the entire 1-km accelerator tunnel, the average activation is actually less than 4 Ci per meter of tunnel. Table 6 shows the activity density and total activity for the regions in the model. The highest activity levels occur in the tunnel concrete, B82 magnets, and the stainless in the cryostat vacuum vessel. After a 10-day decay period, the concrete is reduced to manageable levels, leaving the magnets and cryostat vessels as the main D&D waste problem. Again, due to beam energy assumptions, these are conservative numbers. Several other cooling times were calculated, but have not been included in Table 5 or 6.
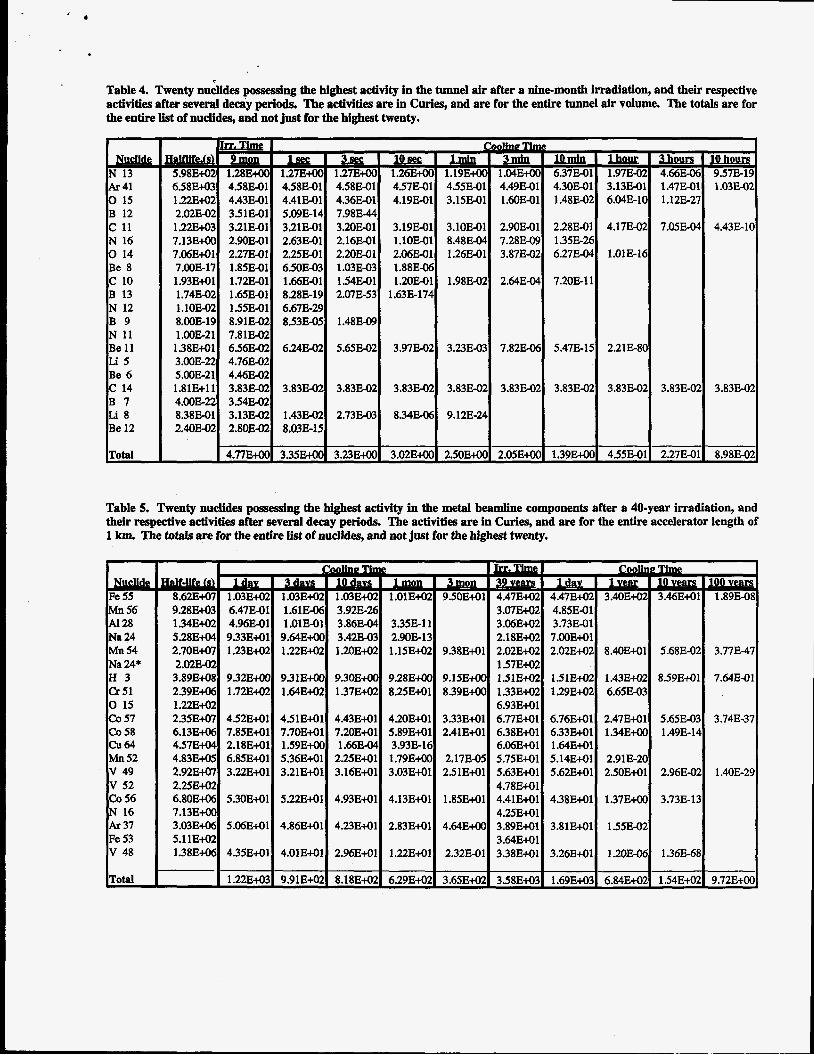
Table 4. Twenty nuhides possesSing the highest activity in the tunnel air after a nine-month irradiation, and their respective activities after several decay periods. The activities are in Curies, and are for the entire tunnel air volume. The totals are for the entire list of nuclides, and not just for the highest twenty.
Nuclide N 13 Ar 41 0 15 B 12 c 11 N 16 0 14 Be 8 c 10 B 13 N 12 B 9 N 11 Be 11 Li5 Be 6 C 14 B 7 L i 8 Be 12
Total
6.58E43 4.58-1 4.58E-01 4.58E-01 4.573-01 4.55E-01 4.49E-0 1.22E-102 4.43E-01 4.41E-01 4.36E-01 4.19E-01 3.15E-01 1.60E-0 2.023-02 351E-01 5.093-14 798344 1.22E+O3 3.21E-01 3.21E-01 3.20E-01 3.19E-01 3.10E-01 2.90E-0 7.13E-140 2.9OE-01 2.63301 2.16-1 l.lOE-O1 8.48304 7.28E-0 7.06E+Ol 2.273-01 2.25E-01 2.20E-01 2.06E-01 1.26E-01 3.87E-0 7.003-17 1.85E-01 6.50-3 1.03E-03 1.883-06 1.93M1 1.72E-01 1.66E-01 154E-01 1.20E-01 1.98302 2.64E-0 1.74E-02 1.65E-01 8.283-19 2.073-53 1.633-174 1.10302 155E-01 6.673-29 8.003-19 8.91302 8.53E-05 1.483-09 1.00E-21 7.81E-02 1.38W1 65613-02 6.24E-02 5.65E-02 3.97E-02 3.23E-03 7.82320 3.00E-22 4.76E-02 5.003-21 4.46E-02 1.81E+ll 3.833-02 3.833-02 3.833-02 3.83E02 3.83E-02 3.83E-0 4.003-22 354E-02
2.40E-02 2.80E-02 8.03E-15 8.383-01 3.13302 1.43E-02 2.73E-03 8.34E-06 9.12E-24
4.773+00 3.35E+OO 3.23E-I40 3.02E+OO 2.50EcOo 2.05E+O
4.30-1 3.13E-0 1.483202 6.043-11
2.28E-01 4.17E-O 1.35E-26 6.273-04 1.01E-11
7.203-1
5.473-3 2.21E-81
3.83E-02 3.8330 4 1.39E+OO 4.55E-0
- 3h,!!x& 4.66m 1.47- 1.123-Z
7.05E-O
-
3.83E-0
2.27E-0 -
lQhQU8 957E-19 1.03W
4.43E-10
3.83E-02
8.98E-02
Table 5. Twenty nuclides possessing the highest activity in the metal beamline components after a 40-year irradiation, and their respective activities after several decay periods. The activities are in Curies, and are for the entire accelerator length of 1 km. The tom are for the entire list of nuclides, and not just for the highest twenty.
Fe 55 Ma 56 Al28 Na 24 Mn 54 Na 24* H 3 Cr 51 0 15 co 57 Co 58 cu64 Mn 52 v 49 v 52 Co 56 N 16 Ar 37 Fe 53 V 48
Total
9.28E+O3 6.47E-01 1.34E+O2 4.96E-01 5.28E+04 9.33343 2.70E+07 1 . 2 3 W 2.02342 3.893+08 9.32E+OC 2.39- 1 . 7 M 1 . 2 2 m 2 . 3 W 4.52E41 6.13- 7.85343 457E+04 2.18E+O1 4.83E+O5 6.85E41 2.92E+07 3.22E41 2.25E+02 6.803+06 5.3OEi-01 7.13E+OO 3.03E+O6 5.06E41 5.11E42 1.38346 4.35341
I 1.22343
1.61E-06 3.92E-2f 1.01E-01 3.86E44 9.64W 3.423-0: 1.22E-m 1.2oE+Oz
9.31Em 9.30E+CN 1 . 6 4 W 1 . 3 7 W
451E+O1 4.433+03 7.70E+O1 7.20E41 1.59Ei-M) 1.663-04 5.36E+01 2.25E+O1 3.21E41 3.16E41
5.22341 493E+Ol
4.86E+O1 4.23E+O1
4.01E41 2.96E41
9.91E+O21 8.18E42
335E-3-11 2.903-12 1 . 1 5 M
9.28EAK 8.25W1
4.20W1 5.89341
1.79EAK 3.03E41
4.13E+O1
2.83Wl
1.22E+o1
3.93E-1C
6.29EG -
9.38E41
9.15Ei-M 8.39Ei-M
3.33E-143 2.41Ei-01
2.17-5 2.51Ei-01
1.85E41
4 . 6 4 M
2.32E-03
3.65Ea -
3 . 0 7 W 3.06E-m 2.18Ea 2.02EG 1.57Ea 1.51Ea 1.33EG 693E+O1 6.77E-141 6.38E+O3 6.06E41 5.75E+01 5.633-1-03 4.78E+01 4.41E41 4.25E+O1 3.89W1 3.64Ei-01 3.38M1
4.85E-03 3.733-03 7.00E+01 2.02E4
6.763+03 6.33W3 1.64E41 5.14E+O1 5.62E-103
4.38E41
3.81W1
3.26E+03
8.4OE+Oll 5.68E-021 3.77E-471
1.433+02 6.65E-03
2.47E+O1 1.34E+OO
2.91E-20 2.50E41
8.59E43
5.65342 1.49ElL
2.96E-0:
7.643341
3.74E-37
1 .4OE29
1.553-02

P
Table 6. Activity density and total activity of the accelerator beamline components after a 40-year irradiation, and after a 10 day decay period. Volumes are scaled to the entire 1-km length of the accelerator, and activity is for the total 1-km length.
Region
tally 14 tally24 tally44 tally 54 tally64 tally 74 tally 84 tally 94 tally104
-
tally1 14 tally124 tally134
tallv154 tally144
Volume Description
6.59E+10 Tunnel Air 3.48E+10 Tunnel Concrete 4.60E47 B82 Magnet 1.42E+08 SS-316 (Cryostat Vacuum Vessel, beamline) 1.88E+07 Niobium 2.80E+07 Liquefied Helium 3.06E+07 Al6061-T6 (Waveguide) 1.83E+08 Water 4.79E+07 csubon Steel (Waveguide Support Structure) 9.23E+06 Copper Heat Shield 3.89E+07 SS-316 (Accelerator Cavity Stainless) 4.63E+06 Helium Gas 1.85Ei-07 50-50 Helium 4.63E+06 Liauid Helium
( C d
Activity Density (CVCC)
3.02E-08 2.41E-05 7.13E-06 1.43E-05
6.28E-07 1.95E-08 5.84E-07 1.12E-05 4.1 OE-07
Total Activity ((3
1052.86 1106.34 1014.99 269.15
19.21 3.56 27.95 103.76 15.93
10 Days Later (Ci)
66.95 602.96 550.37 137.50
0.12 0.01 14.03 10.53 9.42
7. CONCLUSIONS
CINDERPO, in conjunction with the LCS, provides an excellent method for calculating nuclide production, activation, and decay. Complete activation calculations have been done for the tunnel air inside the 1700-MeV APT accelerator, with time-dependent results obtained for a 9-month irradiation and including decay periods from 1 second to 3 months afterwards. The total activation of the accelerator beamline components was also calculated for the lifetime of the accelerator for the deactivation and decommissioning of the APT accelerator. The source terms produced through the LCS/CINDERPO combi- nation of codes can then be used in a variety of calculations, such as personnel dose calculations and safety calculations, needed for such documentation as the Environmental Impact Statement, and the ultimate safe operation of the APT 1700- MeV accelerator.
REFERENCES
1. R. E. Prael and H. Lichtenstein, “User Guide to LCS: The MET Code System,” Los Alamos National Laboratory report LA-UR-89-3014 (September 1989).
2. W.B. Wilson, et al., “Accelerator Transmutation Studies at Los Alums with M E T , MCNPj and CINDER’90,” Pro- ceedings of the Workshop on Simulation of Accelerator Radiation Environments, January 11-15,1993, Santa Fe, New Mex- ico; Los A m o s National Laboratory conference proceedings LA-128354 (October 1994) pp. 115-133; also available as Los Alamos National Laboratory informal document LA-UR-93-3080 (January 11,1993).
3. W.B. Wilson, T.R. England, D.C. George, D.W. Muir, and P.G. Young, “Recent Development of the CZNDER’90 Transmutation Code and Data Library for Actinide Transmutation Studies,” Proceedings of the GLOBAL’95 International Conference on Evaluation of Emerging Nuclear Fuel Cycle Systems, Versailles, France, September 11-14,1995, pp.848- 854; Los Alamos National Laboratory preprint LA-UR-95-2181.
ratory report LA-12625-M, Version 4B, (March 1997).
Ridge National Laboratory report CCC 178 (August 1977).
4. J. F. Briesmeister, Ed., “MCNP -A General Monte Carlo N-Particle Transport Code,” Los Alamos National Labo-
5. Radiation Shielding Information Center, “HETC Monte Carlo High-Energy Nucleon-Meson Transport Code,” Oak

8 *
. 6. H. W. Bertini, ‘Yntranuclear-Cascade Calculation of the Secondary Nucleon Spectra from Nucleon-Nucleus Interac- tions in the Energy Range 340 to 2900 MeV and Comparisons with Experiment,” Phys. Rev. 188, 171 1 (1969).
7. R. E. Prael and M. Bozoian, “Adaptation of the Multistage Preequilibrium Model for the Monte Carlo Method (I),” Los Alamos National Laboratory report LA-UR-88-3238 (September 1988); R. E. Prael and M. Bozoian, “Adaptation ofthe Multistage Preequilibnum Model for the Monte Carlo Method (II),” Los Alamos National Laboratory (to be pub.).
8. L. Dresner, “EVAl-A FORTRAN Program for Calculating the Evaporation of Various Particles from Excited Com- pound Nuclei,” Oak Ridge National Laboratory report ORNL-TM-96 (April 1962).
9. K. Chen, et al., “WGAS: A Monte CQrlo Simulation of Intranuclear Cascades,” Phys Rev. 166,949 (1 968). 10. R. E. Prael and D.G. Madland, “ M E T Code System Modijications for UHEl2.8,” Los Alamos National Labora-
11. T.R. England, “CINDER - A One Point Depletion and Fission Product Program,” Bettis Atomic Power Laboratory
12. T.R. England, R. Wilczynski, and N.L. Whittemore, “Cinder-7: An Interim Users Report,” Los Alamos Scientific
13. W.B. Wilson, T.R. England, R.J. LaBauve, M.E. Battat, D.E. Wessol, and R.T. Perry, “CINDER-3: Depletion Code
14. F.M. Mann, “REAC-2: A Users Manual and Code Description,” Westinghouse Hanford Company report WHC-EP-
15. E.C. Snow, APT design calculations, Phase I., Bechtel Nevada Interoffice Memorandum No. F28D-ES-97-129, July
tory report LA-UR-95-3605 (September 1995).
report WAPD-TM-334 (August 1962; Rev. June 1964).
Laboratory report LA-5885-MS (April 1975).
for Class VI Computers,” Trans. Am. Nucl. SOC. 46,724, (1984).
0282 (December 1989).
1997.