Embed Size (px)
Citation preview
Rockefeller UniversityDigital Commons @ RU
Student Theses and Dissertations
2006
TMEM27: A Cleaved and Shed Plasma MembraneProtein That Stimulates Pancreatic Beta CellProliferationPinar Akpinar
Follow this and additional works at: http://digitalcommons.rockefeller.edu/student_theses_and_dissertations
Part of the Life Sciences Commons
This Thesis is brought to you for free and open access by Digital Commons @ RU. It has been accepted for inclusion in Student Theses andDissertations by an authorized administrator of Digital Commons @ RU. For more information, please contact [email protected].
Recommended CitationAkpinar, Pinar, "TMEM27: A Cleaved and Shed Plasma Membrane Protein That Stimulates Pancreatic Beta Cell Proliferation" (2006).Student Theses and Dissertations. Paper 2.
TMEM27: A CLEAVED AND SHED PLASMA MEMBRANE PROTEIN
THAT STIMULATES PANCREATIC BETA CELL PROLIFERATION
A Thesis Presented to the Faculty of
The Rockefeller University
In Partial Fulfillment of the Requirements for
the degree of Doctor of Philosophy
by
Pinar Akpinar
June 2006

© Copyright by Pinar Akpinar, 2006
ABSTRACT
The signals and the molecular mechanisms that regulate the replication of
terminally differentiated β cells are unclear. In this thesis I report the
identification of a gene encoding transmembrane protein 27 (TMEM27) in
pancreatic β cells. Expression of Tmem27 is reduced in Tcf1–/– mice, which
exhibit defects in proliferation, and is increased in islets of ob/ob, db/db and aP2-
Srebp-1c transgenic mice with marked hypertrophy of the endocrine pancreas.
Tmem27 is expressed in hormone positive cells at early stages of pancreas
development and becomes restricted to pancreatic β cells in the mature pancreas.
Biochemical characterization revealed that the Tmem27 exists as a dimer and that
its extracellular domain is glycosylated, cleaved and shed from the plasma
membrane. The cleavage process of Tmem27 is β cell-specific and does not occur
in other cell types. Overexpression of full-length Tmem27, but not the truncated
or soluble protein, in MIN6 cells leads to increased thymidine incorporation,
whereas silencing of Tmem27 using RNAi results in a reduction of cell
replication. Furthermore, transgenic mice with increased expression of Tmem27
in pancreatic β cells exhibit increased β cell mass compared to their control
littermates. The following results identify a novel pancreatic β cell-shed protein
that regulates cell growth of pancreatic islets.

iii
ACKNOWLEDGEMENTS
I have spent a most enjoyable and productive four and a half years at
Rockefeller and I would like to thank a number of people whose support I have
greatly appreciated.
First and foremost, I would like to thank Markus Stoffel for being a
wonderful mentor. I very much appreciated his penchant for science and I
would like to thank him for teaching me how to ask useful questions in scientific
research.
I have especially enjoyed working on my Ph.D. in the Stoffel lab as I had
wonderful friends and colleagues who made work a fun and pleasant place to be
everyday. I would especially like to acknowledge Vivian Lee, Jenni Lowe, Latif
Rachdi, Jan Kruetzfeldt, Christian Wolfrum, and Satoru Kuwajima for their
friendship and all the help they have offered me over the years.
I have made many valuable friendships at Rockefeller and there are too
many names to list here. However, I have to single out Francisco Lopez de Saro
for always finding solutions to my random scientific problems and Bahar Taneri
for always taking the time to talk.
I would not be where I am today if it had not been for my parents, Guner
and Ismail Akpinar. Their vision and drive for me and my sister have been most
instrumental in our lives and I owe my success to them.
Lastly and most importantly, I would like to thank James, my closest
friend of all, for his constant support, love, and for being a joy to come home to
everyday.
iv
TABLE OF CONTENTS
INTRODUCTION
1.1 Introduction to diabetes mellitus 1
1.2 Regulation of islet mass 2
1.3 Overview of pancreas development 5
1.4 Network of transcription factor regulate 7
β cell development and function
1.5 Maturity-onset diabetes of the young (MODY) 11
1.6 Identification of a Tcf1 target gene involved in β cell growth 18
RESULTS
2.1 Tmem27 expression is regulated by Tcf1 20
2.2 Pdx-1 binds to a conserved site in Tmem27 promoter 23
2.3 Tmem27 is regulated during pancreas development 24
2.4 Tmem27 is an N-linked glycoprotein and forms dimers in vivo 26
2.5 Tmem27 is cleaved and shed from pancreatic β cells 28
2.6 Tmem27 is a constitutively shed plasma membrane protein 33
2.7 Search for a cleavage site and protease 38
2.8 Tmem27 influences insulin secretion 46
2.9 Increased expression of Tmem27 in mouse models with islet 49
hypertophy and enhanced β cell replication in vitro
v
2.10 Transgenic mice overexpressing Tmem27 in pancreatic islets 57
exhibit hypertrophy
DISCUSSION
3.1 Tcf1 regulates expression of Tmem27 63
3.2 Expression of Tmem27 in embryonic pancreas development 64
3.3 Ectodomain shedding of Tmem27 65
3.4 Tmem27 influences insulin secretion 69
3.5 Tmem27 stimulated β cell growth in vivo 70
3.6 Conclusion 76
EXPERIMENTAL PROCEDURES
4.1 Experimental Procedures 78
Experimental animals 78
Vectors 78
Antibodies 79
Cell culture 79
Transient transfections and luciferase assay 80
Crosslinking of proteins in cell lysates 80
Inhibition and enzymatic cleavage of N-glycosylation 81
Electrophoretic mobility shift assay (EMSA) 81
Whole cell extract preparation 82
vi
Pulse-Chase experiment 83
In vitro insulin secretion and hormone measurements 84
Pancreatic islet and RNA isolation 84
Islet morphometry 85
RT-PCR 85
Immunoblotting and immunohistochemistry 86
Electron microscopy studies 87
Thymidine incorporation studies 88
RNA interference 89
Generation of adenovirus 89
Generation of RIP-Tmem27 mice 90
Bacterial protein production 90
S2 cell protein production 91
PCR-directed mutagenesis 92
Protease inhibitors 92
Statistical analysis 93
REFERENCES 94
vii
LIST OF FIGURES
Page
Figure 1: Dorsal and ventral pancreatic buds in the embryo 6
Figure 2: Branching morphogenesis of embryonic pancreas 7
Figure 3: Transcription factors in endocrine cell specification 9
Figure 4: Tmem27 expression in Tcf1-/- islets 20
Figure 5: Promoter sequence for human and mouse Tmem27 21
Figure 6: Transcription activation assays 22
Figure 7: Tcf1 binds to Tmem27 promoter sequence in vitro 22
Figure 8: Tcf1 binds to Tmem27 promoter in vivo 23
Figure 9: Transcriptional activation assay with Pdx-1 24
Figure 10: Tmem27 is expressed in developing mouse pancreas 25
Figure 11: Tmem27 is an N-glycosylated protein 27
Figure 12: Tmem27 forms dimmers in vivo 27
Figure 13: Schematic drawing of Tmem27 protein 28
Figure 14: Tmem27 is detected as two bands on western blots 29
Figure 15: Only β cel lines release soluble Tmem27 30
Figure 16: Mouse islets release soluble Tmem27 30
Figure 17: Removal of N-glycosylation from soluble Tmem27 31
Figure 18: si-Tmem27 treated MIN6 cells shed less soluble protein 31
viii
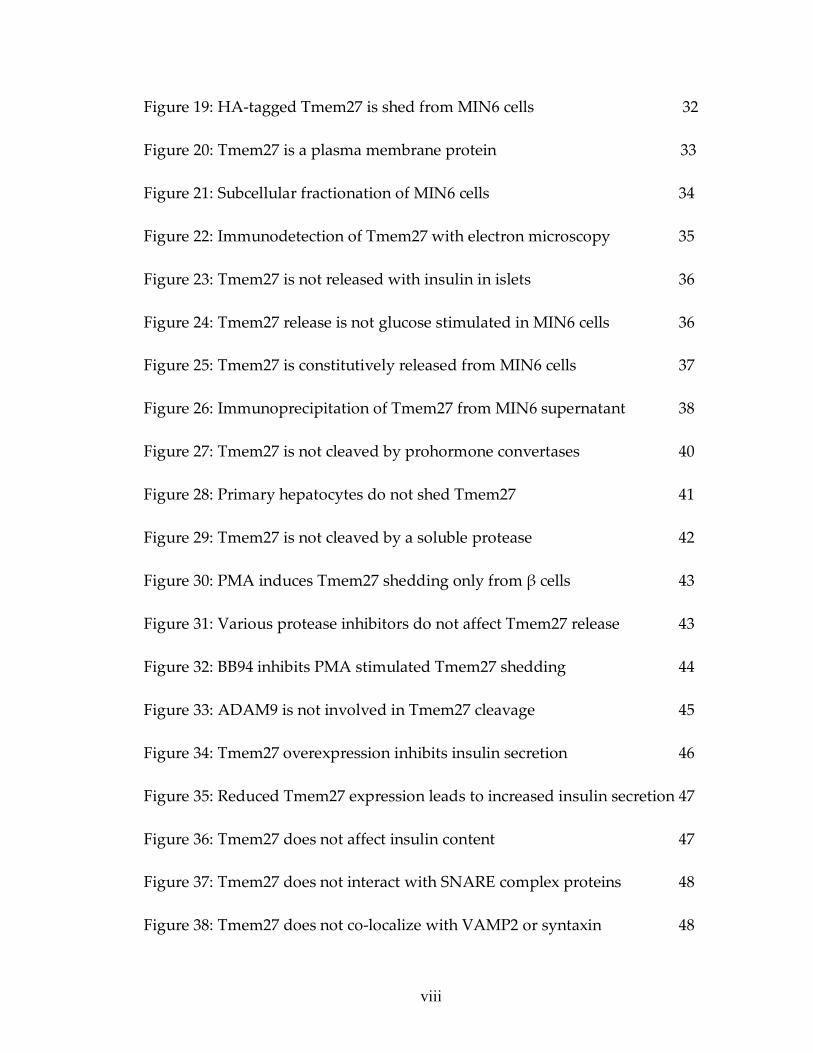
Figure 19: HA-tagged Tmem27 is shed from MIN6 cells 32
Figure 20: Tmem27 is a plasma membrane protein 33
Figure 21: Subcellular fractionation of MIN6 cells 34
Figure 22: Immunodetection of Tmem27 with electron microscopy 35
Figure 23: Tmem27 is not released with insulin in islets 36
Figure 24: Tmem27 release is not glucose stimulated in MIN6 cells 36
Figure 25: Tmem27 is constitutively released from MIN6 cells 37
Figure 26: Immunoprecipitation of Tmem27 from MIN6 supernatant 38
Figure 27: Tmem27 is not cleaved by prohormone convertases 40
Figure 28: Primary hepatocytes do not shed Tmem27 41
Figure 29: Tmem27 is not cleaved by a soluble protease 42
Figure 30: PMA induces Tmem27 shedding only from β cells 43
Figure 31: Various protease inhibitors do not affect Tmem27 release 43
Figure 32: BB94 inhibits PMA stimulated Tmem27 shedding 44
Figure 33: ADAM9 is not involved in Tmem27 cleavage 45
Figure 34: Tmem27 overexpression inhibits insulin secretion 46
Figure 35: Reduced Tmem27 expression leads to increased insulin secretion 47
Figure 36: Tmem27 does not affect insulin content 47
Figure 37: Tmem27 does not interact with SNARE complex proteins 48
Figure 38: Tmem27 does not co-localize with VAMP2 or syntaxin 48
ix
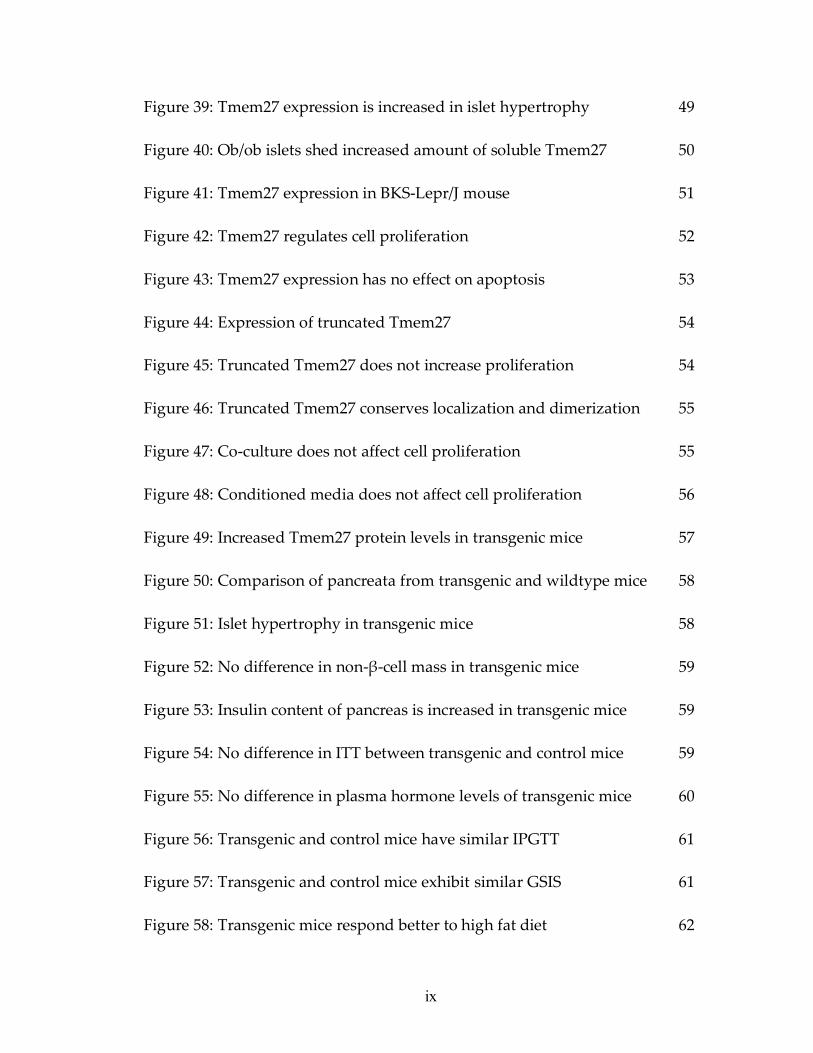
Figure 39: Tmem27 expression is increased in islet hypertrophy 49
Figure 40: Ob/ob islets shed increased amount of soluble Tmem27 50
Figure 41: Tmem27 expression in BKS-Lepr/J mouse 51
Figure 42: Tmem27 regulates cell proliferation 52
Figure 43: Tmem27 expression has no effect on apoptosis 53
Figure 44: Expression of truncated Tmem27 54
Figure 45: Truncated Tmem27 does not increase proliferation 54
Figure 46: Truncated Tmem27 conserves localization and dimerization 55
Figure 47: Co-culture does not affect cell proliferation 55
Figure 48: Conditioned media does not affect cell proliferation 56
Figure 49: Increased Tmem27 protein levels in transgenic mice 57
Figure 50: Comparison of pancreata from transgenic and wildtype mice 58
Figure 51: Islet hypertrophy in transgenic mice 58
Figure 52: No difference in non-β-cell mass in transgenic mice 59
Figure 53: Insulin content of pancreas is increased in transgenic mice 59
Figure 54: No difference in ITT between transgenic and control mice 59
Figure 55: No difference in plasma hormone levels of transgenic mice 60
Figure 56: Transgenic and control mice have similar IPGTT 61
Figure 57: Transgenic and control mice exhibit similar GSIS 61
Figure 58: Transgenic mice respond better to high fat diet 62

x
Figure 59: Model for Tmem27 function in the β cell 77
xi
LIST OF TABLES
Page
Table 1: Transcription factors important in endocrine cell development 11
Table 2: Screen with protease inhibitors 44

1
1.1 Introduction to diabetes mellitus
The number of people with diabetes has been rising at a disconcerting rate
worldwide with significant increases in the last two decades. As of 2001, an
estimated 150 million people globally had diabetes and this number is expected
to reach 220 million people by 2010 and 300 million by 2025 (Zimmet et al., 2001).
Diabetes is a heterogeneous group of disorders characterized by high fasting
blood glucose levels (ADA Report, 2001). There are two major forms of diabetes.
Type 1 diabetes, also known as juvenile-onset diabetes, occurs as a result of an
autoimmune mediated destruction of the insulin producing β cells of the
pancreas. The more prevalent type 2 diabetes accounts for more than 90% of
people with diabetes and is a complex disease that develops as a result of both
genetic and environmental factors. Diabetics of both types develop serious
micro- and macrovascular complications that affect the kidney, heart,
extremities, eyes,and lead to renal failure, heart attack, gangrene, stroke, and
blindness. Thus diabetes already imposes a considerable burden on health-care
systems and will develop into a major international public health threat in the
future.
Type 2 diabetes may develop as a result of various defects in diverse
molecular pathways. The precise regulation of plasma glucose levels requires a
balance between the function of pancreatic β cells and the responsiveness of
2
metabolic tissues such as muscle, liver, and fat. Genetic disposition as well as
obesity and sedentary lifestyle are contributing factors to type 2 diabetes, which
involves insulin resistance and/or dysfunctional β cells. Hence, defects in β cell
growth and function play a central role in the pathophysiology of both type 1
and 2 diabetes.
The pancreas is derived from the endoderm and consists of three distinct
cell populations called the endocrine, acinar, and ductal cells. The acinar cells
make up the exocrine pancreas that secrete digestive enzymes into the intestine.
The endocrine cells are the major constituents of islets that secrete hormones into
the blood stream (Slack, 1995). Pancreatic islets are comprised mainly of β cells
(80%) that secrete insulin and to a lesser extent of α cells (10-15%) that secrete
glucagon, δ cells that secrete somatostatin, PP cells that secrete pancreatic
polypeptide and ε cells that express ghrelin (Prado et al, 2004).
1.2 Regulation of islet mass
Endocrine hormones tightly regulate energy metabolism in the body and
islet mass is dynamic and adaptable in response to metabolic demand. In a
number of metabolic states such as growth, pregnancy, insulin resistance due to
obesity and in various injury models, islet mass seems capable of compensating
both functionally and morphologically. In fact, only 15-20% of people with
3
obesity or severe insulin resistance become diabetic and most people are able to
maintain normoglycemia due to β cell compensation (Bonner-Weir, 2000). This
phenomenon is shown in humans (Kloppel, 1985) and in experimental rodent
models. In Zucker fa/fa rat, a nondiabetic animal model of obesity, β cell mass
increases 4-fold compared with lean controls (Pick, 1998). During pregnancy, β
cell mass adjusts considerably and it has been shown in the rat that β cell mass
increases by about 50% due to increased β cell proliferation induced by placental
lactogen and increased cell volume as a functional adaptation. Β cell mass also
continues to increase during postnatal growth and in rodents it is linearly
correlated with body weight (Bonner-Weir, 2000). β cells are also capable of
decreasing their mass when it is necessary. After pregnancy, a rapid decrease of
the β cell mass occurs in postpartum rats (Marynissen et al., 1983). This is
accompanied by decreased β cell replication and β cell size, and by an increased
frequency of apoptosis (Scaglia et al., 1995).
The mass of β cells is governed by the balance of β cell growth
(replication) and β cell death (apoptosis) (Bonner-Weir, 2000; Lingohr et al., 2002;
Butler et al., 2003; Flier et al., 2001). However, the identity of the factors that
control β cell mass remains elusive. In the adult organism, maintenance of β cell
mass involves replication of preexisting cells (Dor et al., 2004) and recent
evidence substantiates that regeneration of islets even after injury does not
4
display recapitulation of neogenesis present during development (Lee et al.,
2006). Thus, understanding how β cell mass is regulated is important to design
rational approaches to prevent pancreatic β cell loss and to expand β cells for
transplantation in type 1 diabetes.
During development, β cells are generated from a population of
pancreatic progenitor cells (Edlund, 2002; Wilson et al., 2003). The β cells that
differentiate from progenitor cells are postmitotic, and direct lineage tracing
studies indicate that a population of progenitor cells persists throughout
embryogenesis to allow the differentiation of new β cells (Dor et al., 2004; Gu et
al., 2002; Gradwohl et al., 2000). In the neonatal period new β cells are formed by
replication of differentiated β cells, which results in a massive increase in β cell
mass (Finegood et al., 1995; Svenstrup et al., 2002). In adulthood there is little
increase in the β cell number except in conditions of increased demand and the
growth stimulatory signals in pathological insulin resistant states are not well
understood.
Several mouse models of insulin resistance and diabetes, such as the ob/ob
and db/db mice or mutant mice created by inactivation of the gene for insulin
receptor substrate-1 (Irs-1) or double heterozygous knockout of the insulin
receptor and Irs-1, exhibit marked islet hyperplasia (Bock et al., 2003; Tomita et
al., 1992; Gapp et al., 1983; Kulkarni et al., 2004 and Kahn, 2003). In contrast, loss
5
of Irs-2 function leads to a dramatic reduction of β cells and diabetes (Withers et
al., 1998). Glucose itself is known to stimulate β cell replication (Topp et al.,
2004), however, many of the above mouse models increase their total islet mass
before the onset of detectable hyperglycemia. Furthermore, in most cases the
hyperplastic response bears no relationship to the level of hyperglycemia,
suggesting that factors independent of glucose are likely to contribute to the islet
growth.
1.3 Overview of pancreas development
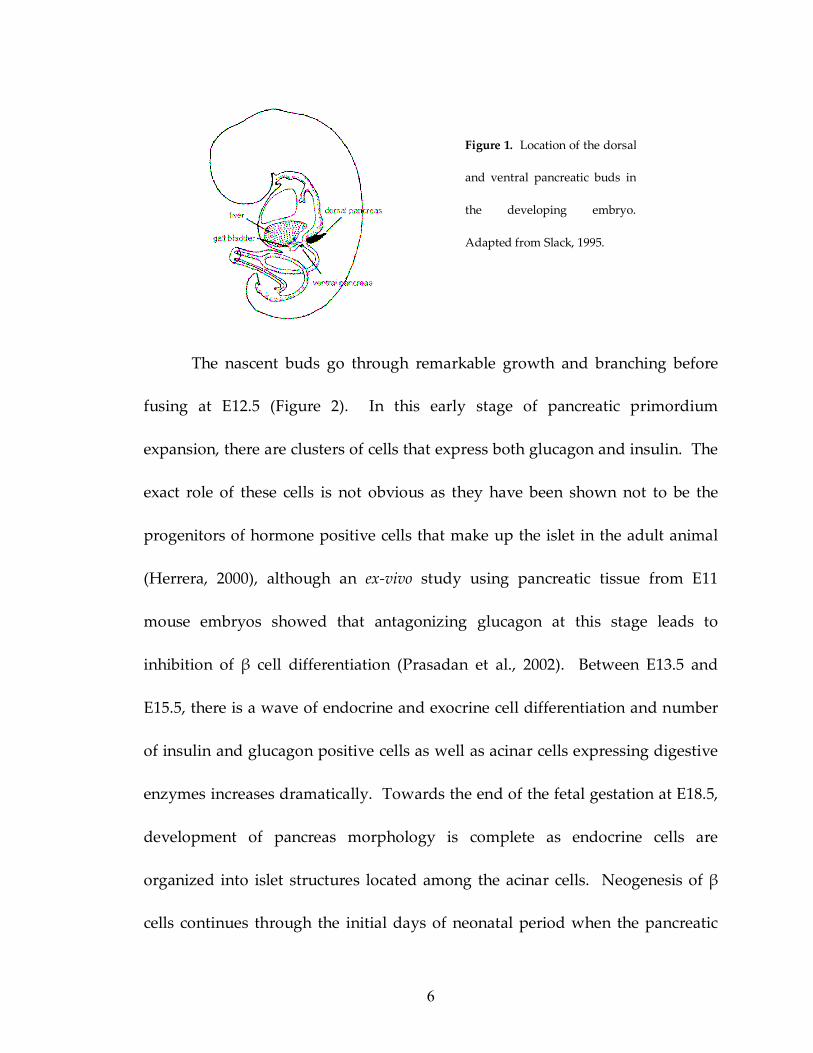
Pancreas development in the mouse begins at embryonic day 9 (E9) with
the emergence of dorsal and ventral epithelium buds between the stomach and
duodenum (Figure 1). The molecular machinery that drives gut epithelium
towards a pancreatic fate is not completely understood, however, a temporally
and spatially regulated framework of transcription factors involved in the
development of pancreatic tissue has been described. Pdx1 is one of the earliest
expressed transcription factors in the pancreatic epithelium. It has been showed
that initiation of either bud can take place without Pdx1 expression. Yet, Pdx1
expression is crucial for growth and morphogenesis of the bud epithelia
(Ahlgren et al., 1996; Offield et al., 1996).
6
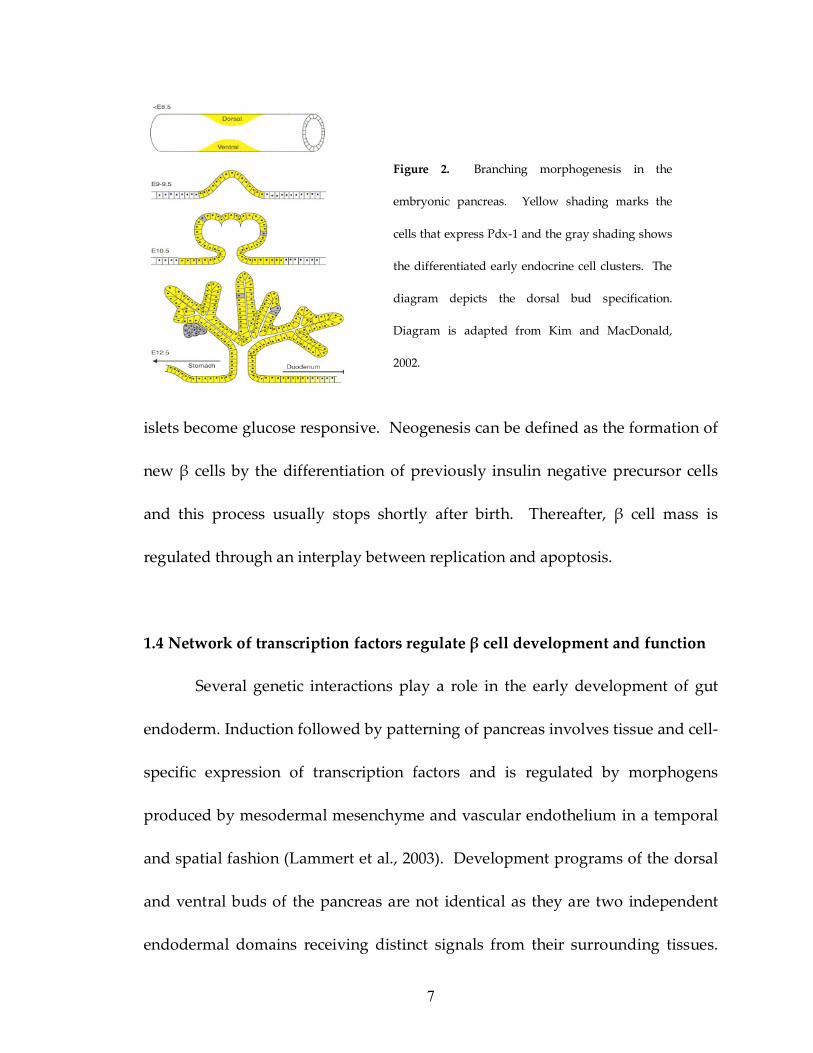
The nascent buds go through remarkable growth and branching before
fusing at E12.5 (Figure 2). In this early stage of pancreatic primordium
expansion, there are clusters of cells that express both glucagon and insulin. The
exact role of these cells is not obvious as they have been shown not to be the
progenitors of hormone positive cells that make up the islet in the adult animal
(Herrera, 2000), although an ex-vivo study using pancreatic tissue from E11
mouse embryos showed that antagonizing glucagon at this stage leads to
inhibition of β cell differentiation (Prasadan et al., 2002). Between E13.5 and
E15.5, there is a wave of endocrine and exocrine cell differentiation and number
of insulin and glucagon positive cells as well as acinar cells expressing digestive
enzymes increases dramatically. Towards the end of the fetal gestation at E18.5,
development of pancreas morphology is complete as endocrine cells are
organized into islet structures located among the acinar cells. Neogenesis of β
cells continues through the initial days of neonatal period when the pancreatic
Figure 1. Location of the dorsal
and ventral pancreatic buds in
the developing embryo.
Adapted from Slack, 1995.
7
islets become glucose responsive. Neogenesis can be defined as the formation of
new β cells by the differentiation of previously insulin negative precursor cells
and this process usually stops shortly after birth. Thereafter, β cell mass is
regulated through an interplay between replication and apoptosis.
1.4 Network of transcription factors regulate β cell development and function
Several genetic interactions play a role in the early development of gut
endoderm. Induction followed by patterning of pancreas involves tissue and cell-
specific expression of transcription factors and is regulated by morphogens
produced by mesodermal mesenchyme and vascular endothelium in a temporal
and spatial fashion (Lammert et al., 2003). Development programs of the dorsal
and ventral buds of the pancreas are not identical as they are two independent
endodermal domains receiving distinct signals from their surrounding tissues.
Figure 2. Branching morphogenesis in the
embryonic pancreas. Yellow shading marks the
cells that express Pdx-1 and the gray shading shows
the differentiated early endocrine cell clusters. The
diagram depicts the dorsal bud specification.
Diagram is adapted from Kim and MacDonald,
2002.
8
Dorsal bud grows in close proximity to notochord and its development requires
signals from the notochord to repress the signaling factor sonic hedgehog in the
presence of Pdx-1 expression (Apelqvist et al., 1997). Ventral bud develops in
close connection to the liver and bile duct epithelium. Signals that drive ventral
pancreatic bud differentiation are not completely understood, however,
pancreatic lineage appears to be more of a default pathway as cardiac mesoderm
signaling defines liver cells and lack of this signaling leads to pancreas
specification. Recent evidence implicates the homeobox protein, Hex, in control
of positioning endoderm cells and specifying the ventral bud (Bort et al., 2004).
Several transcription factors are critical regulators of the endodermal
development and their expression in certain stages along with defined
interacting partners determine differentiation programs of individual cell types
(Habener et al., 2005). Trancription factors Tcf-1, Tcf-2, Foxa2, HNF4α and Hnf6
(Onecut 1) are all expressed in the pancreatic progenitor cells that are defined by
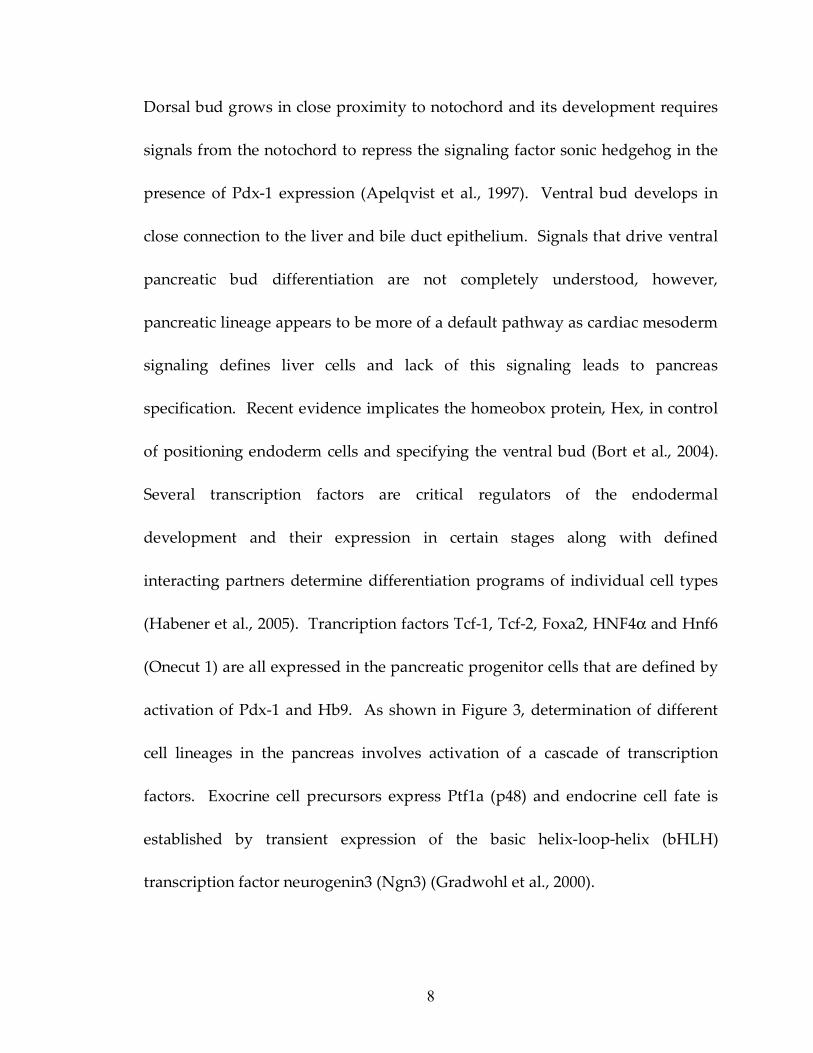
activation of Pdx-1 and Hb9. As shown in Figure 3, determination of different
cell lineages in the pancreas involves activation of a cascade of transcription
factors. Exocrine cell precursors express Ptf1a (p48) and endocrine cell fate is
established by transient expression of the basic helix-loop-helix (bHLH)
transcription factor neurogenin3 (Ngn3) (Gradwohl et al., 2000).
9
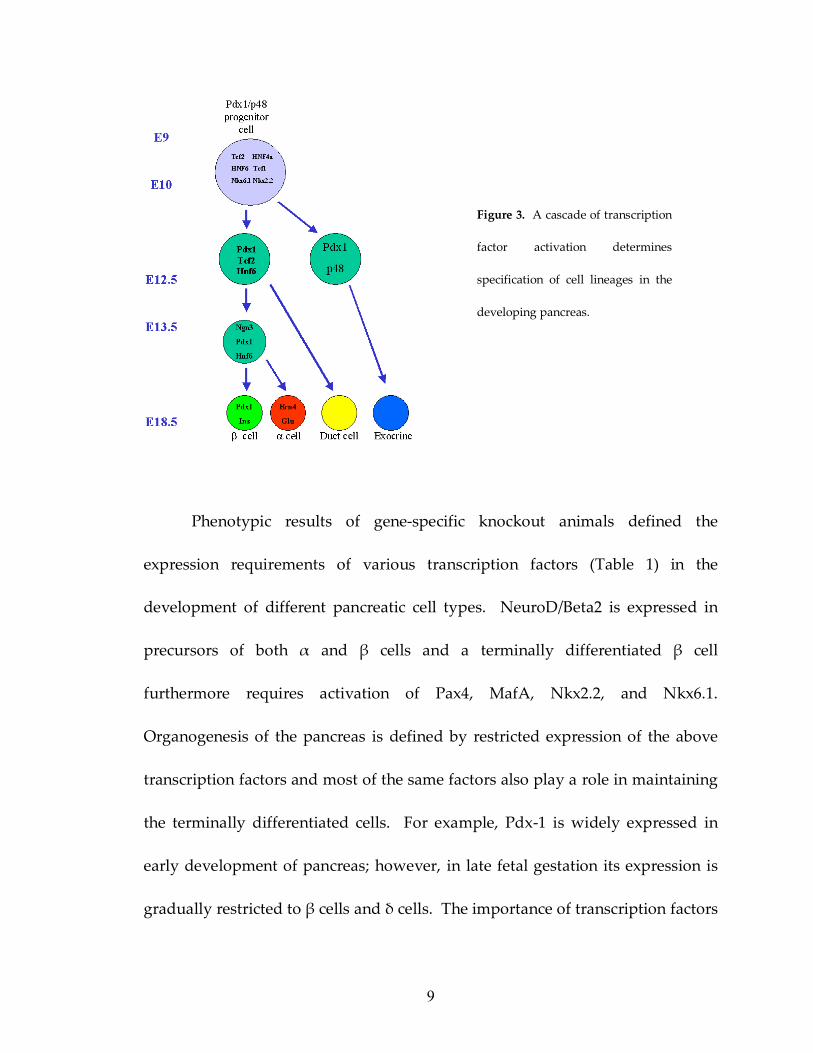
Phenotypic results of gene-specific knockout animals defined the
expression requirements of various transcription factors (Table 1) in the
development of different pancreatic cell types. NeuroD/Beta2 is expressed in
precursors of both α and β cells and a terminally differentiated β cell
furthermore requires activation of Pax4, MafA, Nkx2.2, and Nkx6.1.
Organogenesis of the pancreas is defined by restricted expression of the above
transcription factors and most of the same factors also play a role in maintaining
the terminally differentiated cells. For example, Pdx-1 is widely expressed in
early development of pancreas; however, in late fetal gestation its expression is
gradually restricted to β cells and δ cells. The importance of transcription factors
Figure 3. A cascade of transcription
factor activation determines
specification of cell lineages in the
developing pancreas.
10
in endocrine cell development and function has also been emphasized in humans
as mutations in transcription factors TCF1, TCF2, HNF4α, IPF-1 (Pdx-1),
NEUROD/BETA2 result in a monogenic form of diabetes called the maturity-
onset diabetes of the young (MODY). In the β cell, Tcf1 (MODY3), Pdx-1
(MODY4), and NeuroD (MODY6) are all shown to be direct regulators of insulin
gene expression. Moreover, these transcription factors along with HNF4α
(MODY1), Tcf2 (MODY5), Hnf6 and Foxa2 exist in a transcriptional network
where they regulate each other’s expression. Thus the determination of the
identity and the function of the β cell are achieved through expression of a
unique combination of transcription factors in a specific gene regulatory
network.
11
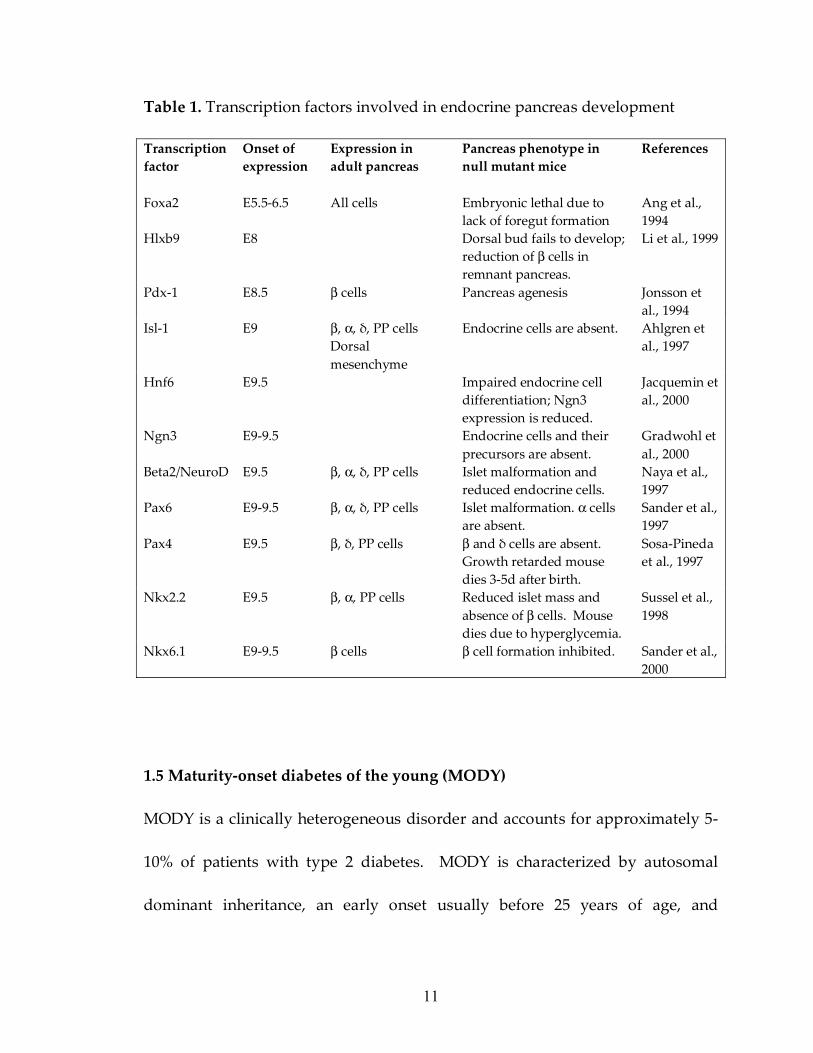
Table 1. Transcription factors involved in endocrine pancreas development
Transcription factor
Onset of expression
Expression in adult pancreas
Pancreas phenotype in null mutant mice
References
Foxa2 E5.5-6.5 All cells Embryonic lethal due to lack of foregut formation
Ang et al., 1994
Hlxb9 E8 Dorsal bud fails to develop; reduction of β cells in remnant pancreas.
Li et al., 1999
Pdx-1 E8.5 β cells Pancreas agenesis Jonsson et al., 1994
Isl-1 E9 β, α, δ, PP cells Dorsal mesenchyme
Endocrine cells are absent. Ahlgren et al., 1997
Hnf6 E9.5 Impaired endocrine cell differentiation; Ngn3 expression is reduced.
Jacquemin et al., 2000
Ngn3 E9-9.5 Endocrine cells and their precursors are absent.
Gradwohl et al., 2000
Beta2/NeuroD E9.5 β, α, δ, PP cells Islet malformation and reduced endocrine cells.
Naya et al., 1997
Pax6 E9-9.5 β, α, δ, PP cells Islet malformation. α cells are absent.
Sander et al., 1997
Pax4 E9.5 β, δ, PP cells β and δ cells are absent. Growth retarded mouse dies 3-5d after birth.
Sosa-Pineda et al., 1997
Nkx2.2 E9.5 β, α, PP cells Reduced islet mass and absence of β cells. Mouse dies due to hyperglycemia.
Sussel et al., 1998
Nkx6.1 E9-9.5 β cells β cell formation inhibited. Sander et al., 2000
1.5 Maturity-onset diabetes of the young (MODY)
MODY is a clinically heterogeneous disorder and accounts for approximately 5-
10% of patients with type 2 diabetes. MODY is characterized by autosomal
dominant inheritance, an early onset usually before 25 years of age, and
12
development of marked hyperglycemia with a progressive impairment in insulin
secretion (Shih and Stoffel, 2002). Studies using genetic linkage and candidate
gene approaches have led to mutations in six genes that cause MODY in people.
The MODY2 gene encodes the glycolytic enzyme glucokinase (GCK) important
for glucose sensing in β cells (Frougel et al., 1993). Glucokinase catalyzes the first
rate-limiting step in glycolysis and is crucial for generating the metabolic signal
for insulin secretion (Matschinsky, 1990). Heterozygous mutations in the GCK
gene lead to a partial deficiency of this enzyme and are associated with MODY2;
homozygous mutations result in a complete deficiency of this enzyme and lead
to permanent neonatal diabetes mellitus (Njolstad et al., 2001). Glucokinase-
deficient mice exhibit a similar phenotype to MODY2 patients as mice that lack
GCK activity die perinatally with severe hyperglycemia resembling rare forms of
neonatal diabetes and heterozygous mice have elevated blood glucose levels and
reduced insulin secretion. The importance of GCK activity in β cells is reinforced
with further experiments in the GCK-deficient mice, which show that recovering
expression of glucokinase only in β cells can rescue homozygous null mice from
perinatal death (Grupe et al., 1995). Several heterozygous activating GCK
mutations that cause hypoglycemia have also been reported in humans (Glaser et
al., 1998; Christesen et al., 2002; Gloyn et al., 2003).
13
MODY4 is a rare form MODY caused by an inactivating mutation in the
IPF-1/PDX-1 gene. This single nucleotide deletion (Pro63fsdelC) has been
described in a patient with pancreatic agenesis (Stoffers et al., 1998). This patient
inherited the mutant allele from his parents who were heterozygous for the same
mutation (Stoffers et al., 1997). Heterozygous family members have early-onset
diabetes (Stoffers et al., 1997b). Other PDX-1 mutations have been described to
predispose carriers to diabetes and functional analysis of these variants
suggested that these mutations might lead to a progressive impairment of β cell
function and glucose homeostasis collectively with other risk factors (Hani et al.,
1999; Macfarlane et al., 1999). Mice with targeted disruption of the Pdx-1 gene
also fail to develop a pancreas and moreover, β cell-specific inactivation of Pdx-1
gene leads to a loss of β cell phenotype and diabetes (Jonsson et al., 1994;
Ahlgren et al., 1998). In both humans and rodents, PDX-1 appears to be a key
regulator in early pancreas formation and in maintenance of insulin expression
and normoglycemia.
MODY6 is caused by mutations in the bHLH transcription factor
NEUROD1/BETA2. NEUROD1 mutations so far have been described in two
families with autosomal-dominant inheritance. One family showed a clinical
phenotype that resembles type 2 diabetes with high fasting serum insulin levels.
The second family met the criteria for MODY as three carriers in the family
14
displayed onset of diabetes before 25 years of age and five family members
required insulin treatment consistent with β cell dysfunction and low
endogenous insulin secretion (Malecki, et al., 1999). NEUROD1 regulates insulin
gene expression by binding to its promoter and plays an important role in
endocrine cell type determination in development. Mice deficient in NeuroD1
function have abnormal islet morphology, overt diabetes, and die after birth
(Naya et al., 1997).
Transcription factors HNF4α and Tcf1 regulate each other’s expression
and consequently clinical features of MODY1 and MODY3 are similar. Both
MODY1 and MODY3 patients show progressive deterioration of glycemic
control associated with a decrease in insulin secretion (Fajans et al., 1993).
HNF4α is a member of the nuclear receptor family of transcription factors and
plays a critical role in development, cell differentiation, and metabolism of
pancreatic islets as well as visceral endoderm, liver, intestine, and kidney (Stoffel
and Duncan, 1997). Molecular studies indicate that HNF4α deficiency results in
impairment of insulin secretion by dysregulation of pancreatic islet gene
expression and the extent of regulation by HNF4α has recently been further
substantiated using a combined chromatin immunoprecipitation with a custom
promoter microarray (Odom et al., 2004). The authors discovered that over 40%
of the active promoters in pancreatic islets were bound by HNF4α including
15
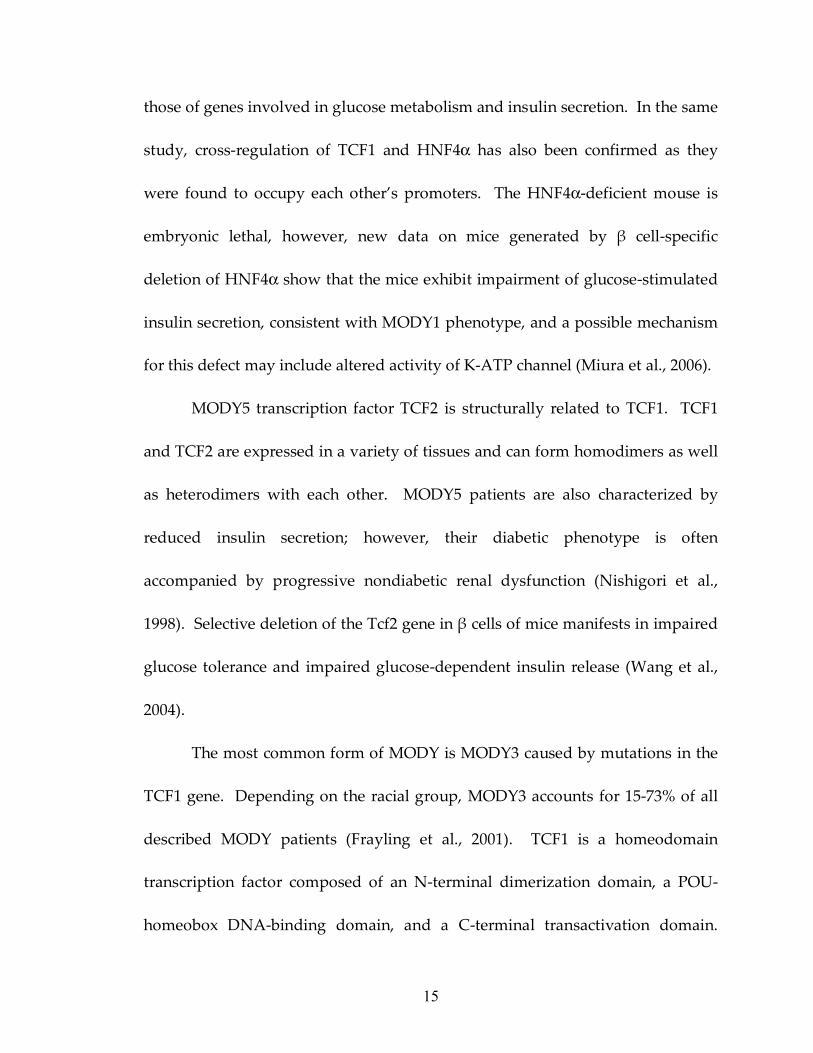
those of genes involved in glucose metabolism and insulin secretion. In the same
study, cross-regulation of TCF1 and HNF4α has also been confirmed as they
were found to occupy each other’s promoters. The HNF4α-deficient mouse is
embryonic lethal, however, new data on mice generated by β cell-specific
deletion of HNF4α show that the mice exhibit impairment of glucose-stimulated
insulin secretion, consistent with MODY1 phenotype, and a possible mechanism
for this defect may include altered activity of K-ATP channel (Miura et al., 2006).
MODY5 transcription factor TCF2 is structurally related to TCF1. TCF1
and TCF2 are expressed in a variety of tissues and can form homodimers as well
as heterodimers with each other. MODY5 patients are also characterized by
reduced insulin secretion; however, their diabetic phenotype is often
accompanied by progressive nondiabetic renal dysfunction (Nishigori et al.,
1998). Selective deletion of the Tcf2 gene in β cells of mice manifests in impaired
glucose tolerance and impaired glucose-dependent insulin release (Wang et al.,
2004).
The most common form of MODY is MODY3 caused by mutations in the
TCF1 gene. Depending on the racial group, MODY3 accounts for 15-73% of all
described MODY patients (Frayling et al., 2001). TCF1 is a homeodomain
transcription factor composed of an N-terminal dimerization domain, a POU-
homeobox DNA-binding domain, and a C-terminal transactivation domain.
16
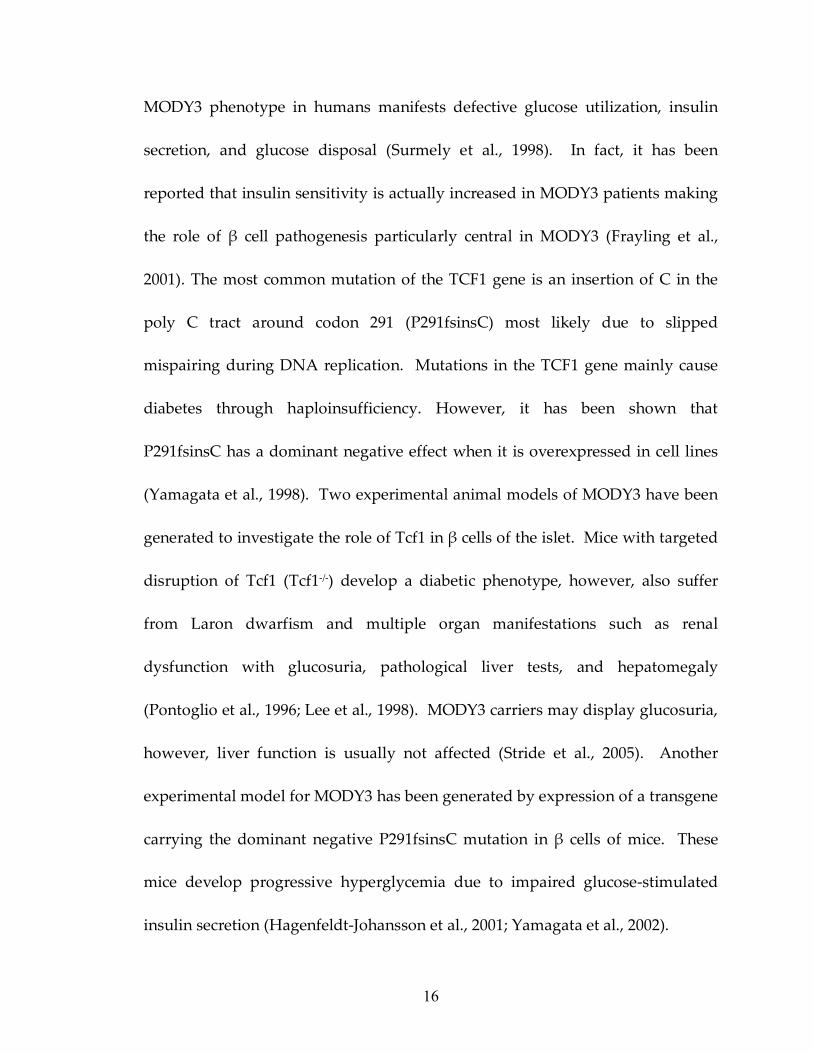
MODY3 phenotype in humans manifests defective glucose utilization, insulin
secretion, and glucose disposal (Surmely et al., 1998). In fact, it has been
reported that insulin sensitivity is actually increased in MODY3 patients making
the role of β cell pathogenesis particularly central in MODY3 (Frayling et al.,
2001). The most common mutation of the TCF1 gene is an insertion of C in the
poly C tract around codon 291 (P291fsinsC) most likely due to slipped
mispairing during DNA replication. Mutations in the TCF1 gene mainly cause
diabetes through haploinsufficiency. However, it has been shown that
P291fsinsC has a dominant negative effect when it is overexpressed in cell lines
(Yamagata et al., 1998). Two experimental animal models of MODY3 have been
generated to investigate the role of Tcf1 in β cells of the islet. Mice with targeted
disruption of Tcf1 (Tcf1-/-) develop a diabetic phenotype, however, also suffer
from Laron dwarfism and multiple organ manifestations such as renal
dysfunction with glucosuria, pathological liver tests, and hepatomegaly
(Pontoglio et al., 1996; Lee et al., 1998). MODY3 carriers may display glucosuria,
however, liver function is usually not affected (Stride et al., 2005). Another
experimental model for MODY3 has been generated by expression of a transgene
carrying the dominant negative P291fsinsC mutation in β cells of mice. These
mice develop progressive hyperglycemia due to impaired glucose-stimulated
insulin secretion (Hagenfeldt-Johansson et al., 2001; Yamagata et al., 2002).
17
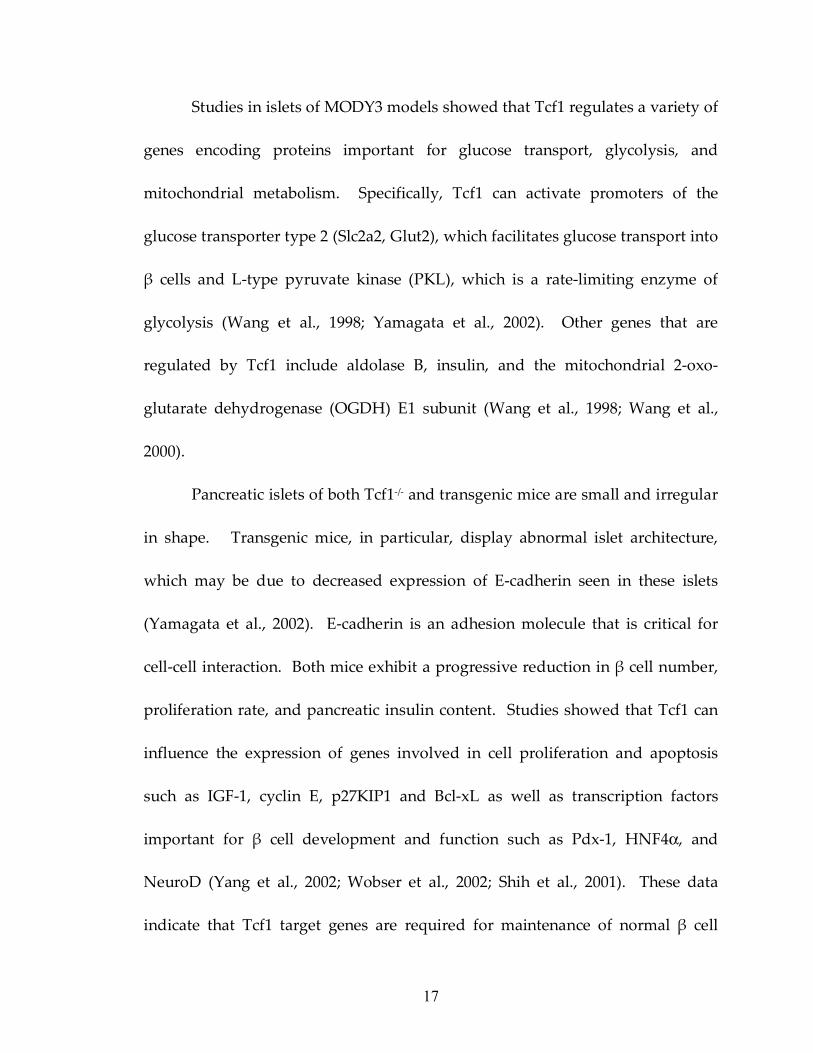
Studies in islets of MODY3 models showed that Tcf1 regulates a variety of
genes encoding proteins important for glucose transport, glycolysis, and
mitochondrial metabolism. Specifically, Tcf1 can activate promoters of the
glucose transporter type 2 (Slc2a2, Glut2), which facilitates glucose transport into
β cells and L-type pyruvate kinase (PKL), which is a rate-limiting enzyme of
glycolysis (Wang et al., 1998; Yamagata et al., 2002). Other genes that are
regulated by Tcf1 include aldolase B, insulin, and the mitochondrial 2-oxo-
glutarate dehydrogenase (OGDH) E1 subunit (Wang et al., 1998; Wang et al.,
2000).
Pancreatic islets of both Tcf1-/- and transgenic mice are small and irregular
in shape. Transgenic mice, in particular, display abnormal islet architecture,
which may be due to decreased expression of E-cadherin seen in these islets
(Yamagata et al., 2002). E-cadherin is an adhesion molecule that is critical for
cell-cell interaction. Both mice exhibit a progressive reduction in β cell number,
proliferation rate, and pancreatic insulin content. Studies showed that Tcf1 can
influence the expression of genes involved in cell proliferation and apoptosis
such as IGF-1, cyclin E, p27KIP1 and Bcl-xL as well as transcription factors
important for β cell development and function such as Pdx-1, HNF4α, and
NeuroD (Yang et al., 2002; Wobser et al., 2002; Shih et al., 2001). These data
indicate that Tcf1 target genes are required for maintenance of normal β cell
18
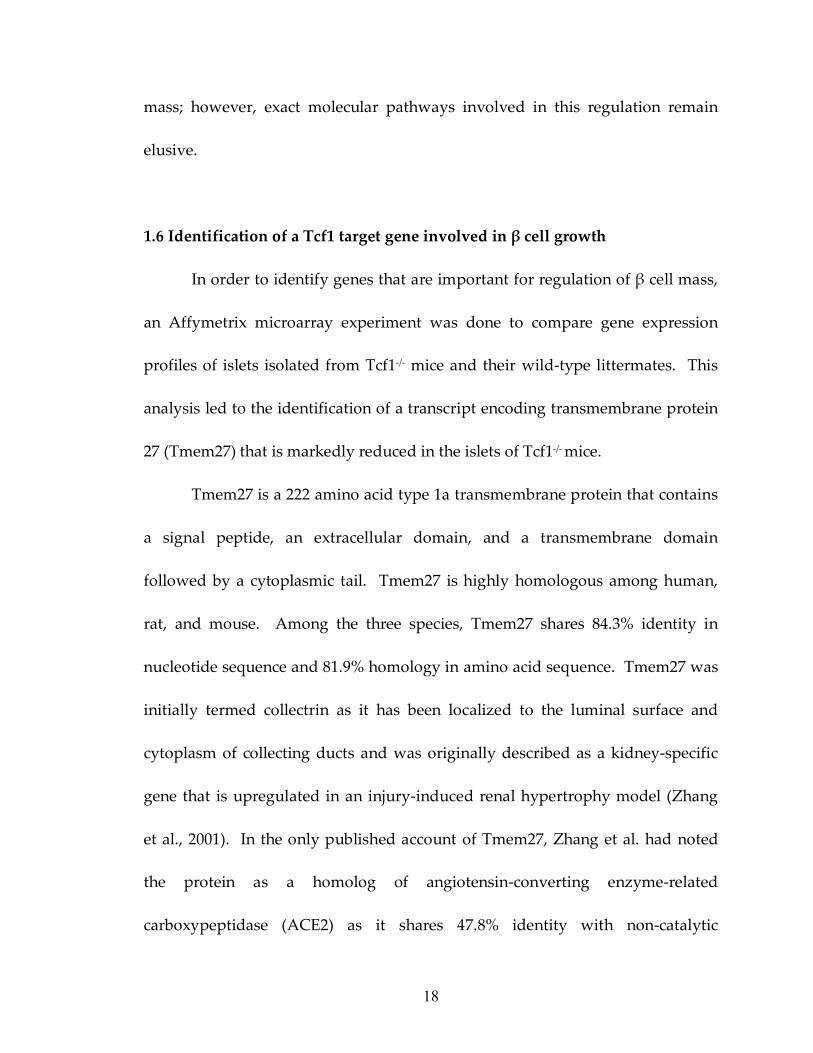
mass; however, exact molecular pathways involved in this regulation remain
elusive.
1.6 Identification of a Tcf1 target gene involved in β cell growth
In order to identify genes that are important for regulation of β cell mass,
an Affymetrix microarray experiment was done to compare gene expression
profiles of islets isolated from Tcf1-/- mice and their wild-type littermates. This
analysis led to the identification of a transcript encoding transmembrane protein
27 (Tmem27) that is markedly reduced in the islets of Tcf1-/- mice.
Tmem27 is a 222 amino acid type 1a transmembrane protein that contains
a signal peptide, an extracellular domain, and a transmembrane domain
followed by a cytoplasmic tail. Tmem27 is highly homologous among human,
rat, and mouse. Among the three species, Tmem27 shares 84.3% identity in
nucleotide sequence and 81.9% homology in amino acid sequence. Tmem27 was
initially termed collectrin as it has been localized to the luminal surface and
cytoplasm of collecting ducts and was originally described as a kidney-specific
gene that is upregulated in an injury-induced renal hypertrophy model (Zhang
et al., 2001). In the only published account of Tmem27, Zhang et al. had noted
the protein as a homolog of angiotensin-converting enzyme-related
carboxypeptidase (ACE2) as it shares 47.8% identity with non-catalytic
19
extracellular, transmembrane, and cytosolic domains of ACE2. Moreover,
Tmem27 expression was described during mouse kidney development. Tmem27
is detectable at E13 in the ureteric bud branches. Its expression is progressively
increased in later stages of gestation extending into the neonatal periods and
then is decreased in adult life (Zhang et al., 2001).
In this thesis, I describe the specific expression of Tmem27 in β cells of the
endocrine pancreas. I carried out a comprehensive biochemical and functional
analysis of Tmem27 and demonstrated that it is a stimulator if β cell replication
in vivo and in vitro.
20
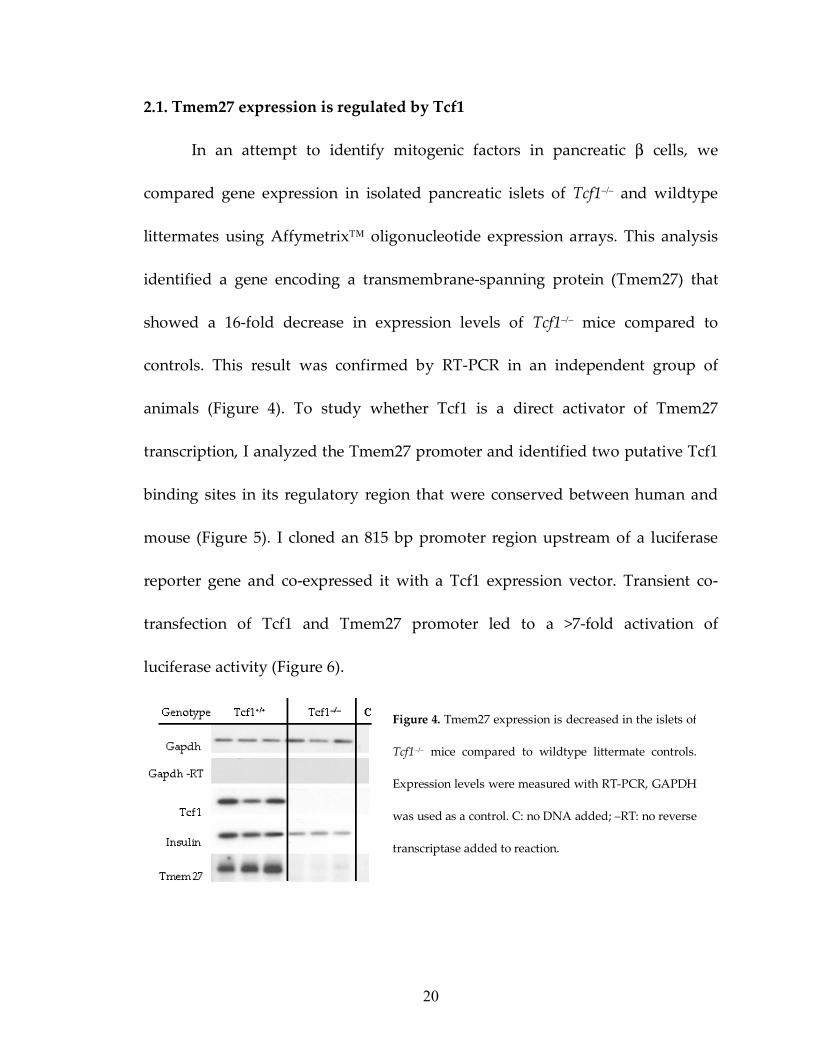
2.1. Tmem27 expression is regulated by Tcf1
In an attempt to identify mitogenic factors in pancreatic β cells, we
compared gene expression in isolated pancreatic islets of Tcf1–/– and wildtype
littermates using Affymetrix™ oligonucleotide expression arrays. This analysis
identified a gene encoding a transmembrane-spanning protein (Tmem27) that
showed a 16-fold decrease in expression levels of Tcf1–/– mice compared to
controls. This result was confirmed by RT-PCR in an independent group of
animals (Figure 4). To study whether Tcf1 is a direct activator of Tmem27
transcription, I analyzed the Tmem27 promoter and identified two putative Tcf1
binding sites in its regulatory region that were conserved between human and
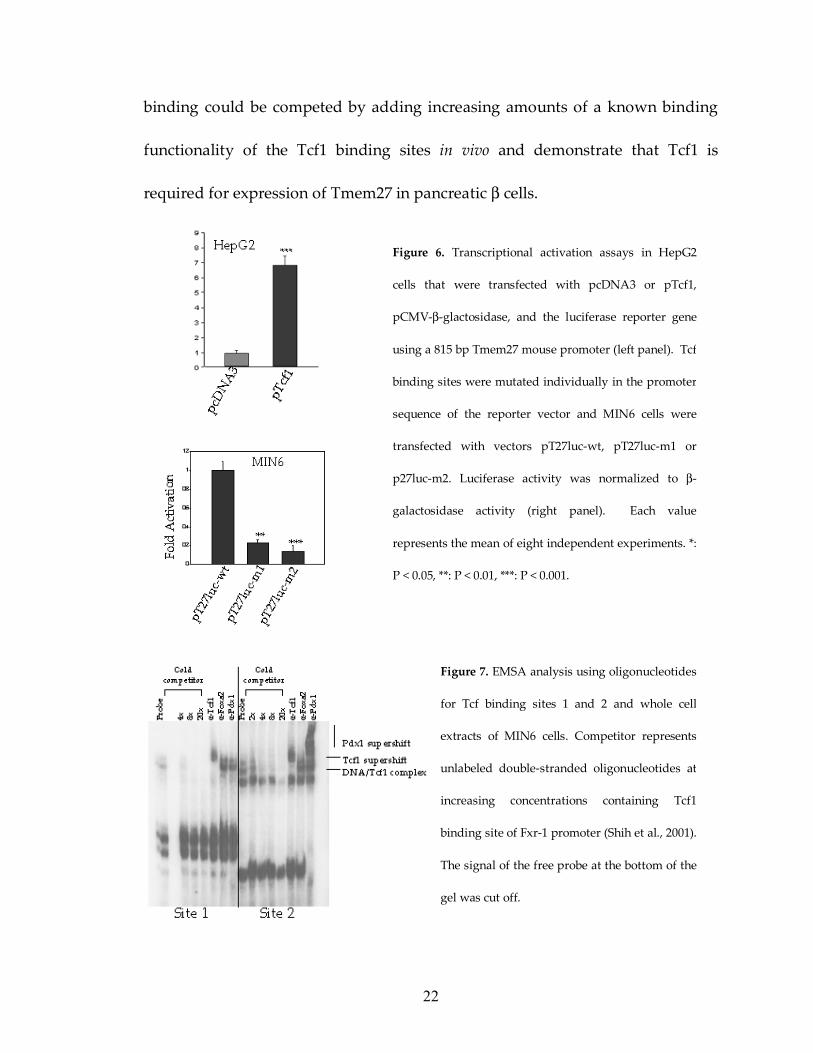
mouse (Figure 5). I cloned an 815 bp promoter region upstream of a luciferase
reporter gene and co-expressed it with a Tcf1 expression vector. Transient co-
transfection of Tcf1 and Tmem27 promoter led to a >7-fold activation of
luciferase activity (Figure 6).
Figure 4. Tmem27 expression is decreased in the islets of
Tcf1–/– mice compared to wildtype littermate controls.
Expression levels were measured with RT-PCR, GAPDH
was used as a control. C: no DNA added; –RT: no reverse
transcriptase added to reaction.
21
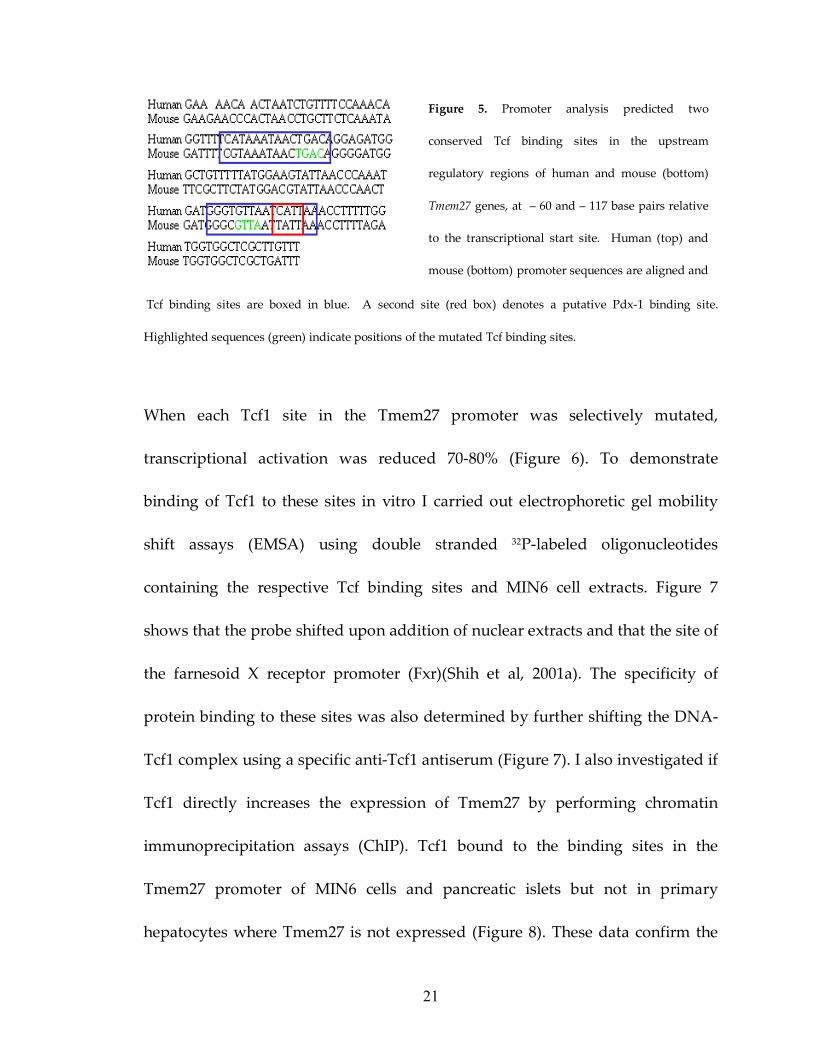
Tcf binding sites are boxed in blue. A second site (red box) denotes a putative Pdx-1 binding site.
Highlighted sequences (green) indicate positions of the mutated Tcf binding sites.
When each Tcf1 site in the Tmem27 promoter was selectively mutated,
transcriptional activation was reduced 70-80% (Figure 6). To demonstrate
binding of Tcf1 to these sites in vitro I carried out electrophoretic gel mobility
shift assays (EMSA) using double stranded 32P-labeled oligonucleotides
containing the respective Tcf binding sites and MIN6 cell extracts. Figure 7
shows that the probe shifted upon addition of nuclear extracts and that the site of
the farnesoid X receptor promoter (Fxr)(Shih et al, 2001a). The specificity of
protein binding to these sites was also determined by further shifting the DNA-
Tcf1 complex using a specific anti-Tcf1 antiserum (Figure 7). I also investigated if
Tcf1 directly increases the expression of Tmem27 by performing chromatin
immunoprecipitation assays (ChIP). Tcf1 bound to the binding sites in the
Tmem27 promoter of MIN6 cells and pancreatic islets but not in primary
hepatocytes where Tmem27 is not expressed (Figure 8). These data confirm the
Figure 5. Promoter analysis predicted two
conserved Tcf binding sites in the upstream
regulatory regions of human and mouse (bottom)
Tmem27 genes, at – 60 and – 117 base pairs relative
to the transcriptional start site. Human (top) and
mouse (bottom) promoter sequences are aligned and
22
binding could be competed by adding increasing amounts of a known binding
functionality of the Tcf1 binding sites in vivo and demonstrate that Tcf1 is
required for expression of Tmem27 in pancreatic β cells.
Figure 6. Transcriptional activation assays in HepG2
cells that were transfected with pcDNA3 or pTcf1,
pCMV-β-glactosidase, and the luciferase reporter gene
using a 815 bp Tmem27 mouse promoter (left panel). Tcf
binding sites were mutated individually in the promoter
sequence of the reporter vector and MIN6 cells were
transfected with vectors pT27luc-wt, pT27luc-m1 or
p27luc-m2. Luciferase activity was normalized to β-
galactosidase activity (right panel). Each value
represents the mean of eight independent experiments. *:
P < 0.05, **: P < 0.01, ***: P < 0.001.
Figure 7. EMSA analysis using oligonucleotides
for Tcf binding sites 1 and 2 and whole cell
extracts of MIN6 cells. Competitor represents
unlabeled double-stranded oligonucleotides at
increasing concentrations containing Tcf1
binding site of Fxr-1 promoter (Shih et al., 2001).
The signal of the free probe at the bottom of the
gel was cut off.
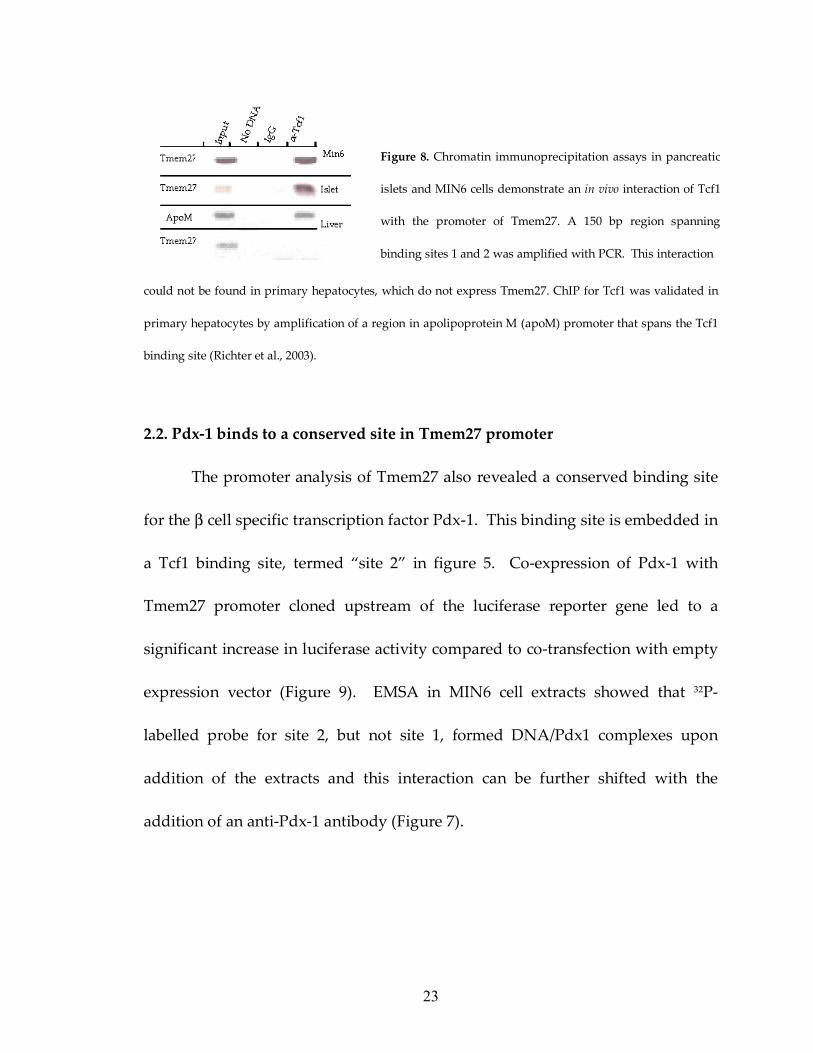
23
could not be found in primary hepatocytes, which do not express Tmem27. ChIP for Tcf1 was validated in
primary hepatocytes by amplification of a region in apolipoprotein M (apoM) promoter that spans the Tcf1
binding site (Richter et al., 2003).
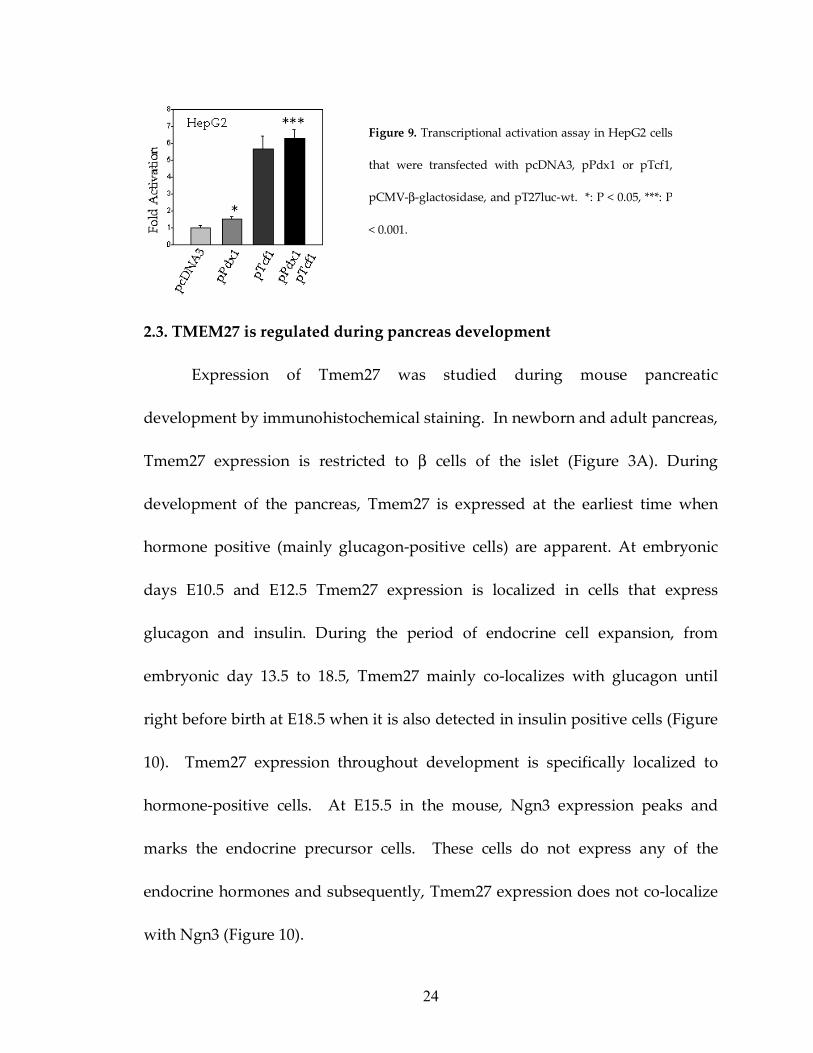
2.2. Pdx-1 binds to a conserved site in Tmem27 promoter
The promoter analysis of Tmem27 also revealed a conserved binding site
for the β cell specific transcription factor Pdx-1. This binding site is embedded in
a Tcf1 binding site, termed “site 2” in figure 5. Co-expression of Pdx-1 with
Tmem27 promoter cloned upstream of the luciferase reporter gene led to a
significant increase in luciferase activity compared to co-transfection with empty
expression vector (Figure 9). EMSA in MIN6 cell extracts showed that 32P-
labelled probe for site 2, but not site 1, formed DNA/Pdx1 complexes upon
addition of the extracts and this interaction can be further shifted with the
addition of an anti-Pdx-1 antibody (Figure 7).
Figure 8. Chromatin immunoprecipitation assays in pancreatic
islets and MIN6 cells demonstrate an in vivo interaction of Tcf1
with the promoter of Tmem27. A 150 bp region spanning
binding sites 1 and 2 was amplified with PCR. This interaction
24
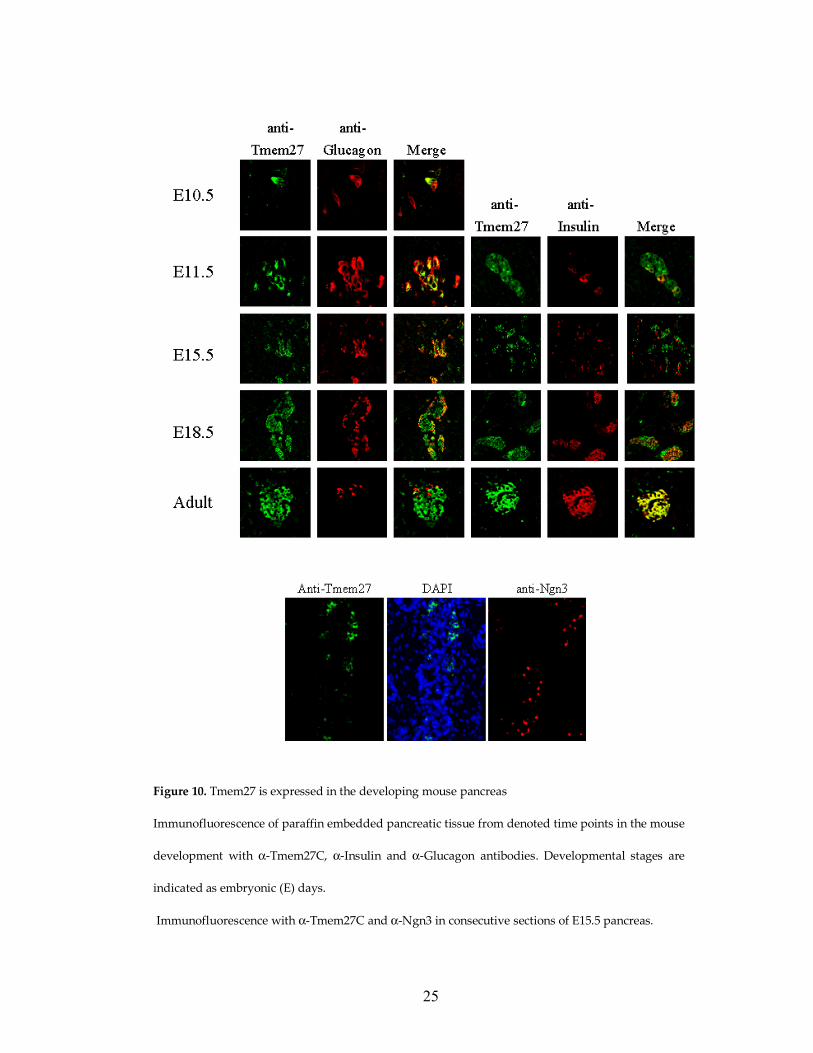
2.3. TMEM27 is regulated during pancreas development
Expression of Tmem27 was studied during mouse pancreatic
development by immunohistochemical staining. In newborn and adult pancreas,
Tmem27 expression is restricted to β cells of the islet (Figure 3A). During
development of the pancreas, Tmem27 is expressed at the earliest time when
hormone positive (mainly glucagon-positive cells) are apparent. At embryonic
days E10.5 and E12.5 Tmem27 expression is localized in cells that express
glucagon and insulin. During the period of endocrine cell expansion, from
embryonic day 13.5 to 18.5, Tmem27 mainly co-localizes with glucagon until
right before birth at E18.5 when it is also detected in insulin positive cells (Figure
10). Tmem27 expression throughout development is specifically localized to
hormone-positive cells. At E15.5 in the mouse, Ngn3 expression peaks and
marks the endocrine precursor cells. These cells do not express any of the
endocrine hormones and subsequently, Tmem27 expression does not co-localize
with Ngn3 (Figure 10).
Figure 9. Transcriptional activation assay in HepG2 cells
that were transfected with pcDNA3, pPdx1 or pTcf1,
pCMV-β-glactosidase, and pT27luc-wt. *: P < 0.05, ***: P
< 0.001.
25
Figure 10. Tmem27 is expressed in the developing mouse pancreas
Immunofluorescence of paraffin embedded pancreatic tissue from denoted time points in the mouse
development with α-Tmem27C, α-Insulin and α-Glucagon antibodies. Developmental stages are
indicated as embryonic (E) days.
Immunofluorescence with α-Tmem27C and α-Ngn3 in consecutive sections of E15.5 pancreas.
26
2.4. Tmem27 is an N-linked glycoprotein and forms dimers in vivo
Tmem27 contains two predicted N-glycosylation sites at amino acid
residues 76 and 93, respectively. MIN6 cells were treated with tunicamycin, an
inhibitor of N-glycosylation (Waechter and Lennarz, 1976). Cells were incubated
in the presence of increasing concentrations of tunicamycin and protein extracts
were prepared and analyzed by SDS-PAGE and immunoblotting. Two bands
with increased electrophoretic mobility appeared upon treatment with
tunicamycin, whereas the high molecular weight protein disappeared (Figure
11). This result was confirmed with an in vitro assay using N-glycanase, an
enzyme that releases intact N-linked glycans (Figure 11). These data suggest that
Tmem27 is an N-linked glycoprotein.
I also carried out chemical cross-linking experiments to test if Tmem27
protein exists as a multimer. MIN6 cell extracts were incubated in the presence
of two different cross-linking reagents: BMH (bismaleimidohexane), a
membrane-permeable, non-cleavable compound and DTBP (dimethyl 3, 3’-
dithiobispropionimidate), a membrane permeable, cleavable compound.
Following these treatments, an SDS-PAGE analysis was performed under
reducing and non-reducing conditions (Partis et al., 1983; Geisler et al. 1992).
Non-reducing western blots revealed a band of exactly twice the molecular
weight than under reducing conditions. Cell extracts treated with BMH showed
27
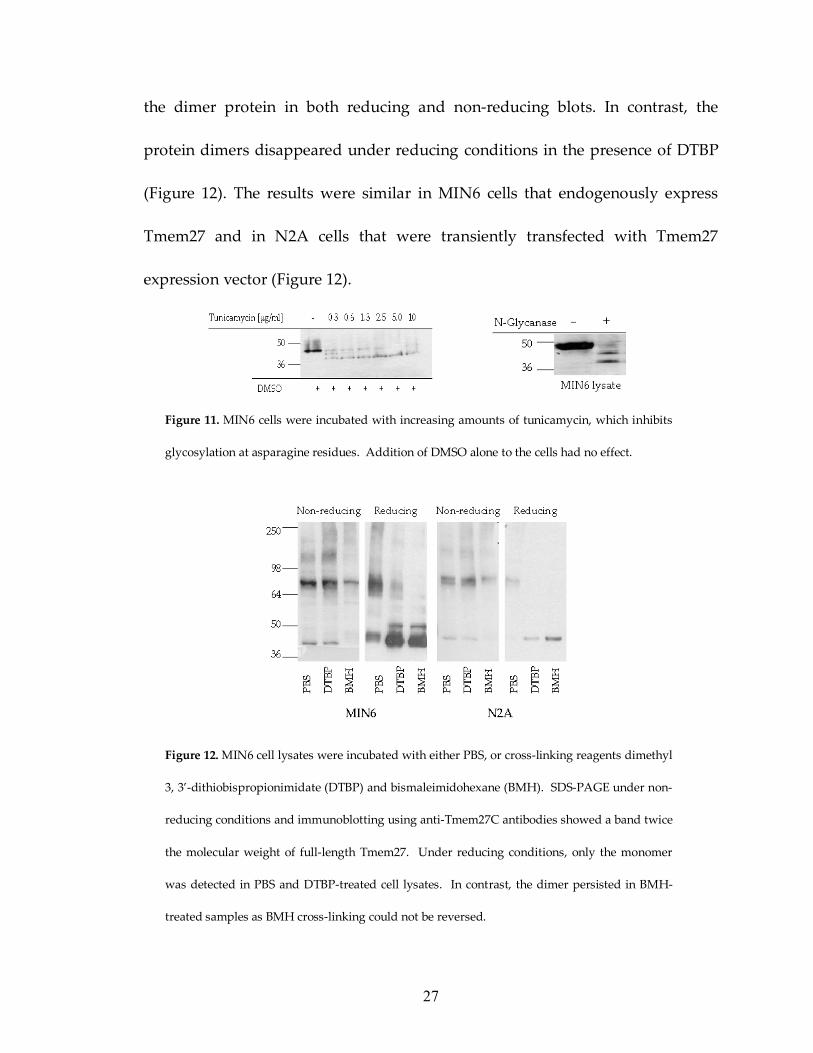
the dimer protein in both reducing and non-reducing blots. In contrast, the
protein dimers disappeared under reducing conditions in the presence of DTBP
(Figure 12). The results were similar in MIN6 cells that endogenously express
Tmem27 and in N2A cells that were transiently transfected with Tmem27
expression vector (Figure 12).
Figure 11. MIN6 cells were incubated with increasing amounts of tunicamycin, which inhibits
glycosylation at asparagine residues. Addition of DMSO alone to the cells had no effect.
Figure 12. MIN6 cell lysates were incubated with either PBS, or cross-linking reagents dimethyl
3, 3’-dithiobispropionimidate (DTBP) and bismaleimidohexane (BMH). SDS-PAGE under non-
reducing conditions and immunoblotting using anti-Tmem27C antibodies showed a band twice
the molecular weight of full-length Tmem27. Under reducing conditions, only the monomer
was detected in PBS and DTBP-treated cell lysates. In contrast, the dimer persisted in BMH-
treated samples as BMH cross-linking could not be reversed.
28
2.5. Tmem27 is cleaved and shed from pancreatic β cells
Tmem27 has previously been predicted to be a transmembrane protein
with an N-terminal extracellular domain (Zhang et al., 2001). We generated two
antibodies (α-Tmem27N and α-Tmem27C) that recognize peptides from extra-
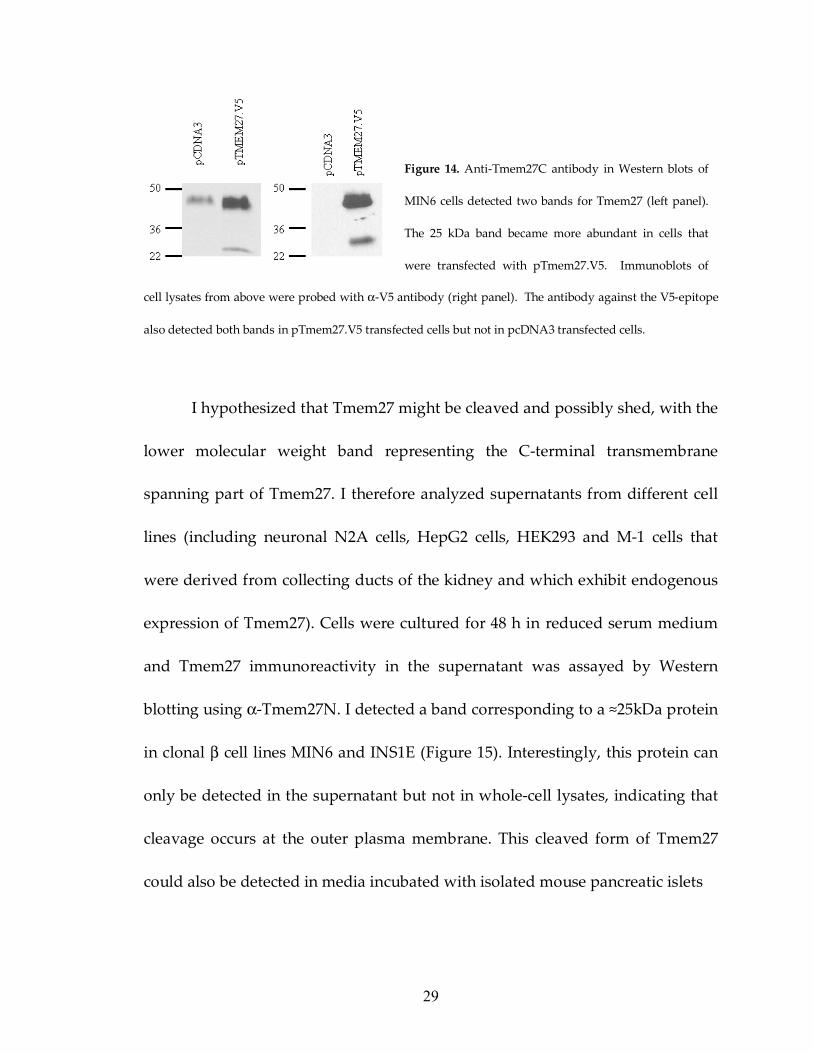
and intracellular domains of the protein, respectively (Figure 13). In Western
blotting experiments α-Tmem27C detected two bands in whole cell lysates of
MIN6 cells (Figure 14). The higher molecular weight band corresponded to the
predicted molecular weight of the glycosylated full-length protein. The lower
band (≈25 kD) was also specific since it could be detected by Western blotting in
cell lysates following transfection with a vector (p-Tmem27.V5) expressing a C-
terminal V5-Tag fusion protein and an anti-V5 antibody (Figure 14).
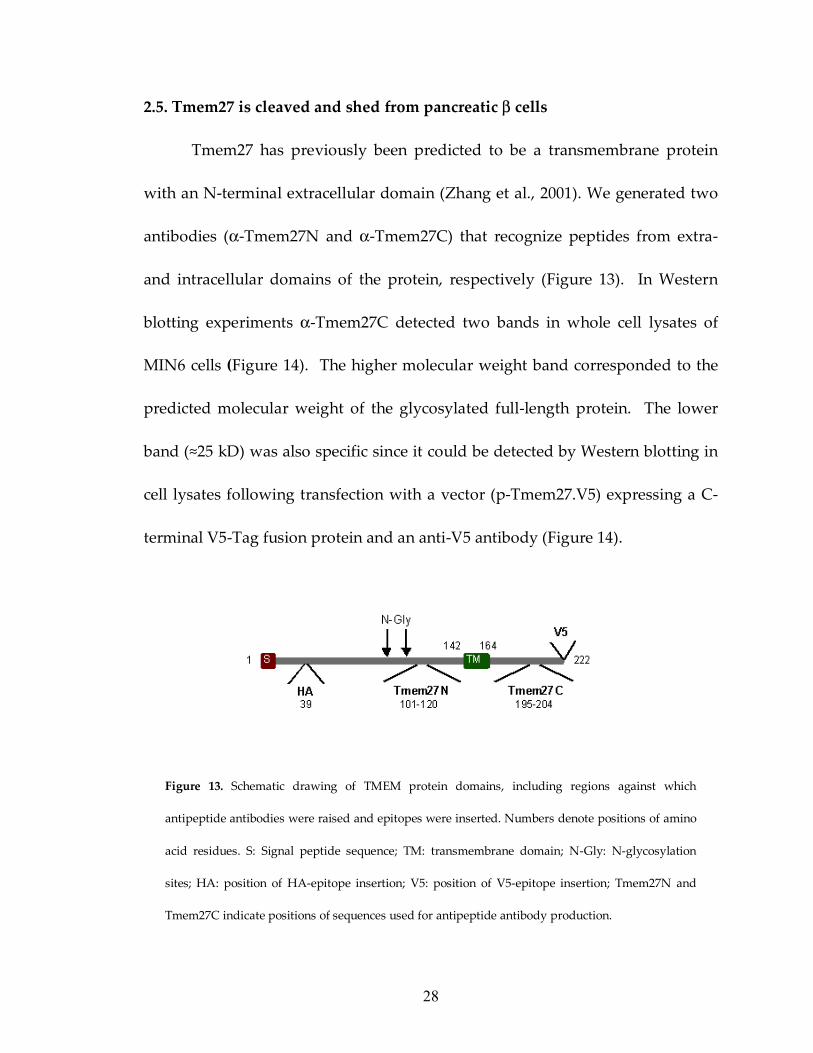
Figure 13. Schematic drawing of TMEM protein domains, including regions against which
antipeptide antibodies were raised and epitopes were inserted. Numbers denote positions of amino
acid residues. S: Signal peptide sequence; TM: transmembrane domain; N-Gly: N-glycosylation
sites; HA: position of HA-epitope insertion; V5: position of V5-epitope insertion; Tmem27N and
Tmem27C indicate positions of sequences used for antipeptide antibody production.
29
cell lysates from above were probed with α-V5 antibody (right panel). The antibody against the V5-epitope
also detected both bands in pTmem27.V5 transfected cells but not in pcDNA3 transfected cells.
I hypothesized that Tmem27 might be cleaved and possibly shed, with the
lower molecular weight band representing the C-terminal transmembrane
spanning part of Tmem27. I therefore analyzed supernatants from different cell
lines (including neuronal N2A cells, HepG2 cells, HEK293 and M-1 cells that
were derived from collecting ducts of the kidney and which exhibit endogenous
expression of Tmem27). Cells were cultured for 48 h in reduced serum medium
and Tmem27 immunoreactivity in the supernatant was assayed by Western
blotting using α-Tmem27N. I detected a band corresponding to a ≈25kDa protein
in clonal β cell lines MIN6 and INS1E (Figure 15). Interestingly, this protein can
only be detected in the supernatant but not in whole-cell lysates, indicating that
cleavage occurs at the outer plasma membrane. This cleaved form of Tmem27
could also be detected in media incubated with isolated mouse pancreatic islets
Figure 14. Anti-Tmem27C antibody in Western blots of
MIN6 cells detected two bands for Tmem27 (left panel).
The 25 kDa band became more abundant in cells that
were transfected with pTmem27.V5. Immunoblots of
30
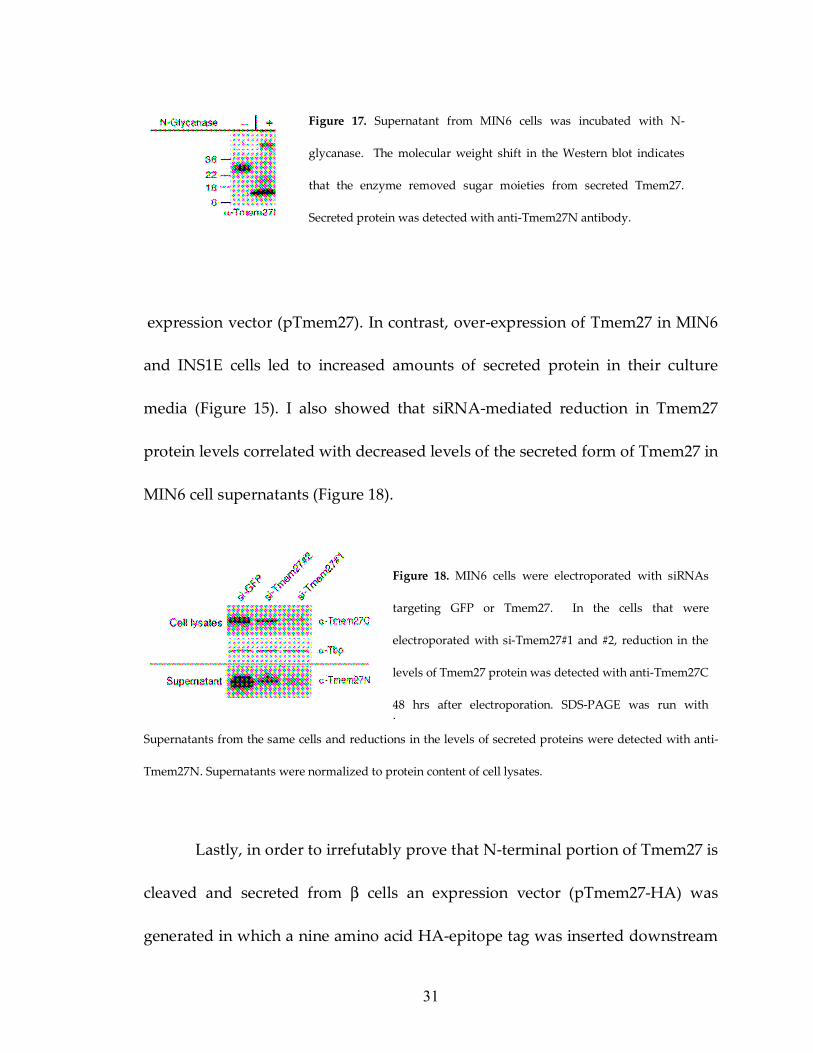
(Figure 16). Treatment of supernatants with N-Glycanase led to the
disappearance of the ≈25kDa protein and the emergence of a band at ≈12kDa, the
expected molecular weight of the unglycosylated N-terminal domain of Tmem27
(Figure 17). Interestingly, in spite of robust expression of full-length protein in
cell-lysates, I failed to detect this band in Western blot analysis in the culture
medium of non-β cell lines that were transiently transfected with a Tmem27
expre
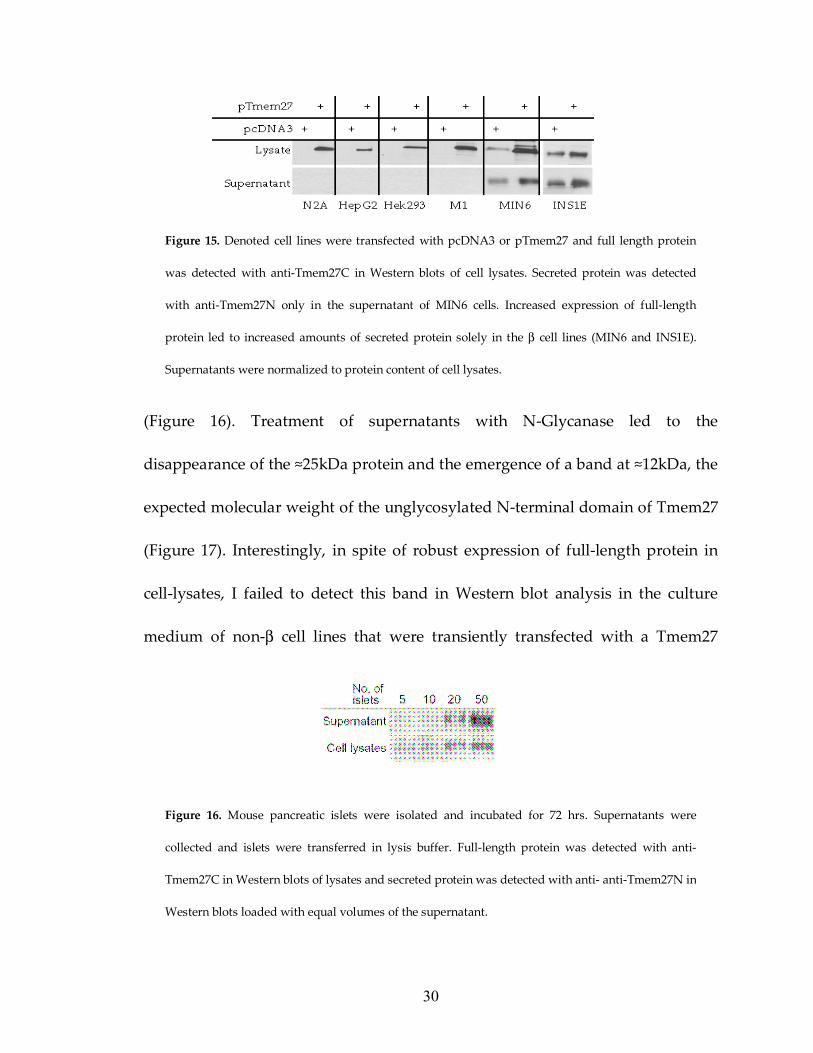
Figure 15. Denoted cell lines were transfected with pcDNA3 or pTmem27 and full length protein
was detected with anti-Tmem27C in Western blots of cell lysates. Secreted protein was detected
with anti-Tmem27N only in the supernatant of MIN6 cells. Increased expression of full-length
protein led to increased amounts of secreted protein solely in the β cell lines (MIN6 and INS1E).
Supernatants were normalized to protein content of cell lysates.
Figure 16. Mouse pancreatic islets were isolated and incubated for 72 hrs. Supernatants were
collected and islets were transferred in lysis buffer. Full-length protein was detected with anti-
Tmem27C in Western blots of lysates and secreted protein was detected with anti- anti-Tmem27N in
Western blots loaded with equal volumes of the supernatant.
31
expression vector (pTmem27). In contrast, over-expression of Tmem27 in MIN6
and INS1E cells led to increased amounts of secreted protein in their culture
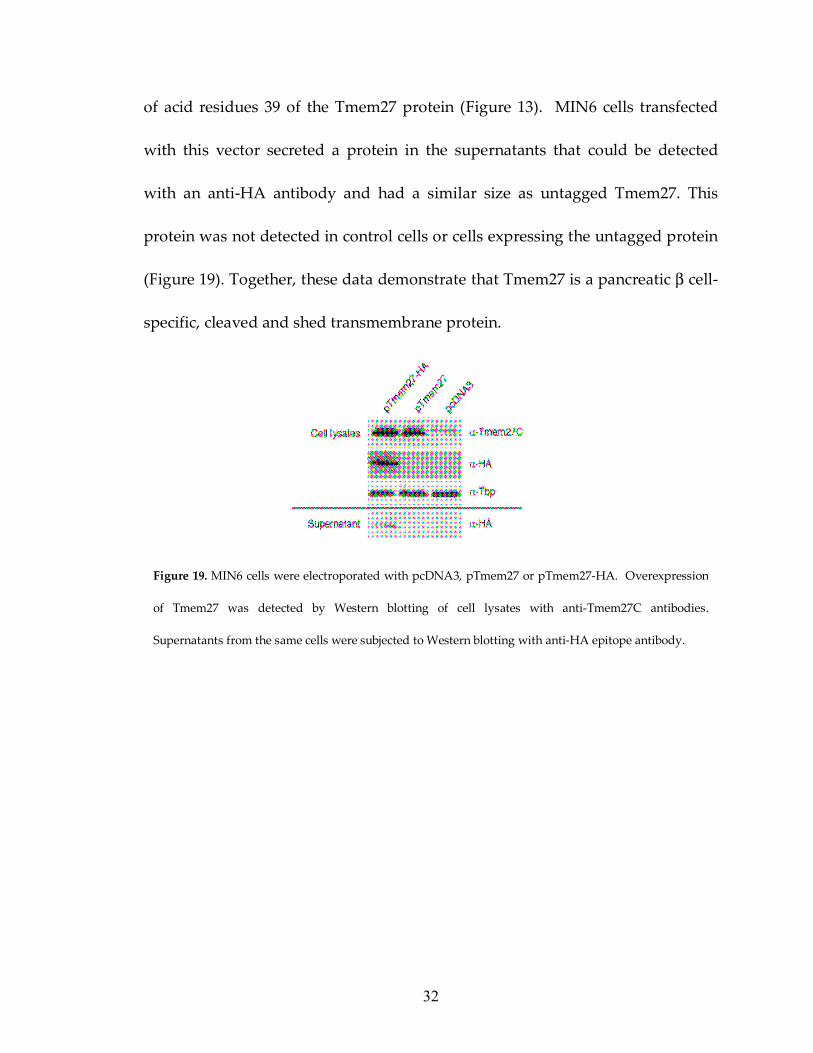
media (Figure 15). I also showed that siRNA-mediated reduction in Tmem27
protein levels correlated with decreased levels of the secreted form of Tmem27 in
MIN6 cell supernatants (Figure 18).
Supernatants from the same cells and reductions in the levels of secreted proteins were detected with anti-
Tmem27N. Supernatants were normalized to protein content of cell lysates.
Lastly, in order to irrefutably prove that N-terminal portion of Tmem27 is
cleaved and secreted from β cells an expression vector (pTmem27-HA) was
generated in which a nine amino acid HA-epitope tag was inserted downstream
Figure 17. Supernatant from MIN6 cells was incubated with N-
glycanase. The molecular weight shift in the Western blot indicates
that the enzyme removed sugar moieties from secreted Tmem27.
Secreted protein was detected with anti-Tmem27N antibody.
Figure 18. MIN6 cells were electroporated with siRNAs
targeting GFP or Tmem27. In the cells that were
electroporated with si-Tmem27#1 and #2, reduction in the
levels of Tmem27 protein was detected with anti-Tmem27C
48 hrs after electroporation. SDS-PAGE was run with
32
of acid residues 39 of the Tmem27 protein (Figure 13). MIN6 cells transfected
with this vector secreted a protein in the supernatants that could be detected
with an anti-HA antibody and had a similar size as untagged Tmem27. This
protein was not detected in control cells or cells expressing the untagged protein
(Figure 19). Together, these data demonstrate that Tmem27 is a pancreatic β cell-
specific, cleaved and shed transmembrane protein.
Figure 19. MIN6 cells were electroporated with pcDNA3, pTmem27 or pTmem27-HA. Overexpression
of Tmem27 was detected by Western blotting of cell lysates with anti-Tmem27C antibodies.
Supernatants from the same cells were subjected to Western blotting with anti-HA epitope antibody.
33
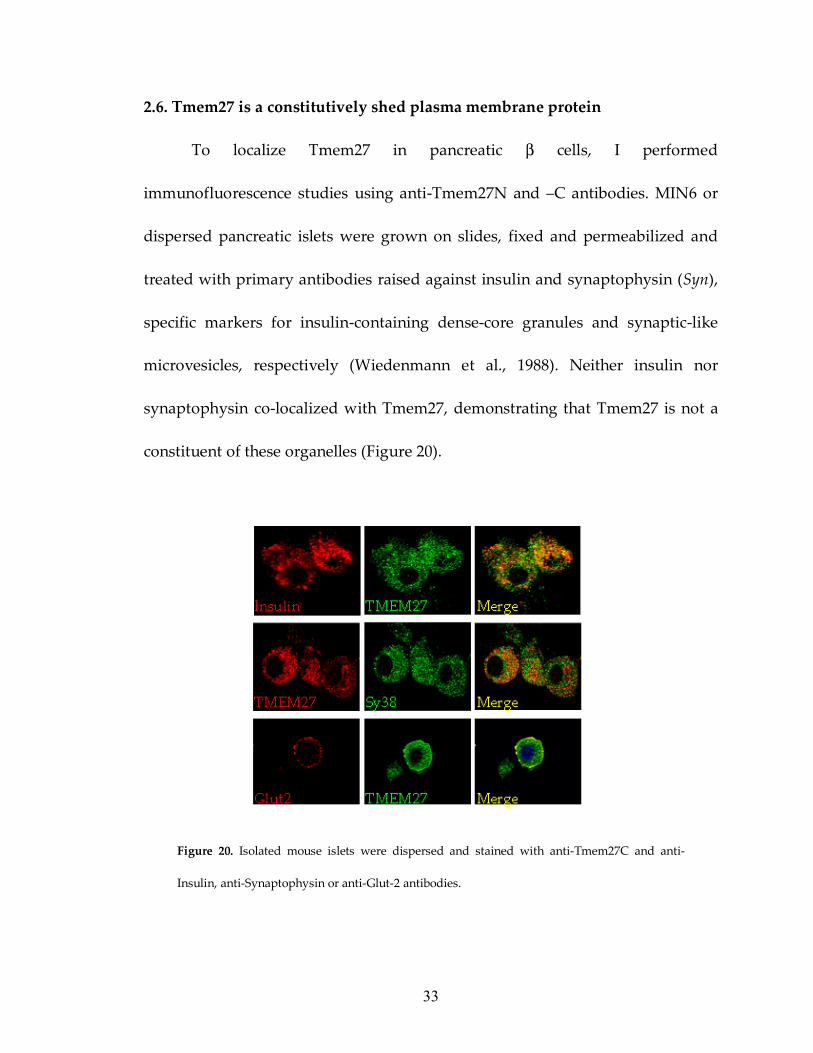
2.6. Tmem27 is a constitutively shed plasma membrane protein
To localize Tmem27 in pancreatic β cells, I performed
immunofluorescence studies using anti-Tmem27N and –C antibodies. MIN6 or
dispersed pancreatic islets were grown on slides, fixed and permeabilized and
treated with primary antibodies raised against insulin and synaptophysin (Syn),
specific markers for insulin-containing dense-core granules and synaptic-like
microvesicles, respectively (Wiedenmann et al., 1988). Neither insulin nor
synaptophysin co-localized with Tmem27, demonstrating that Tmem27 is not a
constituent of these organelles (Figure 20).
Figure 20. Isolated mouse islets were dispersed and stained with anti-Tmem27C and anti-
Insulin, anti-Synaptophysin or anti-Glut-2 antibodies.
34
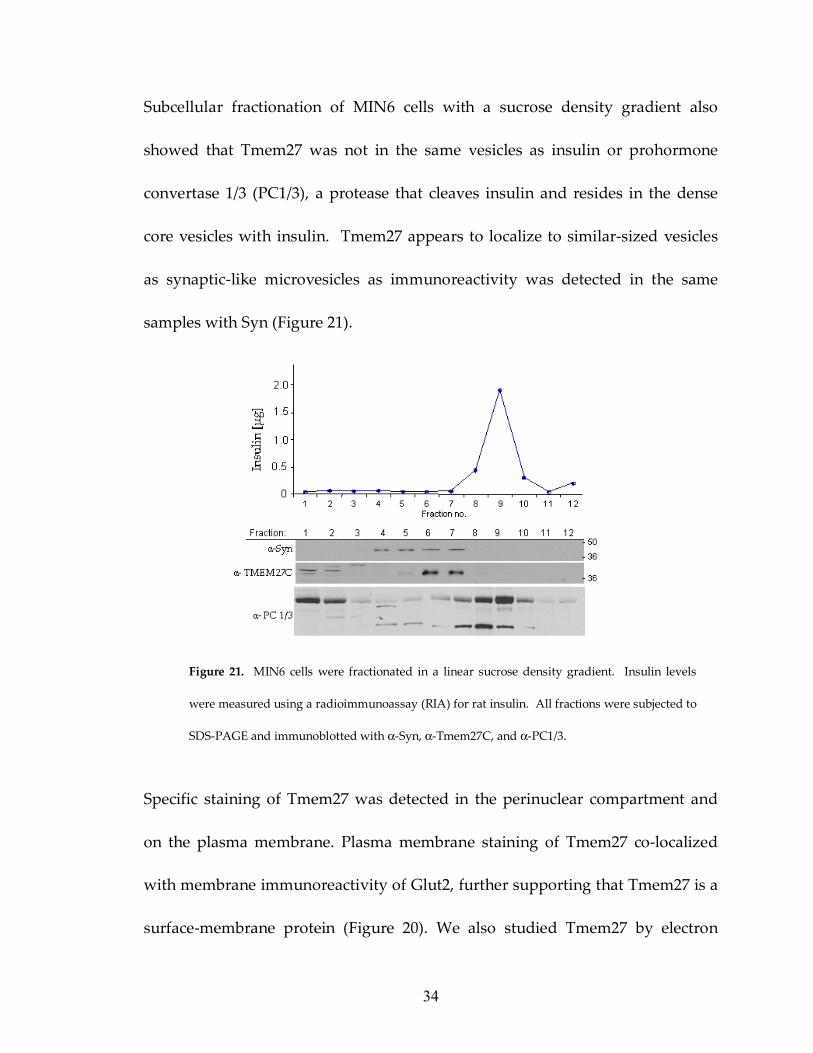
Subcellular fractionation of MIN6 cells with a sucrose density gradient also
showed that Tmem27 was not in the same vesicles as insulin or prohormone
convertase 1/3 (PC1/3), a protease that cleaves insulin and resides in the dense
core vesicles with insulin. Tmem27 appears to localize to similar-sized vesicles
as synaptic-like microvesicles as immunoreactivity was detected in the same
samples with Syn (Figure 21).
Specific staining of Tmem27 was detected in the perinuclear compartment and
on the plasma membrane. Plasma membrane staining of Tmem27 co-localized
with membrane immunoreactivity of Glut2, further supporting that Tmem27 is a
surface-membrane protein (Figure 20). We also studied Tmem27 by electron
Figure 21. MIN6 cells were fractionated in a linear sucrose density gradient. Insulin levels
were measured using a radioimmunoassay (RIA) for rat insulin. All fractions were subjected to
SDS-PAGE and immunoblotted with α-Syn, α-Tmem27C, and α-PC1/3.
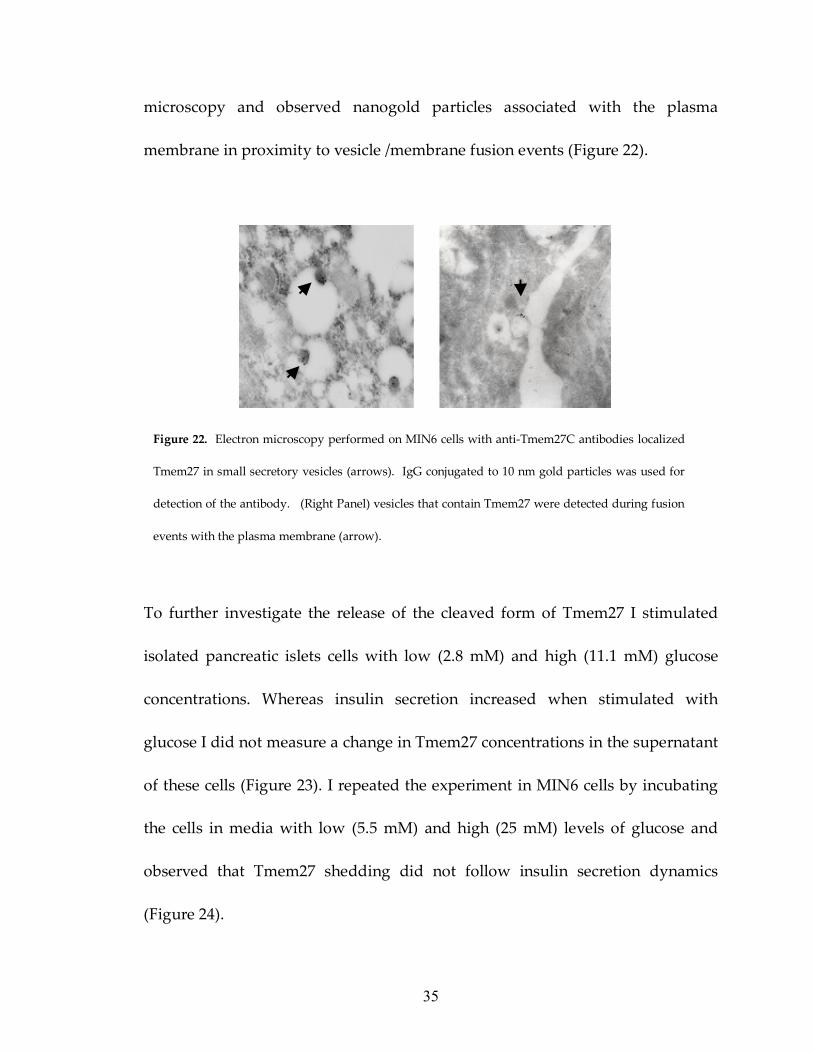
35
microscopy and observed nanogold particles associated with the plasma
membrane in proximity to vesicle /membrane fusion events (Figure 22).
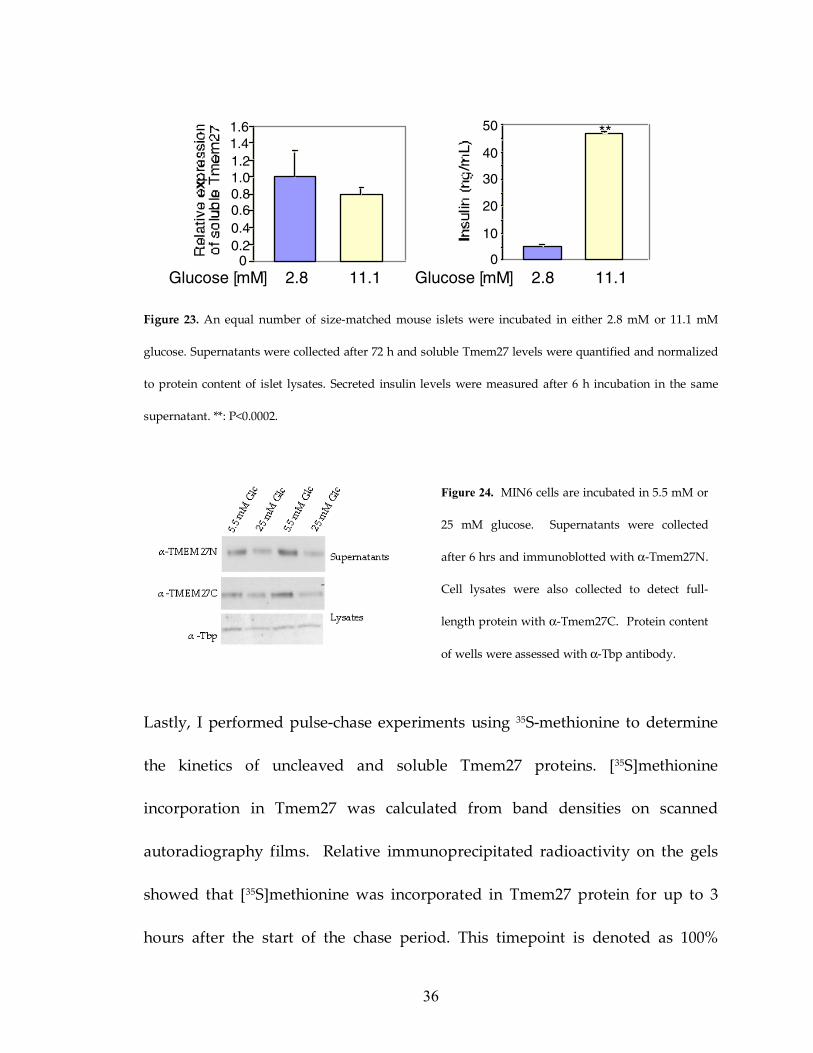
To further investigate the release of the cleaved form of Tmem27 I stimulated
isolated pancreatic islets cells with low (2.8 mM) and high (11.1 mM) glucose
concentrations. Whereas insulin secretion increased when stimulated with
glucose I did not measure a change in Tmem27 concentrations in the supernatant
of these cells (Figure 23). I repeated the experiment in MIN6 cells by incubating
the cells in media with low (5.5 mM) and high (25 mM) levels of glucose and
observed that Tmem27 shedding did not follow insulin secretion dynamics
(Figure 24).
Figure 22. Electron microscopy performed on MIN6 cells with anti-Tmem27C antibodies localized
Tmem27 in small secretory vesicles (arrows). IgG conjugated to 10 nm gold particles was used for
detection of the antibody. (Right Panel) vesicles that contain Tmem27 were detected during fusion
events with the plasma membrane (arrow).
36
Figure 23. An equal number of size-matched mouse islets were incubated in either 2.8 mM or 11.1 mM
glucose. Supernatants were collected after 72 h and soluble Tmem27 levels were quantified and normalized
to protein content of islet lysates. Secreted insulin levels were measured after 6 h incubation in the same
supernatant. **: P<0.0002.
Lastly, I performed pulse-chase experiments using 35S-methionine to determine
the kinetics of uncleaved and soluble Tmem27 proteins. [35S]methionine
incorporation in Tmem27 was calculated from band densities on scanned
autoradiography films. Relative immunoprecipitated radioactivity on the gels
showed that [35S]methionine was incorporated in Tmem27 protein for up to 3
hours after the start of the chase period. This timepoint is denoted as 100%
0
10
20
30
40
50
Glucose [mM] 2.8 11.1
**
00.20.40.60.81.01.21.41.6
Glucose [mM] 2.8 11.1
Figure 24. MIN6 cells are incubated in 5.5 mM or
25 mM glucose. Supernatants were collected
after 6 hrs and immunoblotted with α-Tmem27N.
Cell lysates were also collected to detect full-
length protein with α-Tmem27C. Protein content
of wells were assessed with α-Tbp antibody.
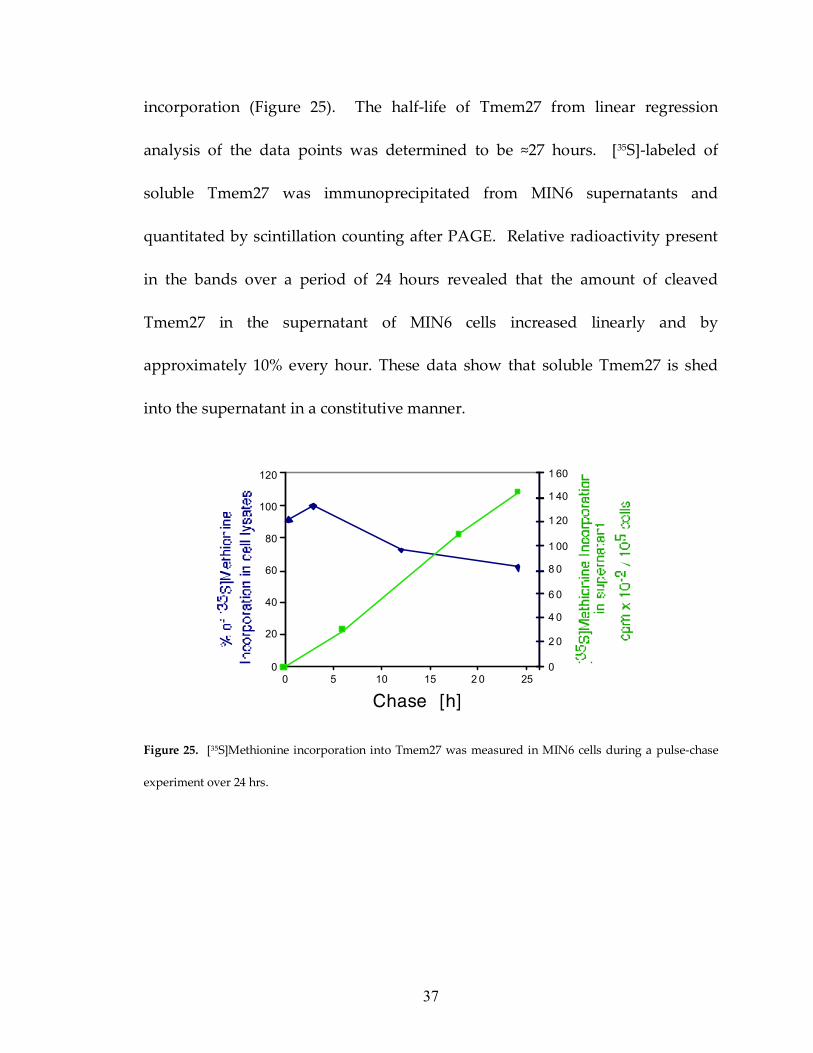
37
incorporation (Figure 25). The half-life of Tmem27 from linear regression
analysis of the data points was determined to be ≈27 hours. [35S]-labeled of
soluble Tmem27 was immunoprecipitated from MIN6 supernatants and
quantitated by scintillation counting after PAGE. Relative radioactivity present
in the bands over a period of 24 hours revealed that the amount of cleaved
Tmem27 in the supernatant of MIN6 cells increased linearly and by
approximately 10% every hour. These data show that soluble Tmem27 is shed
into the supernatant in a constitutive manner.
Figure 25. [35S]Methionine incorporation into Tmem27 was measured in MIN6 cells during a pulse-chase
experiment over 24 hrs.
0
20
40
60
80
100
120
0 5 10 15 2 0 250
2 0
4 0
6 0
8 0
1 00
1 20
1 40
1 60
Chase [h]
38
2.7. Search for a cleavage site and protease
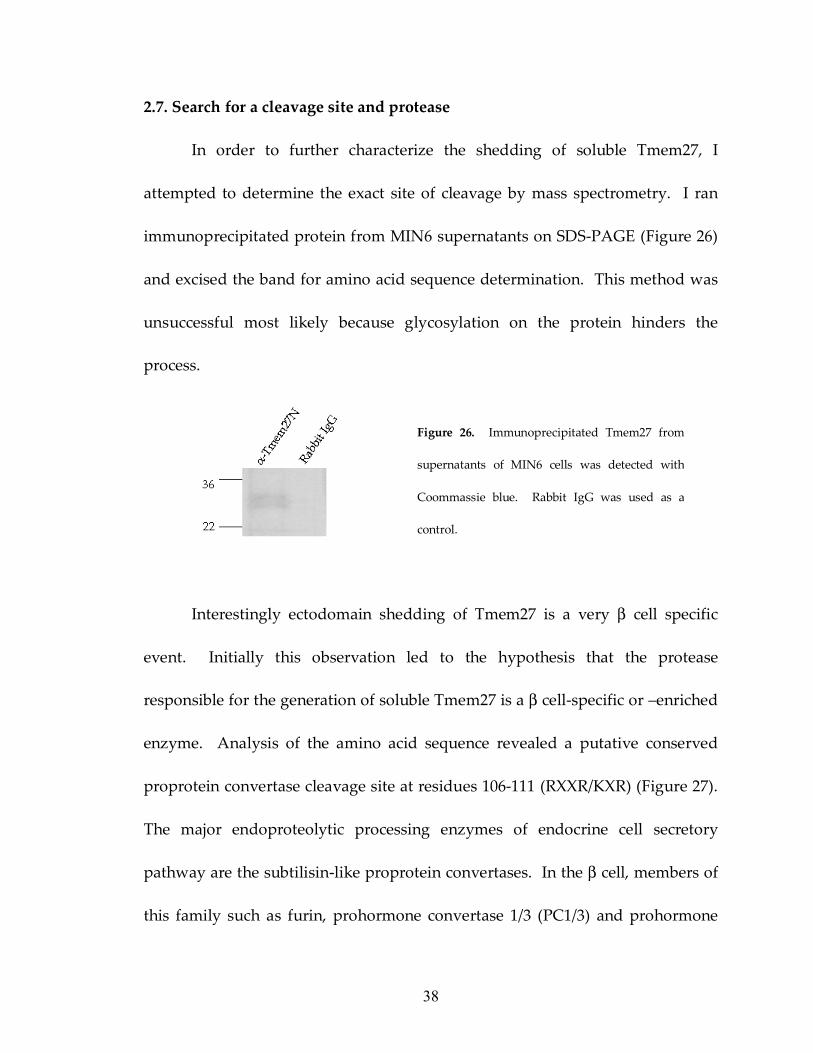
In order to further characterize the shedding of soluble Tmem27, I
attempted to determine the exact site of cleavage by mass spectrometry. I ran
immunoprecipitated protein from MIN6 supernatants on SDS-PAGE (Figure 26)
and excised the band for amino acid sequence determination. This method was
unsuccessful most likely because glycosylation on the protein hinders the
process.
Interestingly ectodomain shedding of Tmem27 is a very β cell specific
event. Initially this observation led to the hypothesis that the protease
responsible for the generation of soluble Tmem27 is a β cell-specific or –enriched
enzyme. Analysis of the amino acid sequence revealed a putative conserved
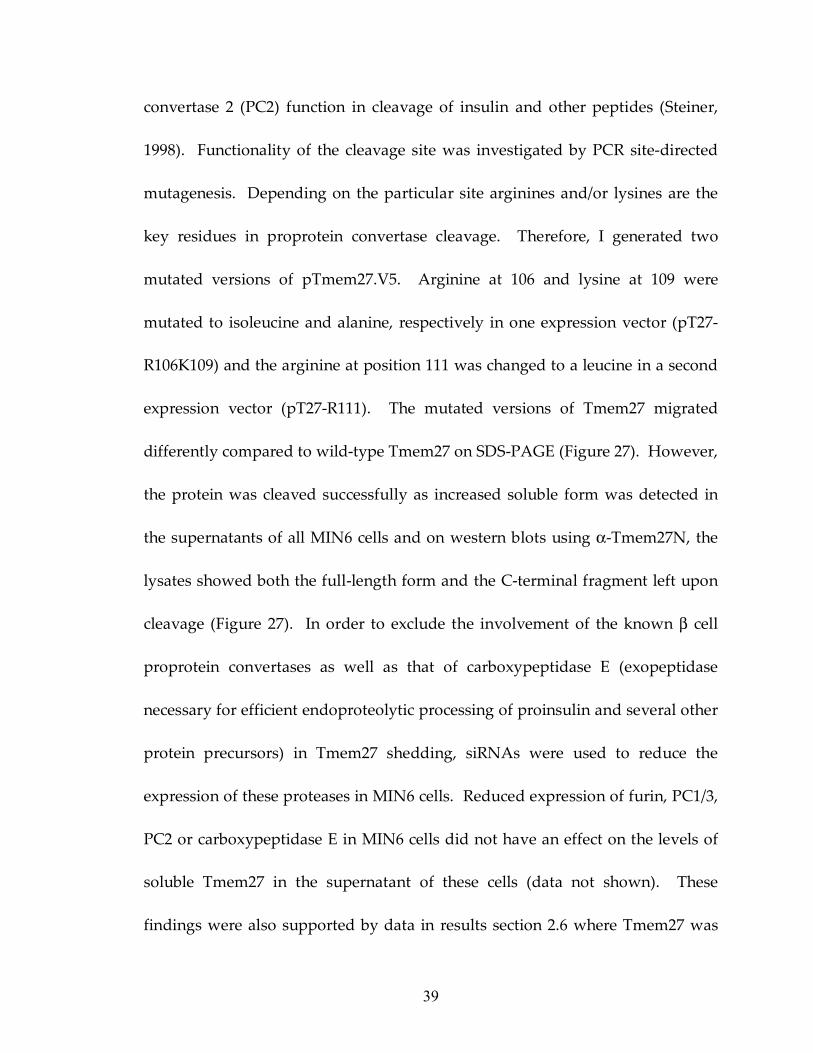
proprotein convertase cleavage site at residues 106-111 (RXXR/KXR) (Figure 27).
The major endoproteolytic processing enzymes of endocrine cell secretory
pathway are the subtilisin-like proprotein convertases. In the β cell, members of
this family such as furin, prohormone convertase 1/3 (PC1/3) and prohormone
Figure 26. Immunoprecipitated Tmem27 from
supernatants of MIN6 cells was detected with
Coommassie blue. Rabbit IgG was used as a
control.
39
convertase 2 (PC2) function in cleavage of insulin and other peptides (Steiner,
1998). Functionality of the cleavage site was investigated by PCR site-directed
mutagenesis. Depending on the particular site arginines and/or lysines are the
key residues in proprotein convertase cleavage. Therefore, I generated two
mutated versions of pTmem27.V5. Arginine at 106 and lysine at 109 were
mutated to isoleucine and alanine, respectively in one expression vector (pT27-
R106K109) and the arginine at position 111 was changed to a leucine in a second
expression vector (pT27-R111). The mutated versions of Tmem27 migrated
differently compared to wild-type Tmem27 on SDS-PAGE (Figure 27). However,
the protein was cleaved successfully as increased soluble form was detected in
the supernatants of all MIN6 cells and on western blots using α-Tmem27N, the
lysates showed both the full-length form and the C-terminal fragment left upon
cleavage (Figure 27). In order to exclude the involvement of the known β cell
proprotein convertases as well as that of carboxypeptidase E (exopeptidase
necessary for efficient endoproteolytic processing of proinsulin and several other
protein precursors) in Tmem27 shedding, siRNAs were used to reduce the
expression of these proteases in MIN6 cells. Reduced expression of furin, PC1/3,
PC2 or carboxypeptidase E in MIN6 cells did not have an effect on the levels of
soluble Tmem27 in the supernatant of these cells (data not shown). These
findings were also supported by data in results section 2.6 where Tmem27 was
40
localized to vesicles separate from insulin containing secretory granules where
the prohormone convertases reside.
Various non-β cell lines were tested for Tmem27 shedding with negative
results. Examination of the data from Affymetrix™ array of Tcf1–/– islets revealed
regulation of hepatocyte growth factor activator (HGFA) expression. Expression
levels of HGFA was markedly reduced in the islets of Tcf1–/– mice compared to
wild-type controls. Two experiments were performed to investigate the
possibility of a role HGFA might play in Tmem27 cleavage. First, isolated
primary hepatocytes were infected with an adenovirus expressing the human
Tmem27 protein (Adv-hTmem27). Supernatants were run on SDS-PAGE and
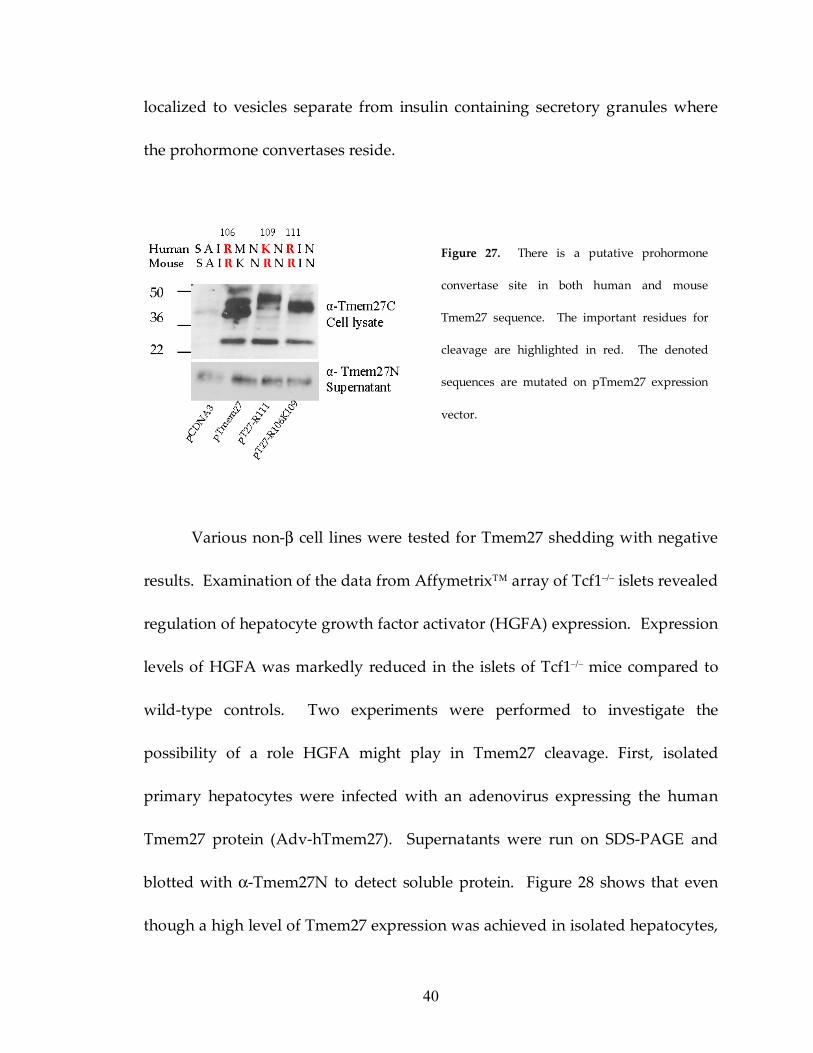
blotted with α-Tmem27N to detect soluble protein. Figure 28 shows that even
though a high level of Tmem27 expression was achieved in isolated hepatocytes,
Figure 27. There is a putative prohormone
convertase site in both human and mouse
Tmem27 sequence. The important residues for
cleavage are highlighted in red. The denoted
sequences are mutated on pTmem27 expression
vector.
41
no protein shedding occurred in the supernatants 48hrs after infection. Secondly,
neither over-expression of HGFA protein nor reduction of its expression with
several siRNAs had any effect on the levels of soluble Tmem27 in the
supernatants of MIN6 cells (data not shown).
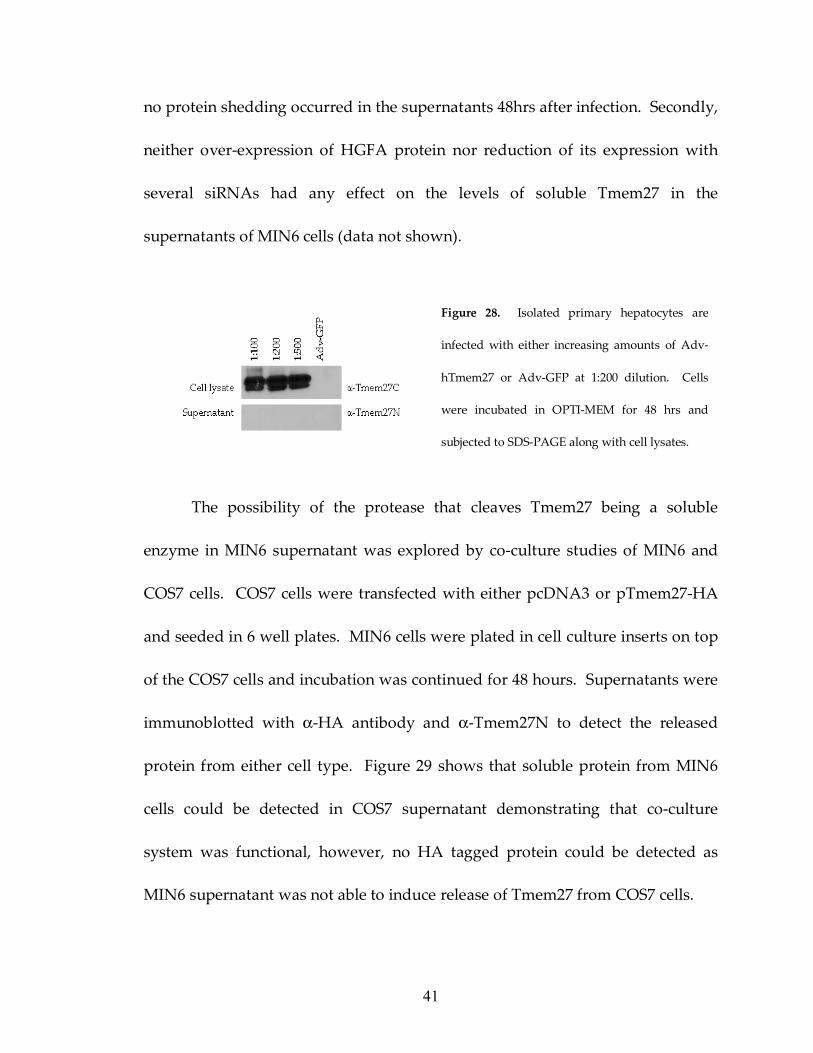
The possibility of the protease that cleaves Tmem27 being a soluble
enzyme in MIN6 supernatant was explored by co-culture studies of MIN6 and
COS7 cells. COS7 cells were transfected with either pcDNA3 or pTmem27-HA
and seeded in 6 well plates. MIN6 cells were plated in cell culture inserts on top
of the COS7 cells and incubation was continued for 48 hours. Supernatants were
immunoblotted with α-HA antibody and α-Tmem27N to detect the released
protein from either cell type. Figure 29 shows that soluble protein from MIN6
cells could be detected in COS7 supernatant demonstrating that co-culture
system was functional, however, no HA tagged protein could be detected as
MIN6 supernatant was not able to induce release of Tmem27 from COS7 cells.
Figure 28. Isolated primary hepatocytes are
infected with either increasing amounts of Adv-
hTmem27 or Adv-GFP at 1:200 dilution. Cells
were incubated in OPTI-MEM for 48 hrs and
subjected to SDS-PAGE along with cell lysates.
42
Ectodomain shedding is an important regulatory mechanism in the
function of membrane-bound cell-surface molecules (Arribas and Borroto, 2002)
and the most widely studied inducer of shedding is phorbol 12-myristate 13-
acetate (PMA), which activates protein kinase C (Schlondorff and Blobel, 1999).
Upon incubation of MIN6 cells with PMA, shedding of Tmem27 was also
stimulated. MIN6 cells were incubated in either 1 µM PMA or DMSO in OPTI-
MEM for 1.5 hours and Figure 30 shows that cells, that were stimulated with
PMA, had significantly more soluble Tmem27 in the media. Upon this finding, I
investigated whether other cell types that do not endogenously express Tmem27
would be able to shed the ectodomain with PMA stimulation. COS7 cells were
transfected with pTmem27.V5 and 48 hours later they were stimulated with
PMA for 6 hours. The supernatant from PMA and DMSO treated cells were
immunoblotted with α-Tmem27N. PMA stimulated COS7-pTmem27.V5 showed
Figure 29. COS7 cells were transfected with either
pcDNA3 or pTmem27-HA and co-cultured with
MIN6 cells that were electroporated with
pcDNA3 or pTmem27.V5. Top legend shows
overexpression of Tmem27 in COS7 and MIN6
cells. Bottom legend denotes two layers of the co-
culture setup.
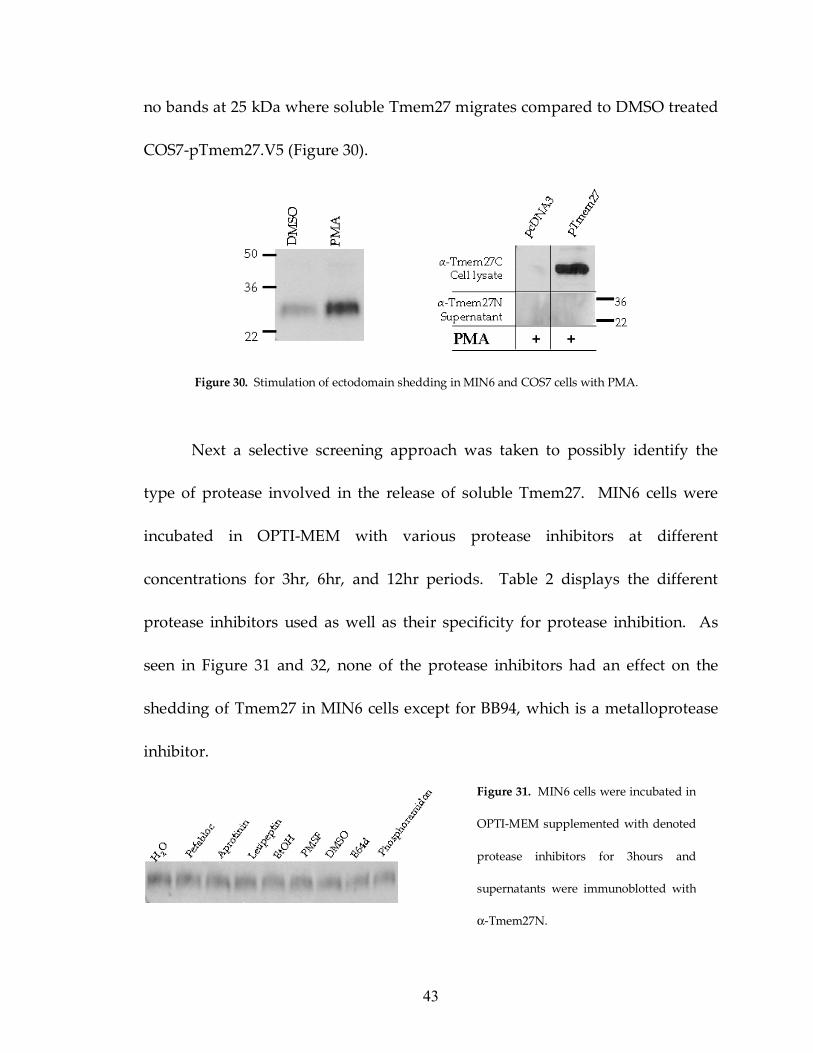
43
no bands at 25 kDa where soluble Tmem27 migrates compared to DMSO treated
COS7-pTmem27.V5 (Figure 30).
Figure 30. Stimulation of ectodomain shedding in MIN6 and COS7 cells with PMA.
Next a selective screening approach was taken to possibly identify the
type of protease involved in the release of soluble Tmem27. MIN6 cells were
incubated in OPTI-MEM with various protease inhibitors at different
concentrations for 3hr, 6hr, and 12hr periods. Table 2 displays the different
protease inhibitors used as well as their specificity for protease inhibition. As
seen in Figure 31 and 32, none of the protease inhibitors had an effect on the
shedding of Tmem27 in MIN6 cells except for BB94, which is a metalloprotease
inhibitor.
Figure 31. MIN6 cells were incubated in
OPTI-MEM supplemented with denoted
protease inhibitors for 3hours and
supernatants were immunoblotted with
α-Tmem27N.
44
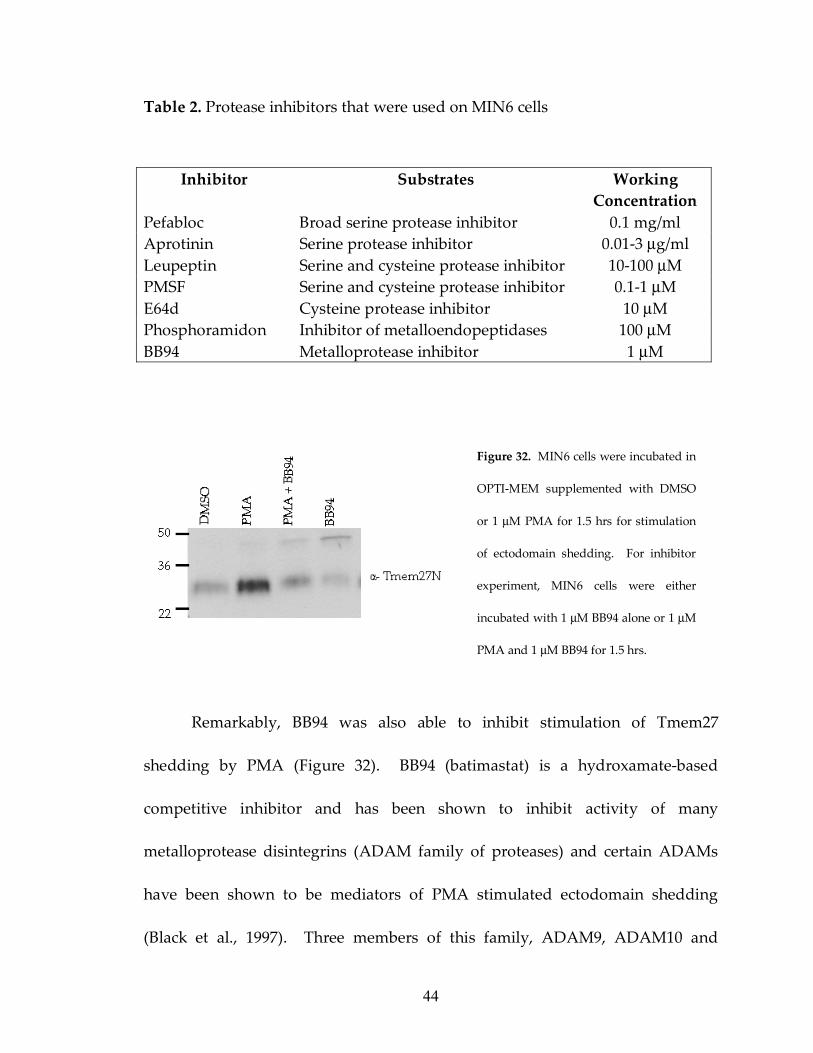
Table 2. Protease inhibitors that were used on MIN6 cells
Remarkably, BB94 was also able to inhibit stimulation of Tmem27
shedding by PMA (Figure 32). BB94 (batimastat) is a hydroxamate-based
competitive inhibitor and has been shown to inhibit activity of many
metalloprotease disintegrins (ADAM family of proteases) and certain ADAMs
have been shown to be mediators of PMA stimulated ectodomain shedding
(Black et al., 1997). Three members of this family, ADAM9, ADAM10 and
Inhibitor Substrates Working Concentration
Pefabloc Broad serine protease inhibitor 0.1 mg/ml Aprotinin Serine protease inhibitor 0.01-3 µg/ml Leupeptin Serine and cysteine protease inhibitor 10-100 µM PMSF Serine and cysteine protease inhibitor 0.1-1 µM E64d Cysteine protease inhibitor 10 µM Phosphoramidon Inhibitor of metalloendopeptidases 100 µM BB94 Metalloprotease inhibitor 1 µM
Figure 32. MIN6 cells were incubated in
OPTI-MEM supplemented with DMSO
or 1 µM PMA for 1.5 hrs for stimulation
of ectodomain shedding. For inhibitor
experiment, MIN6 cells were either
incubated with 1 µM BB94 alone or 1 µM
PMA and 1 µM BB94 for 1.5 hrs.
45
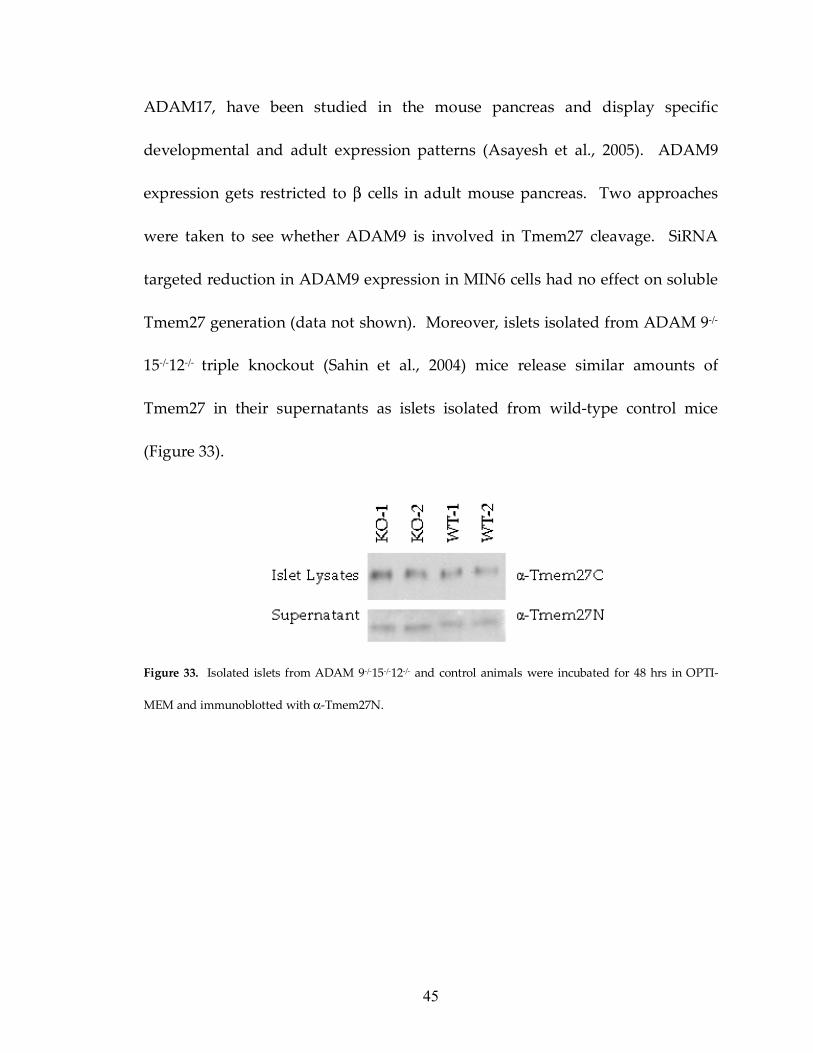
ADAM17, have been studied in the mouse pancreas and display specific
developmental and adult expression patterns (Asayesh et al., 2005). ADAM9
expression gets restricted to β cells in adult mouse pancreas. Two approaches
were taken to see whether ADAM9 is involved in Tmem27 cleavage. SiRNA
targeted reduction in ADAM9 expression in MIN6 cells had no effect on soluble
Tmem27 generation (data not shown). Moreover, islets isolated from ADAM 9-/-
15-/-12-/- triple knockout (Sahin et al., 2004) mice release similar amounts of
Tmem27 in their supernatants as islets isolated from wild-type control mice
(Figure 33).
Figure 33. Isolated islets from ADAM 9-/-15-/-12-/- and control animals were incubated for 48 hrs in OPTI-
MEM and immunoblotted with α-Tmem27N.
46
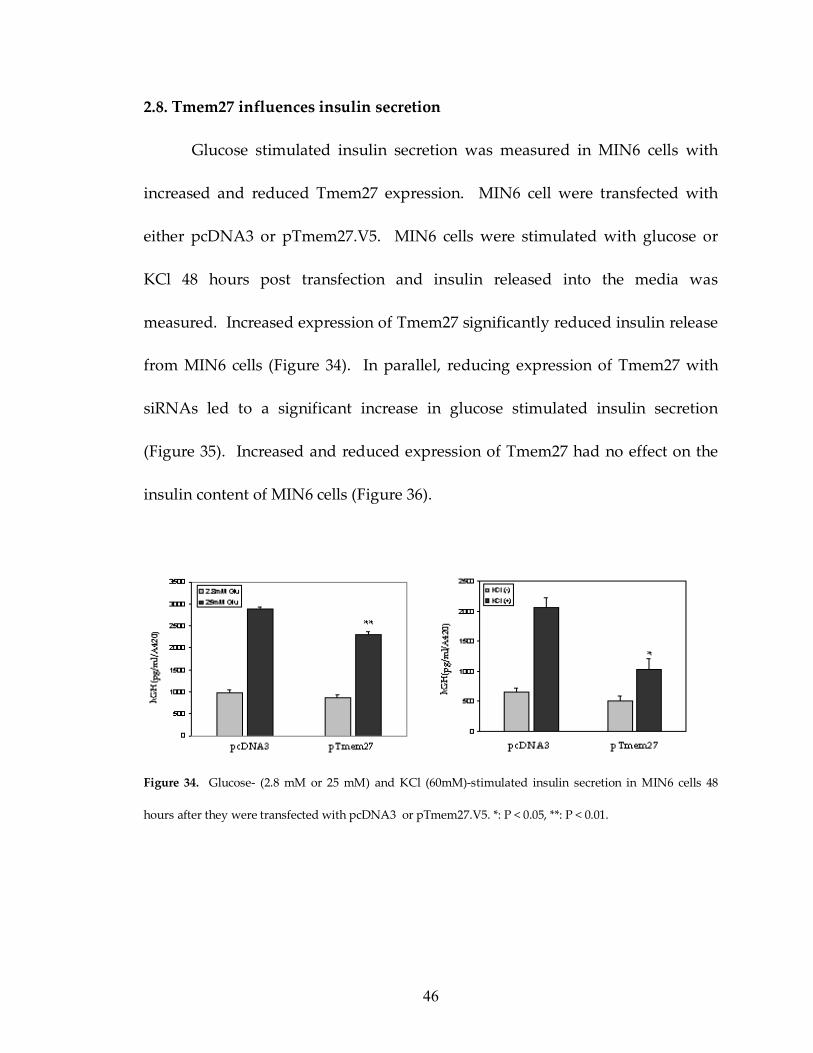
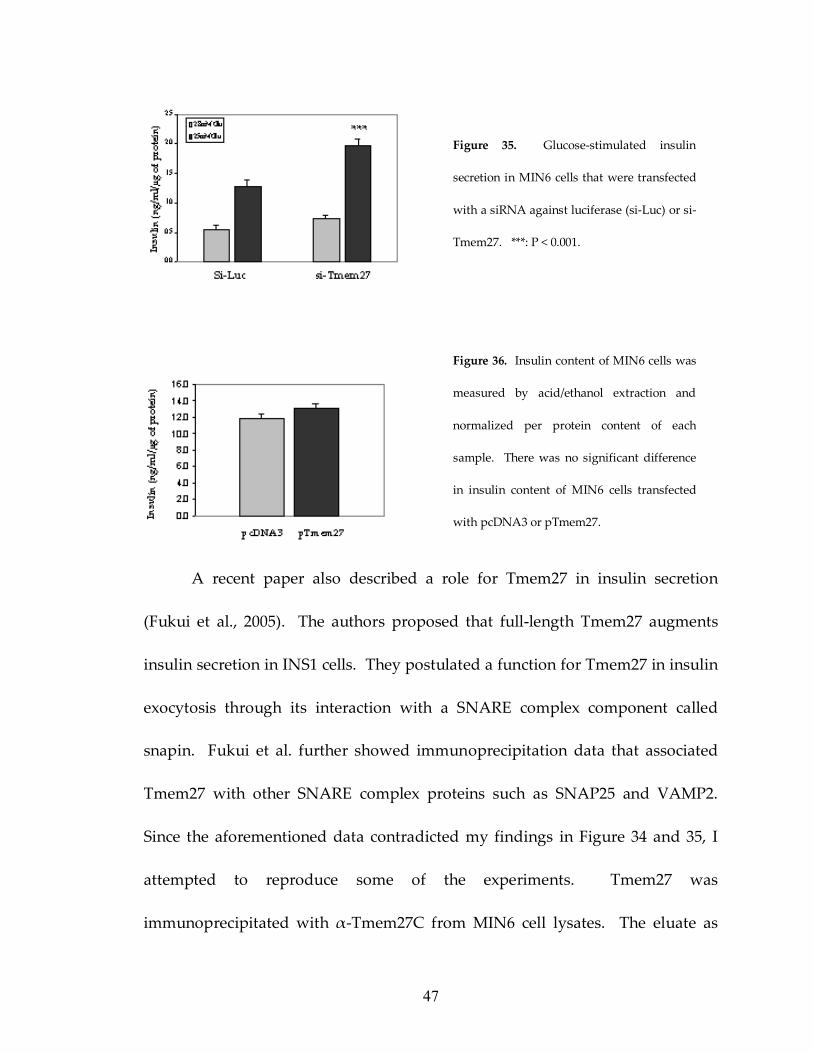
2.8. Tmem27 influences insulin secretion
Glucose stimulated insulin secretion was measured in MIN6 cells with
increased and reduced Tmem27 expression. MIN6 cell were transfected with
either pcDNA3 or pTmem27.V5. MIN6 cells were stimulated with glucose or
KCl 48 hours post transfection and insulin released into the media was
measured. Increased expression of Tmem27 significantly reduced insulin release
from MIN6 cells (Figure 34). In parallel, reducing expression of Tmem27 with
siRNAs led to a significant increase in glucose stimulated insulin secretion
(Figure 35). Increased and reduced expression of Tmem27 had no effect on the
insulin content of MIN6 cells (Figure 36).
Figure 34. Glucose- (2.8 mM or 25 mM) and KCl (60mM)-stimulated insulin secretion in MIN6 cells 48
hours after they were transfected with pcDNA3 or pTmem27.V5. *: P < 0.05, **: P < 0.01.
47
A recent paper also described a role for Tmem27 in insulin secretion
(Fukui et al., 2005). The authors proposed that full-length Tmem27 augments
insulin secretion in INS1 cells. They postulated a function for Tmem27 in insulin
exocytosis through its interaction with a SNARE complex component called
snapin. Fukui et al. further showed immunoprecipitation data that associated
Tmem27 with other SNARE complex proteins such as SNAP25 and VAMP2.
Since the aforementioned data contradicted my findings in Figure 34 and 35, I
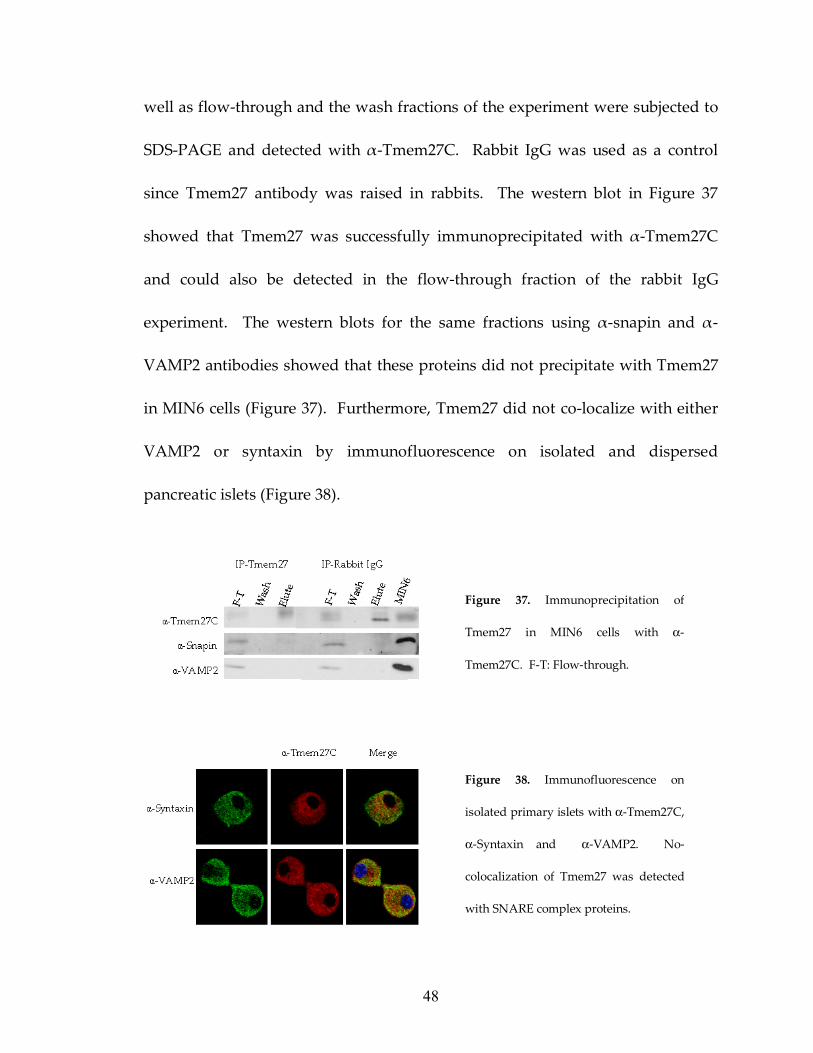
attempted to reproduce some of the experiments. Tmem27 was
immunoprecipitated with α-Tmem27C from MIN6 cell lysates. The eluate as
Figure 35. Glucose-stimulated insulin
secretion in MIN6 cells that were transfected
with a siRNA against luciferase (si-Luc) or si-
Tmem27. ***: P < 0.001.
Figure 36. Insulin content of MIN6 cells was
measured by acid/ethanol extraction and
normalized per protein content of each
sample. There was no significant difference
in insulin content of MIN6 cells transfected
with pcDNA3 or pTmem27.
48
well as flow-through and the wash fractions of the experiment were subjected to
SDS-PAGE and detected with α-Tmem27C. Rabbit IgG was used as a control
since Tmem27 antibody was raised in rabbits. The western blot in Figure 37
showed that Tmem27 was successfully immunoprecipitated with α-Tmem27C
and could also be detected in the flow-through fraction of the rabbit IgG
experiment. The western blots for the same fractions using α-snapin and α-
VAMP2 antibodies showed that these proteins did not precipitate with Tmem27
in MIN6 cells (Figure 37). Furthermore, Tmem27 did not co-localize with either
VAMP2 or syntaxin by immunofluorescence on isolated and dispersed
pancreatic islets (Figure 38).
Figure 37. Immunoprecipitation of
Tmem27 in MIN6 cells with α-
Tmem27C. F-T: Flow-through.
Figure 38. Immunofluorescence on
isolated primary islets with α-Tmem27C,
α-Syntaxin and α-VAMP2. No-
colocalization of Tmem27 was detected
with SNARE complex proteins.
49
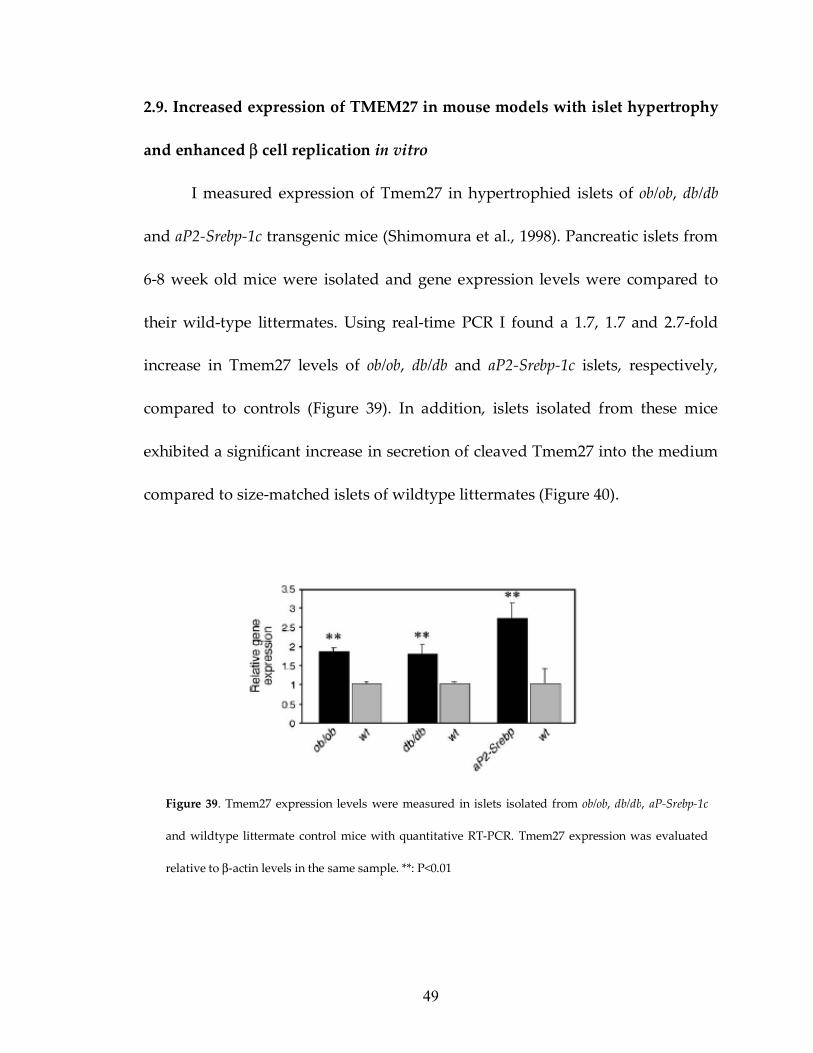
2.9. Increased expression of TMEM27 in mouse models with islet hypertrophy
and enhanced β cell replication in vitro
I measured expression of Tmem27 in hypertrophied islets of ob/ob, db/db
and aP2-Srebp-1c transgenic mice (Shimomura et al., 1998). Pancreatic islets from
6-8 week old mice were isolated and gene expression levels were compared to
their wild-type littermates. Using real-time PCR I found a 1.7, 1.7 and 2.7-fold
increase in Tmem27 levels of ob/ob, db/db and aP2-Srebp-1c islets, respectively,
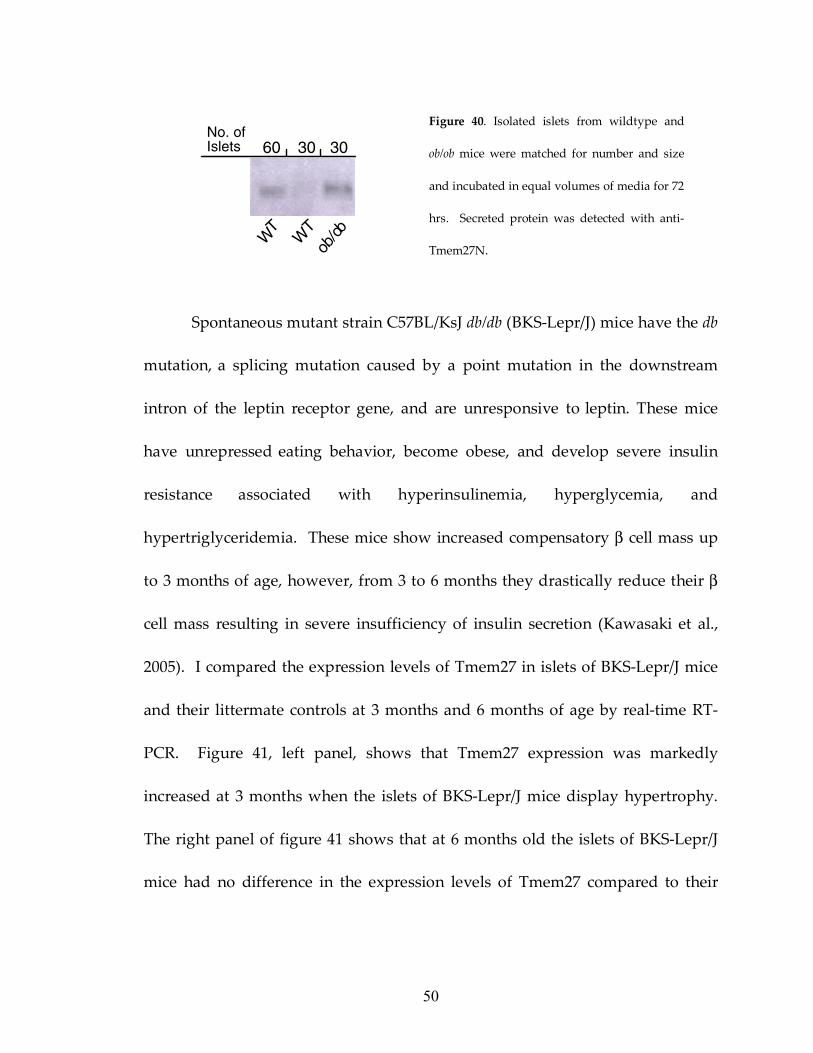
compared to controls (Figure 39). In addition, islets isolated from these mice
exhibited a significant increase in secretion of cleaved Tmem27 into the medium
compared to size-matched islets of wildtype littermates (Figure 40).
Figure 39. Tmem27 expression levels were measured in islets isolated from ob/ob, db/db, aP-Srebp-1c
and wildtype littermate control mice with quantitative RT-PCR. Tmem27 expression was evaluated
relative to β-actin levels in the same sample. **: P<0.01
50
Spontaneous mutant strain C57BL/KsJ db/db (BKS-Lepr/J) mice have the db
mutation, a splicing mutation caused by a point mutation in the downstream
intron of the leptin receptor gene, and are unresponsive to leptin. These mice
have unrepressed eating behavior, become obese, and develop severe insulin
resistance associated with hyperinsulinemia, hyperglycemia, and
hypertriglyceridemia. These mice show increased compensatory β cell mass up
to 3 months of age, however, from 3 to 6 months they drastically reduce their β
cell mass resulting in severe insufficiency of insulin secretion (Kawasaki et al.,
2005). I compared the expression levels of Tmem27 in islets of BKS-Lepr/J mice
and their littermate controls at 3 months and 6 months of age by real-time RT-
PCR. Figure 41, left panel, shows that Tmem27 expression was markedly
increased at 3 months when the islets of BKS-Lepr/J mice display hypertrophy.
The right panel of figure 41 shows that at 6 months old the islets of BKS-Lepr/J
mice had no difference in the expression levels of Tmem27 compared to their
B
No. of Islets 60 30 30
WT
WT
ob/ob
Figure 40. Isolated islets from wildtype and
ob/ob mice were matched for number and size
and incubated in equal volumes of media for 72
hrs. Secreted protein was detected with anti-
Tmem27N.
51
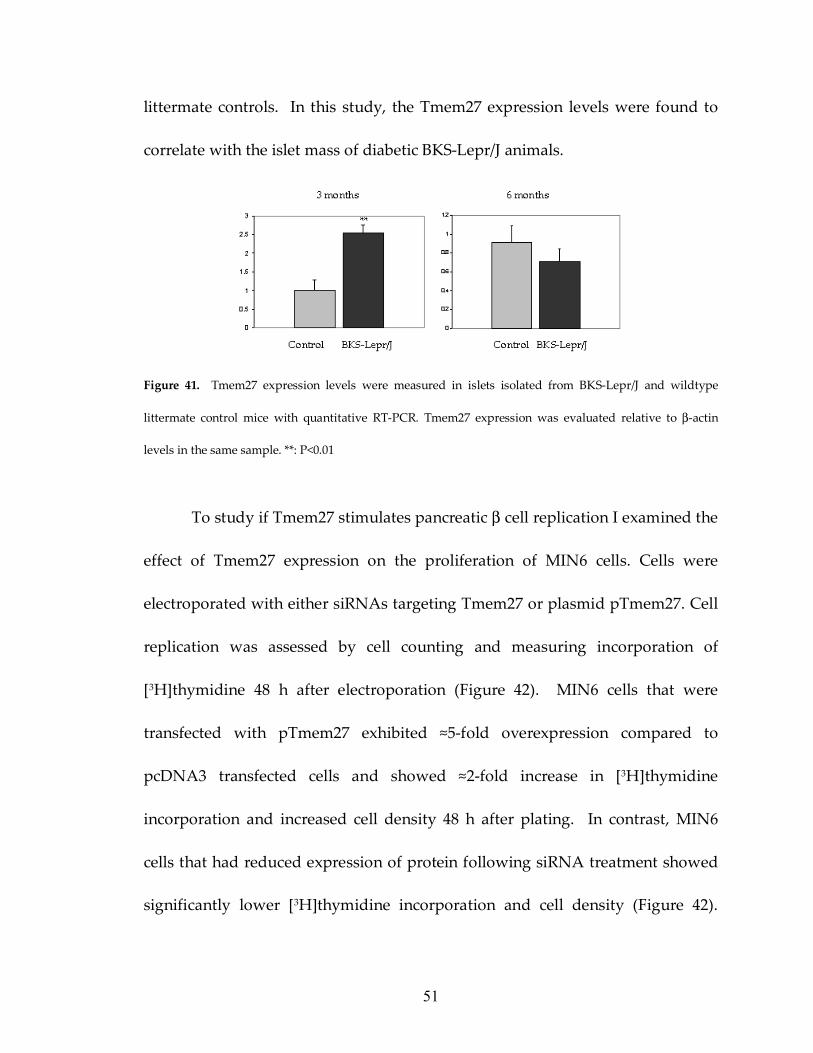
littermate controls. In this study, the Tmem27 expression levels were found to
correlate with the islet mass of diabetic BKS-Lepr/J animals.
Figure 41. Tmem27 expression levels were measured in islets isolated from BKS-Lepr/J and wildtype
littermate control mice with quantitative RT-PCR. Tmem27 expression was evaluated relative to β-actin
levels in the same sample. **: P<0.01
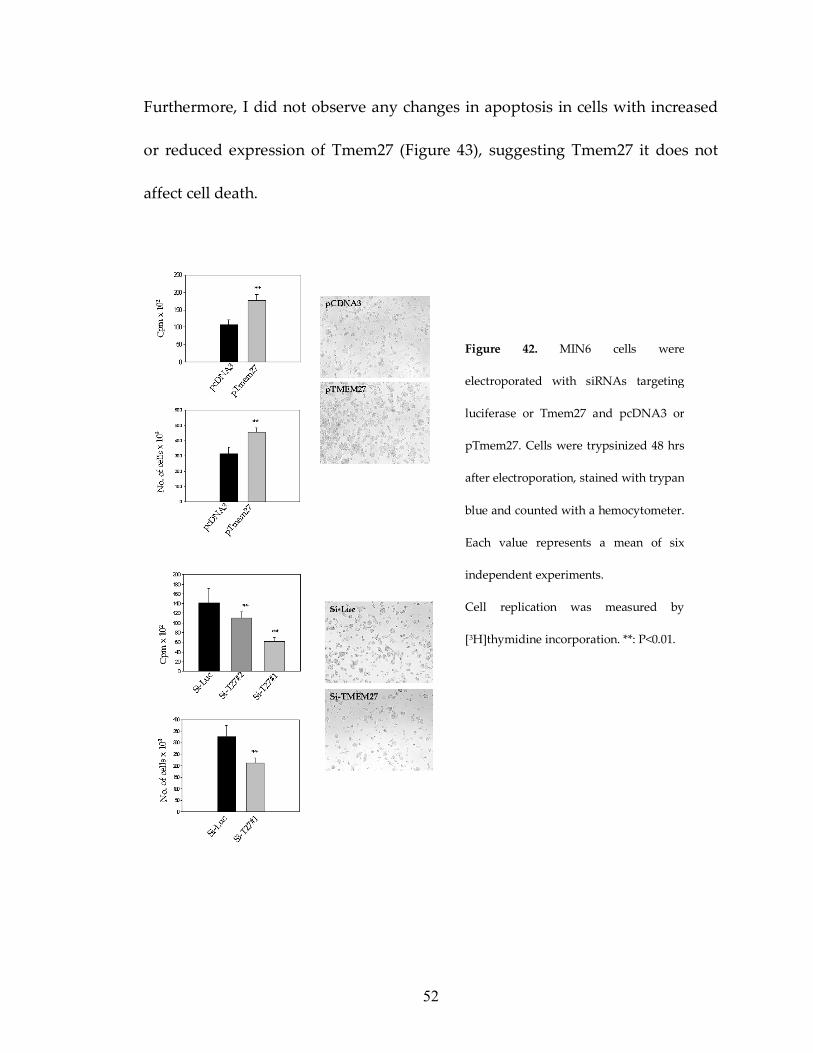
To study if Tmem27 stimulates pancreatic β cell replication I examined the
effect of Tmem27 expression on the proliferation of MIN6 cells. Cells were
electroporated with either siRNAs targeting Tmem27 or plasmid pTmem27. Cell
replication was assessed by cell counting and measuring incorporation of
[3H]thymidine 48 h after electroporation (Figure 42). MIN6 cells that were
transfected with pTmem27 exhibited ≈5-fold overexpression compared to
pcDNA3 transfected cells and showed ≈2-fold increase in [3H]thymidine
incorporation and increased cell density 48 h after plating. In contrast, MIN6
cells that had reduced expression of protein following siRNA treatment showed
significantly lower [3H]thymidine incorporation and cell density (Figure 42).
52
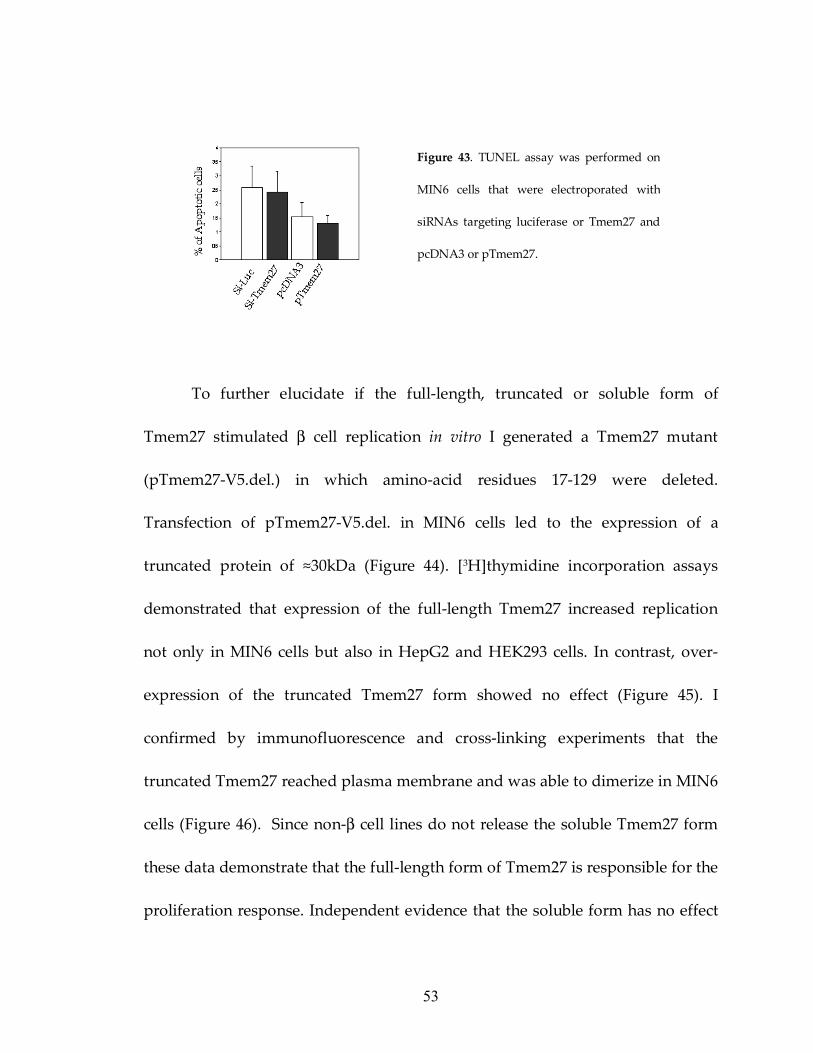
Furthermore, I did not observe any changes in apoptosis in cells with increased
or reduced expression of Tmem27 (Figure 43), suggesting Tmem27 it does not
affect cell death.
Figure 42. MIN6 cells were
electroporated with siRNAs targeting
luciferase or Tmem27 and pcDNA3 or
pTmem27. Cells were trypsinized 48 hrs
after electroporation, stained with trypan
blue and counted with a hemocytometer.
Each value represents a mean of six
independent experiments.
Cell replication was measured by
[3H]thymidine incorporation. **: P<0.01.
53
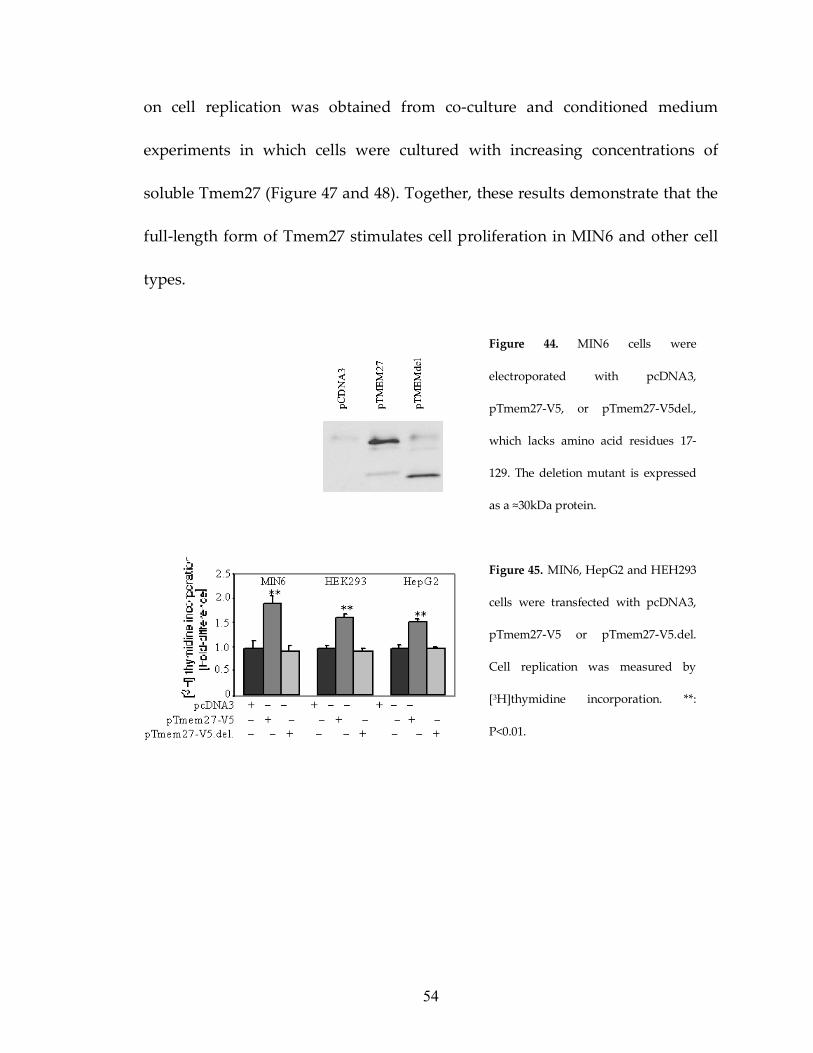
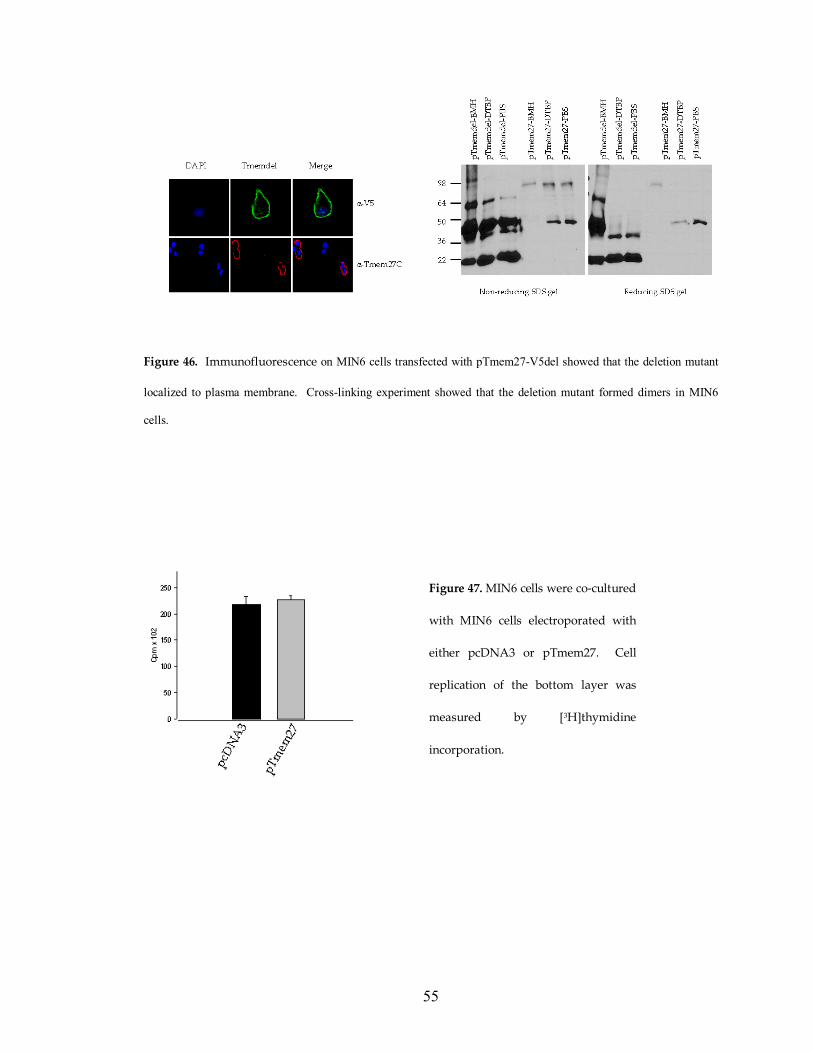
To further elucidate if the full-length, truncated or soluble form of
Tmem27 stimulated β cell replication in vitro I generated a Tmem27 mutant
(pTmem27-V5.del.) in which amino-acid residues 17-129 were deleted.
Transfection of pTmem27-V5.del. in MIN6 cells led to the expression of a
truncated protein of ≈30kDa (Figure 44). [3H]thymidine incorporation assays
demonstrated that expression of the full-length Tmem27 increased replication
not only in MIN6 cells but also in HepG2 and HEK293 cells. In contrast, over-
expression of the truncated Tmem27 form showed no effect (Figure 45). I
confirmed by immunofluorescence and cross-linking experiments that the
truncated Tmem27 reached plasma membrane and was able to dimerize in MIN6
cells (Figure 46). Since non-β cell lines do not release the soluble Tmem27 form
these data demonstrate that the full-length form of Tmem27 is responsible for the
proliferation response. Independent evidence that the soluble form has no effect
Figure 43. TUNEL assay was performed on
MIN6 cells that were electroporated with
siRNAs targeting luciferase or Tmem27 and
pcDNA3 or pTmem27.
54
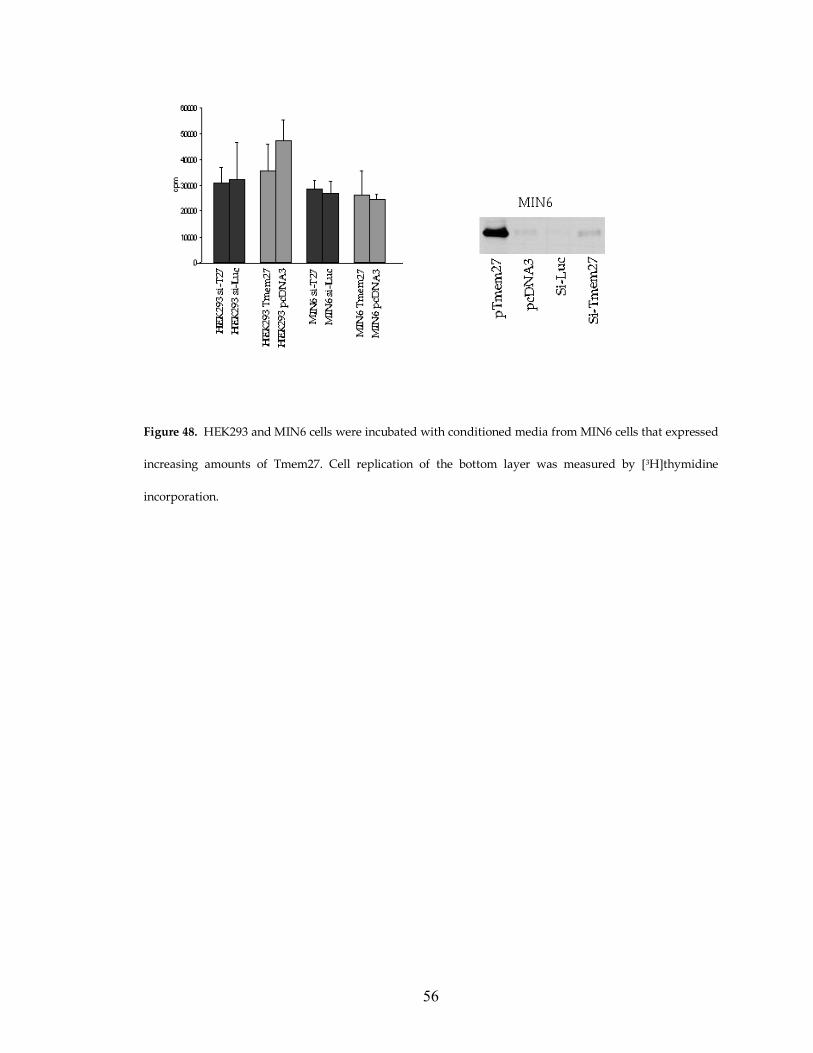
on cell replication was obtained from co-culture and conditioned medium
experiments in which cells were cultured with increasing concentrations of
soluble Tmem27 (Figure 47 and 48). Together, these results demonstrate that the
full-length form of Tmem27 stimulates cell proliferation in MIN6 and other cell
types.
Figure 44. MIN6 cells were
electroporated with pcDNA3,
pTmem27-V5, or pTmem27-V5del.,
which lacks amino acid residues 17-
129. The deletion mutant is expressed
as a ≈30kDa protein.
Figure 45. MIN6, HepG2 and HEH293
cells were transfected with pcDNA3,
pTmem27-V5 or pTmem27-V5.del.
Cell replication was measured by
[3H]thymidine incorporation. **:
P<0.01.
55
Figure 46. Immunofluorescence on MIN6 cells transfected with pTmem27-V5del showed that the deletion mutant
localized to plasma membrane. Cross-linking experiment showed that the deletion mutant formed dimers in MIN6
cells.
Figure 47. MIN6 cells were co-cultured
with MIN6 cells electroporated with
either pcDNA3 or pTmem27. Cell
replication of the bottom layer was
measured by [3H]thymidine
incorporation.
56
Figure 48. HEK293 and MIN6 cells were incubated with conditioned media from MIN6 cells that expressed
increasing amounts of Tmem27. Cell replication of the bottom layer was measured by [3H]thymidine
incorporation.
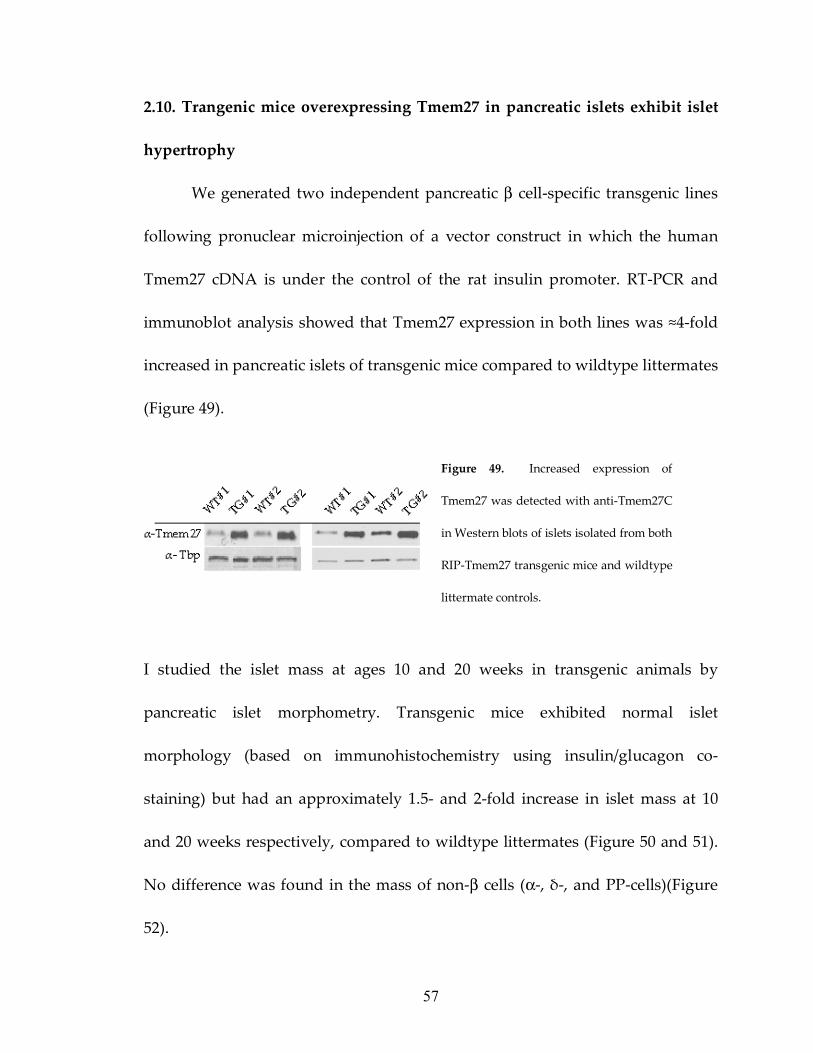
57
2.10. Trangenic mice overexpressing Tmem27 in pancreatic islets exhibit islet
hypertrophy
We generated two independent pancreatic β cell-specific transgenic lines
following pronuclear microinjection of a vector construct in which the human
Tmem27 cDNA is under the control of the rat insulin promoter. RT-PCR and
immunoblot analysis showed that Tmem27 expression in both lines was ≈4-fold
increased in pancreatic islets of transgenic mice compared to wildtype littermates
(Figure 49).
I studied the islet mass at ages 10 and 20 weeks in transgenic animals by
pancreatic islet morphometry. Transgenic mice exhibited normal islet
morphology (based on immunohistochemistry using insulin/glucagon co-
staining) but had an approximately 1.5- and 2-fold increase in islet mass at 10
and 20 weeks respectively, compared to wildtype littermates (Figure 50 and 51).
No difference was found in the mass of non-β cells (α-, δ-, and PP-cells)(Figure
52).
Figure 49. Increased expression of
Tmem27 was detected with anti-Tmem27C
in Western blots of islets isolated from both
RIP-Tmem27 transgenic mice and wildtype
littermate controls.
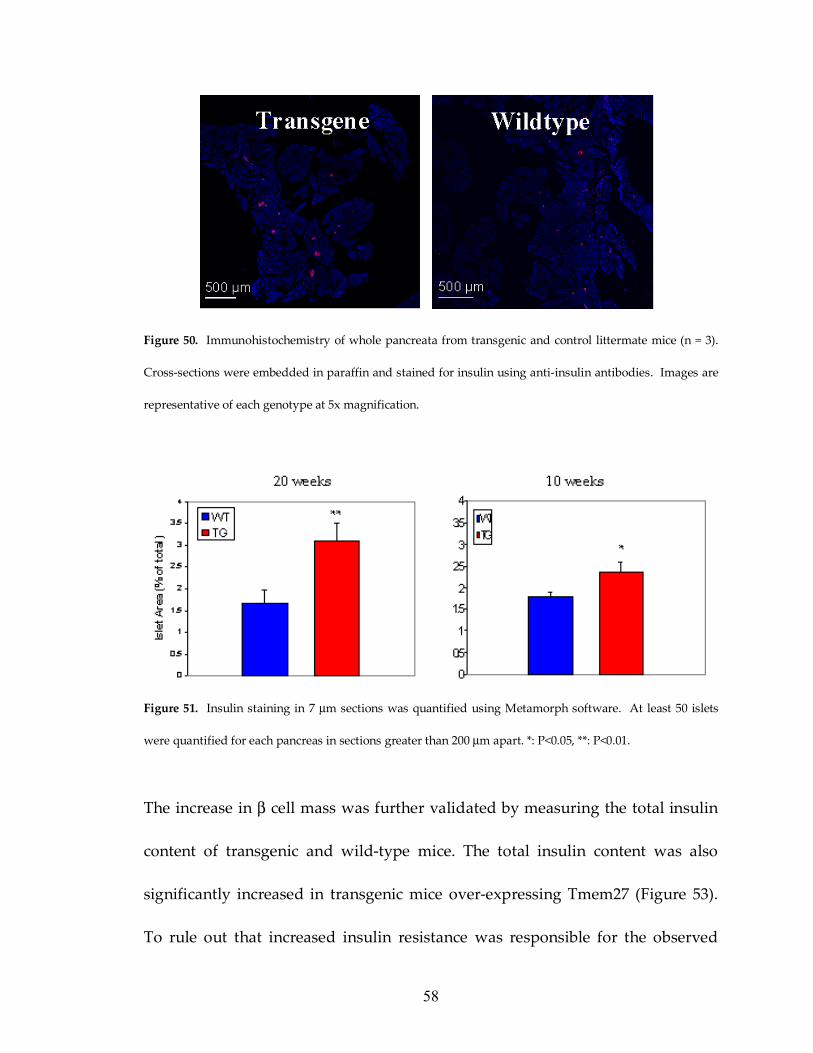
58
Figure 50. Immunohistochemistry of whole pancreata from transgenic and control littermate mice (n = 3).
Cross-sections were embedded in paraffin and stained for insulin using anti-insulin antibodies. Images are
representative of each genotype at 5x magnification.
Figure 51. Insulin staining in 7 µm sections was quantified using Metamorph software. At least 50 islets
were quantified for each pancreas in sections greater than 200 µm apart. *: P<0.05, **: P<0.01.
The increase in β cell mass was further validated by measuring the total insulin
content of transgenic and wild-type mice. The total insulin content was also
significantly increased in transgenic mice over-expressing Tmem27 (Figure 53).
To rule out that increased insulin resistance was responsible for the observed
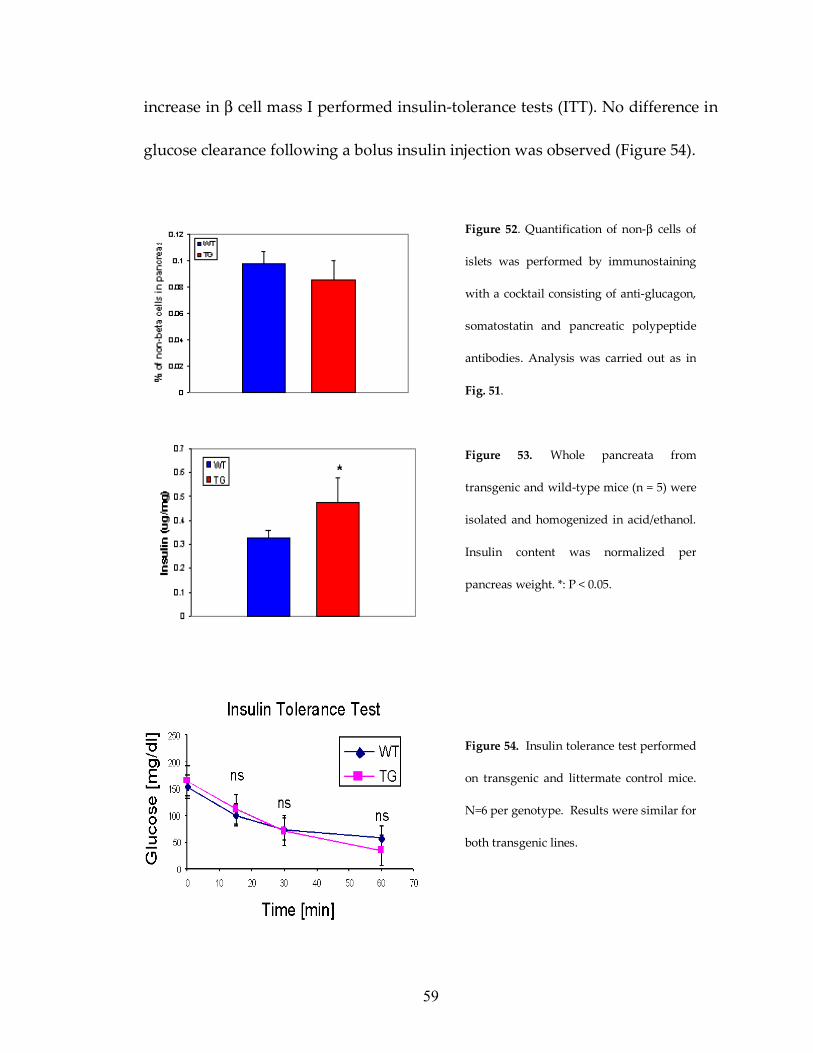
59
increase in β cell mass I performed insulin-tolerance tests (ITT). No difference in
glucose clearance following a bolus insulin injection was observed (Figure 54).
Figure 52. Quantification of non-β cells of
islets was performed by immunostaining
with a cocktail consisting of anti-glucagon,
somatostatin and pancreatic polypeptide
antibodies. Analysis was carried out as in
Fig. 51.
Figure 53. Whole pancreata from
transgenic and wild-type mice (n = 5) were
isolated and homogenized in acid/ethanol.
Insulin content was normalized per
pancreas weight. *: P < 0.05.
Figure 54. Insulin tolerance test performed
on transgenic and littermate control mice.
N=6 per genotype. Results were similar for
both transgenic lines.
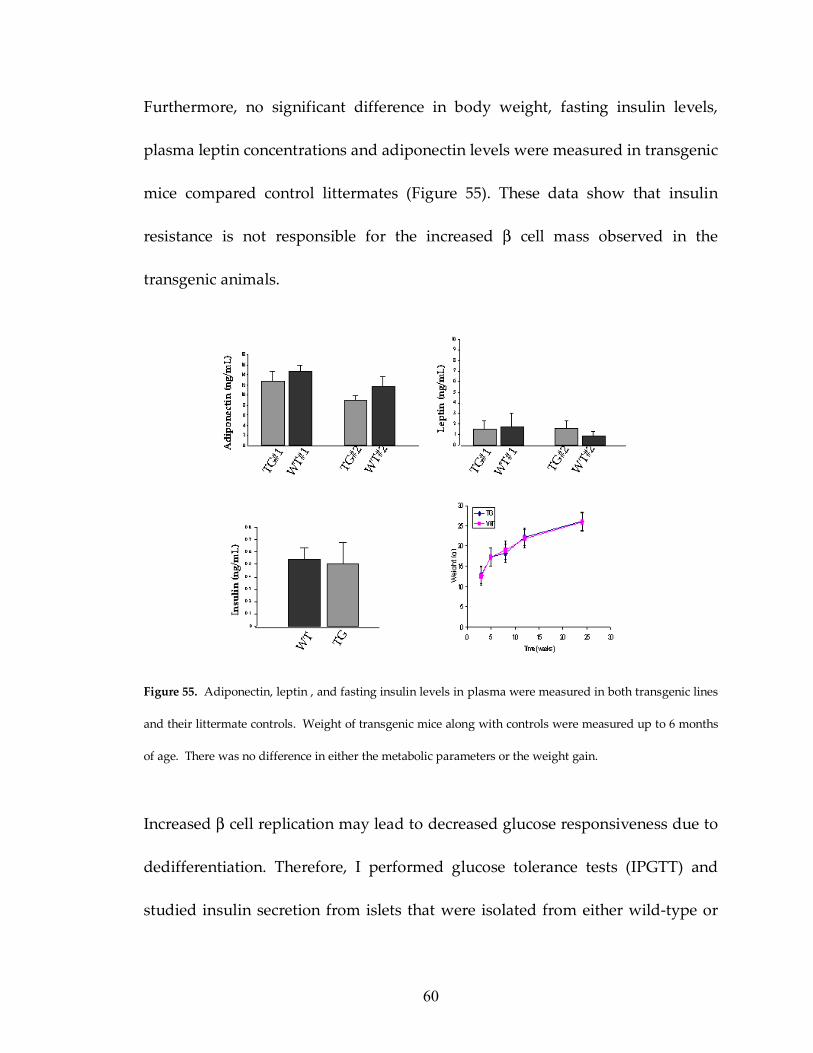
60
Furthermore, no significant difference in body weight, fasting insulin levels,
plasma leptin concentrations and adiponectin levels were measured in transgenic
mice compared control littermates (Figure 55). These data show that insulin
resistance is not responsible for the increased β cell mass observed in the
transgenic animals.
Figure 55. Adiponectin, leptin , and fasting insulin levels in plasma were measured in both transgenic lines
and their littermate controls. Weight of transgenic mice along with controls were measured up to 6 months
of age. There was no difference in either the metabolic parameters or the weight gain.
Increased β cell replication may lead to decreased glucose responsiveness due to
dedifferentiation. Therefore, I performed glucose tolerance tests (IPGTT) and
studied insulin secretion from islets that were isolated from either wild-type or
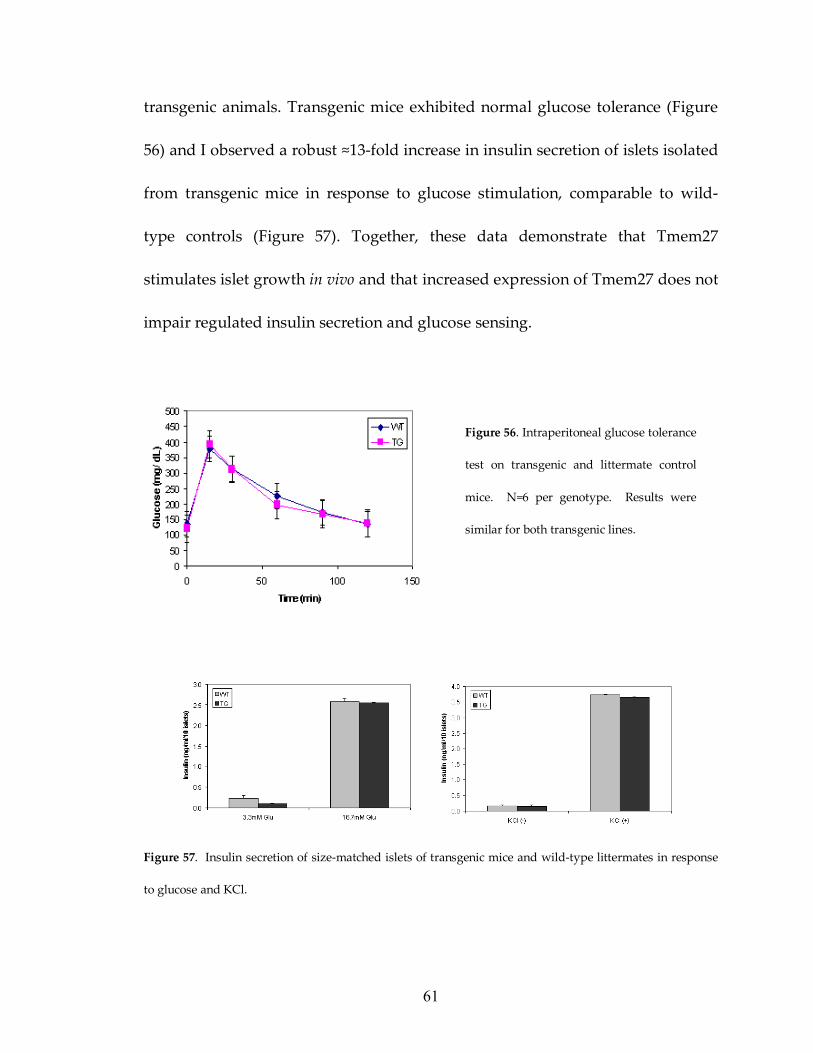
61
transgenic animals. Transgenic mice exhibited normal glucose tolerance (Figure
56) and I observed a robust ≈13-fold increase in insulin secretion of islets isolated
from transgenic mice in response to glucose stimulation, comparable to wild-
type controls (Figure 57). Together, these data demonstrate that Tmem27
stimulates islet growth in vivo and that increased expression of Tmem27 does not
impair regulated insulin secretion and glucose sensing.
Figure 57. Insulin secretion of size-matched islets of transgenic mice and wild-type littermates in response
to glucose and KCl.
Figure 56. Intraperitoneal glucose tolerance
test on transgenic and littermate control
mice. N=6 per genotype. Results were
similar for both transgenic lines.
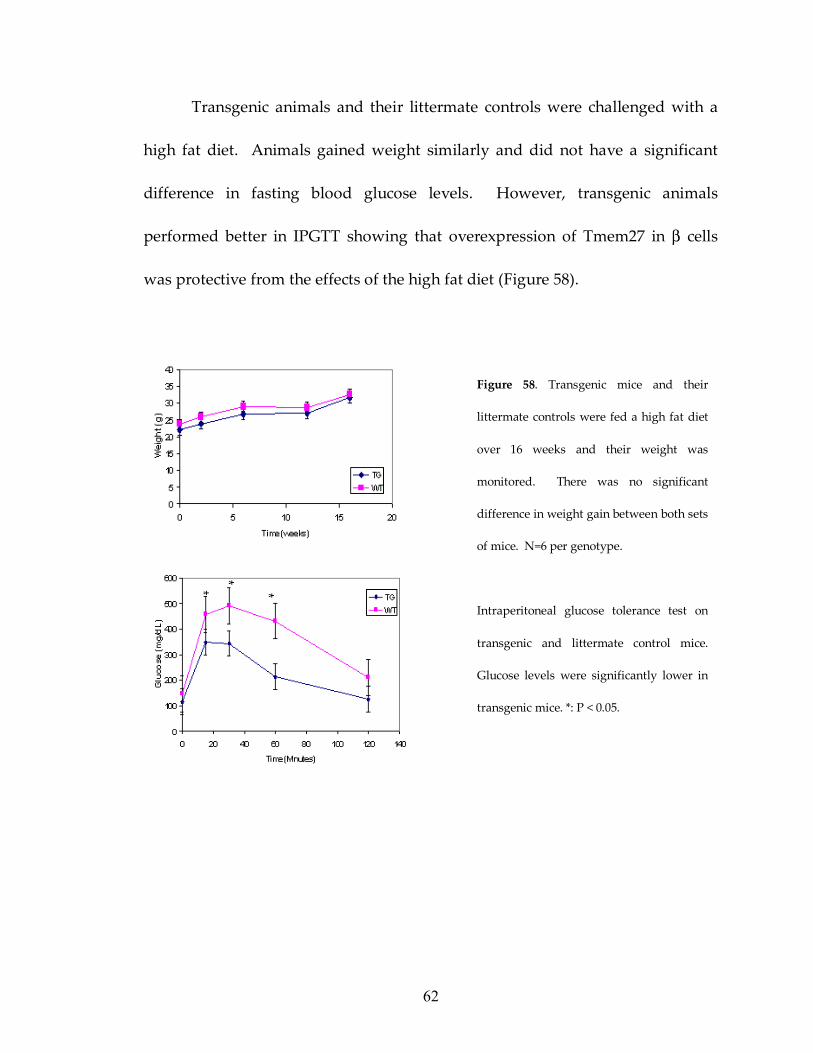
62
Transgenic animals and their littermate controls were challenged with a
high fat diet. Animals gained weight similarly and did not have a significant
difference in fasting blood glucose levels. However, transgenic animals
performed better in IPGTT showing that overexpression of Tmem27 in β cells
was protective from the effects of the high fat diet (Figure 58).
Figure 58. Transgenic mice and their
littermate controls were fed a high fat diet
over 16 weeks and their weight was
monitored. There was no significant
difference in weight gain between both sets
of mice. N=6 per genotype.
Intraperitoneal glucose tolerance test on
transgenic and littermate control mice.
Glucose levels were significantly lower in
transgenic mice. *: P < 0.05.
63
DISCUSSION
In this thesis a genomic approach was used to identify genes that
may contribute to islet mass maintenance during adult life and islet growth
following increased demand for insulin secretion. A number of transcription
factors have been shown to be important regulators of both development and
function of pancreatic β cells. TCF1 is a transcription factor that leads to
progressive early-onset diabetes called MODY3 when mutated in humans.
Experimental mouse models for MODY3, Tcf1-/- and RIP-P291fsinsC, display
decreased islet mass due to a progressive reduction in β cell number and
proliferation rate. Expression profiles of islets isolated from Tcf1-/- and wild-type
littermate animals were compared in order to identify mitogenic factors that are
regulated by Tcf1.
We found that Tmem27 exhibits markedly reduced expression in the islets
of diabetic Tcf1-/- animals with decreased islet mass compared to wild-type
littermates. Further experiments revealed that Tmem27 is essential for optimal β
cell growth in vitro and transgenic mice over-expressing Tmem27 exhibit
increased islet mass.
3.1 Tcf1 regulates expression of Tmem27
Promoter analysis and chromatin immunoprecipitation demonstrate that
Tcf1 binds to conserved TCF1 binding sites in the Tmem27 promoter and that it
64
activates transcription of this gene.
During the development of mouse kidney, Tmem27 is detectable at day 13
of gestation in the ureteric bud branches. Its expression is progressively
increased during later stages of the gestation extending into the neonatal periods
and then is decreased in adult life (Zhang et al., 2001). Interestingly, we found
normal levels of Tmem27 mRNA in the kidneys of Tcf1–/– animals (data not
shown). Tcf1 expression in adult kidneys is restricted to the proximal and distal
tubules, whereas Tcf2, a related protein that can form heterodimers with Tcf1
and shares 93%, 75% and 47% sequence identity in their DNA binding domains,
dimerization domains, carboxyl-terminal activation domains, respectively, is
mainly localized in the collecting ducts (Rey-Campos et al., 1991; Coffinier et al.,
1999). Tmem27 is specifically expressed in the collecting tubules and therefore
overlaps in its expression with Tcf2, indicating that Tcf2 homodimers may
regulate the expression of Tmem27 in these cells in the adult kidney. In
pancreatic islets of Tcf1–/– mice, Tmem27 expression is profoundly reduced,
indicating that Tcf2 cannot substitute for Tcf1. This may be explained by
different DNA binding specificities and/or by the higher Tcf1 expression levels
compared to Tcf2 in pancreatic islets.
3.2 Expression of Tmem27 in embryonic pancreas development
Tmem27 expression is found at the earliest stages of pancreatic
65
development (E10.5). Tmem27 is expressed in hormone-positive cells throughout
development but becomes restricted to pancreatic β cells in the postnatal period.
Tmem27 expression was not detected in Ngn3-positive neuroendocrine
precursor cells. This expression pattern is reminiscent of the temporal and spacial
expression of Pdx-1, an essential transcription factor for pancreas development,
differentiation and insulin gene transcription (Jonsson et al., 1994; Offield et al.,
1996; Ahlgren et al., 1998). Indeed, a conserved binding site of Pdx-1 was
identified in the Tmem27 promoter that partially overlaps with the Tcf1 site and
which exhibits binding activity in EMSA analysis (Figures 7 and 9), suggesting
that Pdx-1 may also be a critical regulator of Tmem27. These data make it
tempting to speculate that the membrane–bound or secreted form of Tmem27
contributes to the defect observed in Pdx-1 deficient mice, possibly by acting as a
receptor or a signaling molecule (Johnsson et al., 2003).
3.3 Ectodomain shedding of Tmem27
I found that the N-terminal, extracellular domain of Tmem27 is cleaved
and released from the plasma membrane of pancreatic β cells. Tmem27 does not
co-localize with insulin granules or synaptic-like microvesicles, thereby ruling
out the possibility that Tmem27 is released by the regulated secretory pathway.
This is further supported by the observation that the cleaved protein cannot be
detected in whole cell extracts of MIN6 cells and that release of the cleaved form
66
of Tmem27 is not regulated by glucose. Interestingly, cleavage of Tmem27 only
occurs in pancreatic β cells and could not be detected in cells that were
transfected with a Tmem27 expression vector. This may suggest that Tmem27 is
cleaved by a β cell-specific or -enriched protease. However, reducing the
expression of proteases that have known β cell-specific actvity with siRNAs does
not lead to any alterations in soluble Tmem27 levels. Biochemical data as well as
siRNA experiments exclude the involvement of furin, PC1/3, PC2 and
carboxypeptidase E.
PMA stimulated shedding of Tmem27 as well as inhibition of this
induction by the hydroxamate-based compound BB94 suggests the involvement
of the zinc-dependent mettalloproteases of the metzincin family, which includes
proteases containing a disintegrin and a mettaloprotease (ADAM) domain.
ADAMs have been shown to cleave a variety of substrates with important roles
in development and disease, including cytokines, growth factors/receptors and
adhesion molecules. In the pancreas, expression patterns are characterized for
three members of this family. ADAM9, 10, and 17 are all expressed in the
pancreatic anlagen. During development the expression of all three proteases
gets restricted to different cell lineages. In the adult pancreas ADAM9 is only
expressed in β cells whereas ADAM17 is expressed in all endocrine cell types.
ADAM10 is detected in endocrine as well as exocrine pancreas (Asayesh et al.,
67
2005). ADAM9-/- mice display no reduction in the release of soluble Tmem27
release from isolated islets excluding the role of this protease in cleavage.
ADAM17-/- mice are not viable, however, ADAM17∆Zn/∆Zn mice, which lack the
Zn2+ binding domain, live for 2-3 weeks and can be used for islet studies. A
recent study also identified ADAM17 as a mediator of the regulated ectodomain
shedding of ACE2 (Lambert et al., 2005). The cleavage site for ADAM17
mediated proteolysis of ACE2 is not clear, however, it is predicted to be in the
juxtamembrane stalk region from the mass of the released peptide. The
juxtamembrane regions of ACE2 and Tmem27 are highly homologous.
Therefore, possible role of ADAM17 in Tmem27 shedding should be investigated
with further studies in mice as well as with siRNA mediated targeting of
ADAM17 expression in β cell lines.
Receptor shedding has been reported for members of diverse families of
transmembrane receptors. For instance, the precursor form of hepatocyte growth
factor is associated with the cell surface and biological function is dependent on
proteolytic cleavage of an extracellular domain by the serine protease hepatocyte
growth factor activator (HGFA)(Naldini et al., 1992; Miyazawa et al., 1993). Other
receptors can bind to ligands upon cleavage and inhibit their activity. One
example is the growth hormone-binding protein (GHBP), which derives from
proteolytic shedding of the GH receptor (GHR) extracellular domain and is
68
complexed to a substantial fraction of circulating GH (Wang et al., 2002).
Proteolytic shedding of receptors may not just release ligands or ligand binding
proteins but can also be a means to regulate receptor function. For instance, one
of the mechanisms that has evolved to modulate TNF function is the proteolytic
cleavage of its cell surface receptors (Xanthoulea et al., 2004). The biological
relevance is highlighted by identifications of mutations affecting shedding of the
p55TNF receptor that have been linked with the development of the TNFR-
associated periodic syndromes (McDermott, 2001). Our studies support a model
by which the full length, membrane-bound form of Tmem27 is responsible for
stimulating cell replication: i. Over-expression of full-length Tmem27 in β cell
lines and non-β cells that do not cleave Tmem27 leads to increased cell
replication, ii. Over-expression of a truncated form in β cells and non-β cells has
no effect on cell replication, and iii. Conditioned media or co-culture experiments
failed to provide evidence that the soluble form of Tmem27 stimulates cell
replication. These studies indicate that identification of the cleavage enzyme that
processes Tmem27 could be therapeutically used to develop drugs that inhibit
the activity of this protease. Such an inhibitor may therefore reduce cleavage of
Tmem27 and lead to constitutive receptor activation, thereby increasing β cell
mass. The role of the extracellular, soluble form of Tmem27 is currently
unknown and future studies need to establish if it serves as a ligand, a ligand-
69
binding protein or a receptor. However, its unique properties, including
pancreatic β cell-specific and constitutive release, make it tempting to
hypothesize that it may be exploited in the future as a biomarker for islet mass if
sensitive RIAs or ELISAs can be developed to detect this protein in serum
samples.
3.4 Tmem27 influences insulin secretion
In MIN6 cells overexpression of Tmem27 leads to a decrease in insulin
secretion while electroporation of cells with si-Tmem27 increases insulin
secretion. These data contradict recent findings by Fukui et al. that show
Tmem27 augments insulin secretion in INS1 cells through its interaction with the
SNARE complex. I failed to detect this interaction through immunoprecipitation
of Tmem27 from MIN6 cells. I further show immunofluorescence data that
refute interaction of Tmem27 with VAMP-2 and syntaxin-1, components of the
SNARE complex. Additional experiments are necessary to illuminate the cause
for the differences in both sets of data, however, one explanation may be the
different expression levels of Tmem27. When I electroporate MIN6 cells with
either pTmem27 or si-Tmem27, western blots show marked increase or decrease
in protein levels. Representative immunoblots in the Fukui et al. show less
robust regulation of Tmem27 in INS1 cells. Thus levels of protein expression
may specify thresholds for Tmem27 function. This hypothesis may also explain
70
the lack of islet hypertrophy in RIP-Tmem27 transgenic mice generated by Fukui
et al. The Tmem27 protein levels display slight increase in islets of transgenic
animals compared to wild-type controls. Another major difference between the
two studies is the β cell lines that are used to measure insulin secretion. All my
experiments were done in MIN6 cells that were transiently transfected whereas
Fukui et al. used INS1 cells that stably overexpress Tmem27. It is possible to
postulate that long-term overexpression of Tmem27 may affect cell lines
differently. Moreover, I show that endogenous Tmem27 does not co-localize
with SNARE complex proteins with immunofluorescence on primary islets,
which is a more physiologically relevant approach than INS1 cells that are
clonally selected.
3.5 Tmem27 stimulates β cell growth in vivo
In this study I have also established that Tmem27 controls islet growth in
vivo. The expression of Tmem27 is reduced in Tcf-1–/– mice and increased in three
animal models of islet hypertrophy: ob/ob, db/db and aP2-Srebp-1c transgenic mice.
I also show that expression of Tmem27 is correlated with islet mass in the BKS-
Lepr/J mice. It is interesting that expression of Tmem27 is also increased in the
hypertrophic kidneys after renal ablation, indicating that it may play a role in
compensatory growth responses to organ injury (Zhang et al., 2001).
Significantly, two independent lines of transgenic mice with increased expression
71
of Tmem27 in pancreatic β cells exhibited a ≈2-fold increase in pancreatic islet
mass and insulin content. Over-expression of Tmem27 in β cells had no effect on
non-β cell mass, further supporting the notion that the full-length, membrane
bound form is responsible for stimulating cell growth. Although under normal a
chow fed diet I did not observe alterations of glucose homeostasis, increased β
cell mass together with unaltered glucose sensing would likely be beneficial in
insulin resistance states. Thus I challenged the transgenic animals and their
littermates with a high fat diet. The high fat diet did not lead to any differences
in weight gain or fasting glucose levels between the two sets of mice. However,
intraperitoneal glucose tolerance tests show that transgenic animals are more
glucose responsive than their littermates. Future studies with loss-of-function
and gain-of-function mutations will further elucidate the role of Tmem27 in the
maintenance of islet mass and insulin secretion.
Adult pancreatic β cells retain a significant proliferative capacity as islet
mass is adaptable to metabolic demand in the body. Β cell proliferation is
controlled by the cell cycle molecular machinery. The earliest account of β cell
mass regulation by cell cycle alterations came from studies in transgenic mice
overexpressing SV40 large T-antigen in the β cell. These mice displayed
increased β cell replication, islet hyperplasia, and consequently insulinomas
(Hanahan, 1985). SV40 large T-antigen promotes proliferation by inactivating
72
p53 as well as the retinoblastoma tumor suppressor protein (pRb), both
important in the G1 checkpoint of the cell cycle (Sherr, 2000; Levine, 1997).
Supporting data for the importance of G1 checkpoint in β cell proliferation was
obtained from cdk-4 deficient mice that display β cell hypoplasia causing
neonatal diabetes (Rane et al., 1999). Moreover, a knocked-in constitutively
active cdk-4 allele results in beta cell hyperplasia. D-cyclins are also key
regulators of G1 phase. Two members of this family, cyclin D1 and cyclin D2,
have been shown to be important in β cell replication and growth (Zhang et al.,
2005; Georgia and Bhushan, 2004). I investigated whether increase in cell
replication caused by Tmem27 expression was mediated by cdk-4 or cyclin D1. I
checked the levels of each protein in western blots 48 hours after MIN6 cells were
transfected with an expression vector of Tmem27. I could not detect a difference
in the expression levels of either protein (data not shown).
A number of growth factors have been identified as capable of increasing
β cell replication including lactogens, insulin, insulin-like growth factors (IGFs),
hepatocyte growth factor (HGF), and glucagon-like peptide-1 (GLP-1).
Lactogens include placental lactogen (PL), prolactin (PRL), and growth
hormone (GH). Role of lactogens in regulation of β cell mass and function has
been studied extensively during pregnancy. PL and PRL signal through a
common PRL receptor (PRLR). Both PRLR and GH receptor (GHR) belong to the
73
cytokine family of receptors that interact with members of the Janus Kinase
(JAK) family of tyrosine kinases (Bole-Feysot et al., 1998). JAKs, upon
phosphorylation, bind to members of the Signal Transduction and Activators of
Trancription (STAT) family of transcription factors, which then translocate to the
nucleus and activate expression of genes. Recent studies indicate that β cell
replication induced through the PRLR is dependent on the activation of
JAK2/STAT5 signalling pathway that results in the modulation of cyclin D2
expression (Friedrichsen et al., 2001 and 2003).
Insulin, IGF-I and IGF-II all have been shown to be important for growth
and cell proliferation during embryogenesis and adult life. Insulin and IGF-I
bind to tyrosine kinase receptors called insulin receptor (IR) and IGF-I receptor
(IGF-IR), respectively. IGF-II can bind to both receptors. In vitro data obtained
from β cell lines as well as isolated islets demonstrated that IGF-I and IGF-II
increased β cell replication. IGF-I most likely leads to the activation of Erk1/2,
phosphoinositide 3 (PI3)-kinase and subsequently mTOR/p70(S6K) signaling
pathways through the insulin receptor substrate (IRS)-2 (Lingohr et al., 2002).
In vitro studies and transgenic mice overexpressing HGF in β cells suggest
that HGF might be important for β cell proliferative response during insulin
resistance, obesity, and partial pancreotectomy. HGF binds with high affinity
and activates the transmembrane receptor encoded by the c-met protooncogene
74
(Furge et al., 2000). In the β cell line INS-1, HGF-induced cell replication
involves signaling through PI3 kinase and atypical PKCs (Gahr et al., 2002).
However, conditional knockout mice with disrupted HGF/c-met signaling in β
cells display normal β cell mass and proliferation suggesting that HGF is not
essential for normal β cell growth and proliferation (Roccisana et al., 2005).
In addition to the lactogens produced during pregnancy, the only well
characterized stimulant for beta cell growth in a physiological situation is the
gastrointestinal incretin hormone GLP-1. GLP-1 binds to the seven-
transmembrane-spanning G protein-coupled receptor GLP-1R and has been
shown to control blood glucose levels by stimulating insulin secretion, insulin
biosynthesis, β cell proliferation and by inhibition of gastric emptying and
glucagon release (Drucker, 2006). GLP-1 stimulated β cell proliferation in studies
using isolated islets and β cell lines appears to involve activation of genes such as
c-jun, junD, nur77 and c-fos (Buteau et al., 2001; Susini et al., 1998). These studies
and others also implicate the involvement of signaling molecules such as PI3
kinase, Akt/PKB and PKCζ (Buteau et al., 1999; Wang et al., 2004; Buteau et al.,
2001).
Recent evidence emphasizes the importance of PI3 kinase and Akt
signaling in regulation of β cell mass as various growth factors has been shown
to activate these molecules. In β cells, the molecules and mechanisms that
75
mediate Akt signaling is not well defined. However, in vivo and in vitro
experiments suggest that Akt could mediate proliferative signals induced by
activation of Irs-2 (White, 2002). One of the mechanisms used for cell cycle
regulation by Akt is inhibition of glycogen synthase kinase 3β (GSK3β) by
phosphorylation. This inhibition leads to cyclin D1 and c-Myc accumulation in
the nucleus and reduced levels of the cell cycle inhibitor p21CIP (Chang et al.,
2003). Akt has also been shown to regulate cell cycle by inactivation of the Foxo
family of transcription factors (Martinez-Gac et al., 2004). Overexpression of
Foxo transcription factors causes inhibition of cell proliferation (Chang et al.,
2003). Moreover, decreased levels of Foxo1 restore Pdx1 expression and β cell
proliferation in mice deficient in Irs-2, suggesting that Akt induced proliferative
signals can be mediated by Foxo1 and Pdx1 (Kitamura et al., 2002).
It will be important to elucidate the exact molecular mechanisms Tmem27
utilizes in order to regulate cell replication. Tmem27 might exert its effects
through one of the pathways described above and further experiments are
necessary in order to determine specific signaling events. Activation of
previously described signaling molecules for growth such as JAK/STAT, Erk1/2,
PI3 kinase, and Akt should be checked following Tmem27 expression. I did not
find an increase in the expression levels of cell cycle modulators such as cdk-4
and cyclin D1 upon Tmem27 expression, however, control of cell cycle is very
76
complicated and requires a precise balance of many different proteins. Further
experiments should be performed in order to distinguish which molecules
mediate the growth effect of Tmem27.
3.6 Conclusion
In this thesis I have identified and characterized a novel growth factor in
pancreatic β cells. I show that Tmem27 expression is directly regulated by Tcf1
elucidating a link between the mutated transcription factor and its consequent
islet mass phenotype. I demonstrate that Tmem27 undergoes ectodomain
shedding, however, the function of this process needs to be elucidated. The data
collectively suggest that full-length Tmem27 is responsible for the proliferation
response. Thus we speculate that release of the extracellular domain may be a
signal used to regulate replication of β cells of the islet (Figure 59). Identification
of the protease in control of Tmem27 shedding and the functional relevance of
this cleavage is crucial. Such studies will validate Tmem27 or its inactivating
protease as a novel pharmacological target for the treatment of diabetes.
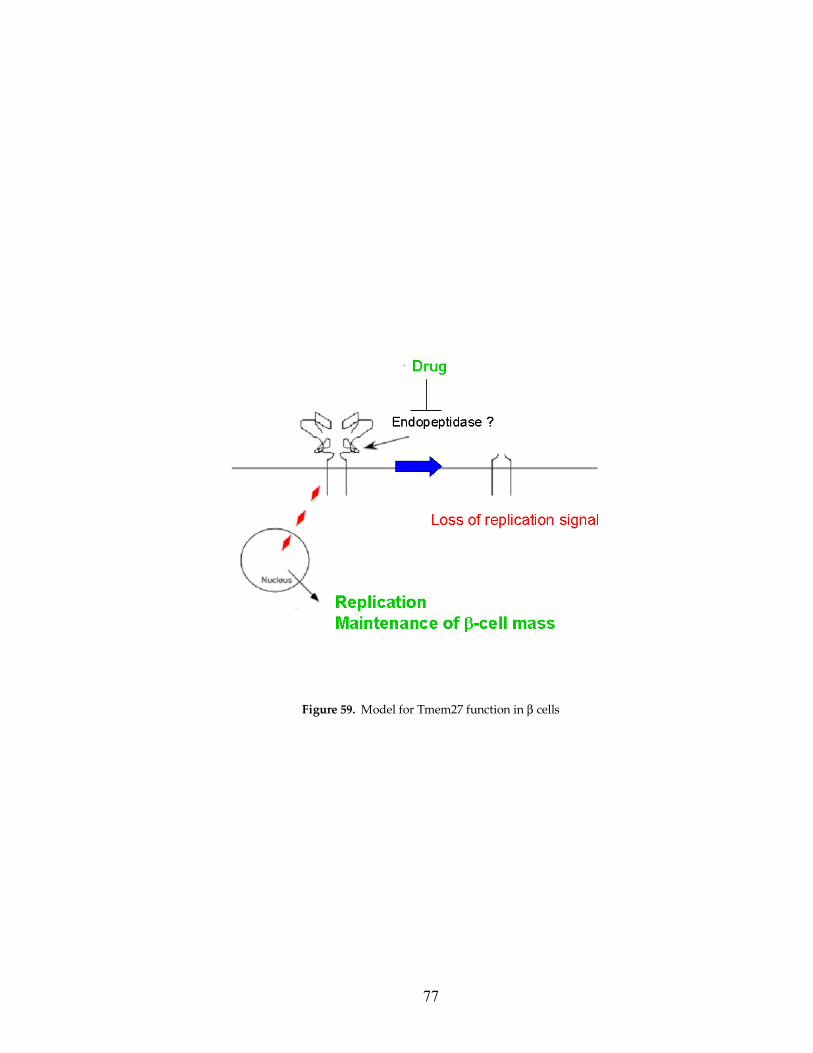
77
Figure 59. Model for Tmem27 function in β cells
78
EXPERIMENTAL PROCEDURES
Experimental animals
All animal models were housed in Laboratory of Animal Research Center
(LARC), a pathogen-free animal facility at the Rockefeller University. The
animals were maintained on a 12 hours light/dark cycle and fed a standard
rodent chow. Genotyping of transgenic mice was performed on DNA isolated
from 3 weeks old mice by PCR (Lee et al., 1998).
Vectors
The reporter plasmid pT27luc-wt was generated by cloning an 815-bp fragment
of the mouse Tmem27 promoter into pGL2-luciferase. The reporter plasmids
pT27luc-m1 and -m2 are identical to pT27luc-wt except for mutated TCF1
binding sites at positions -56 to –59 and –116 to –119. Vector pTmem27.V5 is
generated by cloning a PCR fragment of 696 bp that encompasses 30 bp of 5’UTR
of Tmem27 cDNA and the rest of the open reading frame except for the stop
codon into pcDNA3.1/V5-His-TOPO vector from Invitrogen. Vector pTmem27-
V5.del. was generated by deleting amino acid residues 17-129 of pTmem27.V5
vector using a PCR approach. The sequences of all constructs were confirmed by
DNA sequencing.
79
Antibodies
Two peptides (anti-Tmem27N: VQSAIRKNRNRINSAFFLD and anti-Tmem27C:
GIPCDPLDMKGGHINDGFLT) were synthesized and processed to >90% purity,
conjugated to KLH and used for immunization of rabbits (Bethyl Laboratories,
Texas). Antisera were affinity purified and tested by western blotting and
immunohistochemistry. Affinity purified antisera were used for all studies.
Other antibodies used for immunoblotting and immunohistochemistry were
obtained from the following sources: anti-insulin (Linco), anti-glucagon (Linco),
anti-V5 (Invitrogen), anti-Tcf1 (Active Motif), anti-HA (Covance), anti-Glut2
(R&D Systems), anti-synaptophysin (Chemicon), anti-somatostatin (Cell
Marque), anti-PP (Linco), and anti-Pdx1 (gift from Chris Wright). Rhodamine red
conjugated donkey anti-guinea pig (Jackson Labs), Alexa 488 donkey anti-rabbit
(Molecular Probes).
Cell culture
MIN6 cells were cultured with DMEM medium containing 25 mM glucose, 15%
fetal bovine serum, and 5.5 µM 2-mercaptoethanol. INS-1 cells were cultured
with RPMI 1640 medium containing 11.1 mM glucose and 5% fetal bovine serum
and 10 mM Hepes, pH7.4. HepG2 cells were cultured with DMEM medium
containing 25 mM glucose and 10% fetal bovine serum. Pancreatic islets were
80
cultured in RPMI-1640 medium. S2 cells were cultured in Schneider’s Medium
with 10% FBS.
Transient transfections and luciferase assay
Fugene reagent (Roche) for HepG2 cells and Lipofectamine 2000 (Invitrogen) for
MIN6 cells were used according to the manufacturer’s directions in transient
transfections. 0.5 µg of luciferase reporter construct, expression vector and
CMV-LacZ were added per 35 mm dish. Luciferase was normalized for
transfection efficiency by the corresponding β-galactosidase activity (Shih et al.,
2001).
Crosslinking of proteins in cell lysates
MIN6 cells, grown to 90% confluency in 6 well plates, were harvested and
resuspended in reaction buffer and reagent in 50 µl volume and incubated for 2
hrs at 4˚C. Reactions were stopped by adding 50 mM Tris-Hcl, pH 7.4 for 10 min
on ice. Cells were then washed with PBS and lysed in RIPA buffer in the
presence of protease inhibitors for 15 min at 4˚C. Cell lysates were centrifuged
for 5 min at 10,000 x g and the supernatants were subjected to reducing and non-
reducing SDS-PAGE followed by immunoblotting. Crosslinking reagents and
81
buffers: BMH (Pierce) was dissolved in DMSO and incubated in PBS, and DTBP
(Pierce) was dissolved in water and incubated in 0.2 M triethanolamine pH 8.0.
Inhibition and enzymatic cleavage of N-glycosylation
MIN6 cells that express pV5-TMEM27 were incubated with indicated
concentrations of tunicamycin (Sigma) dissolved in DMSO and with DMSO
alone for 12 h at 37˚C. Cell lysates were then subjected to SDS-PAGE and
immunoblotting with anti-V5 antibody.
Intact N-linked glycans were removed from secreted portion of TMEM27 with
the recombinant enzyme N-glycanase (Prozyme, San Leandro, CA).
Supernatants from MIN6 cells and pancreatic islets were denatured in 20 mM
sodium phosphate pH 7.5, 0.1% SDS and 50 mM β-mercaptoethanol by heating at
100˚C for 5 min. NP-40 was added to a final concentration of 0.75 % and reaction
was incubated with N-glycanase for 3 h at 37˚C.
Electrophoretic mobility shift assays (EMSA)
EMSA analysis was performed as described previously (Shih et al., 2001) with
minor modifications. Assay was performed with 10 µg of whole cell extracts in
binding buffer (20 mM Hepes, pH 7.9, 10 % glycerol, 150 mM NaCl, 1 mM DTT).
Whole cell extracts were incubated with 32P-labeled double stranded
82
oligonucleotide probes containing the wildtype or mutant Tcf1 binding sites in
the TMEM27 promoter (sequences: 5’-GGAGATTTTCGTAAATAACTGACA -3’,
5’-GGGCGTTAATTATTAAACCTTTTA-3’ and 5’-GGGCAGAGATTATTAAA
CCTTTTA-3’, respectively). Cold competitor was an unlabeled double-stranded
oligonucleotide containing the Tcf1 binding site in the Fxr-1 promoter (sequence:
5'−GATGGGGGTTAATCAAGTAAACCACAC−3'). Supershifts were carried out with an
anti-Tcf1 antibody (Geneka Biotechnology Inc., Montreal, Canada). ChIP analysis
was carried out using isolated primary hepatocytes and isolated islets from
C57/B6 mice or MIN6 cells, and the ChIP Assay kit (Upstate Cell Signaling
Solutions, Lake Placid, NY) according to the manufacturers protocol. Tcf1 was
precipitated with anti-HNF-1� antibody and DNA was amplified using primers
sequences: 5’-ACAGGAGGCAGGTGGGAGGCTTCT -3’ and 5’-CCCGGA
TTAGGGTATCGGAGAA -3’). Primers for apoM were 5’-GGGCTCAG
CTTTCCTCCTA-3’ and 5’-CTCCGCCTTAACTGTTCTCTGATG -3’).
Whole Cell extract preparation
MIN6 cells were grown to 90% confluency in 150 mm tissue culture dishes. Cells
were washed once in ice-cold PBS and scraped into 3 ml PBS. Cells were
centrifuged at 4,000 x g for 4 min and resuspended in 2 volumes of high-salt
extraction buffer (400 mM KCl, 20 mM Tris, pH 7.5, 20 % glycerol, 2 mM DTT, 1x
83
complete TM protease inhibitors (Boehringer Mannheim), and 20 µg/mL
Aprotinin). Cell-lysis was performed by freezing and thawing, and the cellular
debris was removed by centrifugation at 16,000 x g for 10 min at 4˚C.
Pulse-Chase experiment with 35S-labeled Tmem27
2 x 10⁵ MIN6 cells were plated in 35 mm dishes and incubated in methionine-free
DMEM (DMEM-Met) for 70 min at 37oC. 200 µCi/mL of [35S]methionine was
added to DMEM-Met and cells were labeled in this media for 2 hours at 37oC. At
the end of the pulse period, MIN6 cells were chased with complete growth
medium for different periods. At the indicated time points, supernatants were
collected and cells were lysed for immunoprecipitation. Cells were washed in ice
cold PBS five times and scraped into PBS and centrifuged for 5 min at 2000 rpm.
Cells were suspended in lysis buffer (20 mM Tris-HCl pH 7.4, 150 mM NaCl, 1%
NP40, 1mM EDTA and protease inhibitors) and sonicated 5 sec for 4 times.
0.25% sodium deoxycholate was added to the samples, which were then mixed
and incubated on ice for 15 min. Samples were centrifuged for 15 min at max
speed at 4oC and the supernatant from the lysates were immuno-precipitated
with α-Tmem27C for 16 hours at 4oC followed by incubation with Protein G-
Sepharose for 1 hour. Collected MIN6 supernatants were adjusted to 20 mM
Tris-HCl pH 7.4 and 1% NP40 along with protease inhibitors. α-Tmem27N
84
antibodies were used to immunoprecipitate cleaved protein for 16 hrs at 4oC
followed by incubation with Protein G-Sepharose for 1 h. The sepharose beads
were washed in ice-cold PBS 5-times for 5 min each and resuspended in SDS
sample buffer (2% SDS, 62.5 mM Tris, pH 6.8). Samples were boiled for 5 min
and supernatants were run on 4-15% gradient SDS gels. Gels were processed for
autoradiography and exposed on film.
In vitro insulin secretion and hormone measurements
Mouse islets were isolated and incubated in different glucose concentrations
after an overnight culture. Insulin and glucagon were extracted from pancreata
with acid ethanol (10% glacial acetic acid in absolute ethanol), sonicated for 10
min, and centrifuged 2 times at 4°C at 12,000xg for 10 min. Supernatants were
collected and stored at -20°C for insulin and glucagon determinations by using
sensitive RIA kits (Linco Research).
Pancreatic islet and RNA isolation
Pancreatic islets were isolated from 6 to 8 week-old mice. We used collagenase
digestion and differential centrifugation through Ficoll gradients, with a
modification of procedures previously described (Shih et al., 2002). Total RNA
was then extracted using TRIzol reagent (Gibco-BRL) and following the
85
manufacturer’s instructions. Contaminating genomic DNA was removed using
1µl of RNase free DNase-I (Boehringer) per 5µg of RNA.
Islet morphometry
The pancreata were fixed in paraformaldehyde and stained for insulin and pool
of glucagon, pancreatic polypeptide and somatostatin as described above.
Sections (7�m) through the entire pancreas were taken, and every sixth section
was used for morphometric analysis. At least 288 non-overlapping images (pixel
size 0.88�m) were scanned using a confocal laser-scanning microscope (Zeiss
LSM 510, Germany). The parameters measured in this study were analyzed
using integrated morphometry analysis tool in the Metamorph Software Package
(Universal Imaging Corporation, PA). The area covered by cells stained by
insulin or non-β cell pool was integrated using stained objects that are greater
than 10 pixel in size.
RT-PCR
Total RNA was extracted using TRIZOL reagent (Invitrogen) and 10 �g of RNA
was treated with 5U of RNase-free DNase-I (Ambion). cDNA was synthesized
using Moloney leukemia virus reverse transcriptase with dNTPs and random
hexamer primers (Invitrogen). The cDNAs provided templates for PCRs using
86
specific primers in the presence of [�-32P]dCTP and Taq polymerase as previously
described (Shih et al., 2001). Quantitative PCR was performed using the
Sequence Detection System 7700 (Applied Biosystems) for amplification and
specific sequence detection. Forward and reverse PCR primers were used at a
final concentration of 300 nM, and probes, containing a 5' fluorophor (6-FAM)
and a 3' quencher (TAMRA), were used at a final concentration of 100 nM.
Expression of Tmem27 was evaluated relative to the mRNA expression of the
housekeeping gene �-actin in the same sample. Cycling parameters were: 2 min,
50°C; 10 min, 95°C; and 40 times: 30 s, 95°C; 1 min, 60°C. Primers and probes
were purchased from Applied Biosystems.
Immunoblotting and Immunohistochemistry
Cytosolic protein extracts were separated by SDS-PAGE (4-15%) and transferred
onto a nitrocellulose membrane (Schleicher & Schuell) by electroblotting.
TMEM27 was detected with anti-Tmem27N and anti-Tmem27C antisera (1:500).
Membranes were incubated with primary antibodies overnight at 4°C.
Incubations containing the secondary antibody were performed at RT for 1 hr.
SDS-PAGE under non-reducing conditions was performed under conditions
omitting DTT from the sample buffer.
87
MIN6 cells were plated on coated slides (Nalge Nunc Int.) and fixed with 4%
paraformaldehyde at 4˚C for 20 min. Mouse islets were dissociated for 5 min at
37oC in the presence of 0.01% Trypsin-EDTA and were plated in collagen coated
slides and fixed the same way. Slides were incubated in 0.01% saponin with 3%
normal donkey serum in PBS for 30 min at room temperature and anti-
Tmem27N and anti-Tmem27C (1:20) were added overnight at 4˚C along with
anti-insulin (1:600), anti-Glut2 (1:50), and anti-synaptophysin (1:500). Secondary
antibodies were added for 30 min at RT.
Pancreata were fixed in 4% paraformaldehyde at 4˚C for 4 h and embedded in
paraffin. 7 µm sections were cut and after deparaffinization, antigen-unmasking
was performed by microwaving slides in 0.01 M sodium citrate pH 6.0. Sections
were permeabilized in 0.1 % Triton-X-100 and incubated in 3 % normal donkey
serum in PBS for 30 min. Staining was completed as above.
Electron microscopy studies
MIN6 cells were fixed in 4% paraformaldehyde and 0.02% glutaraldehyde in 0.1
M cacodylate buffer, pH 7.4 for 2 hours. The cells were washed with PBS and
embedded in 10% gelatin and refixed as above. Cell pellets were cryo-protected
using a 2.3M sucrose solution in PBS, and samples were stored in liquid nitrogen
until use (Griffith et al., 1983). Cryo, ultrathin sections were cut using glass
88
knives in a Reichert-Jung FC-4E cryo-ultramicrotome. The sections were
collected on Formvar-carbon coated nickel grids, blocked with 1% BSA-PBS and
incubated with anti-Tmem27C at a 1:10 dilution. Incubation was stopped by
washing 2 times with PBS, 15 min each. The sections were then incubated with
goat anti-rabbit IgG conjugated to 10 nm gold particles (Amersham Life Science,
Arlington Heights, IL). The grids were processed and stained as desribed
previously (Tokuyasu et al., 1973).
Thymidine incorporation studies
[3H]Thymidine incorporation in 5 x 10⁴ cells/well in 24-well culture plates was
assayed as follows. 48 hrs after electroporation, cells were incubated in growth
arrest medium (0.5% FCS) for the next 24 hours and then incubated for an
additional 24 hours in normal growth medium. For the last 4 h of the incubation,
0.25 µCi/well [3H]methylthymidine (Perkin Elmer) was added. After completion,
cells were rinsed twice in ice-cold PBS, and incubated with 10% trichloroacetic
acid (TCA) on ice for 20 min. After washing with 10% TCA, cells were
solubilized in 0.2M NaOH/1% SDS for 10 min at room temperature. TCA-
insoluble materials were neutralized with 0.2M HCl, and radioactivity was
determined by a liquid scintillation counter.
89
RNA interference
Synthetic siRNAs were synthesized by Dharmacon Research (Lafayette, CO).
siRNAs were designed for mouse TMEM27 (NM_020626) and Luciferase. The
target sequences of siRNAs are: siTMEM27#1: gaagtacagtcggccataa,
siTMEM27#2: ctacctatgctgatttaat. 3µg of each siRNA per 1 x 10⁶ cells were
electroporated into MIN6 cells.
Generation of adenovirus
Adenovirus construct was generated by building a minigene with the addition of
the intron between exon 1 and exon 2 to human Tmem27 cDNA. Sequence for 5’
UTR, exon 1, intron 1, exon 2, and first 60 nucleotides of exon 3 were cloned into
pcRII-TOPO (Invitrogen). This construct was digested with EarI and BstXI to
obtain a 756 bp fragment and inserted into pcDNA3.V5 (BstXI and NotI) along
with the 549 bp fragment taken out of Tmem27-pcDNA3.V5 with EarI and NotI.
The minigene construct in pcDNA3.V5 was digested with HindIII and AvrII.
The fragment was inserted into pCMV-Adenovirus vector digested with HindIII
and SpeI to create Adv-hTmem27.
90
Generation of transgenic lines
Human Tmem27 cDNA was cloned next to 949 bp of the rat insulin promoter
(RIP) in pcRII-TOPO vector (Invitrogen). Both transgenic lines were generated
by pronuclear injection of the promoter and cDNA sequence that was extracted
from the vector construct with NsiI. Transgenic lines are genotyped by southern
blotting using AflII and NcoI that yields different patterns for both lines.
Bacterial protein production for monoclonal and polyclonal antibodies
Human Tmem27 sequence for amino acids 15-121 was subcloned into pGEX-4T-1
(Amersham) in frame with glutathione s-transferase (GST) includng a cleavage
site for thrombin. BL21 cells were transformed with construct and soluble
protein was produced by inducing with 0.25 mM IPTG. Briefly, cultures were
induced with IPTG when reached OD reading of 0.6 at A600. Cultures were
further incubated at 37 oC shaking for 5 hours. Bacteria was centrifuged at 6000
rpm for 10 min and dissolved in ice cold PBS that contains protease inhibitors (50
µl PBS per 1 ml of culture). Solutions were sonicated at power 3 for 3 times 15
seconds each with a 1 minute cooling period between each pulse. Triton-X-100
was added to solutions to a concentration of 1% and tubes were rotated at 4oC for
30 minutes. Bacterial lysates are centrifuged at 25000 rpm for 25 min at 4oC and
the supernatant is filtered with 45 µm syringe filters. Supernatants were
91
incubated overnight at 4oC with GST-coupled beads and the next day beads were
washed three times in ice cold PBS. The protein was eluted for ½ hr in 50 mM
Tris pH 8.0, 10 mM reduced glutathione, and 5 mM β-octylglucoside. Eluted
protein was dialyzed 16-24 hrs in 50 mM Tris pH 8.0 and concentrated in
Microcon YM-3 centrifugal units.
S2 cell protein production for a polyclonal antibody
Sequence spanning amino acids 15 to 121 of human Tmem27 was cloned in
frame to vector pMT/BiP/V5-His (Invitrogen) to create hTmem27-pMT/BiP/V5.
S2 cells were transfected using CaPO4 with hTmem27-pMT/BiP/V5 or GFP-
pMT/BiP/V5. Briefly, S2 cells were seeded in 6 well plates (1.5 x 10⁶ cells in 3 ml)
and transfected 24 hours later. Solution A was prepared by adding 36 µl of 2M
CaCl2 and 19 µg DNA to a total volume of 300 µl with sterile water. Solution B
was 300 µl of 2x Hepes buffered saline (HBS). Solution A was added to solution
B in a dropwise fashion while bubbling through with a pipette over 2 minutes.
The mixed solution is incubated at room temperature for 45 minutes and added
in drops while swirling the cells. In 24 hours, cells are centrifuged at 800 rpm for
10 minutes and washed twice with fresh medium. BiP is a secretion signal and
hTmem27-V5 is secreted into the supernatant when S2 cells expressing
hTmem27-pMT/BiP/V5 is induced with CuSO4.
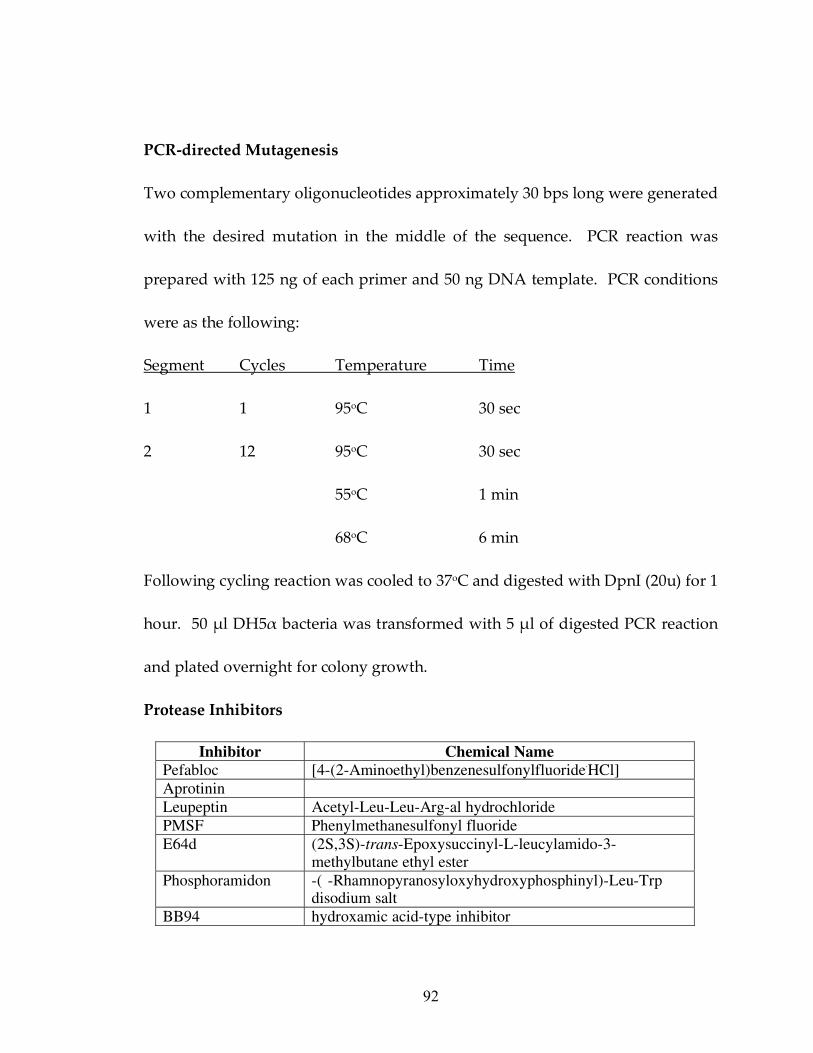
92
PCR-directed Mutagenesis
Two complementary oligonucleotides approximately 30 bps long were generated
with the desired mutation in the middle of the sequence. PCR reaction was
prepared with 125 ng of each primer and 50 ng DNA template. PCR conditions
were as the following:
Segment Cycles Temperature Time
1 1 95oC 30 sec
2 12 95oC 30 sec
55oC 1 min
68oC 6 min
Following cycling reaction was cooled to 37oC and digested with DpnI (20u) for 1
hour. 50 µl DH5α bacteria was transformed with 5 µl of digested PCR reaction
and plated overnight for colony growth.
Protease Inhibitors
Inhibitor Chemical Name Pefabloc [4-(2-Aminoethyl)benzenesulfonylfluoride.HCl] Aprotinin Leupeptin Acetyl-Leu-Leu-Arg-al hydrochloride PMSF Phenylmethanesulfonyl fluoride E64d (2S,3S)-trans-Epoxysuccinyl-L-leucylamido-3-
methylbutane ethyl ester Phosphoramidon -( -Rhamnopyranosyloxyhydroxyphosphinyl)-Leu-Trp
disodium salt BB94 hydroxamic acid-type inhibitor

93
Statistical analysis
Results are given as mean ± SD. Statistical analyses were performed by using a
Student’s t-test, and the null hypothesis was rejected at the 0.05 level.
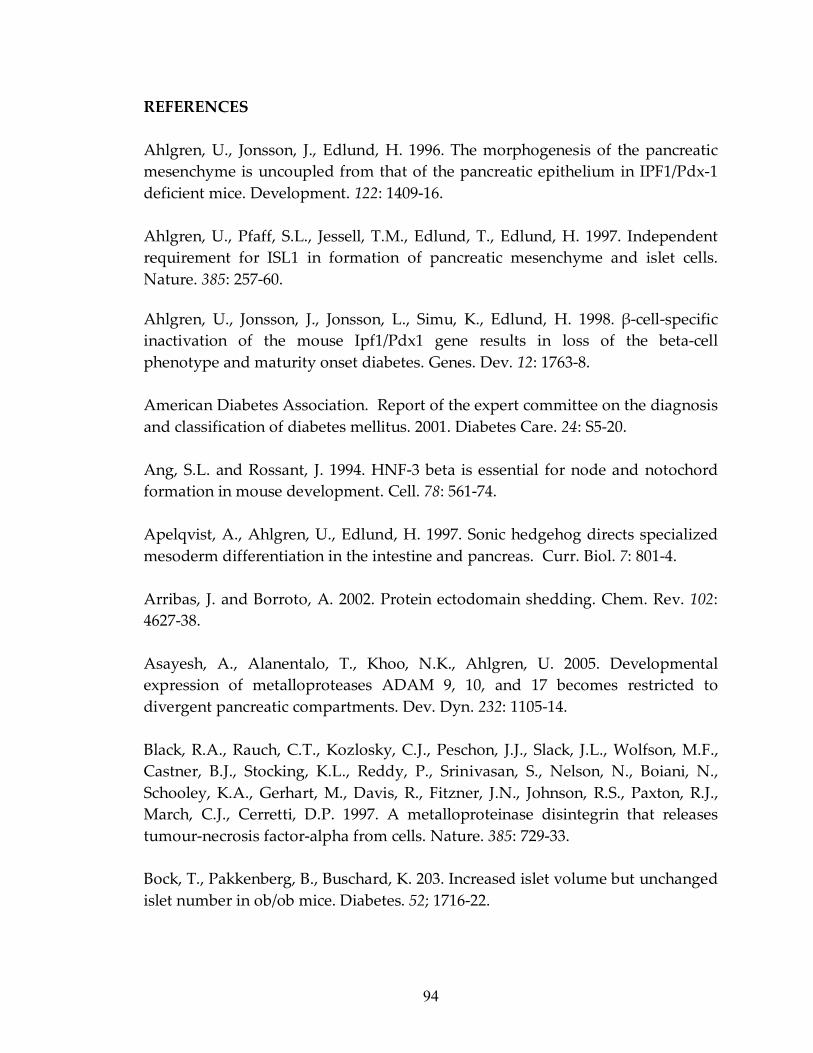
94
REFERENCES Ahlgren, U., Jonsson, J., Edlund, H. 1996. The morphogenesis of the pancreatic mesenchyme is uncoupled from that of the pancreatic epithelium in IPF1/Pdx-1 deficient mice. Development. 122: 1409-16. Ahlgren, U., Pfaff, S.L., Jessell, T.M., Edlund, T., Edlund, H. 1997. Independent requirement for ISL1 in formation of pancreatic mesenchyme and islet cells. Nature. 385: 257-60. Ahlgren, U., Jonsson, J., Jonsson, L., Simu, K., Edlund, H. 1998. β-cell-specific inactivation of the mouse Ipf1/Pdx1 gene results in loss of the beta-cell phenotype and maturity onset diabetes. Genes. Dev. 12: 1763-8. American Diabetes Association. Report of the expert committee on the diagnosis and classification of diabetes mellitus. 2001. Diabetes Care. 24: S5-20. Ang, S.L. and Rossant, J. 1994. HNF-3 beta is essential for node and notochord formation in mouse development. Cell. 78: 561-74. Apelqvist, A., Ahlgren, U., Edlund, H. 1997. Sonic hedgehog directs specialized mesoderm differentiation in the intestine and pancreas. Curr. Biol. 7: 801-4. Arribas, J. and Borroto, A. 2002. Protein ectodomain shedding. Chem. Rev. 102: 4627-38. Asayesh, A., Alanentalo, T., Khoo, N.K., Ahlgren, U. 2005. Developmental expression of metalloproteases ADAM 9, 10, and 17 becomes restricted to divergent pancreatic compartments. Dev. Dyn. 232: 1105-14. Black, R.A., Rauch, C.T., Kozlosky, C.J., Peschon, J.J., Slack, J.L., Wolfson, M.F., Castner, B.J., Stocking, K.L., Reddy, P., Srinivasan, S., Nelson, N., Boiani, N., Schooley, K.A., Gerhart, M., Davis, R., Fitzner, J.N., Johnson, R.S., Paxton, R.J., March, C.J., Cerretti, D.P. 1997. A metalloproteinase disintegrin that releases tumour-necrosis factor-alpha from cells. Nature. 385: 729-33. Bock, T., Pakkenberg, B., Buschard, K. 203. Increased islet volume but unchanged islet number in ob/ob mice. Diabetes. 52; 1716-22.
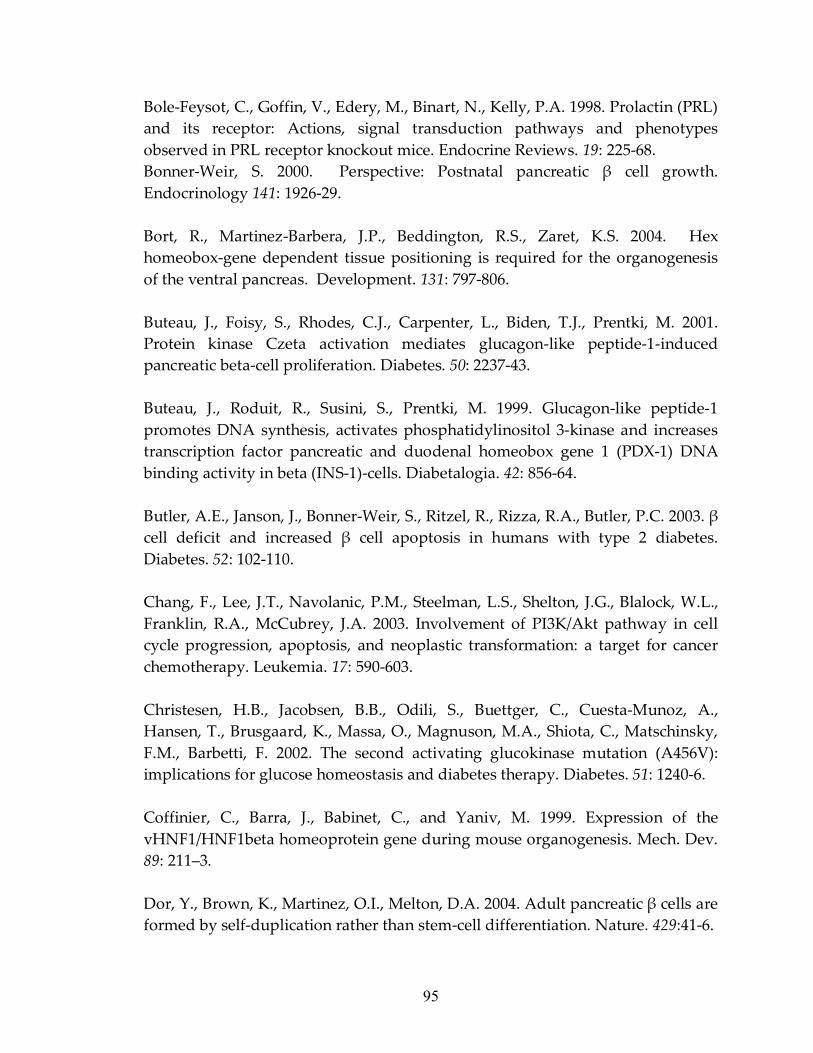
95
Bole-Feysot, C., Goffin, V., Edery, M., Binart, N., Kelly, P.A. 1998. Prolactin (PRL) and its receptor: Actions, signal transduction pathways and phenotypes observed in PRL receptor knockout mice. Endocrine Reviews. 19: 225-68. Bonner-Weir, S. 2000. Perspective: Postnatal pancreatic β cell growth. Endocrinology 141: 1926-29. Bort, R., Martinez-Barbera, J.P., Beddington, R.S., Zaret, K.S. 2004. Hex homeobox-gene dependent tissue positioning is required for the organogenesis of the ventral pancreas. Development. 131: 797-806. Buteau, J., Foisy, S., Rhodes, C.J., Carpenter, L., Biden, T.J., Prentki, M. 2001. Protein kinase Czeta activation mediates glucagon-like peptide-1-induced pancreatic beta-cell proliferation. Diabetes. 50: 2237-43. Buteau, J., Roduit, R., Susini, S., Prentki, M. 1999. Glucagon-like peptide-1 promotes DNA synthesis, activates phosphatidylinositol 3-kinase and increases transcription factor pancreatic and duodenal homeobox gene 1 (PDX-1) DNA binding activity in beta (INS-1)-cells. Diabetalogia. 42: 856-64. Butler, A.E., Janson, J., Bonner-Weir, S., Ritzel, R., Rizza, R.A., Butler, P.C. 2003. β cell deficit and increased β cell apoptosis in humans with type 2 diabetes. Diabetes. 52: 102-110. Chang, F., Lee, J.T., Navolanic, P.M., Steelman, L.S., Shelton, J.G., Blalock, W.L., Franklin, R.A., McCubrey, J.A. 2003. Involvement of PI3K/Akt pathway in cell cycle progression, apoptosis, and neoplastic transformation: a target for cancer chemotherapy. Leukemia. 17: 590-603. Christesen, H.B., Jacobsen, B.B., Odili, S., Buettger, C., Cuesta-Munoz, A., Hansen, T., Brusgaard, K., Massa, O., Magnuson, M.A., Shiota, C., Matschinsky, F.M., Barbetti, F. 2002. The second activating glucokinase mutation (A456V): implications for glucose homeostasis and diabetes therapy. Diabetes. 51: 1240-6. Coffinier, C., Barra, J., Babinet, C., and Yaniv, M. 1999. Expression of the vHNF1/HNF1beta homeoprotein gene during mouse organogenesis. Mech. Dev. 89: 211–3. Dor, Y., Brown, K., Martinez, O.I., Melton, D.A. 2004. Adult pancreatic β cells are formed by self-duplication rather than stem-cell differentiation. Nature. 429:41-6.
96
Drucker, D.J. 2006. The biology of incretin hormones. Cell Metab. 3:153-65. Edlund, H. 2002. Pancreatic organogenesis-developmental mechanisms and implications for therapy. Nat. Rev. Genet. 3: 524-32. Fajans, S.S., Brown, M.B. 1993. Administration of sulfonylureas can increase glucose-induced insulin secretion for decades in patients with maturityonset diabetes of the young. Diabetes Care 16: 1254-61. Finegood, D.T., Scaglia, L., Bonner-Weir, S. 1995. Dynamics of β cell mass in the growing rat pancreas. Estimation with a simple mathematical model. Diabetes 44; 249-56. Flier, S.N., Kulkarni, R.N., Kahn, C.R. 2001. Evidence for a circulating islet cell growth factor in insulin resistant states. Proc. Natl. Acad. Sci. USA. 98: 7475-80. Frayling, T.M., Evans, J.C., Bulman, M.P., Pearson, E., Allen, L., Owen, K., Bingham, C., Hannemann, M., Shepherd, M., Ellard, S., Hattersley, A.T. 2001. β cell genes and diabetes: molecular and clinical characterization of mutations in transcription factors. Diabetes. 50: S94-100. Friedrichsen, B.N., Galsgaard, E.D., Nielsen, J.H., Moldrup, A. 2001. Growth hormone- and prolactin-induced proliferation of insulinoma cells, INS-1, depends on activation of STAT5 (signal transducer and activator of transcription 5). Mol Endocrinol. 15:136-48. Friedrichsen, B.N., Richter, H.E., Hansen, J.A., Rhodes, C.J., Nielsen, J.H., Billestrup, N., Moldrup, A. 2003. Signal transducer and activator of transcription 5 activation is sufficient to drive transcriptional induction of cyclin D2 gene and proliferation of rat pancreatic beta-cells. Mol Endocrinol. 17:945-58. Froguel, P., Zouali, H., Vionnet, N., Velho, G., Vaxillaire, M., Sun, F., Lesage, S., Stoffel, M., Takeda, J., Passa, P., et al. 1993. Familial hyperglycemia due to mutations in glucokinase. Definition of a subtype of diabetes mellitus. N. Eng.J. Med. 328: 697-702. Fukui, K., Yang, Q., Cao, Y., Takahashi, N., Hatakeyama, H., Wang, H., Wada, J., Zhang, Y., Marselli, L., Nammo, T., Yoneda, K., Onishi, M., Higashiyama, S., Matsuzawa, Y., Gonzalez, F.J., Weir, G.C., Kasai, H., Shimomura, I., Miyagawa,
97
J., Wollheim, C.B., Yamagata, K. 2005. The HNF-1 target collectrin controls insulin exocytosis by SNARE complex formation. Cell Metab. 2: 373-84. Furge, K.A., Zhang, Y.W., Vande Woude, G.F. 2000. Met receptor tyrosine kinase: enhanced signaling through adapter proteins. Oncogene. 19: 5582-9. Gahr, S., Merger, M., Bollheimer, L.C., Hammerschmied, C.G., Scholmerich, J., Hugl, S.R. 2002. Hepatocyte growth factor stimulates proliferation of pancreatic beta-cells particularly in the presence of subphysiological glucose concentrations. J Mol Endocrinol. 28: 99-110. Gapp, D.A., Leiter, E.H., Coleman, D.L. Schwizer, R.W. 1983. Temporal changes in pancreatic islet composition in C57BL/6J-db/db (diabetes) mice. Diabetologia. 25: 439-43. Geisler, N., Schunemann, J., Weber, K. 1992. Chemical cross-linking indicates a staggered and antiparallel protofilament of desmin intermediate filaments and characterizes one higher-level complex between protofilaments. Eur. J. Biochem. 206: 841-52. Georgia, S. and Bhushan, A. 2004. Β cell replication is the primary mechanism for maintaining post-natal β cell mass. Journal of Clin. Invest. 114: 963-8. Glaser, B., Kesavan, P., Heyman, M., Davis, E., Cuesta, A., Buchs, A., Stanley, C.A., Thornton, P.S., Permutt, M.A., Matschinsky, F.M., Herold, K.C. 1998. Familial hyperinsulinism caused by an activating glucokinase mutation. N. Engl. J. Med. 338: 226-30. Gloyn, A.L., Noordam, K., Willemsen, M.A., Ellard, S., Lam, W.W., Campbell, I.W., Midgley, P., Shiota, C., Buettger, C., Magnuson, M.A., Matschinsky, F.M., Hattersley, A.T. 2003. Insights into the biochemical and genetic basis of glucokinase activation from naturally occurring hypoglycemia mutations. Diabetes. 52: 2433-40. Gradwohl, G., Dierich, A., LeMeur, M., Guillemot, F. 2000. Neurogenin3 is required for the development of the four endocrine cell lineages of the pancreas. Proc. Natl. Acad. Sci. USA. 97: 1607-11.
98
Grupe, A., Hultgren, B., Ryan, A., Ma, Y.H., Bauer, M., Stewart, T.A. 1995. Transgenic knockouts reveal a critical requirement for pancreatic beta cell glucokinase in maintaining glucose homeostasis. Cell. 83:69-78. Gu, G., Dubauskaite, J., Melton, D.A. 2002. Direct evidence for the pancreatic lineage: NGN3+ cells are islet progenitors and are distinct from duct progenitors. Development. I129: 2447-57. Habener, J.F., Kemp, D.M., Thomas, M.K. 2005. Minireview: Transcriptional regulation in pancreatic development. Endocrinology. 146: 1025-1034. Hagenfeldt-Johansson, K.A., Herrera, P.L., Wang, H., Gjinovci, A., Ishihara, H., Wollheim, C.B. 2001. Beta-cell-targeted expression of a dominant-negative hepatocyte nuclear factor-1 alpha induces a maturity-onset diabetes of the young (MODY)3-like phenotype in transgenic mice. Endocrinology. 142: 5311-20. Hanahan, D. 1985. Heritable formation of pancreatic beta-cell tumors in transgenic mice expressing recombinant insulin/simian virus 40 oncogenes. Nature. 315: 115-122. Hani, E.H., Stoffers, D.A., Chevre, J.C., Durand, E., Stanojevic, V., Dina, C., Habener, J.F., Froguel, P. 1999. Defective mutations in the insulin promoter factor-1 gene in late-onset type 2 diabetes mellitus. J. Clin. Invest. 104: R41-8. Herrera, P.L. 2000. Adult insulin and glucagons producing cells differentiate from two independent cell lineages. Development. 127: 2317-22. Jacquemin, P., Durviaux, S.M., Jensen, J., Godfraind, C., Gradwohl, G., Guillemot, F., Madsen, O.D., Carmeliet, P., Dewerchin, M., Collen, D., Rousseau, G.G., Lemaigre, F.P. 2000. Transcription factor hepatocyte nuclear factor 6 regulates pancreatic endocrine cell differentiation and controls expression of the proendocrine gene ngn3. Mol. Cell Biol. 20: 4445-54. Jonsson, J., Carlsson, L., Edlund, T., Edlund, H. 1994. Insulin-promoter-factor 1 is required for pancreas development in mice. Nature. 371: 606-9. Johnson, J.D., Ahmed, N.T., Luciani, D.S., Han, Z., Tran, H., Fujita, J., Misler, S., Edlund, H, Polonsky, K.S. 2003. Increased islet apoptosis in Pdx1+/- mice. J. Clin. Invest. 111: 1147-60.
99
Kahn, C.R. 2003. Knockout mice challenge our concepts of glucose homeostasis and the pathogenesis of diabetes. Exp. Diabesity Res. 4: 169-82. Kawasaki, F., Matsuda, M., Kanda, Y., Inoue, H., Kaku, K. 2005. Structural and functional analysis of pancreatic islets preserved by pioglitazone in db/db mice. Am. J. Physiol. Endocrinol. Metab. 288: E510-8. Kitamura, T., Nakae, J., Kitamura, Y., Kido, Y., Wright, C.V., White, M.F., Arden, K.C., Accili, D. 2002. The forkhead transcription factor Foxo1 links insulin signaling to Pdx1 regulation of pancreatic beta cell growth. J Clin Invest. 110: 1839-47. Kloppel, G. 1985. Islet pathology and the pathogenesis of type 1 and type 2 diabetes mellitus revisited. Surv. Synth. Pathol. Res. 4: 110-25. Kulkarni, R.N., Otani, K., Baldwin, A.C., Kruetzfeldt, J., Ueki, K., Stoffel, M., Kahn, C.R., Polonsky, K.S. 2004. Reduced β cell mass and altered glucose sensing impair insulin secretory function in βIRKO mice. Am. J. Physiol. Endocrinol. Metab. 286: E41-9. Lammert, E., Cleaver, O., Melton, D. 2003. Role of endothelial cells in early pancreas and liver development. Mech. Dev. 120: 59-64. Lee, C.S., De Leon, D.D., Kaestner, K.H., Stoffers, D.A. 2006. Regeneration of pancreatic islets after partial pancreatectomy in mice does not involve the reactivation of neurogenin3. Diabetes. 55: 269-72. Lee, Y.H., Sauer, B., Gonzalez, F.J. 1998. Laron dwarfism and non-insulin-dependent diabetes mellitus in the Hnf-1alpha knockout mouse. Mol. Cell Biol. 18: 3059-68. Levine, A.J. 1997. P53, the cellular gate keeper for growth division. Cell. 88: 323-31. Li, H., Arber, S., Jessell, T.M., Edlund, H. 1999. Selective agenesis of the dorsal pancreas in mice lacking homeobox gene Hlxb9. Nat. Genet. 23: 67-70. Lingohr, M.K., Buettner, R., Rhodes, C.J. 2002. Pancreatic β cell groeth and survival – a role in obesity-linked type 2 diabetes? Trends Mol. Med. 8: 375-84.
100
Macfarlane, W.M., Frayling, T.M., Ellard, S., Evans, J.C., Allen, L.I., Bulman, M.P., Ayres, S., Shepherd, M., Clark, P., Millward, A., Demaine, A., Wilkin, T., Docherty, K., Hattersley, A.T. 1999. Missense mutations in the insulin promoter factor-1 gene predispose to type 2 diabetes. J. Clin. Invest. 104: R33-9. Malecki, M.T., Jhala, U.S., Antonellis, A., Fields, L., Doria, A., Orban, T., Saad, M., Warram, J.H., Montminy, M., Krolewski, A.S. 1999. Mutations in NEUROD1 are associated with the development of type 2 diabetes mellitus. Nat. Genet.23:323-8. Martinez-Gac, L., Alvarez, B., Garcia, Z., Marques, M., Arrizabalaga, M., Carrera, A.C. 2004. Phosphoinositide 3-kinase and Forkhead, a switch for cell division. Biochem Soc Trans. 32: 360-1. Marynissen, G., Aerts, L., Van Assche, F.A. 1983. The endocrine pancreas during pregnancy and lactation in the rat. J. Dev. Physiol. 5: 373-81. Matschinsky, F.M. 1990. Glucokinase as glucose sensor and metabolic signal generator in pancreatic β cells and hepatocytes. Diabetes 39:647-52. Miura, A., Yamagata, K., Kakei, M., Hatakeyama, H., Takahashi, N., Fukui, K., Nammo, T., Yoneda, K., Inoue, Y., Sladek, F.M., Magnuson, M.A., Kasai, H., Miyagawa, J., Gonzalez, F.J., Shimomura, I. 2006. Hepatocyte nuclear factor-4alpha is essential for glucose-stimulated insulin secretion by pancreatic β cells. J. Biol. Chem. 281: 5246-57. Naya, F.J., Huang, H.P., Qiu, Y., Mutoh, H., DeMayo, F.J., Leiter, A.B., Tsai, M.J. 1997. Diabetes, defective pancreatic morphogenesis, and abnormal enteroendocrine differentiation in BETA2/neuroD-deficient mice. Genes Dev. 11: 2323-34. Njolstad, P.R., Sovik, O., Cuesta-Munoz, A., et al. 2001. Neonatal diabetes mellitus due to complete glucokinase deficiency. N. Engl. J. Med. 344: 1588-92. Nishigori, H., Yamada, S., Kohama, T., Tomura, H., Sho, K., Horikawa, Y., Bell, G.I., Takeuchi, T., Takeda, J. 1998. Frameshift mutation, A263fsinsGG, in the hepatocyte nuclear factor-1beta gene associated with diabetes and renal dysfunction. Diabetes. 47: 1354-5.
101
Odom, D.T., Zizlsperger, N., Gordon, D.B., Bell, G.W., Rinaldi, N.J., Murray, H.L., Volkert, T.L., Schreiber, J., Rolfe, P.A., Gifford, D.K., Fraenkel, E., Bell, G.I., Young, R.A. 2004. Control of pancreas and liver gene expression by HNF transcription factors. Science. 303:1378-81. Offield, M.F., Jetton, T.L., Labosky, P.A., Ray, M., Stein, R.W, Magnuson, M.A., Hogan, B.L., Wright, C.V. 1996. PDX-1 is required for pancreatic outgrowth and differentiation of the rostral duodenum. Development. 122: 983-95. Partis, M. D., Griffiths, D. G., Roberts, G. C., Beechey, R. B. 1983. Cross-linking of Multi Sub-unit Enzymes and Immobilization of Enzymes on Solid Supports J. Protein Chem. 2: 263. Pick, A., Clark, J., Kubstrup, C., Levisetti, M., Pugh, W., Bonner-weir, S., Polonsky, K.S. 1998. Role of apoptosis in failure of β cell mass compensation for insulin resistance and β cell defects in the male Zucker diabetic fatty rat. Diabetes. 47: 358-64. Pontoglio, M., Barra, J., Hadchouel, M., Doyen, A., Kress, C., Bach, J.P., Babinet, C., Yaniv, M. 1996. Hepatocyte nuclear factor 1 inactivation results in hepatic dysfunction, phenylketonuria, and renal Fanconi syndrome. Cell. 84: 575-85. Prado, C.L., Pugh-Bernard, A.E., Elghazi, L., Sosa-Pineda, B., Sussel, L. 2004. Ghrelin cells replace insulin producing β cells in two mouse models of pancreas development. Proc. Natl. Acad. Sci. USA. 101: 2924-9. Rane, S.G., Dubus, P., Mettus, R.V., Galbreath, E.J., Boden, G., Reddy, E.P., et al. (1999). Loss of Cdk4 expression causes insulin-deficient diabetes and Cdk4 activation results in beta-islet cell hyperplasia. Nature Genetics. 22, 44-52. Rey-Campos, J., Chouard, T., Yaniv, M., and Cereghini, S. 1991. vHNF1 is a homeoprotein that activates transcription and forms heterodimers with HNF1. EMBO J. 10: 1445–57. Richter, S., Shih, D.Q., Pearson, E.R., Wolfrum, C., Fajans, S.S., Hattersley, A.T., Stoffel, M. 2003. Regulation of apolipoprotein M gene expression by MODY3 gene hepatocyte nuclear factor-1alpha: haploinsufficiency is associated with reduced serum apolipoprotein M levels. Diabetes. 52: 2989-95.
102
Roccisana, J., Reddy, V., Vasavada, R.C., Gonzalez-Pertusa, J.A., Magnuson, M.A., Garcia-Ocana, A. 2005. Targeted inactivation of hepatocyte growth factor receptor c-met in beta-cells leads to defective insulin secretion and GLUT-2 downregulation without alteration of beta-cell mass. Diabetes. 54: 2090-102. Sahin, U., Weskamp, G., Kelly, K., Zhou, H.M., Higashiyama, S., Peschon, J., Hartmann, D., Saftig, P., Blobel, C.P. 2004. Distinct roles for ADAM10 and ADAM17 in ectodomain shedding of six EGFR ligands. J. Cell Biol. 164: 769-79. Sander, M., Neubuser, A., Kalamaras, J., Ee, H.C., Martin, G.R., German, M.S. 1997. Genetic analysis reveals that PAX6 is required for normal transcription of pancreatic hormone genes and islet development. Genes Dev. 11: 1662-73. Sander, M., Sussel, L., Conners, J., Scheel, D., Kalamaras, J., Dela Cruz, F., Schwitzgebel, V., Hayes-Jordan, A., German, M. 2000. Homeobox gene Nkx6.1 lies downstream of Nkx2.2 in the major pathway of beta-cell formation in the pancreas. Development. 127: 5533-40. Scaglia, L., Smith, F.E., Bonner-Weir, S. 1995. Apoptosis contributes to the involution of beta cell mass in the post partum rat pancreas. Endocrinology. 136: 5461-8. Schlondorff, J. and Blobel, C.P. 1999. Metalloprotease-disintegrins: modular proteins capable of promoting cell-cell interactions and triggering signals by protein-ectodomain shedding. J. Cell Sci. 112: 3603-17. Sherr, C.J. 2000. The Pezcoller lecture: Cancer cell cycles revisited. Cancer Research. 60: 3689-95. Shih, D.Q., Bussen, M., Sehayek, E., Ananthanarayanan, M., Shneider, B.L., Suchy, F.J., Shefer, S., Bollileni, J.S., Gonzalez, F.J., Breslow, J.L., Stoffel, M. 2001a. Hepatocyte nuclear factor-1alpha is an essential regulator of bile acid and plasma cholesterol metabolism. Nat. Genet. 27:375-382. Shih, D.Q., Screenan, S., Munoz, K.N., Philipson, L., Pontoglio, M., Yaniv, M., Polonsky, K.S., Stoffel, M. 2001b. Loss of HNF-1alpha function in mice leads to abnormal expression of genes involved in pancreatic islet development and metabolism. Diabetes. 50: 2472-80.
103
Shih, D.Q., Stoffel, M. 2002. Molecular etiologies of MODY and other early-onset forms of diabetes. Curr. Diab. Rep. 2: 125-34. Shimomura, I., Hammer, R.E., Richardson, J.A., Ikemoto, S., Bashmakov, Y., Goldstein, J.L., Brown, M.S. 1998. Insulin resistance and diabetes mellitus in transgenic mice expressing nuclear SREBP-1c in adipose tissue: model for congenital generalized lipodystrophy. Genes Dev. 12: 3182-94. Slack, J.M.W. 1995. Developmental biology of the pancreas. Development. 121:1569-80. Sosa-Pineda, B., Chowdhury, K., Torres, M., Oliver, G., Gruss, P. 1997. The Pax4 gene is essential for differentiation of insulin-producing beta cells in the mammalian pancreas. Nature. 386: 399-402. Steiner, D.F. 1998. The proprotein convertases. Curr. Opin. Chem. Biol. 2: 31-9. Stoffel, M. and Duncan, S.A. 1997. The maturity-onset diabetes of the young (MODY1) transcription factor HNF4alpha regulates expression of genes required for glucose transport and metabolism. Proc. Natl. Acad. Sci. USA. 94:13209-14. Stoffers, D.A., Zinkin, N.T., Stanojevic, V., Clarke, W.L., Habener, J.F. 1997. Pancreatic agenesis attributable to a single nucleotide deletion in the human IPF1 gene coding sequence. Nat. Genet. 15: 106-10. Stoffers, D.A., Ferrer, J., Clarke, W.L., Habener, J.F. 1997b. Early-onset type-II diabetes mellitus (MODY4) linked to IPF1. Nat. Genet. 17:138-9. Stoffers, D.A., Stanojevic, V., Habener, J.F. 1998. Insulin promoter factor-1 gene mutation linked to early-onset type 2 diabetes mellitus directs expression of a dominant negative isoprotein. J. Clin. Invest. 102:232-41. Stride, A., Ellard, S., Clark, P., Shakespeare, L., Salzmann, M., Shepherd, M., Hattersley, A.T. 2005. Beta-cell dysfunction, insulin sensitivity, and glycosuria precede diabetes in hepatocyte nuclear factor-1alpha mutation carriers. Diabetes Care. 28: 1751-6.
104
Surmely, J.F., Guenat, E., Philippe, J., Dussoix, P., Schneiter, P., Temler, E., Vaxillaire, M., Froguel, P., Jequier, E., Tappy, L. 1998. Glucose utilization and production in patients with maturity-onset diabetes of the young caused by a mutation of the hepatocyte nuclear factor-1alpha gene. Diabetes. 47: 1459-63. Susini, S., Roche, E., Prentki, M., Schlegel, W. 1998. Glucose and glucoincretin peptides synergize to induce c-fos, c-jun, junB, zif-268, and nur-77 gene expression in pancreatic beta(INS-1) cells. FASEB J. 12: 1173-82. Sussel, L., Kalamaras, J., Hartigan-O'Connor, D.J., Meneses, J.J., Pedersen, R.A., Rubenstein, J.L., German, M.S. 1998. Mice lacking the homeodomain transcription factor Nkx2.2 have diabetes due to arrested differentiation of pancreatic beta cells. Development. 125: 2213-21. Svenstrup, K., Skau, M., Pakkenberg, B., Buschard, K., Bock, T. 2002. Postnatal development of β cells in rats. Proposed explanatory model. APMIS 110; 372-8. Tomita, T., Doull, V., Pollock, H.G. Krizsan, D. 1992. Pancreatic islets of obese hyperglycemic mice (ob/ob). Pancreas. 7: 367-75. Topp, B.G., McArthur, M.D., Finegood, D.T. 2004. Metabolic adaptations to chronic glucose infusion in rats. Diabetologia. 47: 1602-10. Turner, A.J., Hooper, N.M. 2002. The angiotensin-converting enzyme gene family: genomics and pharmacology. Trends Pharmacol. Sci. 23: 177-83. Waechter, C.J., Lennarz, W.J. 1976. The role of polyprenol-linked sugars in glycoprotein synthesis. Annu. Rev. Biochem. 45: 95-112. Wang, H., Maechler, P., Hagenfeldt, K.A., Wollheim, C.B. 1998. Dominant-negative suppression of HNF-1alpha function results in defective insulin gene transcription and impaired metabolism-secretion coupling in a pancreatic beta-cell line. EMBO J. 17: 6701-13. Wang, H., Antinozzi, P.A., Hagenfeldt, K.A., Maechler, P., Wollheim, C.B. 2000. Molecular targets of a human HNF1 alpha mutation responsible for pancreatic beta-cell dysfunction. EMBO J. 19: 4257-64.
105
Wang, L., Coffinier, C., Thomas, M.K., Gresh, L., Eddu, G., Manor, T., Levitsky, L.L., Yaniv, M., Rhoads, D.B. 2004. Selective deletion of the Hnf1beta (MODY5) gene in beta-cells leads to altered gene expression and defective insulin release. Endocrinology. 145: 3941-9. Wang, Q., Li, L., Xu, E., Wong, V., Rhodes, C., Brubaker, P.L. 2004. Glucagon-like peptide-1 regulates proliferation and apoptosis via activation of protein kinase B in pancreatic INS-1 beta cells. Diabetologia. 47: 478-87. White, M.F. 2002. IRS proteins and the common path to diabetes. Am J Physiol Endocrinol Metab. 283: E413-22. Wiedenmann, B., Rehm, H., Knierim, M., Becker, C.M. 1988. Fractionation of synaptophysin- containing vesicles from rat brain and cultured PC12 pheochromocytoma cells. FEBS Lett. 240: 71-77. Wilson, M.E., Scheel, D., german, M.S. 2003. Gene expression cascades in pancreatic development. Mech. Dev. 120: 65-80. Withers, D.J., Gutierrez, J.S., Towery, H., Burks, D.J., Ren, J.M., Previs, S., Zhang, J., Bernal, D., Pons, S., Shulman, G.I. et al. 1998. Disruption of IRS-2 causes type 2 diabetes in mice. Nature. 391: 900-4. Wobser, H., Dussmann, H., Kogel, D., Wang, H., Reimertz, C., Wollheim, C.B., Byrne, M.M., Prehn, J.H. 2002. Dominant-negative suppression of HNF-1 alpha results in mitochondrial dysfunction, INS-1 cell apoptosis, and increased sensitivity to ceramide-, but not to high glucose-induced cell death. J. Biol. Chem. 277: 6413-21. Yamagata, K., Yang, Q., Yamamoto, K., Iwahashi, H., Miyagawa, J., Okita, K., Yoshiuchi, I., Miyazaki, J., Noguchi, T., Nakajima, H., Namba, M., Hanafusa, T., Matsuzawa, Y. 1998. Mutation P291fsinsC in the transcription factor hepatocyte nuclear factor-1alpha is dominant negative. Diabetes. 47: 1231-5. Yamagata, K., Nammo, T., Moriwaki, M., Ihara, A., Iizuka, K., Yang, Q., Satoh, T., Li, M., Uenaka, R., Okita, K., Iwahashi, H., Zhu, Q., Cao, Y., Imagawa, A., Tochino, Y., Hanafusa, T., Miyagawa, J., Matsuzawa, Y. 2002. Overexpression of dominant-negative mutant hepatocyte nuclear fctor-1 alpha in pancreatic beta-cells causes abnormal islet architecture with decreased expression of E-cadherin, reduced beta-cell proliferation, and diabetes. Diabetes. 51: 114-23.
106
Yang, Q., Yamagata, K., Fukui, K., Cao, Y., Nammo, T., Iwahashi, H., Wang, H., Matsumura, I., Hanafusa, T., Bucala, R., Wollheim, C.B., Miyagawa, J., Matsuzawa, Y. 2002. Hepatocyte nuclear factor-1alpha modulates pancreatic beta-cell growth by regulating the expression of insulin-like growth factor-1 in INS-1 cells. Diabetes. 51: 1785-92. Zimmet, P., Alberti, K.G., Shaw, J. 2001. Global and societal implications of the diabetes epidemic. Nature. 414: 782-7. Zhang, H., Wada, J., Hida, K., Tsuchiyama, Y., Hiragushi, K., Shikata, K., Wang, H., Lin, S., Kanwar, Y.S., Makino, H. 2001. Collectrin, a collecting duct-specific transmembrane glycoprotein, is a novel homolog of ACE2 and is developmentally regulated in embryonic kidneys. J. Biol. Chem. 276: 17132-9. Zhang, X., Gaspard, J.P., Mizukami, Y., Li, J., Graeme-Cook, F., Chung, D.C. 2005. Overexpression of cyclin D1 in pancreatic β cells in vivo results in islet hyperplasia without hypoglycemia. Diabetes. 54: 712-9.