Embed Size (px)
Citation preview

To: Gulf Coast Workforce Board Members From: Mike Temple Carol Kimmick David Baggerly Michelle Ramirez Date: July 27, 2015 Subj: Board Meeting Materials for Tuesday, August 4, 2015 The next meeting of the Gulf Coast Workforce Board is scheduled for 10:00 a.m., Tuesday, August 4, 2015 in H-GAC’s second floor conference rooms A, B and C, 3555 Timmons Lane, Houston. Reports. Chair Guthrie will provide an update to members on items of interest. Audit/Monitoring Committee Chair Joe Garcia will report on the committee’s July meeting which included a summary of yearly trends from quality assurance monitoring. Committee Chair Gerald Andrews will provide information on the Employer Service Committee’s last meeting. Action. Early Education Chair Bobbie Henderson will provide an update for members on changes to the Texas Rising Star quality rating system for early education providers, including a recommendation for possible action on increasing reimbursement rates for these providers. Dr. Henderson will also present the Procurement Committee’s recommendations for funding 2016 Workforce Solutions and Adult Education Consortium contracts. Information. David Baggerly will report on our performance to-date, and we will report as usual on the Board’s expenditures against its budget. Ron Borski will brief us on developments in the economy and also the next installment of our series on key regional industries. This month we will take an in-depth look at regional employment in the health care industry. We look forward to seeing you on August 4th. As always, please call or email us if you have questions, or if we can be of assistance.

Tuesday, August 4, 2015 at 10:00 a.m. H-GAC Conference Room A/ B/C
3555 Timmons Lane, Second Floor, Houston, Texas 77027
1.
Call to Order and Determine Quorum
2.
Adopt Agenda
3.
Hear Public Comment
4.
Review June 2015 meeting minutes
5.
Declare Conflicts of Interest
6. a. Chair’s Report. The Board Chair will discuss items of interest. Consider Reports
b. Audit/Monitoring. The Committee Chair will present an update from the committee’s July 2015 review of annual trends.
c. Employer Service. The Committee Chair will provide an update from the committee’s July 2015 meeting.
7.
a. Early Care and Education. The Committee Chair will present information and recommendation for possible action to increase reimbursement rates for early education providers that have achieved Texas Rising Star certification.
Take Action
b. Procurement. The Committee Vice Chair will present recommendations to fund 2016 Workforce Solutions and adult education consortium contracts for system operations in total amount not to exceed $196,471,200.
8.
a. System Performance. Report on current performance. Receive Information
b. Expenditures. Report on expenditures.
9. Report on current economic data and trends in the Houston-Gulf Coast area, including a briefing on employment in the region’s health care industry.
Look at the Economy
10.
Take Up Other Business
11.
Adjourn
Workforce Solutions is an equal opportunity employer/program.
Auxiliary aids and services are available upon request to individuals with disabilities. Please contact H-GAC at 713.627.3200 at least 48 hours in advance to request accommodations.
Deaf, hard-of-hearing or speech-impaired customers may contact: Relay Texas 1-800-735-2989 (TTY) or 711 (Voice).
Equal opportunity is the law.
The
Gul
f Coa
st W
orkf
orce
Boa
rd
Tent
ativ
e A
gend
a

MINUTES OF THE GULF COAST WORKFORCE BOARD
TUESDAY, JUNE 2, 2015 _________________________________________________________________
MEMBERS PRESENT:
Ray Aguilar Willie Alexander Karlos Allen Gerald Andrews Betty Baitland Sara Bouse Carl Bowles Joe Garcia Cheryl Guido Mark Guthrie John Hebert Bobbie Henderson Guy Robert Jackson Sarah Janes Tony Jones David Joost Jeff Labroski Ray Laughter Kendrick McCleskey Steve Mechler Jerry Nevlud Linda O’Black Dale Pillow Allene Schmitt Richard Shaw Connie Smith Gil Staley Evelyn Timmins Shunta Williams Sarah Wrobleski
H-GAC STAFF MEMBERS PRESENT
Mike Temple David Baggerly Michelle Ramirez Ron Borski Parker Harvey Mr. Mark Guthrie, Chairman, called the meeting to order at approximately 10:00 a.m., on Tuesday, June 2, 2015, in the 2nd floor, H-GAC Conference Rooms A/B/C, at 3555 Timmons Lane, Houston, Texas. Chair Guthrie determined a quorum was present.
ADOPTION OF AGENDA
Chair Guthrie asked for adoption of the agenda as presented. A motion was made and seconded to adopt the agenda.
The motion carried and the agenda was adopted as presented.
PUBLIC COMMENT
No one signed up for public comment. MINUTES FROM APRIL 7, 2015 MEETING

Gulf Coast Workforce Board Minutes June 2, 2015 Page 2 of 16 Chair Guthrie explained that a single corrected page of the April 7, 2015 meeting minutes was handed out at the meeting. This page is intended to substitute the original minutes page number 13 of the April 7, 2015 meeting included in the current version of the Board packet – to make a typographical correction. Chair Guthrie asked for a motion to approve the corrected minutes for the April 7, 2015 Board meeting. A motion was made and seconded to approve the corrected minutes as presented. Chair Guthrie called for discussion or further corrections. The motion carried and the corrected minutes of the April 7, 2015 meeting were approved. DECLARE CONFLICTS OF INTEREST Chair Guthrie asked for a declaration of any conflicts of interest with items on the agenda. No one declared a conflict. Chair Guthrie reminded the members that they also were welcome to declare conflicts with items as they are considered. CONSIDER REPORTS Chair’s Report Chair Guthrie explained that he was happy to report SB 208 was passed in both the House and the Senate during the last few days of the session. This bill reauthorizes the Texas Workforce Commission (TWC), but it also transfers Vocational Rehabilitation program from the Texas Department of Assistive and Rehabilitation Services (DARS) to TWC. Chair Guthrie noted that Board member Mr. Guy Robert Jackson provided resource testimony on the bill before both the House and the Senate Committees and commended his efforts in that regard. Chair Guthrie stated that at the April 2015 board meeting he announced that he wanted to implement a pilot project to station a couple of vocational rehabilitation counselors in a career office to help guide us on how best to combine operations of the career offices with the operations of the vocational rehabilitation counselors. Chair Guthrie explained that the DARS management in Austin declined to authorize this project while SB 208 was pending. Chair Guthrie said that efforts will resume for approval and implementation of the pilot project once SB 208 becomes law. Chair Guthrie reported that he and Mr. Mike Temple attended the Texas Association of Workforce Boards (TAWB) meeting in Austin on May 3 and May 4, 2015. He noted there was not much to report from the meeting; except that Mr. Mike Temple was expected to be elected the new President of the Executive Directors Council of TAWB starting in August 2015. This will entail leading the group of the 28 local board Executive Directors that are a part of the TAWB organization. Chair Guthrie explained that on May 28, 2015 he attended a business symposium sponsored by the Greater Houston Business Leadership Network (GHBLN). This organization is composed primarily of private employers with the goals of increasing employment of persons with disabilities and removing barriers to that employment. Chair

Gulf Coast Workforce Board Minutes June 2, 2015 Page 3 of 16 Guthrie asked Ms. Cheryl Guido, who is Vice Chair of the local chapter of the organization to give a brief overview of the meeting. Ms. Guido noted that GHBLN is a business to business organization for the advancement of people with disabilities. The group’s goal is to speak with other businesses regarding the benefits and best practices of hiring people with disabilities. The symposium hosted approximately 54 employers and 200 people at the May meeting - Workforce Solutions and our Employer Services Division partnered with the group for this meeting. Ms. Guido noted that Houston is currently the only affiliate organization, but plans are underway for Austin and Dallas to join. Chair Guthrie reported that Mr. Michael Gutierrez, Regional Manager of our Employer Services Division gave an impressive presentation on Workforce Solutions at the symposium. Chair Guthrie explained that there have been proposed regulations issued to implement the Workforce Innovation Opportunity Act (WIOA), which is the reauthorization of the Workforce Investment Act of 1998 (WIA) and that there is an ongoing comment period for the proposed regulations. The comment period on the regulations will expire on June 15, 2015. Chair Guthrie asked if anyone had any interest in commenting on the proposed regulations to please submit their comments by the June 15th
deadline.
Chair Guthrie welcomed new Board member Mr. Peter Beard and asked him to introduce himself. Chair Guthrie concluded his report and no action was taken. Audit/Monitoring Committee Report Chair Joe Garcia reported that the committee met on Wednesday, May 20, 2015 and received an update on recent staff audit and monitoring activity. Chair Garcia explained that since the last report, the regional Quality Assurance (QA) team conducted eleven office reviews and issued six reports. A number of other observations which Chair Garcia reported on are as follows: Neighborhood Centers, Inc.
Northshore rated as average. The QA team saw good customer service, but some wait time issues. This office has had staff turnover and could benefit from having 1 -2 more staff who are bilingual. Lake Jackson rated as above average. The QA team noted good service during our scheduled visit and outstanding team work. There are some “wear and tear” related accessibility repairs needed.
Interfaith of The Woodlands

Gulf Coast Workforce Board Minutes June 2, 2015 Page 4 of 16
Bay City rated average. The customer service was better when the team was in the office than what the secret shopper observed. There were some cash substitute record keeping issues and accessibility wear and tear needed repairs. Huntsville rated below average with inconsistent and unacceptable customer service issues. There were cash substitute data errors, PII concerns and accessibility issues needing attention. Interfaith has replaced the manager. Waller was above average. Staff provided good customer service and teamwork.
Willowbrook rated average. Once again, the QA team saw better customer service when the team presence was known than during the secret shop. The QA team found minor PII and cash substitute data concerns.
• The QA team continues to review the system to determine how well it is
protecting customer information. The QA team did a sweep this time to hit the offices that were not monitored during this period. Four of 15 visits had infractions, 1 from Interfaith and 4 from NCI. Three of the errors were found in staff unlocked and unattended desk drawers and the other issue was a W-2 on the floor.
• Results of the QA team visits to vendors in the network from October through
December 2014 are shown below. Note that visits are counted starting on October 1st
to coincide with the start of the board’s fiscal year.
Active vendors 2,097 Active vendors with referrals 1,495 Vendors with fewer than five children
enrolled 1,129
Vendors visited 10/1/14 to 2/28/15 939
Two Service Improvement Plans were issued since the last report. Two facilities were holding parent’s swipe cards.
• The QA team completed the second review of customer records to ensure staff are opening and closing appropriate services in a timely manner. The QA team also reviewed the quality of staff provided services that help the customer reach their goal. Minimal errors were found.
• The QA team is currently looking at offices, youth projects, the early education
quality improvement effort, non-custodial parent program and Adult Education Literacy contractors.
Financial Monitoring

Gulf Coast Workforce Board Minutes June 2, 2015 Page 5 of 16 Dynamic Educational Systems, Inc. (DESI) -- Update
• DESI satisfactorily resolved all of the financial monitoring concerns. Employment and Training Centers
• One item was found out of compliance with system policies and procedures. It was determined it was due to staff oversight and was corrected immediately.
NCI – Financial Aid Payment Review
• NCI Career office records were monitored for: Scholarship Payments, Work Support Payments, Cash Substitutes and Cash Substitute Reconciliations. The bulk of the concerns are customer record keeping errors. There are questioned costs of $169.56. Board staff is currently working through NCI’s response.
Other Texas Workforce Commission
• Board staff submitted a response to the Audit Resolution Manager for last year’s TWC visit. After the initial response, the audit resolution department usually asks for more details.
• Board staff submitted the document request for the upcoming TWC annual visit
that will begin June 15, 2015. Chair Garcia concluded his report and no action was taken. Government Relations Committee Report – Legislative Update Chair Guy Robert Jackson reported there was notable progress on several items in the Legislature since the April 2015 Board meeting and gave update on bills in which the Board had an interest. SB 208 Texas Workforce Commission continuation and functions In addition to reauthorizing the Workforce Commission, this legislation transfers the responsibility for vocational rehabilitation services from the Texas Department of Assistive and Rehabilitative Services (DARS) to the Workforce Commission which will mean additional responsibilities for the Board. SB 200 Texas Health and Human Services Commission continuation and functions This legislation would eliminate the Departments of Aging and Disability Services, Assistive and Rehabilitative Services, State Health Services, and Family and Protective Services as separate agencies, merging their functions into a newly constituted Health and Human Services Commission. In the case of DARS, only a few remaining functions would be merged into the new structure, as its largest functions-vocational rehabilitation

Gulf Coast Workforce Board Minutes June 2, 2015 Page 6 of 16 and federal disability determination would transfer to the Workforce Commission. The timeline for completing the merger, especially relating to State Health Services and Family and Protective Services, could extend through 2019. HB 4 Publicly Funded Pre-K Of the Pre-K bills being tracked, HB 4 is the only bill that has made any substantial movement in the legislature to date. HB 4, passed by both the House and the Senate, provides an estimated $130 million in additional state funding for school districts and open-enrollment charter schools that agree to adopt a number of policies including regular teacher training, limits on class size and certain curriculum standards in their pre-kindergarten programs, as well as a parent engagement plan. A pre-kindergarten program implemented under this bill may operate on a full-day basis. Chair Jackson noted the next big item for the Government Relations Committee is to deliver the Board’s newest Report Card to the government officials that appoint our Board members and report the Board’s good efforts. Ms. Guido thanked Chair Jackson and the Board for their efforts and support on SB 208. Chair Guthrie also noted on SB 208 that many efforts were made to get the Blind Children’s program moved over as part of the transfer of the Vocational Rehabilitation program. He reported that the Chair of the Finance Committee of the Senate was very opposed to the move. Chair Guthrie stated that he was disappointed that this program was left behind, but there is always hope with the next session. Mr. Tony Jones announced that Ms. Norma Crosby, President of the National Federation of the Blind of Texas (NFB) who also attended the testimony presented by Chair Jackson on SB 200 also wanted to commend him on a great presentation. Mr. Jones also explained that the NFB was happy that the Vocational Rehabilitation was moving under TWC, because the bottom line is that people want to work. Chair Jackson concluded his report and no action was taken. Career Office Chair Karlos Allen stated that our contractors regularly identify staff members they believe best exhibit the I AM Workforce Solutions principles of excellent customer service. The Regional Management Team (RMT) comprised of Board staff and contractor management reviews the nominations and selects one or more individuals for recognition. The RMT selected the following individuals to receive the I AM Workforce Solutions Awards:
Anita Edens, Business Service Representative

Gulf Coast Workforce Board Minutes June 2, 2015 Page 7 of 16
Employer Service Anita works with employers to create quality job postings, which accurately reflects the employer’s needs to attract qualified candidates. She uses her remarkable customer service skills to go beyond by helping employers navigate the complexities of labor laws and remain in compliance with foreign labor certification requirements. She has received a number of compliments and commendations from employers, attorneys and Workforce Solutions staff regarding her outstanding service.
Lisa McCoy, Performance & Training Consultant National Workforce Institute As a trainer, Lisa provides professional development services for Workforce Solutions staff. She provides training in traditional classroom settings, as well as alternative training methods to better support the system and meet individual staff and office needs. Lisa participates in several workgroups, provides customized training and development for career offices and units, and helps align new projects and systems with the Workforce Solutions operational model.
Nicole Quintero, Office Manager Workforce Solutions - Willowbrook Providing quality service and helping customers find employment is paramount to Nicole’s work as an office manager. Nicole consistently works to develop and support her team, so they understand and apply the I AM Workforce Solutions principles with every customer, every time. Nicole uses her management experience and spirit of service to support the larger workforce system on a variety of projects. Her work on assisting to streamline the scholarship process and supporting colleges on special training initiatives has helped to bridge significant gaps throughout our system.
Anita Edens, Lisa McCoy and Nicole Quintero are Workforce Solutions Chair Allen concluded his report and no action was taken. TAKE ACTION
a. Employer Services. The Committee Chair will report on the committee’s recent meeting and recommend updates to the Board’s key industries and high-skill, high growth occupations lists.
Chair Gerald Andrews reported that the Employer Services Committee met on April 14, 2015 and reviewed updates of the three supporting lists: Targeted Industries, High-Skill, High-Growth Occupations and Where the Jobs Are. These lists are used as guides not only for the Board’s strategic investments, but also to help customers build careers in

Gulf Coast Workforce Board Minutes June 2, 2015 Page 8 of 16 industries and occupations with good prospects and higher wages. The High-Skill, High-Growth list is used to decide which occupations the Board will support with education scholarship funds. Chair Andrews noted that staff would bring periodic updates of the lists to the Committee and Board as circumstances warrant. The following information reflects updates to each of the three lists. Targeted Industries The committee initially looked at labor market data which included employment and wage data along with projections for the 10-year period from 2012 to 2022. Next the committee looked for industries that fit the following criteria:
1. Industries with a projected employment growth rate equal to or greater than the average growth rate for all industries in the region for the period 2012 to 2022 (>23.8%)
2. Industries having a projected employment growth of at least 5,000 new jobs
from 2012 to 2022 (an average of 500 jobs per year)
3. Industries with an average weekly wage of at least $954 per week.
In addition to industries meeting the above criteria, the targeted list also included: Oil and Natural Gas Extraction and Manufacturing. There are several different groups of employers within this larger sector and because of the importance of these employers to the area economy and gross regional product, we have created the sector and added it to our list. There has been significant interest from a number of employers in this sector regarding current and projected skills shortages. The Board has been working for several years with the large oil and gas companies, oilfield service firms, refiners and petrochemical manufacturers on a variety of workforce needs. The proposed updated list for the Board’s Target Industries was listed in the Board packet and listed below are the changes: Additions: 5413 Architectural, Engineering and Related Services 3329 Other Fabricated Metal Product Manufacturing 3251 Basic Chemical Manufacturing Removed: 6113 Colleges and Universities 6223 Specialty Hospitals High-Skill, High-Growth Occupations The high-skill, high-growth list is made up of larger, high-skill, well-paying occupations critical to the Gulf Coast region’s economic future. They offer the best job opportunities to area residents now and will likely continue doing so over the next 10 to 15 years. These occupations are found in many industries in the region, not just those on the targeted industries list.

Gulf Coast Workforce Board Minutes June 2, 2015 Page 9 of 16 Qualifying Criteria Occupations must meet the following criteria to be included on the high-skill, high-growth occupations list. They must have:
projected employment for 2022 equal to or greater than the average for all occupations in the region (4,796)
projected employment growth rate equal to or greater than the average growth rate for all industries in the region (23.8 %)
minimum education requirements of a post-secondary certificate or degree, long-term on-the-job training, or work experience in a related occupation
median hourly wages equal to or greater than the median for all occupations in the region ($17.26 per hour)
Scholarship Occupations Students preparing for employment in occupations on the list that meet two of the following three criteria are eligible for, but not guaranteed scholarships from Workforce Solutions or one of its partners. To qualify, two of the three following statements must be true. The occupation must be:
with chronic shortages of qualified workers to fill existing or projected job openings;
where the number of workers expected to graduate from the requisite education or training programs falls significantly below the number of job openings;
employment is over represented in the targeted industries relative to all industries in the region.
The Scholarship Occupations list is a subset of the High-Skill, High-Growth list with those occupations currently in demand in our target industries. Modifying the List An employer or group of employers with a demand for skilled workers can ask us at any time to modify our list. We will discuss with employers their shortage occupations, expected numbers of hires, wages and training requirements. We also use our Employer Services sales and marketing staff and any updates to publish labor market data to check on new or emerging shortage occupations that might be added to our list. The updated High-Skill, High-Growth Occupations list and the Occupations Supported by Scholarship are both in the Board packet. Where the Jobs Are We use the “Where the Jobs Are” list to identify those occupations that are growing. We don’t use wage or other kinds of criteria to refine the list; it consists entirely of those jobs in which we expect to see openings over the next 10 years. Occupations on this list are those with projected annual average job openings equal to or greater than 170 per year.

Gulf Coast Workforce Board Minutes June 2, 2015 Page 10 of 16 Chair Guthrie mentioned that he has personally found the “Where the Jobs Are” document helpful when counseling youth regarding career paths. A motion was made and seconded to adopt the updated Targeted Industries; High-Skill, High Growth Occupations; Occupations Supported by Scholarship; and Where the Jobs Are to better focus available workforce resources in the region. The motion carried. Chair Andrews also noted that TWC has provided Boards throughout the state additional funds to augment industry recognized certifications in High-Skills, High-Growth Occupations and Gulf Coast has received approximately $300,000. Based on employer requests, staff has investigated the need for a center or centers for skills certification in the construction industry on the west side of the region. Currently employers and workers use locations near the Ship Channel and petrochemical complex. Chair Andrews reported that a need is noted for alternative teacher certification programs on the west side.
• Staff has talked with representatives from Bechtel, Toshiba, and National Oilwell Varco; and focus groups of employers which were brought together by the Katy Economic Development Council and the Houston Northwest Chamber of Commerce; along with Board members Ms. Toy Wood (Greater Houston Builders Association) and Mr. Joe Garcia (Mark III Ltd).
• Staff has also talked with representatives of the Spring Branch, Katy, and Alief
ISDs, and Houston Community College and Lone Star College.
As a result of these conversations, staff proposed working with the two community college systems to establish centers, primarily for National Center for Construction Education and Research (NCCER) certifications in the trades. NCCER certifications are widely accepted throughout the construction industry. Staff will continue to work to finalizing a location or locations for the construction industry and alternative teacher certification centers. A progress report and expected targets for the number of individuals expected to be certified will be presented in the future. Several Board members had questions or comments and discussion followed. Chair Andrews concluded his report and no further action was taken.
b. Ratify previous actions. Ratify action from the February 2015 and April 2015 Board meeting.
Chair Guthrie advised that over the past several months elected officials have been in the process of reappointing Board members. This has resulted in two meetings in which the Board was technically out of compliance with membership requirements.

Gulf Coast Workforce Board Minutes June 2, 2015 Page 11 of 16 To ensure that all Board actions are appropriately approved, staff requested that the Board ratify actions taken by the Board at the February and April 2015 meetings. Those actions were: February 3, 2015
a. Early Education & Care. The Committee Chair will report on recommendations to increase maximum reimbursement rates for infant and toddler care.
A motion was made and authorized to increase the Board’s maximum published rates for early education payments to regulated providers for infant and toddler care as shown in the chart above. The motion carried.
b. Career Office. The Committee Chair will provide information from the
committee’s most recent meeting and report on a recommendation to change financial aid eligibility for customers who are dislocated from employment.
A motion was made and seconded to amend financial aid eligibility rules to discontinue the requirement that customers classified as dislocated workers contribute toward the cost of financial aid provided by Workforce Solutions. The motioned carried.
c. Nominating. The Committee Chair will present nominations for Board officers in 2015.
A motion was made and seconded for nominations to cease and the following officers be elected by acclamation – Mark Guthrie – Chairman, Gerald Andrews -Vice Chairman, Joe Garcia– Vice Chairman and Willie Alexander – Vice Chairman. The motion carried. Mr. Willie Alexander abstained from voting
April 7, 2015
a. Budget. The Committee Chair will report on recommendations for the Board’s 2015 budget of $201,905,098.
A Motion was made and seconded to approve the proposed 2015 Board budget in the amount of $201,095,018. The motion carried. Later in the meeting, Budget Chair, Willie Alexander announced that a Board member noted a difference in the amount between the 2015 budget amount approved earlier in the meeting and the budget number listed on page 4 of the board item #7. It was noted that the earlier approved budget amount was incorrect and the correct budget amount should be $201,905,098. A motion was made and seconded to withdraw the earlier budget approval and to approve the corrected 2015 budget amount of $201,905,098. The motion carried and the budget was approved as presented in the amount of $201,905,098. A motion was made and seconded to ratify the actions taken by the Board in February and April 2015, as listed above. The motion carried. Chair Guthrie concluded his report and no further action was taken.

Gulf Coast Workforce Board Minutes June 2, 2015 Page 12 of 16
RECEIVE INFORMATION System Performance Mr. David Baggerly reviewed the Year End System Performance measures for October 2014 through April 2015. These measures gauge progress toward meeting the results set out in the Board’s strategic plan. There are two sets of measures: one for the entire regional workforce system and one for the Board’s operating affiliate, Workforce Solutions. For Workforce Solutions More Competitive Employers – Employers Receiving Services (Market Share) – we expected to provide services to 25,452 employers this year which is almost 18% of the 144,799 employers identified for the Gulf Coast area. We provided services to 21,616 employers through April 2015. Employer Loyalty – our performance indicates our employer customers value our services and return to us for additional services. Of a possible 22,719 employers, 12,554 returned to The Workforce Solutions for additional services through April 2015. More and Better Jobs – New jobs created – This information is captured quarterly and reflects a two year average. Customers employed by the 1st
quarter after exit – Reporting for the quarter ending June 2014, 170,487 of the 220,580 customers who exited from services were employed by the quarter after exit.
Higher Real Incomes – Exiters with Earnings Gains of at least 20% - Reporting for the quarter ending December 2013, 80,302 of the 239,358 customers who exited had earnings gains of at least 20%. A Better Educated and Skilled Workforce – Customers pursuing education diploma, degree or certificate who achieve one - Reporting for the quarter ending December 2014, 1,546 customers pursuing an education diploma, degree or certificate exited in the period July – December 2014. 638 achieved a diploma, degree or certificate by the quarter after exit. In addition to the Board’s measures, Workforce Solutions works to meet the state’s expectations for performance on indicators related to the money we received from the Texas Workforce Commission. For the performance year that began October 1, 2014, the state reports we are meeting or exceeding the target for nine of the ten measures. The measure we are not meeting is:

Gulf Coast Workforce Board Minutes June 2, 2015 Page 13 of 16
• Total Education Achievement. The target for this measure is 80.9%. Our performance in the first three quarters (10/13 – 6/14) was 73.8%. The Board is working with contractor to improve services to help customers attain their educational goal.
We also have twenty-four new Adult Basic Education and Literacy measures.
• There are eleven measures pertaining to the improvement of education levels. We are meeting seven of these measures. Of the four measures we are not meeting, customers tested at the levels described below and did not improve their skills sufficiently after a scheduled post-test –
o English as a Second Language – Low o English as a Second Language – High o Advanced English as a Second Language o Adult Secondary Education
• There are nine separate enrollment targets. We plan to provide Adult Education and Literacy services to 25,540 customers. We’ve recorded 18,860 customers receiving services. We are meeting five of these measures. These are the four enrollment targets we are not meeting:
o Total Students participating 12 hours or more o Total Students o Target for students receiving Temporary Assistance for Needy Families
and participating 12 hours or more o Target for students receiving Temporary Assistance for Needy Families
• There are four long-term measures regarding the outcomes of customers who received services, including: attainment of a high school diploma or equivalent, entering post-secondary education and employment and retention. We only have data for the attainment of a high school diploma or equivalent and we are meeting this measure. Data for the other measures will not be available until October 2015.
Mr. Baggerly reported that we continue to work closely with our contractors to improve performance on all measures. Chair Guthrie followed up on his request from the April 2015 meeting asking staff to retrieve the prior TEA Adult Basic Education measures and actual results for the past few years to compare those to current Adult Basic Education measures and results. Mr. Baggerly explained that staff is working on obtaining the requested information and noted that he is working with the Texas Workforce Commission, but will also contact TEA and expects to have that information by the procurement meeting in July. Mr. Baggerly concluded his report and no action was taken. Expenditure Report

Gulf Coast Workforce Board Minutes June 2, 2015 Page 14 of 16 Mr. Mike Temple reviewed the Financial Status Report for four months ending April 30, 2015 and stated that everything is on target and looks good. Mr. Temple also noted that Financial Aid and Employer Services is running slightly ahead on straight line expenditures, but should not be a problem by the end of the year. Mr. Temple concluded his report and no action was taken. Information Item – Services to Long-Term Unemployed Individuals Update Ms. Michelle Ramirez reported that in February staff provided the Board with information about efforts to target service to long-term unemployed individuals. Unfortunately, two multi-day workshop sessions did not result in great success - only four people have found new jobs and interest remains low. Salary expectations and a reluctance to change occupations were the biggest challenges for customers. Ms. Ramirez explained that response to the content of the seminars was positive and seminars continue to be available to all customers through career offices and the Board website. Staff was recently challenged to recruit customers for alternative teacher certification training. With a growing demand for teachers, 17 school districts expressed great interest for candidates that successfully complete certification training. Using Work-In-Texas, 9,000 unemployed customers were indentified with at least a Bachelor’s degree. Ms. Ramirez advised that these 9,000 customers were then invited to attend an information session on alternative teacher certification training. Below are the results:
• 600 registered • 295 attended an information session • 166 applied for financial aid • 125 qualified for scholarship • 64 applied for admission to the certification program • 39 enrolled in the program to date
Ms. Ramirez stated that staff feels targeted recruiting for career opportunities is a more efficient process to connect long-term unemployed customers to available jobs. The next effort will focus on recruiting unemployed long-term customers for training that leads to certification in skilled trades for construction, where employer demand remains high. Several Board members had questions or comments and discussion followed. Ms. Ramirez concluded her report and no action was taken. LOOK AT THE ECONOMY Mr. Ron Borski explained that the Houston-The Woodlands-Sugar Land Metropolitan Statistical Area (H-W-S MSA) unemployment rate for April was 4.0%, which is a good unemployment rate. The state is also at a 4% unemployment rate, and the national
Gulf Coast Workforce Board Minutes June 2, 2015 Page 15 of 16 unemployment rate is at 5.1%. Mr. Borski noted that the economy appears to be slowing down in the region due to a weak demand in the energy sector. The pace of job growth in the H-W-S MSA dropped one-half of a percentage point to 2.4% in April. The 2.4% pace of job growth was the slowest for the H-W-S MSA since May 2011. Most major industry sectors reported slowing job growth and the healthiest over-the-year growth has been in Mining and logging, Construction, Educational and Health Services (private) and Leisure and Hospitality. Mr. Borski concluded his report and no action was taken. Workforce Demands in the Oil & Gas Industry- Upstream Manufacturing Mr. Parker Harvey provided a brief report on Upstream Manufacturing. This report is the second in a series providing an Overview on the state of the oil and gas industry including a look at immediate and long-term challenges. Mr. Harvey noted that it is widely known that the economy of the Gulf Coast Region is largely centered on the Energy industry with roughly half of all jobs tied to it in some way. A key industry critical to oil and gas production is Upstream Manufacturing. These different types of Manufacturing roughly correspond to the three major segments of the oil and gas industry:
• Upstream – the exploration, production, and extraction of oil and gas • Midstream – the transportation, storage, and wholesale marketing of crude or
refined petroleum products • Downstream – the oil and gas operations that take place after production and up to
the point of sale As of March 2015, Manufacturing in the Gulf Coast Region employed approximately 255,000 people, or roughly 9 percent of total employment. Houston registered its all-time high just recently in December of 2014 with nearly 259,000 jobs. This surpassed the previous peaks in mid-1997 and late-2008 by around 15,000 jobs. There is a strong likelihood that we have seen peak employment in Manufacturing for this economic cycle with possible steep declines in the latter half of 2015. Manufacturing in the Gulf Coast remains highly dependent on the oil and gas industry, particularly as a source of demand for extraction equipment and as a supplier of feedstock to produce various petroleum-based products. Mr. Harvey explained that the four Upstream Manufacturing sub-industries are:
• Metals • Machinery • Electrical Equipment • Petroleum Products, Chemicals, Plastics and Rubber
Gulf Coast Workforce Board Minutes June 2, 2015 Page 16 of 16 The four groups comprise nearly 70 percent of all Manufacturing employment in the Gulf Coast Region. Numerous other Manufacturing sub-industries with a less obvious connection to oil and gas are also likely to provide goods and service to this industry. Wages for the Upstream Manufacturing sector can provide above average wages to those with the right skills. At $1,671 per week, Upstream Manufacturing wages in the region were 24 percent above the average for all industries as of the fourth quarter 2014. Looking at the Subgroups, Machinery Manufacturing provides the highest weekly wage at $2,024 followed by Electrical Equipment at $1,705 and Metals at $1,422. Mr. Harvey mentioned that similar to the Construction and Mining sectors highlighted at previous meetings, the Upstream Manufacturing sector also faces the challenge of an aging workforce. The fastest growing age groups in the Gulf Coast are those between 55 to 64 and 65 and older with a very low percent of workers in 35-44 and 45-54 groups. This suggests a shortage of future senior talent in the coming years as the two oldest group’s transition from the workforce into retirement. Mr. Harvey concluded his report and no action was taken. OTHER BUSINESS Chair Guthrie noted that a memo inviting all Board members to participate in the upcoming Audit/Monitoring and Procurement meeting schedule for Monday, July 13, 2015 at 10:00 would be sent by staff. Anyone interested in participating in the meetings is welcome to attend. ADJOURN There was no further business to come before the Board, and Chair Guthrie adjourned the meeting at approximately 11:15 am.

Item 6b Page 1 of 2
Audit/Monitoring Committee Update for August 2015
The Audit/Monitoring Committee met on July 13, 2015 to review monitoring results from the year and to make any recommendations to the Procurement Committee about contract renewals. A summary of the information from the meeting follows. Trends
• We note an improvement in the quality assurance rankings for career offices.
o In 2015, eight offices rated Above Average, an increase of 100% from the four rated Above Average in 2014.
o Overall, 21 of the 24 offices rated Average or Above Average in 2015.
• The three offices initially rated Below Average this year have all improved operations. During our follow-up visits this summer, we rated the service in Baytown, Southwest, and Huntsville as Average – which means these offices offer acceptable service.
• Within the offices and operating units, we note significantly increased attention to the
security of customers’ personal information from previous years. Although we continue to note minor instances or issues with security during our visits, we believe our reviews show the system has reached an acceptable level of compliance.
• We note an improvement in several key elements of our records.
o We have seen a substantial improvement in timely opening and closing service records.
o In general, the quality of our applications in WorkInTexas has improved. o We have also seen an improvement in required elements for the Trade Adjustment
Assistance records. o We continue to see opportunities to improve counseling notes and documentation
surrounding entry into and exit from training. o We have also seen a need to improve documentation surrounding financial
aid/cash substitutes in the career offices, although we have not seen questioned costs related to this issue.
• We have not identified problems with eligibility.
• The Financial Aid Call Center has improved its processing time for financial aid
applications and reduced the level of customer complaints.

Item 6b Page 2 of 2
• The Financial Aid Payment Office has increased its visits to vendors, and we note only
minor instances of vendors maintaining automated attendance cards.
• Employer Service continues to provide an acceptable level of service.
• Financial reviews of contractors have not disclosed any serious issues.

Item 6c Page 1 of 1
Employer Service Committee Update for August 2015
Current Situations The Employer Service Committee met on Tuesday, July 8, 2015. Members in attendance included Gerald Andrews – chair, Jeff Labroski – vice-chair, Mark Guthrie – Board chair, Sara Bouse, Joe Garcia, Cheryl Guido, Guy Robert Jackson, Richard Shaw and Evelyn Timmons. Representatives from our Employer Service contractor, Employment & Training Centers, Inc. provided an overview of the strategic efforts used to serve employers in the Board’s targeted industries. Staff described the process for identifying employer companies and the tactics used to connect with human resources representatives. Additionally, contractor staff provided anecdotal examples of results from these efforts. A copy of the presentation as well as a staffing chart is included on the pages that follow. Board staff provided an update on activities related to the Greater Houston Partnership’s UpSkill Houston initiative. A summary is attached. The Committee had no items that required action.

1
Workforce Solutions EMPLOYER SERVICE DIVISION
Our ESD Vision • Make Workforce Solutions the first choice for employers
• Provide services to employers without requiring them to leave their office
• Continue to bring talent that does not traditionally use WFS system
• Support emerging markets and industries

2
How We Target Our Market Market Analysts research databases & perform analytics to identify employers on the Targeted Industries List with: ◦ 10 – 500 employees
◦ Revenues of $100,000 - $2,000,000
◦ Indicators reflecting recent hiring or lay-off activity
Business Consultants identify additional businesses in targeted industries through collaboration with:
◦ Economic Development Groups
◦ Industry Associations
◦ Public Community/Technical Colleges
◦ Chambers of Commerce
How We Outreach to Targeted Industry Employers
Business Consultants connect with targeted industry employers via ◦ Participation in Chamber of Commerce Workforce Committees
◦ Participation in Economic Development Group meetings & presentations
◦ Participation in Industry Association events
◦ Facilitation of Employer Seminars
◦ Facilitation of Industry Symposiums
◦ Collaboration with public colleges
Employer Service Representatives connect with targeted industry employers via phone, email, and social media outreach.

3
Our Results, Successes, and Challenges •Educational Services
•Professional and Technical Services
•Oil and Natural Gas Extraction and Manufacturing
•Health Services
•Specialty Construction

Item 6c-3 Page 1 of 2
Employer Service Committee UpSkill Houston – Construction Sector
Background The Greater Houston Partnership’s UpSkill Houston is a sector-based collective impact initiative focusing on seven of our region’s industry sectors. Building talent pipelines of skilled workers through strong collaboration with industry, colleges and schools, and regional workforce training partners is the goal. As we have noted before, the Board staff have been involved with the UpSkill initiative from its beginnings, supporting the work of sector panels and providing labor market data and information. UpSkill Houston’s seven priority industry sectors include petrochemical manufacturing, industrial and commercial construction, healthcare, advanced manufacturing, ports and maritime, utilities, and upstream/midstream oil & gas. Currently the petrochemical and industrial/commercial construction panels are operating. The healthcare panel may form later this year.
ConstructHouston The industrial/commercial construction sector panel effort has been styled as “ConstructHouston.” Steve Mechler (Balfour Beatty) and Laura Bellows (WS Bellows) are the sector leaders, along with Peter Beard (GHP). Other participants include the following:
• Randy Walker, S&B Engineering • JD Slaughter, S&B Engineering • Jerry Nevlud, AGC Houston • Russell Hamley, ABC Houston • Matthew Clark, Jacobs, Inc. • Scott Marshall, Jacobs, Inc. • Dorian Cockrell, United Way • John Stautner, Construction Citizen • Mike Lykes, NCI • Chuck Gremillion, Construction Career Collaborative (C3) • Cally Graves, Gulf Coast Workforce Board • Ann Pham, Gulf Coast Workforce Board • Craig Beskid, East Harris County Manufacturing Association • HISD • Lone Star College • Houston Community College

Item 6c-3 Page 2 of 2
The group meets every second Tuesday of the month, from 2pm-4pm, at different host sites.
Where is it going? UpSkill Houston is a long-term plan. As of today, the construction sector group is gathering information on the following data points:
• Understanding current needs o How big is the current labor gap? What are the projections for 3 years out,
5 years out, etc? o What are the occupations with the greatest need? o How can the sector increase wages without starting a wage war?
• Training
o Map current training capabilities of providers (SJC, LSC, HCC, High School dual credit, etc)?
o Develop a workgroup to focus on creating a real time pipeline of entry level workers
o Develop the skills training to support the progression from helper, to journey level, to supervisor and/or master trade
• Marketing Campaign o Develop and organize an awareness campaign of industry and opportunities o Create a website and commercials to push industry appeal and practical
knowledge of career navigation o Leverage partnerships to push marketing efforts
How are we helping? We are providing staff support to the panel on labor market data, occupation and wage data, resources available for new and current worker training and upgrading, and on the Workforce Innovation and Opportunity Act.

Item 7a Page 1 of 3
Early Education and Care Texas Rising Star and
Provider Reimbursement Rates Current Situation For the past year, the Texas Workforce Commission has worked with Boards and the provider community around the state to design and implement a revised, three-tiered quality rating system for early education providers. This is the result of direction from the Legislature after its 2013 session. As a part of the redesign, a provider that wants Texas Rising Star accreditation must qualify under the revised guidelines, even if that provider had a rating under the previous system. The new rating system goes into effect September 1, 2015. We have 154 providers who are Texas Rising Star accredited under the older standards. This represents about 8% of the approximately 2,000 vendors in our early education/care network.
• 109 of these, or 71%, have applied for accreditation under the new standards. • 52 of the 109 have achieved a quality rating. We are in the process of assessing the
remaining 57 providers. • Five of those 57 have licensing deficiencies which may prevent them from attaining
accreditation Currently we pay 5 % more to providers who have a Texas Rising Star certification, whether that provider is 4-star, 3-star, or 2-star rated. Proposed Changes Beginning September 1, 2015, payments for Rising Star certification will be pegged to the rating level. 2-star rated providers will be paid five percent more than regular rates; 3-star providers, at least seven percent more; and 4-star providers, at least nine percent more. The Legislature set these payment differentials when it required the redesign on the rating system. The Workforce Commission has requested that Boards approve the new rate differentials for Rising Star providers. We have the option to increase the differentials beyond the legislative-required levels.

Item 7a Page 2 of 3
Recommendation Attached are the current rates and the proposed new rates at the legislative-required levels. The proposed new rates increase only for the 3-star and 4-star rated providers. As a part of our regular and usual annual review of rates, we recommend revisiting all rates later in the year to consider possible need for adjustments. Action Approve Texas Rising Star tiered reimbursement rates for 2-star, 3-star and 4-star designated providers as shown on the attached chart.

Item 7a Page 3 of 3
Infant Full
Infant Part
Toddler Full
Toddler Part
Preschool Full
Preschool Part
School-age Full
School-age Part
Licensed CenterCurrent Regular Rate $ 32.91 $ 25.06 $ 28.31 $ 23.40 $ 23.43 $ 16.22 $ 20.76 $ 13.71 2-Star Current Rate* $ 34.56 $ 26.31 $ 29.73 $ 24.57 $ 24.60 $ 17.19 $ 21.80 $ 14.40 3-Star NEW RATE $ 35.25 $ 26.84 $ 30.32 $ 25.06 $ 25.09 $ 17.53 $ 22.24 $ 14.69 4-Star NEW RATE $ 35.97 $ 27.38 $ 30.94 $ 25.57 $ 25.60 $ 17.89 $ 22.69 $ 14.99 2-Star Percentage Above Regular 5.0% 5.0% 5.0% 5.0% 5.0% 6.0% 5.0% 5.0%3-Star Percentage Above Regular 7.1% 7.1% 7.1% 7.1% 7.1% 8.1% 7.1% 7.1%4-Star Percentage Above Regular 9.3% 9.3% 9.3% 9.3% 9.3% 10.3% 9.3% 9.3%
Licensed HomeCurrent Regular Rate $ 26.13 $ 20.67 $ 24.91 $ 19.48 $ 18.54 $ 16.22 $ 15.67 $ 11.03 Level 2 Current Rate* $ 27.44 $ 21.70 $ 26.16 $ 20.45 $ 19.66 $ 17.21 $ 16.45 $ 11.58 3-Star NEW RATE $ 27.99 $ 22.13 $ 26.68 $ 20.86 $ 20.05 $ 17.55 $ 16.78 $ 11.81 4-Star NEW RATE $ 28.56 $ 22.59 $ 27.23 $ 21.29 $ 20.46 $ 17.92 $ 17.12 $ 12.06 Level 2 - Percentage Above Regular 5.0% 5.0% 5.0% 5.0% 6.0% 6.1% 5.0% 5.0%Level 3 - Percentage Above Regular 7.1% 7.1% 7.1% 7.1% 8.1% 8.2% 7.1% 7.1%Level 4 - Percentage Above Regular 9.3% 9.3% 9.3% 9.3% 10.4% 10.5% 9.3% 9.3%
Registered HomeCurrent Regular Rate $ 25.76 $ 19.28 $ 24.16 $ 21.18 $ 17.51 $ 12.36 $ 14.50 $ 10.30 Level 2 Current Rate* $ 27.05 $ 20.24 $ 25.37 $ 22.24 $ 18.57 $ 13.11 $ 15.23 $ 10.92 3-Star NEW RATE $ 27.59 $ 20.64 $ 25.88 $ 22.68 $ 18.94 $ 13.37 $ 15.53 $ 11.14 4-Star NEW RATE $ 28.15 $ 21.07 $ 26.40 $ 23.15 $ 19.33 $ 13.65 $ 15.86 $ 11.37 Level 2 - Percentage Above Regular 5.0% 5.0% 5.0% 5.0% 6.1% 6.1% 5.0% 6.0%Level 3 - Percentage Above Regular 7.1% 7.1% 7.1% 7.1% 8.2% 8.2% 7.1% 8.2%Level 4 - Percentage Above Regular 9.3% 9.3% 9.3% 9.3% 10.4% 10.4% 9.4% 10.4%
Item 7a-1 Page 1 of 2
Early Education & Care
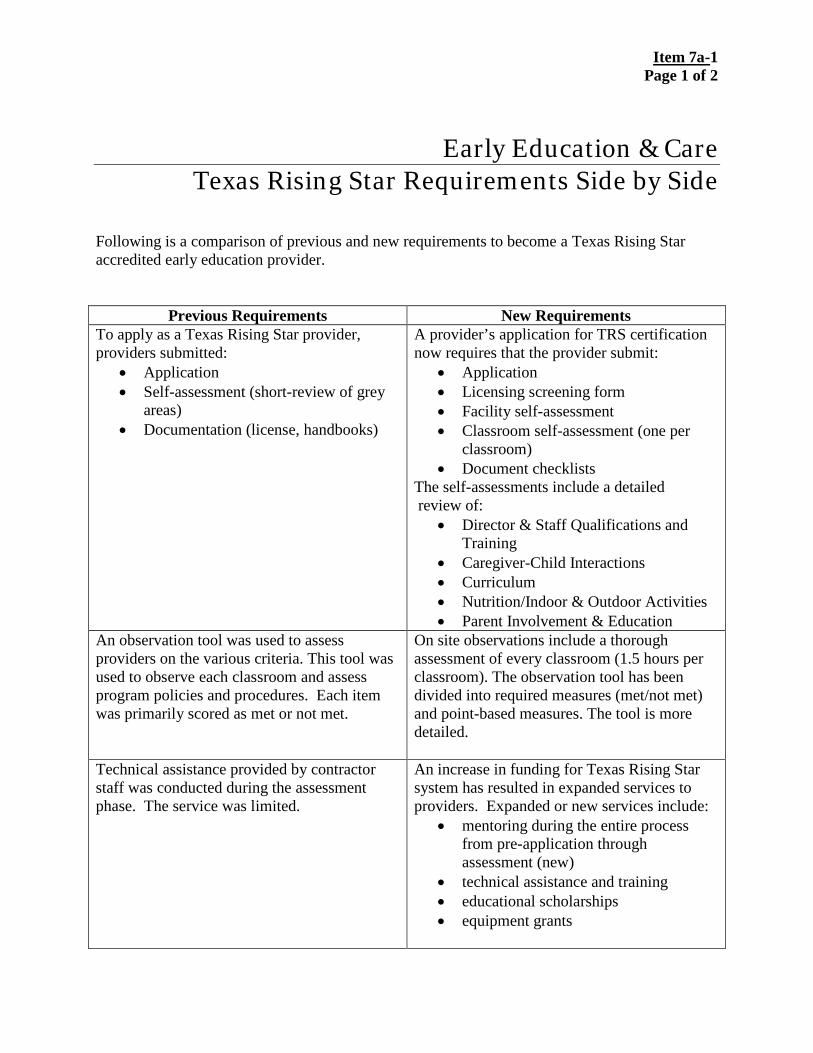
Texas Rising Star Requirements Side by Side Following is a comparison of previous and new requirements to become a Texas Rising Star accredited early education provider.
Previous Requirements New Requirements To apply as a Texas Rising Star provider, providers submitted:
• Application • Self-assessment (short-review of grey
areas) • Documentation (license, handbooks)
A provider’s application for TRS certification now requires that the provider submit:
• Application • Licensing screening form • Facility self-assessment • Classroom self-assessment (one per
classroom) • Document checklists
The self-assessments include a detailed review of:
• Director & Staff Qualifications and Training
• Caregiver-Child Interactions • Curriculum • Nutrition/Indoor & Outdoor Activities • Parent Involvement & Education
An observation tool was used to assess providers on the various criteria. This tool was used to observe each classroom and assess program policies and procedures. Each item was primarily scored as met or not met.
On site observations include a thorough assessment of every classroom (1.5 hours per classroom). The observation tool has been divided into required measures (met/not met) and point-based measures. The tool is more detailed.
Technical assistance provided by contractor staff was conducted during the assessment phase. The service was limited.
An increase in funding for Texas Rising Star system has resulted in expanded services to providers. Expanded or new services include:
• mentoring during the entire process from pre-application through assessment (new)
• technical assistance and training • educational scholarships • equipment grants
Item 7a-1 Page 2 of 2
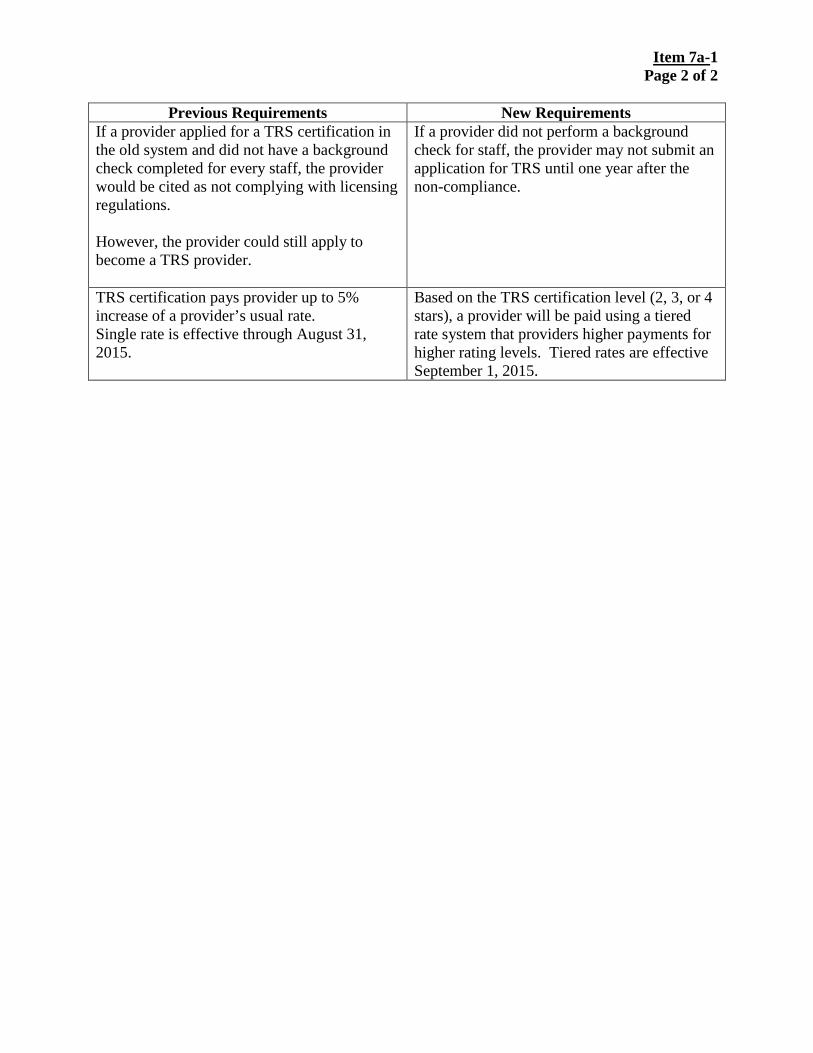
Previous Requirements New Requirements
If a provider applied for a TRS certification in the old system and did not have a background check completed for every staff, the provider would be cited as not complying with licensing regulations. However, the provider could still apply to become a TRS provider.
If a provider did not perform a background check for staff, the provider may not submit an application for TRS until one year after the non-compliance.
TRS certification pays provider up to 5% increase of a provider’s usual rate. Single rate is effective through August 31, 2015.
Based on the TRS certification level (2, 3, or 4 stars), a provider will be paid using a tiered rate system that providers higher payments for higher rating levels. Tiered rates are effective September 1, 2015.
Item 7b Page 1 of 8
Procurement Committee 2016 Contract Renewals
The Procurement Committee met on July 13, 2015 to consider renewing contracts for the operation of Workforce Solutions and the Gulf Coast Adult Education Consortium. Background The Gulf Coast Workforce Board solicited contracts for its Workforce Solutions operating affiliate in 2013. The 2016 contract year will begin on October 1, 2015 and is the third year of the current cycle for system contracts. The Board acted as administrative entity and grant recipient for adult education funds in a 2014 Texas Workforce Commission-initiated procurement. We propose renewing contracts from this award also on October 1, 2015 for the second year of that cycle. Pending approval by the Board and the local elected officials, we would plan to put contracts in place for the year beginning October 1, 2015. Members should note that the recently passed Workforce Innovation and Opportunity Act limits the maximum procurement period for funds from the Act to a total of four years. It has been our recent practice to use a five-year period. We are not certain at the moment if the change in legislation will affect our existing Workforce Solutions system procurements, but if so, we would need to re-procure in early 2017. In addition, the adult education funds procurement is in place through mid-2016 and may also be subject to re-procurement. Performance and Production Update The unemployment rate in our region for May 2015 was 4.2%. We expect to see a rise in this rate for June – this is generally the historical pattern – and overall job growth for the region is slowing. Sectors that have generated much of our employment growth over the past several years – energy, construction, and manufacturing – show slower growth or, in some cases, declines. Sectors in which employment is population-driven – retail trade, hospitality/leisure, and healthcare – continue to grow.
• Through May 2015, 77.3% of our customers were employed by the first quarter after exit from Workforce Solutions -- above the 73.3% annual performance last year and this year’s target of 73%.
• Through May 2015, 33.5% of our customers had earnings gains of 20% or more after exiting from Workforce Solutions services – below the 33.6% performance from last year and below the target of 35%.

Item 7b Page 2 of 8
• Through May 2015, 52.2% of our customers pursuing any education credential, and 66.4% pursuing a post-secondary credential, had achieved their goals. The first indicator is behind target, but ahead of last year’s performance, and the second – for post-secondary credentials, is almost at target and significantly higher than last year.
• We are seeing a slight decline in Career Office traffic. The average monthly traffic
(visits) through May 2015 was 187,003 customers. In 2014 the average monthly traffic was 203,259 customers.
• We are seeing an increase in the number of job postings. The average number of monthly job postings through May 2015 was 10,375. In 2014 the average monthly job postings was 8,748.
We are behind on one of the ten state’s production measures:
1. Education Achievement – This measure is slightly different from the Board performance measures for education credentials. It counts individuals in the third quarter after exit, while the Board performance looks at the first quarter after exit. The state has set the target for this measure higher than the Board has set its target. While we are showing recent improvement, we anticipate continued difficulty meeting this measure during the course of this next year.
The Workforce Solutions System Workforce Solutions consists of several interrelated and integrated units, early education quality improvement providers and youth providers. The major system units include Employer Service, the Career Offices, the Financial Aid Call Center, the Financial Aid Payment Office, and our training and development contractor. Employer Service Employment and Training Centers, Inc. operates Workforce Solutions’ Employer Service which markets and provides a range of services to business. The 88 staff members are located in career offices and a central unit in Houston. For 2015, ETC will work with almost 25,500 employers. Through May, we provided services to just over 23,200 employers.
Career Offices Two contractors operate 24 offices and four information centers.
Neighborhood Centers manages 285 staff to operate 11 offices:
Astrodome, Baytown, East End, Lake Jackson, Northeast, Northline, Northshore, Rosenberg, Southeast, Southwest, and Texas City Information Centers: Houston Public Library-

Item 7b Page 3 of 8
Downtown, Winnie, City of Houston Metropolitan Multi-Services Center
Interfaith of the Woodlands manages 218 staff to operate 13 offices:
Bay City, Columbus, Conroe, Cypress Station, Humble, Huntsville, Katy Mills, Liberty, Sealy, Waller, Westheimer, Wharton and Willowbrook Information Center: Ring Neighborhood Library
Call Center Interfaith of The Woodlands employs 84 staff to operate our Financial Aid Call Center. This unit receives applications for financial aid from our customers, determines the eligibility for financial aid and communicates with our customers regarding the status of their applications, and for those who we approve for assistance, how to access their work, education or work search support. Currently this unit receives approximately 7,560 applications for financial aid and 25,800 calls every month. Payment Office Neighborhood Centers, Inc. employs 36 staff to operate our payment office and manage Workforce Solutions’ vendor networks. This unit tracks, manages, and pays out financial aid to vendors on behalf of our customers. The Payment Office also has staff who investigates alleged fraud. For 2015, we expect that the payment office will pay out more than $125 million in financial aid for scholarships; help with child care expenses and transportation costs; and other education, work and work search expenses. The payment office works with about 2,800 vendors. Early Education Quality Two contractors provide quality resources to child care providers Texas Association for the Education of Young Children (TAEYC) employs two staff to award scholarships to 35 customers for their Associate’s Degree in Child Development or Child Development Associate Credentials (CDA). Collaborative for Children, Inc. (CFC) employs 37 staff to provide quality resources to child care providers. CFC provides teachers and director training, equipment and material grants, intensive quality improvement services, support Texas Rising Star and National Accreditation, support for children with disabilities, support for infant/toddler care, child care resource and referral, resources for listed home providers, parenting support, and securing local match funds to match federal Child Care Development Block Grant funds.

Item 7b Page 4 of 8
Youth Three contractors currently deliver services for young people who completed their High School Education or dropped out. All counties of the region receive these services. SER employs 5.5 staff to provide workforce development services, education, training, career coaching and employment opportunities for young people in Brazoria, Chambers, Fort Bend, Galveston, Harris and Liberty counties. Dynamic Educational Systems, Inc. employs 2.5 staff to provide services to help young people obtain an education credential, employment, or enrollment in postsecondary education in Austin, Colorado, Matagorda, Montgomery, Walker, Waller and Wharton counties. Gulf Coast Trades Center employs 4 staff to provide educational and vocational training and support services to youth offenders referred from County Juvenile Probation Departments. There were fewer referrals this year and we reduced the 2015 budget by $70,000 to $212,000. Additionally, there are five contractors providing services to assist youth with attaining
their high school diploma and move on to post-secondary education or employment. These contractors are just beginning services and are not up for renewal at this time.
Project Grad Genesys Works – Houston Knowledge-First Empowerment Center Alliance for Multicultural Community Services AVANCE Houston, Inc.
Staff Training and Development We contract with Learning Designs, Inc. to provide training and support to staff working within our system. This includes developing and delivering classes for contractor staff and on-site, intensive technical assistance. LDI provides critical support to the system and frequently helps address ways to improve our services to our customers with five staff. From October 1, 2014 through June 30, 2015, LDI provided 138 instructor-led classes to regional Workforce Solutions staff. During that time, LDI also provided onsite technical assistance, training and coaching to staff at 18 Workforce Solutions offices across the region. LDI staff participated on six regional workgroups designed to improve processes and service delivery across the systems and developed 16 new courses and practicums for staff.
Item 7b Page 5 of 8
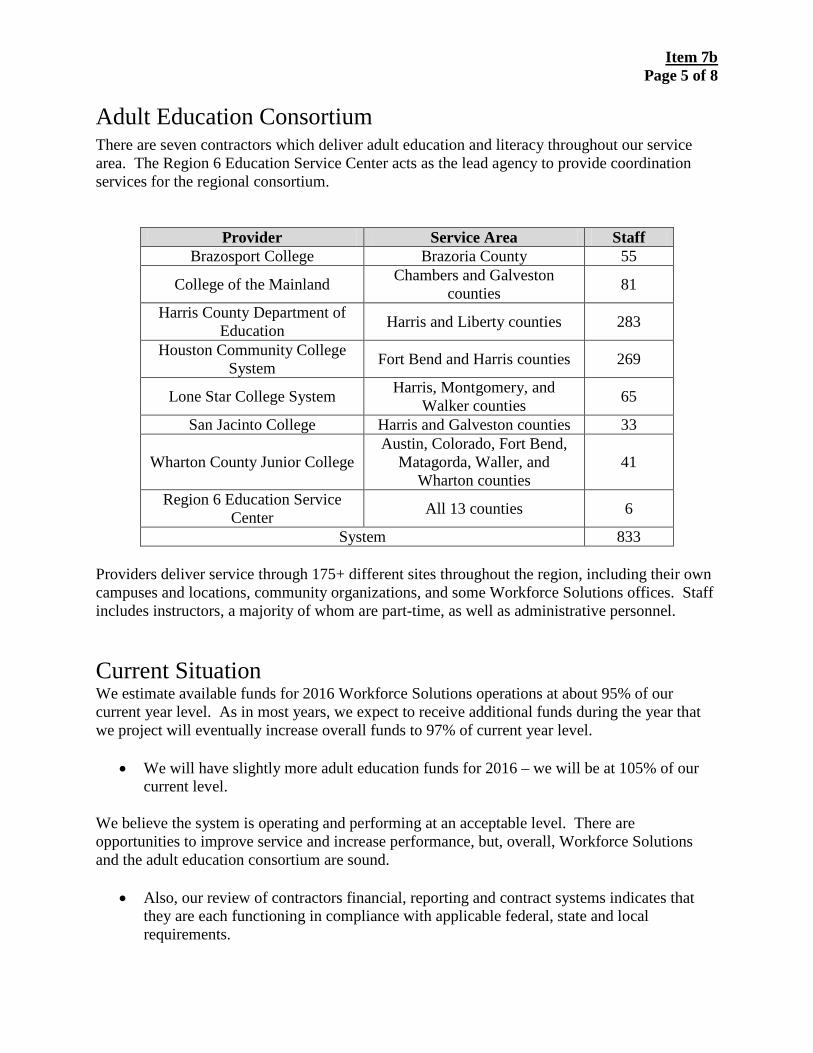
Adult Education Consortium There are seven contractors which deliver adult education and literacy throughout our service area. The Region 6 Education Service Center acts as the lead agency to provide coordination services for the regional consortium.
Provider Service Area Staff Brazosport College Brazoria County 55
College of the Mainland Chambers and Galveston counties 81
Harris County Department of Education Harris and Liberty counties 283
Houston Community College System Fort Bend and Harris counties 269
Lone Star College System Harris, Montgomery, and Walker counties 65
San Jacinto College Harris and Galveston counties 33
Wharton County Junior College Austin, Colorado, Fort Bend,
Matagorda, Waller, and Wharton counties
41
Region 6 Education Service Center All 13 counties 6
System 833 Providers deliver service through 175+ different sites throughout the region, including their own campuses and locations, community organizations, and some Workforce Solutions offices. Staff includes instructors, a majority of whom are part-time, as well as administrative personnel. Current Situation We estimate available funds for 2016 Workforce Solutions operations at about 95% of our current year level. As in most years, we expect to receive additional funds during the year that we project will eventually increase overall funds to 97% of current year level.
• We will have slightly more adult education funds for 2016 – we will be at 105% of our current level.
We believe the system is operating and performing at an acceptable level. There are opportunities to improve service and increase performance, but, overall, Workforce Solutions and the adult education consortium are sound.
• Also, our review of contractors financial, reporting and contract systems indicates that
they are each functioning in compliance with applicable federal, state and local requirements.

Item 7b Page 6 of 8
Recommendations We recommend renewing contracts for all 17 Workforce Solutions and adult education providers in 2016.
• As always, we will negotiate final contract budgets and look to find efficiencies and reduce cost where possible.
• For 2016, we expect to provide a service for 375,000 to 400,000 individuals and almost
26,000 employers. This includes providing more than 26,000 individuals with adult education and literacy instruction. We expect to use about $129 million in financial aid to help 40,000 individuals get a job, keep a job, or get a better job.
• For Workforce Solutions, we will focus system efforts on
o increasing the job postings which we fill for employers, and o improving the success for individuals who receive training or education with our
financial assistance, and o as always, raising the level of our customer service.
• For adult education, we will work to
o further integrate providers and Workforce Solutions offices, offering more seamless access to service for customers,
o improve the service in underserved areas of the region, and o improve overall performance.
• We expect to meet or exceed the Board’s performance targets, as well as state and federal production requirements, for Workforce Solutions and the adult education consortium. In addition, we will:
o Increase the number of job openings and the percentage of job postings we fill to meet and exceed state production requirements;
o Meet and exceed the Board’s performance measures for attaining education credentials; and
o Meet adult education enrollment targets for counties underserved in 2015.
Item 7b Page 7 of 8
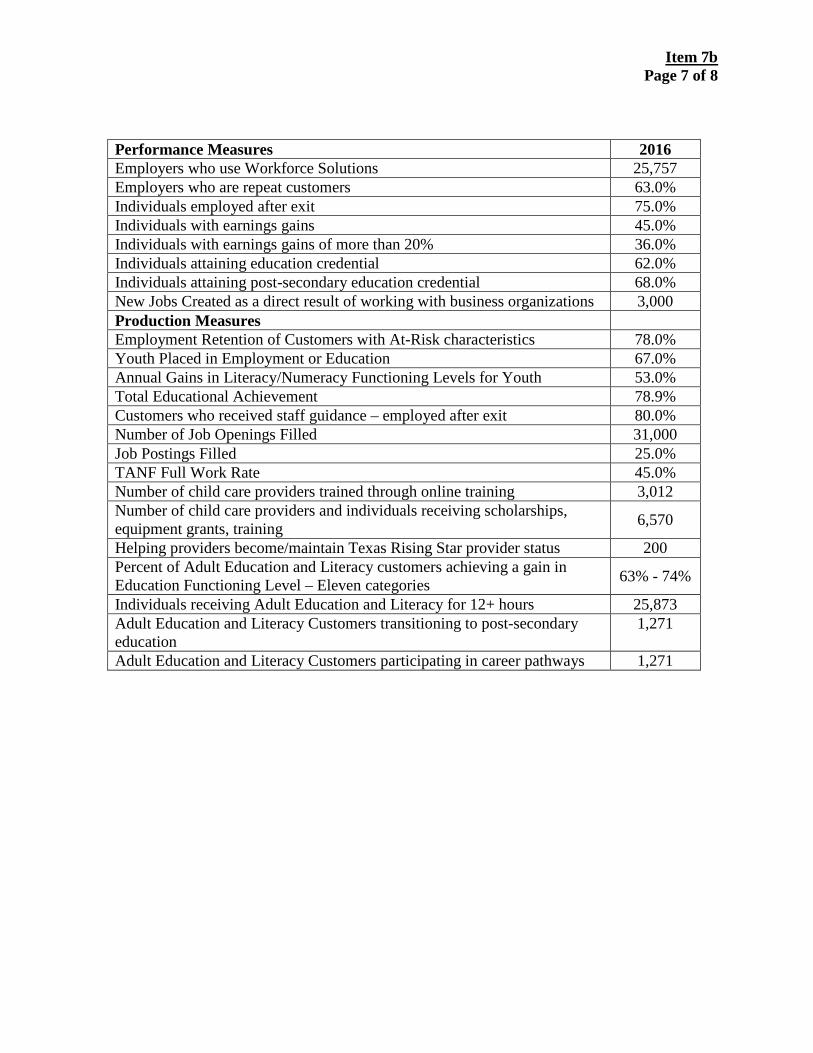
Performance Measures 2016 Employers who use Workforce Solutions 25,757 Employers who are repeat customers 63.0% Individuals employed after exit 75.0% Individuals with earnings gains 45.0% Individuals with earnings gains of more than 20% 36.0% Individuals attaining education credential 62.0% Individuals attaining post-secondary education credential 68.0% New Jobs Created as a direct result of working with business organizations 3,000 Production Measures Employment Retention of Customers with At-Risk characteristics 78.0% Youth Placed in Employment or Education 67.0% Annual Gains in Literacy/Numeracy Functioning Levels for Youth 53.0% Total Educational Achievement 78.9% Customers who received staff guidance – employed after exit 80.0% Number of Job Openings Filled 31,000 Job Postings Filled 25.0% TANF Full Work Rate 45.0% Number of child care providers trained through online training 3,012 Number of child care providers and individuals receiving scholarships, equipment grants, training 6,570
Helping providers become/maintain Texas Rising Star provider status 200 Percent of Adult Education and Literacy customers achieving a gain in Education Functioning Level – Eleven categories 63% - 74%
Individuals receiving Adult Education and Literacy for 12+ hours 25,873 Adult Education and Literacy Customers transitioning to post-secondary education
1,271
Adult Education and Literacy Customers participating in career pathways 1,271
Item 7b Page 8 of 8
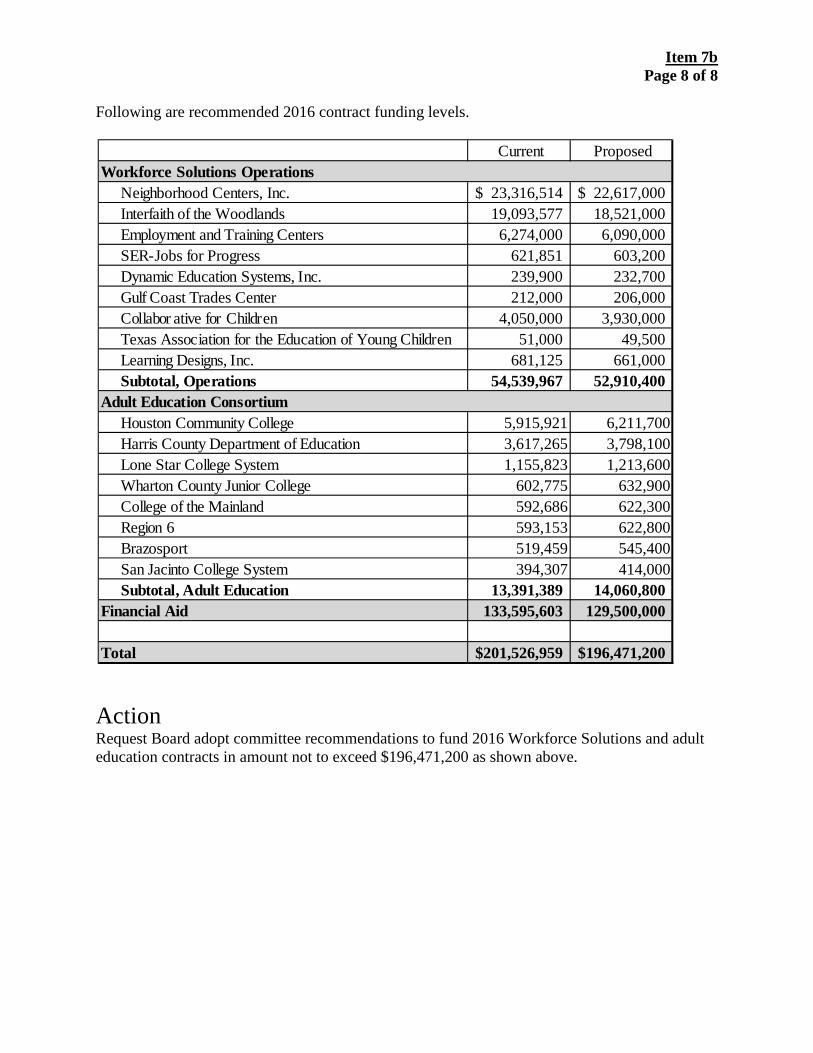
Following are recommended 2016 contract funding levels.
Action Request Board adopt committee recommendations to fund 2016 Workforce Solutions and adult education contracts in amount not to exceed $196,471,200 as shown above.
Current Proposed
Neighborhood Centers, Inc. 23,316,514$ 22,617,000$ Interfaith of the Woodlands 19,093,577 18,521,000 Employment and Training Centers 6,274,000 6,090,000 SER-Jobs for Progress 621,851 603,200 Dynamic Education Systems, Inc. 239,900 232,700 Gulf Coast Trades Center 212,000 206,000 Collabor ative for Children 4,050,000 3,930,000 Texas Association for the Education of Young Children 51,000 49,500 Learning Designs, Inc. 681,125 661,000 Subtotal, Operations 54,539,967 52,910,400
Houston Community College 5,915,921 6,211,700 Harris County Department of Education 3,617,265 3,798,100 Lone Star College System 1,155,823 1,213,600 Wharton County Junior College 602,775 632,900 College of the Mainland 592,686 622,300 Region 6 593,153 622,800 Brazosport 519,459 545,400 San Jacinto College System 394,307 414,000 Subtotal, Adult Education 13,391,389 14,060,800 Financial Aid 133,595,603 129,500,000
Total 201,526,959$ 196,471,200$
Workforce Solutions Operations
Adult Education Consortium

Item 8a Page 1 of 4
Gulf Coast Workforce Board System Performance October 2014 to June 2015
Board Measures These measures gauge progress toward meeting the results set out in the Board’s strategic plan. There are two sets of measures: one for the entire regional workforce system and one for the Board’s operating affiliate, Workforce Solutions. We report on the Workforce Solutions measures at each Board meeting. More Competitive Employers
Measure Annual Target
Current Performance
Performance Last Year
Employers Receiving ServicesWe expect to provide services to 25,452 employers this year which is almost 18% of the 144,799 employers identified for the Gulf Coast area. We provided services to 24,696 employers through June 2015.
(Market Share)
25,452 24,696 24,907
Our performance indicates our employer customers value our services and return to us for additional services. Of a possible 22,719 employers, 13,374 returned to Workforce Solutions for additional services through June 2015.
Employer Loyalty
62% 58.9% 56.8%

Item 8a Page 2 of 4
More and Better Jobs
Measure Annual Target
Current Performance
Performance Last Year
This information is captured quarterly and reflects a two year average. New jobs created
2,700 2,446 2,865
Reporting for the quarter ending September 2014, 231,159 of the 296,222 customers who exited from services were employed by the quarter after exit.
Customers employed by the 1st Qtr after exit
73% 78.0% 73.3%
Higher Real Incomes
Measure Annual Target
Current Performance
Performance Last Year
Reporting for the quarter ending March 2014, 105,581of the 312,258 customers who exited had earnings gains of at least 20%.
Exiters with Earnings Gains of at least 20%
35% 33.8% 33.6%
A Better Educated Workforce
Measure Annual Target
Current Performance
Performance Last Year
Reporting for the quarter ending March 2015, 2,177 customers pursuing an education diploma, degree or certificate exited in the period July – March 2015. 1,003 achieved a diploma, degree or certificate by the quarter after exit.
Customers pursuing education diploma, degree or certificate who achieve one
60% 46.1% 51.7%

Item 8a Page 3 of 4
Production In addition to the Board’s measures, Workforce Solutions works to meet the state’s expectations for performance on indicators related to the money we receive from the Texas Workforce Commission. For the performance year that began October 1, 2014, the state reports we are meeting or exceeding the target for six of the ten measures. The measures we are not meeting currently are:
• Total Education Achievement -
The target for this measure is 80.9%. Our performance in the year was 67.1%. We are working with contractors to improve services to help customers attain their educational goal.
• WIA Youth Placement in Employment or Education -
•
The target for this measure is 67.0%. Our performance in the year was 59.3%. We are working with contractors to improve services to help customers attain their educational and employment goals. Jobs Opening Filled -
The target for this measure for the first three quarters is 22,367. Our performance so far this year is 20,856. We are working with contractors to improve this essential service to our employers.
• Placement of registered Claimants with 10 weeks -
The target for this measure is 55.0%. Our performance in the first nine months slipped from 54.72% to 53.7%. We are working with contractors to improve this essential service to our employers and our customers receiving unemployment compensation.
We also have 24 adult education measures.
• This past year served as a transition year for the adult education system. 6.746 students received Adult Basic Education services, 13,338 received English as a Second Language services, and 446 students received Adult Secondary Education services. All of these students participated at least 12 hours. Although the data is not final, we generally know our performance outcomes.
• There are eleven measures pertaining to the improvement of education levels. Some of the providers within the consortium
met targets for these measures; however, as a system, we have not achieved the performance we expected.

Item 8a Page 4 of 4
Measure Target 2015 Actual Adult Basic Education – Beginning Literacy 74% 58.5% Adult Basic Education – Beginning Basic Education 63% 50% Adult Basic Education – Intermediate Low 63% 48.3% Adult Basic Education – Intermediate High 63% 42.3% English as a Second Language – Beginning Literacy 65% 48.6% English as a Second Language – Beginning Low 72% 53.6% English as a Second Language – Beginning High 73% 53.3% English as a Second Language – Intermediate Low 77% 53% English as a Second Language – Intermediate High 66% 39.3% Advanced English as a Second Language 74% 40% Adult Secondary Education 65% 47.7%
• There are 10 enrollment targets. The system has met seven of the enrollment targets. We have not met the target for Total
Students, the target for Federal/State English-Literacy-Civics Funded Students, or the target for TANF Funded Students.
Enrollment Target 2015 Actual Total Students – All Funds 25,540 22,853 Fed/ State (English-Literacy-Civics funds) Students 24,263 22,110 TANF Funded Students 1,277 1,037
• There are four long-term measures regarding the outcomes of customers who received services, including: attainment of a high
school diploma or equivalent, entering post-secondary education and employment and retention. Data for these measures will not be available until October 2015.
• We are working with Region 6, the consortium lead agency, and the seven providers, to better understand our system
performance for this year and what we will do to ensure we meet the targets for the coming year.

Item 8b
GULF COAST WORKFORCE DEVELOPMENT BOARDFINANCIAL STATUS REPORT ANNUAL BUDGET ACTUAL DOLLARFor the Six Months Ended June 30, 2015 BUDGET YEAR TO DATE YEAR TO DATE VARIANCE
WORKFORCE REVENUES
WORKFORCE REVENUES 201,905,098 100,952,549 103,856,567 (2,904,018)
WORKFORCE EXPENDITURES
BOARD ADMINISTRATION 4,813,345 2,406,673 2,212,809 193,864SYSTEM IT 270,000 135,000 144,608 (9,608)EMPLOYER SERVICES 8,031,167 4,015,584 4,283,313 (267,730)RESIDENT SERVICES 188,790,586 94,395,293 97,215,837 (2,820,544) OFFICE OPERATIONS 38,394,242 19,197,121 18,372,363 824,758 FINANCIAL AID 134,338,344 67,169,172 72,186,924 (5,017,752) SPECIAL PROJECTS 1,960,900 980,450 435,319 545,131 ADULT EDUCATION 14,097,100 7,048,550 6,221,231 827,319
TOTAL WORKFORCE EXPENDITURES 201,905,098 100,952,549 103,856,567 -2,904,018
VARIANCE ANALYSIS
Note: Except for Special Projects that are currently funded through September 30, 2015, the "Budget Year to Date" column reflects straight-line estimate of expenditures for the twelve-month period, assuming equal expenditures every month in order to fully expend the budget in a year.

1
Labor Market Information JUNE 2015 Employment Data
HOUSTON-THE WOODLANDS-SUGAR LAND METROPOLITAN STATISTICAL AREA
Visit our website at www.wrksolutions.com (H-W-S MSA)
THE RATE OF UNEMPLOYMENT IN THE H-W-S MSA EXPERIENCED A SEASONAL INCREASE IN JUNE RISING TO 4.5 PERCENT. The civilian labor force contracted by 22,616 over the year but the number of employed rose by 25,916 helping drive the rate of unemployment down by eight-tenths of a percentage point from one year earlier. The rate of unemployment in the H-W-S MSA was lower than the nation’s 5.5 percent rate but higher than the state’s 4.4 percent rate.
Unemployment Rate (Actual)
JUN 2015 MAY 2015 JUN 2014 Civilian Labor Force 3,241,252 3,247,488 3,263,868 Total Employed 3,095,209 3,112,487 3,091,909 Unemployed 146,043 135,001 171,959 Unemployment Rate 4.5% 4.2% 5.3%
3
3.5
4
4.5
5
5.5
6
6.5
7
Jun-14 Jul-14 Aug-14 Sep-14 Oct-14 Nov-14 Dec-14 Jan-15 Feb-15 Mar-15 Apr-15 May-15 Jun-15
Jun-14 Jul-14 Aug-14 Sep-14 Oct-14 Nov-14 Dec-14 Jan-15 Feb-15 Mar-15 Apr-15 May-15 Jun-15H-W-S MSA 5.3 5.4 5.1 4.7 4.4 4.3 4 4.5 4.3 4.2 4 4.2 4.5Texas 5.4 5.5 5.3 4.9 4.5 4.5 4.1 4.6 4.3 4.2 4 4.1 4.4U.S. 6.3 6.5 6.3 5.7 5.5 5.5 5.4 6.1 5.8 5.6 5.1 5.3 5.5
Figure 1. Rate of Unemployment - Actual
THE H-W-S MSA ADDED 4,300 JOBS IN JUNE. The 0.1 percent increase was weakest job growth for the month of June since 2010. The pace of job growth dropped one-tenth of a percentage point to 1.9 percent in June, an increase of 55,700 jobs over the year. The 1.9 percent pace of job growth was the slowest for the H-W-S MSA since November 2010 and for the second consecutive month the pace of job growth was slower than the nation’s, see Figure 2. Healthiest over-the-year growth has been in population driven industries such as Retail Trade, Educational and Health Services (Private), and Leisure and Hospitality. Several industry sectors were reporting over-the-year losses; Mining and Logging, Manufacturing, and Financial Activities. Detailed data can be viewed on pages 6 & 7. Additional comments by super sector can be found beginning on page 3.
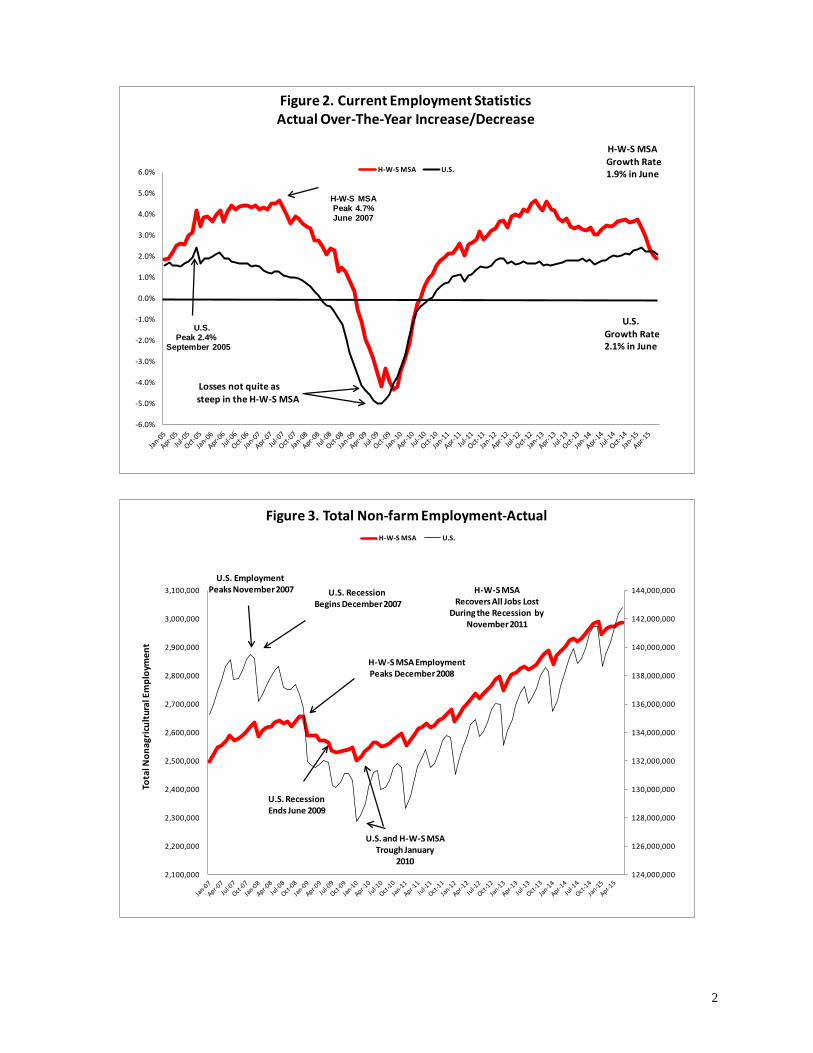
2
-6.0%
-5.0%
-4.0%
-3.0%
-2.0%
-1.0%
0.0%
1.0%
2.0%
3.0%
4.0%
5.0%
6.0%
Figure 2. Current Employment StatisticsActual Over-The-Year Increase/Decrease
H-W-S MSA U.S.
H-W-S MSAPeak 4.7%June 2007
U.S.Peak 2.4%
September 2005
U.S.Growth Rate 2.1% in June
H-W-S MSAGrowth Rate 1.9% in June
Losses not quite as steep in the H-W-S MSA
124,000,000
126,000,000
128,000,000
130,000,000
132,000,000
134,000,000
136,000,000
138,000,000
140,000,000
142,000,000
144,000,000
2,100,000
2,200,000
2,300,000
2,400,000
2,500,000
2,600,000
2,700,000
2,800,000
2,900,000
3,000,000
3,100,000
Tota
l Non
agric
ultu
ral E
mpl
oym
ent
Figure 3. Total Non-farm Employment-Actual H-W-S MSA U.S.
U.S. Employment Peaks November 2007 U.S. Recession
Begins December 2007
H-W-S MSA EmploymentPeaks December2008
U.S. RecessionEnds June 2009
U.S. and H-W-S MSA Trough January
2010
H-W-S MSARecovers All Jobs Lost
During the Recession by November2011

3
Seasonally adjusted data for the H-W-S MSA and U.S. seen in Figure 4 provides an additional view of employment removing the erratic seasonal movement. Payroll growth in the H-W-S MSA has stalled recently after peaking at 2,980,800 in February. The pace of job growth in June was 1.9 percent, slightly weaker than the nation’s 2.1 percent pace and down notably from the most recent peak of 3.8 percent in December 2014.
122,000,000
124,000,000
126,000,000
128,000,000
130,000,000
132,000,000
134,000,000
136,000,000
138,000,000
140,000,000
142,000,000
144,000,000
2,000,000
2,200,000
2,400,000
2,600,000
2,800,000
3,000,000
3,200,000
Tota
l Non
agric
ultu
ral E
mpl
oym
ent
Figure 4. Total Non-farm Employment-Seasonally Adjusted H-W-S MSA U.S.
U.S. EmploymentPeaks January 2008
U.S. RecessionBegins December 2007
H-W-S MSAEmployment
PeaksAugust 2008
H-W-S Employment Trough
December 2009
U.S. RecessionEnds June 2009 U.S. Employment
TroughFebruary 2010
H-W-S MSARecovers All Jobs Lost
During the Recession by November 2011
June 2015
H-W-S MSAUp 1.9% Over the Year
and Up 12.5% Above Pre-Recession High
U.S.
Up 2.1% Over the Yearand Up 2.5% Above Pre-
Recession High
DETAILS BY SUPER SECTOR
Mining and Logging experienced an unexpected increase of 800 jobs in June according to preliminary estimates despite a continued decline in drilling activity. The super sector reported an over-the-year loss for the second consecutive month, down 300 jobs or 0.3 percent over the year. The average U.S. rig count was 861 in June, down 28 from May and 1,000 (53.7%) from one year earlier. The average Texas rig count was 363 in June, down 12 from May and 528 (59.3%) from one year earlier. Layoffs in the super sector are expected to continue into the second half of 2015 due to weak oil demand with most losses concentrated in Support Activities for Mining. Construction added 800 jobs in June. The increase was driven by gains in Construction of Buildings and Specialty Trade Contractors, up 1,600 jobs and 300 jobs respectively. Heavy and Civil Engineering Construction suffered a loss of 1,100 jobs over the month. Construction added 2,400 jobs to payrolls over the year. The 1.2 percent pace of job growth in the super sector is well below a peak of 8.7 percent in December 2014. Strongest job growth has been in Construction of Buildings, up 1,200 jobs or 2.2 percent. Specialty Trade Contractors which is largely driven by the Construction of Buildings sector was up 1,500 jobs or 1.5 percent over the year. Heavy and Civil Engineering Construction was down 300 jobs over the year.
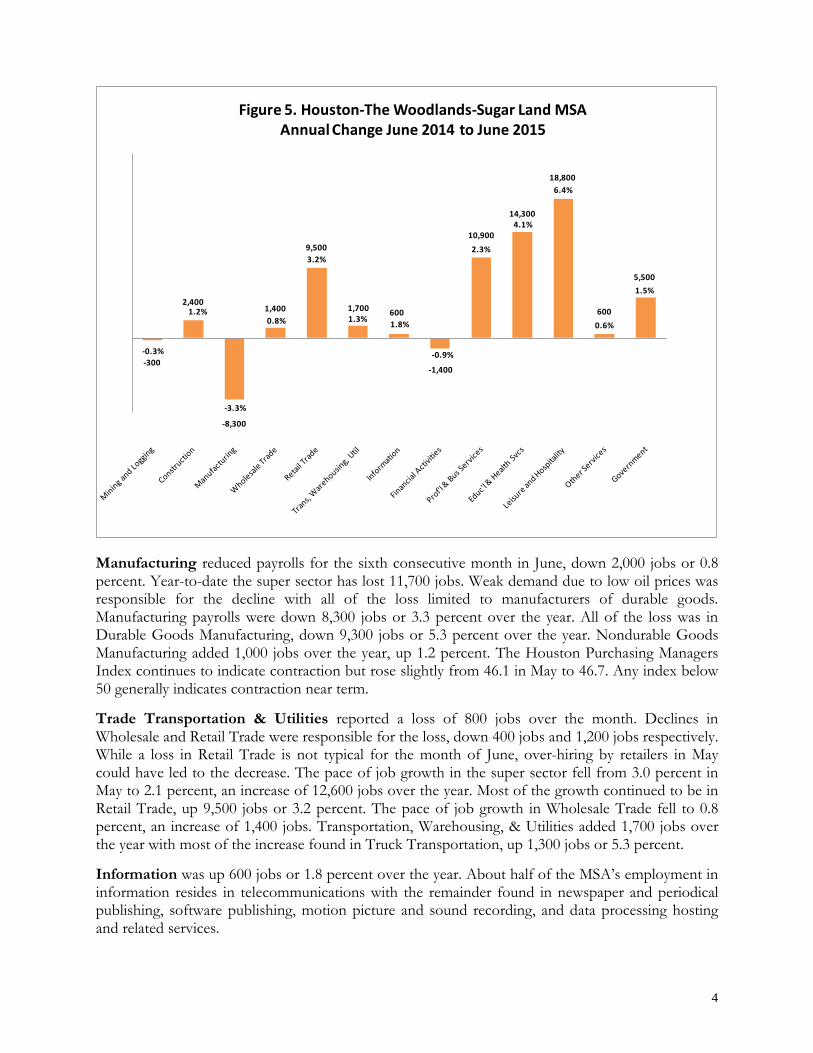
4
-300
2,400
-8,300
1,400
9,500
1,700 600
-1,400
10,900
14,300
18,800
600
5,500
-0.3%
1.2%
-3.3%
0.8%
3.2%
1.3% 1.8%
-0.9%
2.3%
4.1%
6.4%
0.6%
1.5%
Figure 5. Houston-The Woodlands-Sugar Land MSAAnnual Change June 2014 to June 2015
Manufacturing reduced payrolls for the sixth consecutive month in June, down 2,000 jobs or 0.8 percent. Year-to-date the super sector has lost 11,700 jobs. Weak demand due to low oil prices was responsible for the decline with all of the loss limited to manufacturers of durable goods. Manufacturing payrolls were down 8,300 jobs or 3.3 percent over the year. All of the loss was in Durable Goods Manufacturing, down 9,300 jobs or 5.3 percent over the year. Nondurable Goods Manufacturing added 1,000 jobs over the year, up 1.2 percent. The Houston Purchasing Managers Index continues to indicate contraction but rose slightly from 46.1 in May to 46.7. Any index below 50 generally indicates contraction near term. Trade Transportation & Utilities reported a loss of 800 jobs over the month. Declines in Wholesale and Retail Trade were responsible for the loss, down 400 jobs and 1,200 jobs respectively. While a loss in Retail Trade is not typical for the month of June, over-hiring by retailers in May could have led to the decrease. The pace of job growth in the super sector fell from 3.0 percent in May to 2.1 percent, an increase of 12,600 jobs over the year. Most of the growth continued to be in Retail Trade, up 9,500 jobs or 3.2 percent. The pace of job growth in Wholesale Trade fell to 0.8 percent, an increase of 1,400 jobs. Transportation, Warehousing, & Utilities added 1,700 jobs over the year with most of the increase found in Truck Transportation, up 1,300 jobs or 5.3 percent. Information was up 600 jobs or 1.8 percent over the year. About half of the MSA’s employment in information resides in telecommunications with the remainder found in newspaper and periodical publishing, software publishing, motion picture and sound recording, and data processing hosting and related services.

5
Financial Activities added 700 jobs over the month, up 0.5 percent. Real Estate and Rental and Leasing accounted for most of the increase, up 500 jobs or 1.0 percent. The super sector was down 1,400 jobs or 0.9 percent over the year. Real Estate and Rental and Leasing experienced the deepest decline, down 1,800 jobs or 3.3 percent. Credit Intermediation and Related Activities was also reporting a significant loss, down 1,200 jobs or 2.7 percent. Securities, Commodity Contracts, and Other Financial Investments and Related Activities continue to report a healthy increase of 1,000 jobs over the year, up 5.6 percent. Professional and Business Services added 6,500 jobs in June. The 1.4 percent increase was the strongest for the month of June since 2012. Job gains were widespread across the super sector with the exception of Architectural, Engineering, and Related Services which lost 800 jobs over the month, down 1.1 percent. The pace of job growth in Professional and Business Services rose to 2.3 percent, up 10,900 jobs over the year. Strongest job growth was in Accounting, Tax Preparation, Bookkeeping, and Payroll Services, up 1,100 jobs or 5.0 percent over the year. Several areas were reporting declines including Architectural Engineering and Related Services, Management of Companies and Enterprises, and Employment Services. Education and Health Services experienced a seasonal decline in June, down 1,500 jobs or 0.4 percent. All of the loss was in Educational Services which reduced payrolls by 2,000 jobs. An increase of 500 jobs in Health Care and Social Assistance helped offset declines. Payrolls in the super sector were up 14,300 jobs or 4.1 percent over the year. All subsectors were reporting healthy over-the-year increases. Ambulatory Healthcare Services accounted for more than half of the increase with payrolls up 8,200 jobs or 5.8 percent. Hospitals reported the strongest job growth, up 4,800 jobs or 6.2 percent over the year.
Leisure and Hospitality reported a seasonal increase of 5,300 jobs in June, up 1.7 percent. Job gains were across the entire super sector but Arts, Entertainment, and Recreation reported the strongest increase, up 1,400 jobs or 4.2 percent. The pace of job growth in super sector continued to be strong rising to 6.4 percent, an increase of 18,800 jobs over the year. While all subsectors were reporting healthy increases, most of the new jobs are found in Food Services and Drinking Places, up 15,300 jobs or 6.5 percent. Population growth continues to drive demand in the Leisure and Hospitality super sector.
Other Services added 1,600 jobs in June, up 1.5 percent. Over-the-year job growth returned positive with payrolls up 600 jobs or 0.6 percent. Other Services includes, as a partial list, industries such as various repair services (industrial equipment, mining machinery and equipment, and many others related to the oil and gas industry), personal care services, dry cleaning and laundry services, and religious and social advocacy organizations.
Government experienced a seasonal decline in June as educational institutions reduced payrolls for the summer, down 7,200 jobs or 1.9 percent. The super sector was up 5,500 jobs or 1.5 percent over the year. Most of the increases have been in Local Government, up 4,900 jobs or 1.8 percent, driven by gains in Local Government Educational Services.

6
NONAGRICULTURAL EMPLOYMENTHouston-The Woodlands-Sugar Land MSA JUN 2015 Net Percent Net PercentTotal Nonfarm 2,987,000 4,300 0.1% 55,700 1.9%Total Private 2,607,600 11,500 0.4% 50,200 2.0%Goods Producing 561,100 -400 -0.1% -6,200 -1.1%.Mining and Logging 108,900 800 0.7% -300 -0.3%...Oil and Gas Extraction 55,300 600 1.1% 1,300 2.4%...Support Activities for Mining 53,300 600 1.1% -600 -1.1%.Construction 205,200 800 0.4% 2,400 1.2%..Construction of Buildings 56,400 1,600 2.9% 1,200 2.2%..Heavy and Civil Engineering Construction 45,200 -1,100 -2.4% -300 -0.7%..Specialty Trade Contractors 103,600 300 0.3% 1,500 1.5%.Manufacturing 247,000 -2,000 -0.8% -8,300 -3.3%..Durable Goods 165,700 -2,300 -1.4% -9,300 -5.3%...Fabricated Metal Product Manufacturing 60,600 -700 -1.1% -2,800 -4.4%...Machinery Manufacturing 57,400 0 0.0% 400 0.7%....Agriculture, Construction, and Mining Machinery Manufacturing 41,200 -100 -0.2% -600 -1.4%...Computer and Electronic Product Manufacturing 17,300 0 0.0% -700 -3.9%..Non-Durable Goods 81,300 300 0.4% 1,000 1.2%...Petroleum and Coal Products Manufacturing 10,000 100 1.0% 0 0.0%...Chemical Manufacturing 37,700 300 0.8% 900 2.4%Service Providing 2,425,900 4,700 0.2% 61,900 2.6%.Private Service Providing 2,046,500 11,900 0.6% 56,400 2.8%..Trade, Transportation, and Utilities 607,500 -800 -0.1% 12,600 2.1%...Wholesale Trade 170,100 -400 -0.2% 1,400 0.8%....Merchant Wholesalers, Durable Goods 97,400 -500 -0.5% 400 0.4%.....Professional and Commercial Equipment and Supplies Merchant Wholesale 12,800 100 0.8% 200 1.6%....Merchant Wholesalers, Nondurable Goods 44,800 -100 -0.2% -500 -1.1%...Retail Trade 302,100 -1,200 -0.4% 9,500 3.2%....Motor Vehicle and Parts Dealers 40,200 300 0.8% 1,800 4.7%....Building Material and Garden Equipment and Supplies Dealers 22,400 -400 -1.8% 400 1.8%....Food and Beverage Stores 62,700 0 0.0% 1,600 2.6%....Health and Personal Care Stores 18,800 200 1.1% 100 0.5%....Clothing and Clothing Accessories Stores 28,300 -800 -2.7% -900 -3.1%....General Merchandise Stores 65,900 100 0.2% 1,200 1.9%.....Department Stores 21,800 400 1.9% 300 1.4%.....Other General Merchandise Stores 44,100 -300 -0.7% 900 2.1%...Transportation, Warehousing, and Utilities 135,300 800 0.6% 1,700 1.3%....Utilities 16,100 100 0.6% 200 1.3%.....Air Transportation 20,500 100 0.5% -200 -1.0%.....Truck Transportation 25,900 200 0.8% 1,300 5.3%.....Pipeline Transportation 10,500 0 0.0% 200 1.9%..Information 33,900 100 0.3% 600 1.8%...Telecommunications 15,000 100 0.7% -100 -0.7%..Financial Activities 146,700 700 0.5% -1,400 -0.9%...Finance and Insurance 94,100 200 0.2% 400 0.4%....Credit Intermediation and Related Activities 42,600 -200 -0.5% -1,200 -2.7%.....Depository Credit Intermediation 28,200 -200 -0.7% -700 -2.4%....Securities, Commodity Contracts, and Other Financial Investments and Related Activities 18,800 200 1.1% 1,000 5.6%....Insurance Carriers and Related Activities 32,200 200 0.6% 400 1.3%...Real Estate and Rental and Leasing 52,600 500 1.0% -1,800 -3.3%
Month Change Year Change

7
NONAGRICULTURAL EMPLOYMENTHouston-The Woodlands-Sugar Land MSA JUN 2015 Net Percent Net Percent..Professional and Business Services 477,700 6,500 1.4% 10,900 2.3%...Professional, Scientific, and Technical Services 224,600 1,500 0.7% 7,400 3.4%....Legal Services 25,100 0 0.0% 1,000 4.1%....Accounting, Tax Preparation, Bookkeeping, and Payroll Services 23,000 100 0.4% 1,100 5.0%....Architectural, Engineering, and Related Services 74,200 -800 -1.1% -100 -0.1%....Computer Systems Design and Related Services 33,300 900 2.8% 1,000 3.1%...Management of Companies and Enterprises 33,400 300 0.9% -1,200 -3.5%...Administrative and Support and Waste Management and Remediation Services 219,700 4,700 2.2% 4,700 2.2%....Administrative and Support Services 207,800 4,600 2.3% 3,700 1.8%.....Employment Services 79,600 2,200 2.8% -1,800 -2.2%.....Services to Buildings and Dwellings 51,700 1,000 2.0% 1,400 2.8%..Educational and Health Services 361,700 -1,500 -0.4% 14,300 4.1%...Educational Services 52,500 -2,000 -3.7% 1,800 3.6%...Health Care and Social Assistance 309,200 500 0.2% 12,500 4.2%....Ambulatory Health Care Services 148,800 1,000 0.7% 8,200 5.8%....Hospitals 82,400 100 0.1% 4,800 6.2%..Leisure and Hospitality 312,900 5,300 1.7% 18,800 6.4%...Arts, Entertainment, and Recreation 34,800 1,400 4.2% 2,000 6.1%...Accommodation and Food Services 278,100 3,900 1.4% 16,800 6.4%....Accommodation 26,500 600 2.3% 1,500 6.0%....Food Services and Drinking Places 251,600 3,300 1.3% 15,300 6.5%..Other Services 106,100 1,600 1.5% 600 0.6%Government 379,400 -7,200 -1.9% 5,500 1.5%.Federal Government 27,900 0 0.0% 300 1.1%.State Government 70,300 -2,100 -2.9% 300 0.4%..State Government Educational Services 37,800 -2,000 -5.0% 300 0.8%.Local Government 281,200 -5,100 -1.8% 4,900 1.8%..Local Government Educational Services 194,900 -5,000 -2.5% 4,300 2.3%
UNEMPLOYMENT RATE JUN 2015 MAY 2015 JUN 2014H-W-S MSA 4.5 4.2 5.3
Texas (Actual) 4.4 4.1 5.4
United States (Actual) 5.5 5.3 6.3
Month Change Year Change
Houston-The Woodlands-Sugar Land MSA: Includes Austin, Brazoria, Chambers, Ft. Bend, Galveston, Harris, Liberty, Montgomery, and Waller Counties. All Data is Subject To Revision. Sources: U.S. Department of Labor, BLS, Texas Workforce Commission, Institute for Supply Management, Baker Hughes Incorporated, Kiley Advisors, Metrostudy, and The Federal Reserve Bank of Dallas.

Workforce Demands
In the Health Care Industry
Workforce Solutions
August 2015
*Workforce Solutions is an affiliate of the Gulf Coast Workforce Board, which manages a
regional workforce system that helps employers solve their workforce problems and residents build careers so both can compete in the global economy. The workforce system serves
the City of Houston and the surrounding 13 Texas Gulf Coast counties including: Austin, Brazoria, Chambers, Colorado, Fort Bend, Galveston, Harris
Liberty, Matagorda, Montgomery, Walker, Waller, and Wharton.

Workforce Demands in the Health Care Industry August 2015
This report is intended to provide an overview from a workforce stance on the state of the health care industry, its subsectors, and the challenges the Gulf Coast Region faces now and in the future to serve the industry.
An Overview of Health Care
While the center of attention when discussing the Gulf Coast Region’s economy is often focused on the oil and gas industry, the health care industry remains one of the region’s most powerful economic forces. The healthcare industry is currently undergoing a major transition period with the implementation of the Affordable Care Act, an aging population, and advances in technology. The region is home of the Texas Medical Center, the world's largest medical complex that boasts some impressive figures:
• More than 7.2 million visits per year from all over the world • One baby delivered about every 20 minutes • 7,000 patient beds • 106,000 employees
With a population of more than six million that is growing at a pace that more than doubles the nation’s, the health care industry is a great source of jobs and will continue to be in the future. Increasing demand is not only driving growth at the Texas Medical Center but also in the suburbs as providers reach out to population demand for more convenient access to hospitals, health clinics, urgent care centers, and specialized medical facilities. The health care industry provides an extensive range of career opportunities. Growth is projected for numerous occupations throughout the industry, from nursing assistants to medical physicians. Many of these positions offer good wages and have varying education and training requirements ranging anywhere from short term on-the-job training to post-secondary degrees and professional licenses.

Workforce Demands in the Health Care Industry August 2015
2
Economic Cycles and Health Care Employment While many industries have a tendency to rise and fall during economic cycles, the Health Care Industry continued to prosper throughout historical recessions including the most recent which ended June 2009. This can be seen in Chart 1. The only time in recent history when over-the-year job growth turned negative was a brief period in late 1999.
Source: Texas Workforce Commission LMCI Dept. - Quarterly Census of Employment and Wages. Components of the Health Care Industry There are three subsectors of the Health Care Industry: Ambulatory Health Care Services, Hospitals, and Nursing and Residential Care Facilities.
• Ambulatory Health Care Services includes physicians, dentists, outpatient care centers, imaging and diagnostic facilities, and home health care services
• Hospitals includes general medical and surgical hospitals, psychiatric and substance abuse hospitals, and other (specialty) hospitals
• Nursing and Residential Care Facilities provide residential care combined with either nursing, supervisory, or other types of care as required by the residents
0
50,000
100,000
150,000
200,000
250,000
300,000
-2.00%
-1.00%
0.00%
1.00%
2.00%
3.00%
4.00%
5.00%
6.00%
7.00%
8.00%
Chart 1. Gulf Coast RegionHealth Care Industry
Over-the-Year Job Growth1990-2014
Recession Health Care Over-the-Year Growth Rate Total Health Care Employment

Workforce Demands in the Health Care Industry August 2015
3
A Change in the Delivery of Services Times are changing and no longer are the days where the majority of surgeries and many medical and diagnostic procedures require a visit to the hospital. Chart 2 shows the percentage of health care jobs by subsector in 1990 and 2014. The share of health care employment in Hospitals has fallen from 51.0% in 1990 to 38.4% in 2014 while the share of Ambulatory Health Care Services increased from 36.7% to 49.8%.
Source: Texas Workforce Commission LMCI Dept. - Quarterly Census of Employment and Wages. While all three subsectors of the health care industry continue to grow, Ambulatory Health Care Services has replaced Hospitals as the number one job producer in the region, see Chart 3.
Source: Texas Workforce Commission LMCI Dept. - Quarterly Census of Employment and Wages.
36.7%51.0%
12.3%
49.8%38.4%
11.8%
Ambulatory Health Care Services Hospitals Nursing and Residential Care Facilities
Chart 2. Gulf Coast RegionHealth Care Employment
1990 and 2014
1990 2014
-
20,000
40,000
60,000
80,000
100,000
120,000
140,000
Chart 3. Gulf Coast RegionHealth Care Employment
1990-2014Recession Ambulatory Health Care Services Hospitals Nursing and Residential Care Facilities
January Employment 1990 1994 1998 2002 2006 2010 2014
Percent Increase
1990 to 2014Ambulatory Health Care Services 47,690 57,348 108,664 82,716 98,730 121,475 140,863 195.4%Hospitals 67,963 73,228 97,405 83,146 89,898 102,428 109,363 60.9%Residential and Nursing Care Facilities 15,881 18,505 28,060 24,885 26,993 30,469 33,158 108.8%

Workforce Demands in the Health Care Industry August 2015
4
Roughly one-third of the employment in Ambulatory Health Care Services is found in Home Health Care, the fastest growing detailed industry which added more than 35,000 jobs from 1990 to 2014, see Chart 4. As the average life expectancy increases, consumers are looking for care that allows them to stay in their homes. Another one-third of the employment is found in Offices of Physicians, which added more than 29,000 jobs from 1990 to 2014. Outpatient Care Centers was the second fastest growing detailed industry from 1990 to 2014. Growth at outpatient care centers is also related to increased life expectancies as well as population growth as more and more people seek treatment for chronic conditions.
Source: Texas Workforce Commission LMCI Dept. - Quarterly Census of Employment and Wages.
-
10,000
20,000
30,000
40,000
50,000
60,000
Chart 4. Gulf Coast RegionAmbulatory Health Care Services
1990-2014
Recession Offices of Physicians
Offices of Dentists Offices of Other Healthcare Practitioners
Outpatient Care Centers Medical and Diagnostic Laboratories
Home Health Care Other Ambulatory Health Care Services
January Employment 1990 1994 1998 2002 2006 2010 2014Percent Increase
1990 to 2014Offices of Physicians 17,879 21,094 25,134 31,121 34,677 44,092 47,114 163.5%Offices of Dentists 6,840 7,909 9,474 10,852 12,041 13,572 15,788 130.8%Offices of Other Healthcare 4,383 5,933 6,845 7,703 8,028 8,954 11,138 154.1%Outpatient Care Centers 2,898 3,027 5,325 5,277 7,015 6,515 10,041 246.5%Medical and Diagnostic Laboratories 1,724 2,247 2,719 3,649 3,782 4,696 4,792 178.0%Home Health Care 11,775 15,720 25,292 20,728 28,826 38,411 47,016 299.3%Other Ambulatory Health Care Services 2,191 1,418 2,922 3,386 4,361 5,235 4,974 127.0%

Workforce Demands in the Health Care Industry August 2015
5
Hospitals account for the second largest number of jobs in healthcare. The industry has added jobs at a steady but much slower pace than Ambulatory Health Care Services. The majority of employment in Hospitals is found in General Medical and Surgical Hospitals where payrolls increased by nearly 30,000 from 1990 to 2014, see Chart 5. Other Hospitals was the fastest growing detailed industry with payrolls rising some 97 percent from 1990 to 2014. Hospitals providing long-term care for the chronically ill, rehabilitation, and restorative services to physically-challenged or disabled people are included in this industry.
Source: Texas Workforce Commission LMCI Dept. - Quarterly Census of Employment and Wages.
-
10,000
20,000
30,000
40,000
50,000
60,000
70,000
80,000
90,000
100,000
Chart 5. Gulf Coast RegionHospitals1990-2014
Recession General Medical and Surgical Hospitals
Psychiatric and Substance Abuse Hospitals Other Hospitals
January Employment 1990 1994 1998 2002 2006 2010 2014Percent Increase
1990 to 2014General Medical and Surgical Hospitals 54,796 61,857 58,004 65,601 68,556 78,714 84,339 53.9%Psychiatric and Substance Abuse Hospitals 2,013 1,746 1,226 1,917 3,108 3,387 3,034 50.7%Other Hospitals 11,154 9,625 10,674 15,628 18,234 20,327 21,990 97.1%

Workforce Demands in the Health Care Industry August 2015
6
Representing the smallest portion of jobs in the health care industry in 2014, about 12 percent, Nursing and Residential Care Facilities added jobs at the second fastest pace from 1990 to 2014. More than half of the employment was in Nursing Care Facilities where businesses providing extended care in-patient nursing and rehabilitative services are found, see Chart 6. Community Care Facilities for the Elderly added jobs at a pace that triples any other detailed industry sectors in Nursing and Residential Care Facilities from 1990 to 2014.
Source: Texas Workforce Commission LMCI Dept. - Quarterly Census of Employment and Wages.
-
5,000
10,000
15,000
20,000
25,000
Chart 6. Gulf Coast RegionNursing and Residential Care Facilities
1990-2014
Recession Nursing Care Facilities
Residential Mental Health Facilities Community Care Facilities for the Elderly
Other Residential Care Facilities
January Employment 1990 1994 1998 2002 2006 2010 2014
Percent Increase
1990 to 2014Nursing Care Facilities 8,810 9,980 10,968 12,007 14,176 15,167 16,988 92.8%Residential Mental Health Facilities 3,676 4,565 5,158 5,761 5,700 6,380 6,268 70.5%Community Care Facilities for the Elderly 2,076 3,016 4,061 5,738 5,729 7,682 8,734 320.7%Other Residential Care Facilities 1,319 944 1,433 1,379 1,388 1,240 1,168 -11.4%

Workforce Demands in the Health Care Industry August 2015
7
Wages
Hospitals have the largest concentration of high skilled workers thus offering the highest average pay of $1,306.61 per week in 2014. Average wages at hospitals also increased at the highest pace since 1990, up 216 percent. Ambulatory Health Services paid the average worker $929.60 per week in 2014. Average weekly wages in ambulatory health services increased at a much slower pace than hospitals since 1990, up 78.8 percent. Average weekly wages in Nursing and Residential Care Facilities were much lower, $549.60 in 2014. This industry sector has a high concentration of occupations that help patients perform many basic daily tasks thus requiring lower entry requirements resulting in a much lower average weekly wage.
Source: Texas Workforce Commission LMCI Dept. - Quarterly Census of Employment and Wages.
$231.32
$385.09
$516.73 $549.60 $519.93
$666.87
$841.45 $929.60
$414.06
$734.76
$1,080.38
$1,306.61
1990 2000 2010 2014
Chart 7. Gulf Coast RegionHealth Care Average Weekly Wages
1990-2014
Nursing and Residential Care Facilities Ambulatory Health Care Services Hospitals

Workforce Demands in the Health Care Industry August 2015
8
Challenges
An Aging Workforce A large factor which has contributed to recent workforce shortages is an aging population. The percentage of the population that is 55 and over has risen by 6 percent since 2000 and is expected to rise another 2 percent by 2018 to 23.4 percent.
The age of the health care workforce is increasing rapidly with the number approaching retirement age compounding the severity of workforce shortages in the region over the recent expansion period. The percentage of workers ages 55 and over in the health care industry nearly doubled from 12 percent in 2000 to 21 percent in 2014, see Chart 8 and 9.
Nearly 58,000 individuals with expertise in the industry are approaching retirement age, see Chart 10.
Number Percent Number Percent Number Percent Number Percent
Total 4,854,389 100.00% 6,087,133 100.00% 6,499,962 100.00% 7,064,464 100.00%Age 55+ 739,122 15.2% 1,156,059 19.0% 1,378,021 21.2% 1,650,040 23.4%
Population by Age
2000 Census 2010 CENSUS 2014 ESTIMATE 2018 FORECAST
14-5488%
55 and Over12%
Chart 8. Gulf Coast RegionAge of Health Care Workforce
First Quarter 2000
Source: U.S. Census Bureau
14-5479%
55 and Over21%
Chart 9. Gulf Coast RegionAge of Health Care Workforce
First Quarter 2014
Source: U.S. Census Bureau
1,566 5,100
8,291
45,018 52,292
40,831
16,054
3,843 916 5,530
12,350
67,130 71,667
63,976
44,873
13,082
-
10,000
20,000
30,000
40,000
50,000
60,000
70,000
80,000
14-18 19-21 22-24 25-34 35-44 45-54 55-64 65-99
Chart 10. Gulf Coast RegionAge of Health Care Workforce
2000 2014Source: U.S. Census Bureau

Workforce Demands in the Health Care Industry August 2015
9
Technological Advances Technological advances are affecting the delivery of health care and prompting changes in the skills required for many health occupations.
• New technologies and medical treatments are becoming more complex with many healthcare workers taking on new roles and new responsibilities
• Advances in health informatics are changing the skills requirements of many healthcare workers and fostering specializations in the industry helping to improve the quality and safety of patient care
The Affordable Care Act The Affordable Care Act (ACA) is expected to create more demand for healthcare services and change the way services are delivered. The need for primary care workers such as nurses, medical doctors, and nurse practitioners are expected to increase. Educational Capacity A lack of training capacity continues to be a problem with long waiting lists for many programs. Expansion of local educational opportunities has been difficult due to funding, faculty, classroom, laboratory and clinical space.

Workforce Demands in the Health Care Industry August 2015
10
The Future of Health Care
The health care industry has been a stable career choice for decades. This is in part due to the fact that people need health services regardless of the state of the economy. Add in the rapidly growing population and the result is a much higher than average pace of growth than most industries. In 2012, there were more than 268,000 jobs in the health care industry according to estimates produced by the Texas Workforce Commission, see Table 1. It is projected to add more jobs, nearly 88,000, than any other major industry between 2012 and 2022. Ambulatory Health Care Services are expected to increase payrolls by 37.4 percent from 2012 to 2022 and will account for the largest number of jobs in healthcare representing about 52 percent of total healthcare employment in 2022. Employers in this industry include offices of physicians, dentists, and other health practitioners. Hospitals are expected to increase payrolls by 28.7 percent from 2012 to 2022 and will account for about 37 percent of total healthcare employment in 2022. Nursing & Residential Care Facilities are expected to increase payrolls by 25.7 percent from 2012 to 2022 and will account for about 11 percent of total healthcare employment in 2022.
Source: Texas Workforce Commission LMCI Dept.
Industry Number PecentCode Industry Title 2012 2022 Change Change
Total Health Care 268,150 355,990 87,840 32.8%621 Ambulatory Health Care Services 135,230 185,800 50,570 37.4%
6211 Offices of Physicians 46,410 63,310 16,900 36.4%6212 Offices of Dentists 15,130 19,110 3,980 26.3%6213 Offices of Other Health Practitioners 10,560 13,770 3,210 30.4%6214 Outpatient Care Centers 7,860 13,140 5,280 67.2%6215 Medical & Diagnostic Laboratories 4,760 6,750 1,990 41.8%6216 Home Health Care Services 46,520 64,440 17,920 38.5%6219 Other Ambulatory Health Care Services 3,990 5,280 1,290 32.3%
622 Hospitals, Public & Private 102,260 131,650 29,390 28.7%6221 General Medical & Surgical Hospitals, Public & Private 77,730 99,700 21,970 28.3%
623 Nursing & Residential Care Facilities 30,660 38,540 7,880 25.7%6231 Nursing Care Facilities, Skilled Nursing 16,660 21,730 5,070 30.4%6232 Residential Mental Facilities 4,240 4,940 700 16.5%6233 Continuing Care & Assisted Living Facilities 8,360 10,230 1,870 22.4%6239 Other Residential Care Facilities 1,410 1,640 230 16.3%
Annual Average Employment
Table 1. Gulf Coast Region Projections

Workforce Demands in the Health Care Industry August 2015
11
Occupational Demand in the Health Care Industry
Table 2 represents the top 20 health care related occupations in the health care industry and their estimated growth across all industries from 2012 to 2022.
Source: Texas Workforce Commission LMCI Dept. Eight of the top 20 health care occupations are currently on the Gulf Coast Workforce Board’s list of targeted high-skill high-growth occupations:
• Registered Nurse • Licensed Practical & Licensed Vocational Nurses • Radiologic Technologists and Technicians • Medical Records & Health Information Technicians • Medical & Clinical Laboratory Technologists • Respiratory Therapists • Physical Therapists • Physicians & Surgeons, All Other
OCC. CODE OCCUPATIONAL TITLE 2012 2022
10 Year Number Change
10 Year Pct Chg
Total Annual
Demand2014 Avg Hrly Wage
29-1141 Registered Nurse 45,160 58,710 13,550 30.0% 2,230 $ 36.19
39-9021 Personal Care Aides 40,090 55,770 15,680 39.1% 1,855 $ 8.52 43-6013 Medical Secretaries 18,950 26,880 7,930 41.8% 1,025 $ 15.48
31-1014 Nursing Assistants 18,210 23,670 5,460 30.0% 890 $ 12.17
31-9092 Medical Assistants 12,210 16,330 4,120 33.7% 645 $ 14.06
29-2061 Licensed Practical & Licensed Vocational Nurses 15,100 19,400 4,300 28.5% 800 $ 23.30 31-1011 Home Health Aides 9,480 13,160 3,680 38.8% 550 $ 9.79
31-9091 Dental Assistants 5,600 6,930 1,330 23.8% 250 $ 16.64
29-1069 Physicians & Surgeons, All Other 4,360 5,760 1,400 32.1% 250 $ 96.91 11-9111 Medical & Health Services Managers 4,540 5,910 1,370 30.2% 245 $ 52.19
29-2021 Dental Hygienists 3,020 3,980 960 31.8% 170 $ 35.33 29-2034 Radiologic Technologies 3,250 4,290 1040 32.0% 150 $ 26.46
29-2071 Medical Records & Health Information Technicians 3,970 5,190 1,220 30.7% 225 $ 19.44
29-2041 Emergency Medical Technicians 3,550 4,570 1020 28.7% 195 $ 16.85
29-2011 Medical & Clinical Laboratory Technologists 3,230 4,060 830 25.7% 170 $ 28.75
29-2012 Medical & Clinincal Laboratory Technicians 2,700 3,810 1110 41.1% 180 $ 19.11 29-2055 Surgical Technologists 2,190 3,070 880 40.2% 110 $ 22.09
29-1126 Respiratory Therapists 2,610 3,400 790 30.3% 120 $ 27.80
29-1123 Physical Therapists 2,780 3,690 910 32.7% 160 $ 43.30
31-9097 Phlebotomists 1,930 2,570 640 33.2% 100 $ 15.25
Table 2. Gulf Coast RegionTop 20 Health Occupations
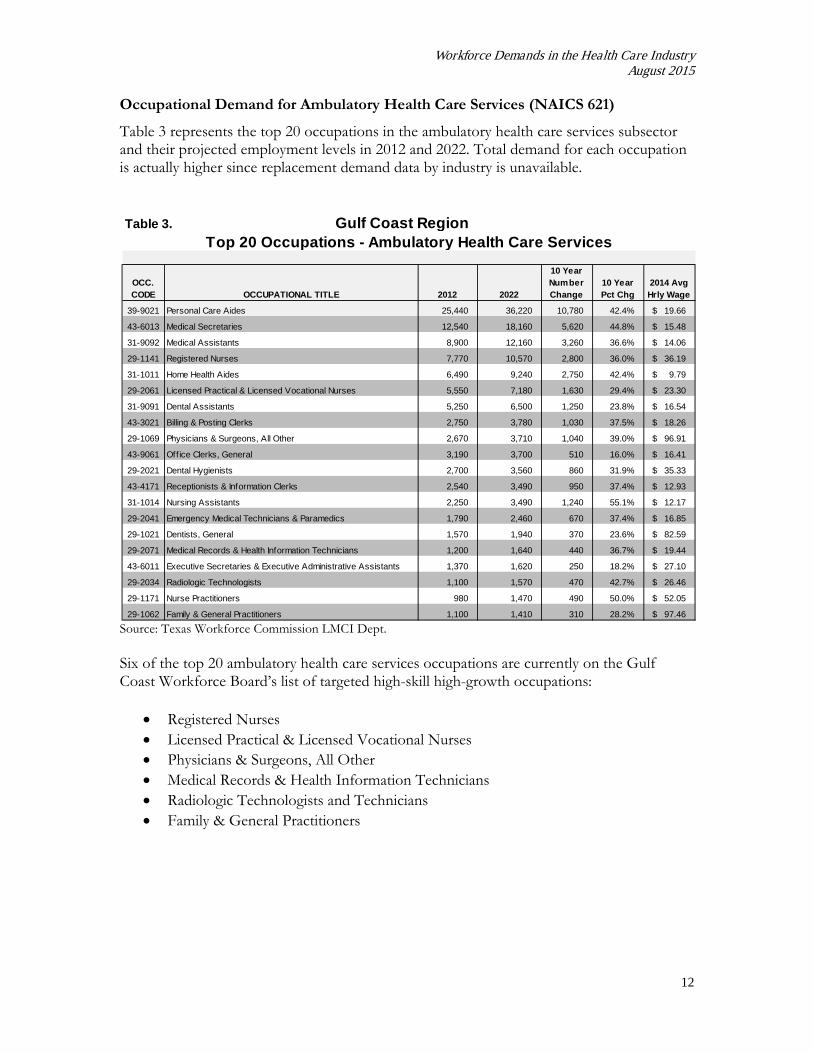
Workforce Demands in the Health Care Industry August 2015
12
Occupational Demand for Ambulatory Health Care Services (NAICS 621)
Table 3 represents the top 20 occupations in the ambulatory health care services subsector and their projected employment levels in 2012 and 2022. Total demand for each occupation is actually higher since replacement demand data by industry is unavailable.
Source: Texas Workforce Commission LMCI Dept. Six of the top 20 ambulatory health care services occupations are currently on the Gulf Coast Workforce Board’s list of targeted high-skill high-growth occupations:
• Registered Nurses • Licensed Practical & Licensed Vocational Nurses • Physicians & Surgeons, All Other • Medical Records & Health Information Technicians • Radiologic Technologists and Technicians • Family & General Practitioners
OCC. CODE OCCUPATIONAL TITLE 2012 2022
10 Year Number Change
10 Year Pct Chg
2014 Avg Hrly Wage
39-9021 Personal Care Aides 25,440 36,220 10,780 42.4% $ 19.66
43-6013 Medical Secretaries 12,540 18,160 5,620 44.8% $ 15.48
31-9092 Medical Assistants 8,900 12,160 3,260 36.6% $ 14.06
29-1141 Registered Nurses 7,770 10,570 2,800 36.0% $ 36.19
31-1011 Home Health Aides 6,490 9,240 2,750 42.4% $ 9.79
29-2061 Licensed Practical & Licensed Vocational Nurses 5,550 7,180 1,630 29.4% $ 23.30
31-9091 Dental Assistants 5,250 6,500 1,250 23.8% $ 16.54
43-3021 Billing & Posting Clerks 2,750 3,780 1,030 37.5% $ 18.26
29-1069 Physicians & Surgeons, All Other 2,670 3,710 1,040 39.0% $ 96.91
43-9061 Office Clerks, General 3,190 3,700 510 16.0% $ 16.41
29-2021 Dental Hygienists 2,700 3,560 860 31.9% $ 35.33
43-4171 Receptionists & Information Clerks 2,540 3,490 950 37.4% $ 12.93
31-1014 Nursing Assistants 2,250 3,490 1,240 55.1% $ 12.17
29-2041 Emergency Medical Technicians & Paramedics 1,790 2,460 670 37.4% $ 16.85
29-1021 Dentists, General 1,570 1,940 370 23.6% $ 82.59
29-2071 Medical Records & Health Information Technicians 1,200 1,640 440 36.7% $ 19.44
43-6011 Executive Secretaries & Executive Administrative Assistants 1,370 1,620 250 18.2% $ 27.10
29-2034 Radiologic Technologists 1,100 1,570 470 42.7% $ 26.46
29-1171 Nurse Practitioners 980 1,470 490 50.0% $ 52.05
29-1062 Family & General Practitioners 1,100 1,410 310 28.2% $ 97.46
Table 3. Gulf Coast RegionTop 20 Occupations - Ambulatory Health Care Services

Workforce Demands in the Health Care Industry August 2015
13
Occupational Demand for Hospitals (NAICS 622)
Table 4 represents the top 20 occupations in the hospitals subsector and their projected employment levels in 2012 and 2022. Total demand for each occupation is actually higher since replacement demand data by industry is unavailable.
Source: Texas Workforce Commission LMCI Dept. Seven of the top 20 hospital occupations are currently on the Gulf Coast Workforce Board’s list of targeted high-skill high-growth occupations:
• Registered Nurses • Licensed Practical & Licensed Vocational Nurses • Medical & Clinical Laboratory Technologists • Radiologic Technologists • Respiratory Therapists • Medical Records & Health Information Technicians • Physical Therapists
OCC. CODE OCCUPATIONAL TITLE 2012 2022
10 Year Number Change
10 Year Pct Chg
2014 Avg Hrly Wage
29-1141 Registered Nurses 28,820 37,520 8,700 30.2% $ 36.19
43-6013 Medical Secretaries 4,570 6,300 1,730 37.9% $ 15.48
31-1014 Nursing Assistants 4,800 6,130 1,330 27.7% $ 12.17
29-2061 Licensed Practical & Licensed Vocational Nurses 3,450 4,050 600 17.4% $ 23.30
29-2011 Medical & Clinical Laboratory Technologists 2,660 3,370 710 26.7% $ 28.75
31-9092 Medical Assistants 1,880 2,410 530 28.2% $ 14.60
29-2034 Radiologic Technologists 1,790 2,290 500 27.9% $ 26.46
29-1126 Respiratory Therapists 1,770 2,270 500 28.2% $ 27.80
11-9111 Medical & Health Services Managers 1,610 2,090 480 29.8% $ 52.19
29-2055 Surgical Technologists 1,470 2,080 610 41.5% $ 22.09
37-2011 Janitors & Cleaners, Ex. Maids & Housekeeping Cleaners 1,620 2,060 440 27.2% $ 10.06
29-2071 Medical Records & Health Information Technicians 1,580 2,050 470 29.7% $ 19.44
29-1051 Pharmacists 1,380 1,900 520 37.7% $ 55.44
29-2052 Pharmacy Technicians 1,380 1,780 400 29.0% $ 15.86
31-1013 Psychiatric Aides 1,360 1,620 260 19.1% $ 11.83
37-2012 Maids & Housekeeping Cleaners 1,230 1,590 360 29.3% $ 9.06
29-1123 Physical Therapists 1,090 1,420 330 30.3% $ 43.30
43-3021 Billing & Posting Clerks 1,110 1,420 310 27.9% $ 18.26
43-9061 Office Clerks, General 1,020 1,120 100 9.8% $ 16.41
43-4051 Customer Service Representatives 840 1,070 230 27.4% $ 15.87
Table 4. Gulf Coast RegionTop 20 Occupations - Hospitals

Workforce Demands in the Health Care Industry August 2015
14
Occupational Demand for Nursing and Residential Care Facilities (NAICS 623)
Table 5 represents the top 20 occupations in the nursing and residential care facilities subsector and their projected employment levels in 2012 and 2022. Total demand for each occupation is actually higher since replacement demand data by industry is unavailable.
Source: Texas Workforce Commission LMCI Dept. Two of the top 20 nursing and residential care facilities occupations are currently on the Gulf Coast Workforce Board’s list of targeted high-skill high-growth occupations:
• Registered Nurses • Licensed Practical & Licensed Vocational Nurses
OCC. CODE OCCUPATIONAL TITLE 2012 2022
10 Year Number Change
10 Year Pct Chg
2014 Avg Hrly Wage
31-1014 Nursing Assistants 7,420 9,110 1,690 22.8% $ 12.17
29-2061 Licensed Practical & Licensed Vocational Nurses 3,330 4,710 1,380 41.4% $ 23.30
39-9021 Personal Care Aides 3,140 3,800 660 21.0% $ 8.52
37-2012 Maids & Housekeeping Cleaners 1,310 1,700 390 29.8% $ 9.06
29-1141 Registered Nurses 1,030 1,350 320 31.1% $ 36.19
35-2012 Cooks, Institution & Cafeteria 1,010 1,270 260 25.7% $ 11.18
31-1011 Home Health Aides 690 890 200 29.0% $ 9.79
35-3041 Food Servers, Nonrestaurant 630 850 220 34.9% $ 9.52
39-9041 Residential Advisors 550 640 90 16.4% $ 11.83
51-6011 Laundry & Dry-Cleaning Workers 440 580 140 31.8% $ 9.94
49-9071 Maintenance & Repair Workers, General 410 520 110 26.8% $ 17.94
31-9092 Medical Assistants 390 510 120 30.8% $ 14.06
39-9032 Recreation Workers 390 510 120 30.8% $ 11.78
35-2021 Food Preparation Workers 490 470 -20 -4.1% $ 9.82
31-1015 Orderlies 350 460 110 31.4% $ 11.31
43-9061 Office Clerks, General 340 390 50 14.7% $ 16.41
35-3021 Combined Food Preparation & Serving Workers, Incl. Fast Food 260 350 90 34.6% $ 8.79
11-9111 Medical & Health Services Managers 240 310 70 29.2% $ 52.19
31-1013 Psychiatric Aides 250 290 40 16.0% $ 11.83
29-2071 Medical Records & Health Information Technicians 220 280 60 27.3% $ 19.44
Table 5. Gulf Coast RegionTop 20 Occupations - Nursing and Residential Care Facilities

Workforce Demands in the Health Care Industry August 2015
15
Notes and Limitations Health Care Historical Employment The Current Employment Statistics (CES) program of the Bureau of Labor Statistics produces nonfarm industry employment estimates for the Houston-The Woodlands-Sugar Land Metropolitan Statistical Area (MSA) based on a monthly employer’s survey. While the data is more current, it is not available at the detail needed to discuss the health care industry. Payroll data acquired from the Texas Workforce Commission enables a more detailed view of employment for the region. Historical data in this report was compiled from quarterly employment reports submitted by employers subject to the Texas Unemployment Compensation Act. Projection Limitations
Industry and occupation projections are funded by the Employment and Training Administration, U.S. Department of Labor and updated every two years. The methodology involves four primary steps:
• Identify industry historical trends • Develop industry employment projections • Develop occupation staffing patterns for each industry • Develop occupation employment projections
The projections will foretell the general industry and occupational trends and act as an indicator of relative magnitude and probable direction as opposed to an estimate of absolute values. Additional detail on projection methodology and its limitations can be found at: http://www.tracer2.com/?PAGEID=67&SUBID=114