Embed Size (px)
Citation preview

Harry Moser
President
Reshoring Initiative NTMA
To Offshore or Reshore:
How to Help your Customer Objectively Decide

Agenda
Overview 50 min
Break 10
Website:
TCO, Library, Case Studies 20
Your reshoring cases 10
Discussion on using TCO 20
Q&A 10
Total 120 min

Suggested priorities re reshoring
1. Keep existing domestic sources
2. Shift outsourcing back
3. Repurpose offshore own-facility to serve the offshore
market. Incrementally invest domestically to serve domestic
market
4. Shut offshore own facility. Build new domestic facility.

Definitions
Reshoring/Backshoring/Onshoring/Insourcing:
Bringing back manufacture of products that will
be sold or assembled here.
Transplants: Similar motivation/economics
Producing near the consumer!

Geographic sourcing alternatives
The concept also works in other countries

Offshoring: partially herd behavior
A ‘herd’ mentality to participate in the ‘Chinese miracle’ developed among global giant corporations --{Peter Nolan; University of Cambridge; - 9/03
“There is a herd mentality with OEMs in China —sometimes it makes sense, sometimes it doesn’t—not always rational decision…
People tell their bosses what they want to hear—(going to China) gives a boost to the stock valuation, but you really have to do the analysis on a case by case basis.” {Technology Forecasters 10/03
Source: Stone & Associates

Flawed company economic model
60% of manufacturers:
Apply “rudimentary” total cost models
Ignore 20% or more of the total cost of
offshored products
Source: Archstone Consulting survey, American Machinist Mag., 7/16/09

“Manufacturing Is Expected to Return to America”
“Renaissance in Manufacturing”
“We expect net labor costs for
manufacturing in China and the U.S. to
converge by around 2015” “take a hard look at the total costs”
Source: Boston Consulting Group press release 5/11 & 4/12
Source: Michelle D. Loyalka, 2/17/12 NYT
Chinese no longer ”just thankful not to go hungry.”

The Industry-Led Initiative Provides
Free Total Cost of Ownership (TCO) Software for companies and suppliers
Online Library of 300+ reshoring articles
Case Study template for posting cases.
Media coverage of the trend: WSJ, Fox Business, USA Today, IW, CBS, CNBC, etc.
~100 presentations/year nationwide
Motivation for skilled manufacturing careers
Solutions to major supply chain problems

Some major global supply chain problems
Fragility: Natural disasters: Japan tsunami, Thai flood, European
volcano
Political instability
Chinese and other LLCC wages and environmental costs rising rapidly
U.S. $ declining
Oil soaring

TCO Estimator benefits
Provides a single TCO for each source
Flexible: values are 100% user selected.
Broad: 29 cost factors.
Via pull down menus you automatically insert:
Freight rates for 17 countries
Duty rates for parts or tools, e.g. molds
Current value and 5 year forecast of TCO.
Easy to use: Explanations and references to help select values.
Free

TCO Example: a Part
Chinese unit price $70
U.S. unit price $100
# units/year 12,000
unit weight, lbs 2
Shipments/year 6
product life, yrs 5
Packaging* 1%
Payment on shipment
Yes
Quality* 2%
* Chinese differential vs. U.S.
Product liability risk* 0.5%
IP risk* 1.9%
Innovation* 0.5%
Trips/yr 2
Carrying cost, rate 22%
Emergency air freight %* 5%
Wage inflation, annual* 8%
Currency appreciation, annual* 5%

TCO Comparison Example

Cumulative Cost by Category
CUMULATIVE COST BY CATEGORY, YEAR 0: PARTS
$60
$70
$80
$90
$100
$110
Price
CoG
S
Oth
er H
ard
Risk
Strate
gic
Gre
en
COST CATEGORY
CU
MU
LA
TIV
E C
OS
T, U
.S. $
U.S.
China

Just using TCO could bring back 25% of offshoring
Comparison
Basis
U.S. % of
China price
or TCO,
average
% of cases
where U.S.
has the
advantage
Price 169% 15%
TCO 96% 56%*
Difference 73% 41%**
* For the 56%, the average U.S. TCO was 32% below China
**Conservatively 25% might return
Source: TCO user database 27 “real” 2012 cases China vs. U.S.

Deming on Total Cost
“End the practice of awarding business on the basis of
price tag. Instead, minimize total cost.”
Source: “4th Key Principle for Management,” Out of the
Crisis, W. Edwards Deming

Offshoring multiplies waste
Toyota Wastes Offshoring Contributes
Overproduction Large batch shipments, filling containers
Waiting Uncertain delivery/Inconsistent quality, port, customs,
shared “awake time” window for discussions
Transport 12,000 mi. inbound, 6,000 return (boat ½ full)
Overprocessing More packing and unpacking, customs paperwork,
Inventory In transit, cycle, safety stock, uncertain delivery and
quality, less ability to see and count
Motion Increased cost over time – repetitive motion injuries or
additional labor to compensate
Defects Much higher than local sources, extra inspection of
materials and tolerances, customers unhappy
longer

Offshoring impacts innovation
“exporting manufacturing has a negative impact on the
country's industrial commons, which represents the collective
capability to sustain innovation.”
Professors Gary Pisano and Willy Shih
Harvard Business School

And Product Strategy
Impact of batch size and distance: Offshoring → commoditization
Reshoring → differentiation/mass
customization

Water-heaters
Bringing Production back from China: Water-heater production
Unionized facility in Louisville, KY
400 jobs, renovated facility
Reasons:
Tax incentives
High-tech new model
Ease of design collaboration with workers: cut cost $20
2 tier contract
Chinese cost: -30% becomes +6% considering inventory and delivery problems
Will move a “significant piece” of appliance production back

Bailey Hydropower Hydraulic cylinders
Had 100,000 ft² in Chennai, India
Reshored to Westknoxville, TN
60,000 sq. ft.
Reasons:
Fast delivery vs. 5 wks on the water
Fewer supply chain problems
If a quality problem, no more bad units
en-route
Source: Knoxvillebiz.com Ed Marcum 8/7/10

Plastics, Cookware
China to Kewaskum, WI
Reasons:
Gained efficiency through lean manufacturing
Product delivery time shorter
Inventory turnover faster
Source: Bringing work back to America
By Don Loepp on September 24, 2008

High-end earphones
China to Manatee County, FL
Reasons:
$100Ks scrap
$Ms lost sales
emergency air freight
costs up
communications: language and time
~daily calls at 11 pm

Glucose monitoring systems
China to Charlotte, NC
Hiring 20
Reasons:
5 month delays replacing defective products
Automation, 40% cost reduction
IP control
Inventory down from $6.5M to $1M
Source: The case for back shoring Joe Kolakowski 1/27/10

Hydraulic die cutting presses
o From Taiwan to Cincinnati, OH
o Ability to Control Own Destiny
o Warranty Reduced by 90% on Custom Presses
o Improved Speed to Market – at Least 30 days
o Thus Far Created 17 Jobs
Builds Employee Skills & Morale
Restoring Long-Term “Made in USA” Heritage for Schwabe
Presses
Buttons
China to Clarkesville, GA
Reasons:
Salaries up
Expectations up
Rising Yuan
20-25% of employees did not return from annual holiday

Wright Engineered Plastics injection molding
China to Santa Rosa, CA
Medical and Telecom customers
4+ customers reshored, including JDS Uniphase
and ECO Funnel™
Reasons: Transport costs up
Wages up
Quality issues common and difficult to handle
Source: Design2Part mag, Yes, You Can Go Home Again, Say
Some Manufacturers by Mark Shortt

Welded assemblies for
aerospace and energy
From Hungary and China to Torrance, CA Added 80 jobs in the US and looking to hire more
Reasons Quality control issues overseas
Customers willing to pay more for high precision quality

Circuit boards
Woodridge, IL
Supplies many AEM members
Had quality issue with a Chinese component
Found local IL source
Result: Quality problem fixed
Inventory cut by 94%

Reshoring is happening!
61% of larger companies surveyed “are considering
bringing manufacturing back to the U.S.” (MIT forum for
Supply Chain Innovation 1Q12)
40% of contract manufacturers have done reshoring
work this year (MFG.com 4/12)
% of U.S. consumers who view products Made in
America very favorably: 78% (2012) up from 58%
(2010) (AAM June 28-July 2, 2012)
More likely to buy U.S. product 76%
Less likely to buy Chinese product 57% (Perception Research Services Intl. survey 7/12, 1400 consumers)

50,000 Manufacturing Jobs
since Jan 2010!
Reshoring yielded:
About 50,000 manufacturing jobs*
~ 10% of manufacturing job growth since the Jan. 2010 low
~ 100,000 total, including multiplier effect
* Source of estimate: Reshoring Initiative tabulation of jobs listed in 287
Reshoring Library articles, 85% published since Jan 2010
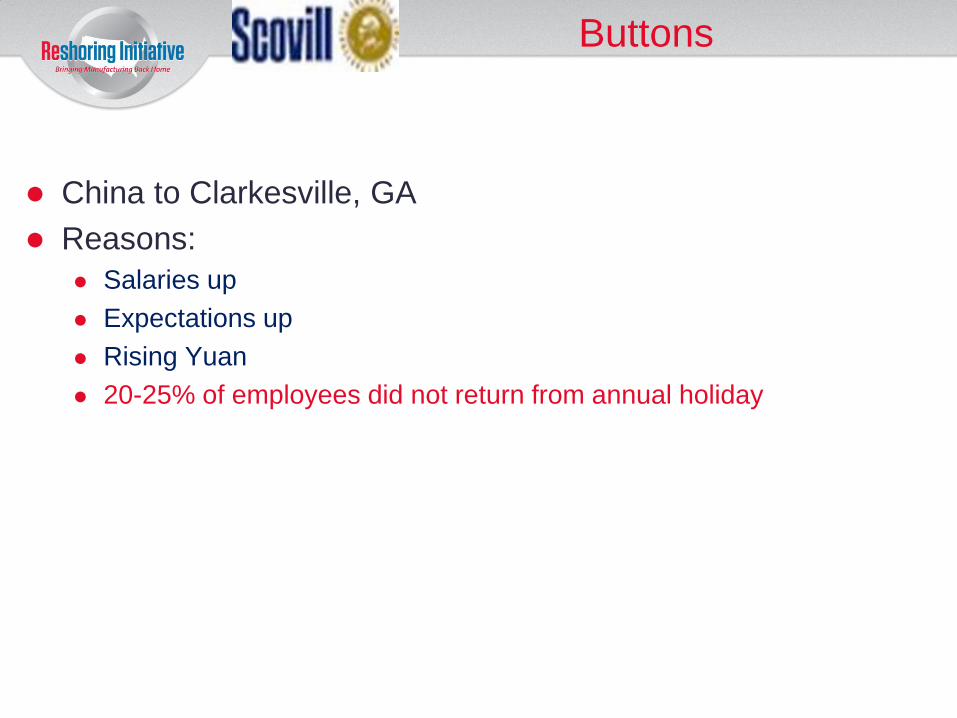
Industries of published cases
Industry Number Elec. equip, appliances &
components 37
Miscellaneous 33
Transportation equipment 27
Machinery 18
Furniture 11
Computer and electronics 9
Plastics and rubber 8
Fabricated metal parts 6
Clothing and textiles 3
Food and beverage 3
Chemicals 1
Primary metal 1
Oil & gas 1
SSource: Reshoring Library, July 2012
Source: Reshoring Library, July 2012

U.S. ManufacturingCompetitiveness:
for Exports
Paper
Electrical Eqpmt
Computer Eqpmt
Fabricated Metal
Pharma.
Appliances
Electronics
Primary Metal
Auto Veh. Parts
Food
Machinery
Medical Eqpmt. Other Transp. Eqpmt.
Bev. & Tobacco
Aerospace
Chemicals
-10%
-15%
-20%
-25%
-30%
-35%
-40%
-45%
Petro/Coal
-55%
-60%
-65%
-70%
Semiconductors
Textile Product Mills
Furniture
Leather
-50%
Nonmetallic Mineral Product
Wood Product
Textile Mills
Apparel Plastics
Auto Final Assm.
290%
-5%
Printing
0%
Circle size = U.S.
consumption Global Leaders
U.S. Manufacturing Positional Advantage for Export High
U.S
. M
fg.
Cost A
dva
nta
ge
ove
r C
hin
a fo
r P
rod
ucts
Con
su
me
d in
th
e C
hin
a(1
)
1) The U.S. cost advantage represents the labor and logistics costs compared with those of Chinese manufacturers, for products consumed by people in China.
Source: U.S. Census Bureau, Bureau of Labor Statistics, UBS Research, CapitalIQ, Energy Information Administration, World Bank, Eurostat, World Trade Organization,
IRS Statistics, Tauber Institute for Global Operations, Booz & Company

U.S. Manufacturing Competitiveness:
in Domestic Markets
-60%
-70%
Semiconductors
Textile Product Mills
Furniture
Leather
Printing
Nonmetallic Mineral Product
Textile Mills
Apparel
Plastics
300%
200%
90%
80%
Paper
Electrical Eqpmt.
Computer Eqpmt.
Fabricated Metal
Pharma.
Appliances
Electronics
Primary Metal
*
Auto Final Assm.
Bev. & Tobacco
Other Transp. Eqpmt.
Wood Product 70%
60%
50%
40%
30%
20%
10%
0%
-10%
-20%
-30%
-40%
-50%
Medical Eqpmt.
Machinery
Food
Petro/Coal
Chemicals
Aerospace
1) The U.S. cost advantage represents the labor and logistics costs compared with those of Chinese manufacturers, for products consumed by people in the United
States.
Source: U.S. Census Bureau, Bureau of Labor Statistics, UBS Research, CapitalIQ, Energy Information Administration, World Bank, Eurostat, World Trade
Organization, IRS Statistics, Tauber Institute for Global Operations, Booz & Company
U.S. Manufacturing Positional Advantage for U.S. Demand High Low
U.S
. M
fg.
Cost A
dva
nta
ge
ove
r C
hin
a fo
r P
rod
ucts
Con
su
me
d in
th
e U
S(1
)
Sectors on the Edge
Niche Players
Regional Powers
Circle size = U.S.
consumption Global Leaders

Reasons for published cases
REASON # of CASES CITED Wage and Currency Changes 54
Quality, Warranty, Rework 41 Delivery 38
Freight Cost 32 Travel Cost/Time or Local Onsite 27
Inventory 25 Total Cost 20
Communications 14 Image/Brand (prefer U.S.) 12
Loss of Customer Responsiveness 9
Emergency Airfreight 9 Difficulty of Innovation/Product Differentiation 6
Natural Disaster Risk 4 Price 4
Green Considerations 4 Burden on Staff 3
Product Liability 2 Personnel Risk 1
Regulatory Compliance 1
Source: Reshoring Library 9/12
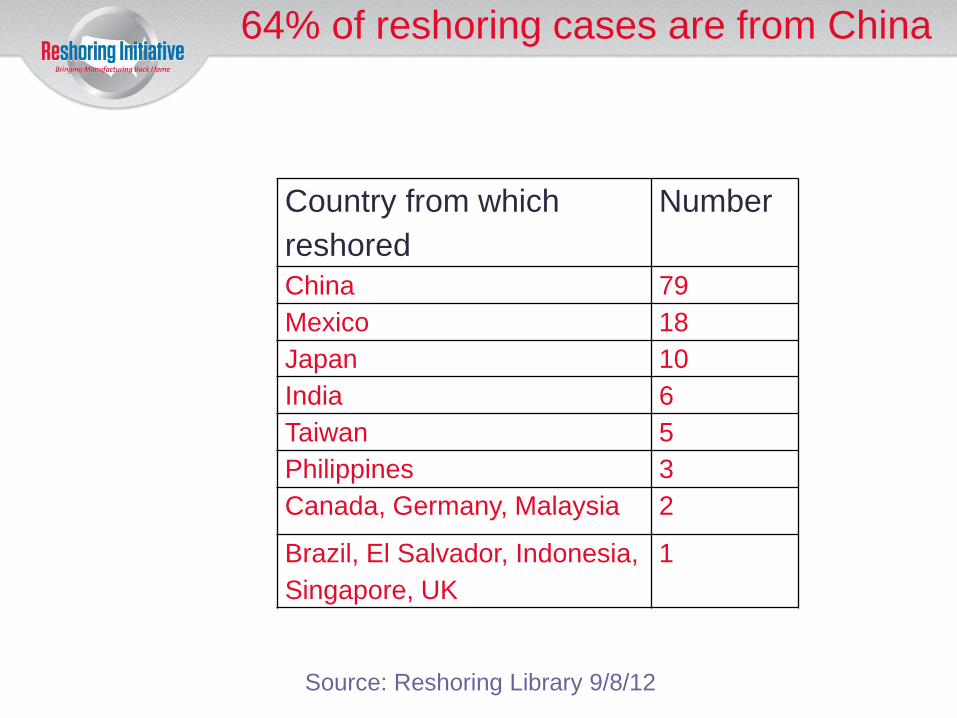
64% of reshoring cases are from China
Country from which
reshored
Number
China 79
Mexico 18
Japan 10
India 6
Taiwan 5
Philippines 3
Canada, Germany, Malaysia 2
Brazil, El Salvador, Indonesia,
Singapore, UK
1
Source: Reshoring Library 9/8/12

Special Relevance to Quality, Automation
Process Improvement and Workforce
By focusing on the small TCO gap instead of the large price
gap:
You can justify domestic process improvement, automation, training, etc.
You do not have to trade-off quality for price.
Recruiting is enhanced as reshoring becomes more visible
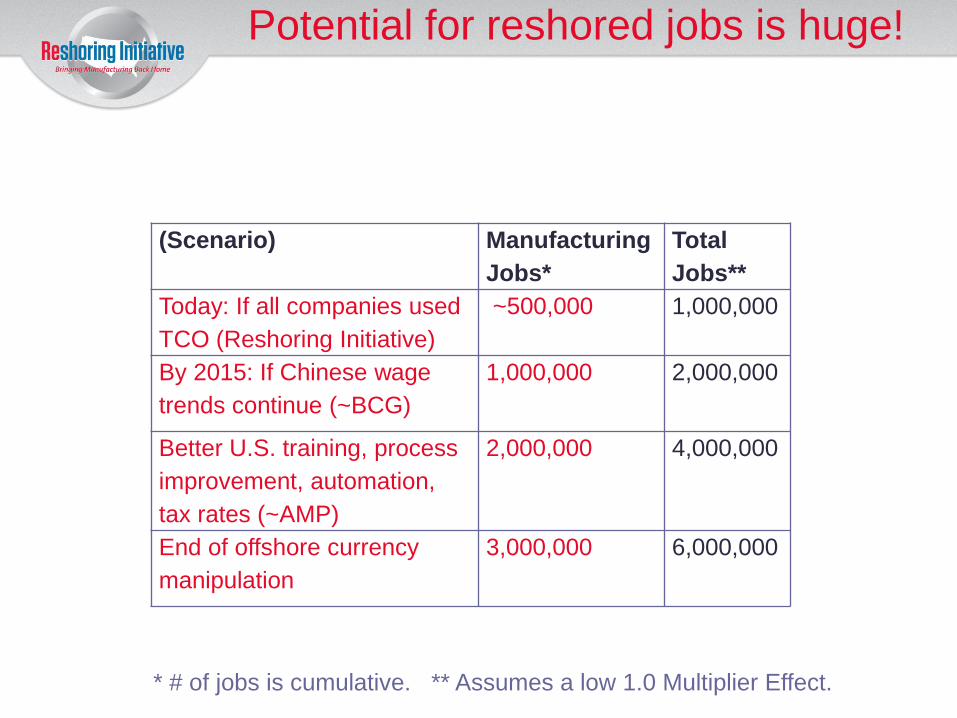
Potential for reshored jobs is huge!
(Scenario) Manufacturing
Jobs*
Total
Jobs**
Today: If all companies used
TCO (Reshoring Initiative)
~500,000 1,000,000
By 2015: If Chinese wage
trends continue (~BCG)
1,000,000 2,000,000
Better U.S. training, process
improvement, automation,
tax rates (~AMP)
2,000,000 4,000,000
End of offshore currency
manipulation
3,000,000 6,000,000
* # of jobs is cumulative. ** Assumes a low 1.0 Multiplier Effect.

The fastest and most efficient way to
strengthen the U.S. economy
●Reshoring breaks out of: The economic zero-sum-game of tax/borrow and spend.
The increases in consumer prices of relying solely on currency changes.
The waiting-for-policy-decisions problem.
● Assures that the pie grows, to the advantage of all Americans.
● Grows the pie by taking back what we earlier lost.
● Focuses on the manufacturing sector which has suffered so many job losses for decades.
● More efficient than exporting, stimulus programs or tax reductions.

Gaining support in Washington, DC
Commerce Dept: 2012 budget specifies TCO.
Links now: www.manufacturing.gov
http://nist.gov/mep/reshoring.cfm
Major link on Commerce due soon
4 rounds of free MEP webinars, last 11/29/12
Testified at CJS Congressional hearing on 3/28/12
Calls from: United States-China Economic and Security Review
Commission
White House National Economic Council

1/11/12 Insourcing Forum

1/11/12 Insourcing Panel

But how do apprenticeships and credentials pay?

What can you do?
Use the tools. Free at www.reshorenow.org
Use our archived webinars to inform staff and customers
Work with groups being trained on TCO, e.g. MEPs
Prepare your workforce for reshoring
Post a link like http://www.pres-flex.com/american-made/
Call on me to speak at: open houses, webinars, sales and supply chain training sessions, esp. for customers.
Submit cases of reshoring for publication and posting using our template. Add visibility to your company, industry, and NTMA
Sponsor

What can NTMA do?
Call on members to report reshoring cases.
Post the cases
Get me onto the programs of events for large customer
industries that offshore
Work with:
MEP (free 11/29 webinar)
EDOs
Make NTMA the U.S. reshoring leader!

Who has reshored as OEM or supplier?
Please:
Tell us now
See me
Give me your card marked “cases.”
www.reshorenow.org

A non-profit with 42 sponsors
Gold
Gold
G
Silver
Platinum
Gold
Silver

A non-profit with 42 sponsors
BronzeB
ronzeBro
nze
SteeelSStSteeleel
Iron Iron
Bronze
Steel

The first group to help us reach companies!

Help slow the offshoring flood now!
Contact:
Harry Moser
Initiative Founder
847-726-2975
www.reshorenow.org
Recruiting trainees for the skilled manufacturing workforce:
http://tinyurl.com/33vpz9k