Embed Size (px)
Citation preview
VTT PU
BLICATIO
NS 646
To patent or not to patent? An innovationlevel investigation of the...
Iiro Mäkinen
ESPOO 2007 VTT PUBLICATIONS 646
Iiro Mäkinen
To patent or not to patent?
An innovationlevel investigation of thepropensity to patent
This study seeks to shed new light on the complex relationship betweenpatents and innovations that has remained extremely elusive thus far. Theobjective of the study is to contribute to our understanding of whichinnovations are patented – and which are not – by analyzing the patentingdecision for circa 800 Finnish innovations. The data is drawn from theSfinno database compiled at VTT Innovation Studies. With the help ofeconometric methods, the study seeks to shed new light on the questionof how the propensity to patent an innovation is affected by thecharacteristics of the innovation, the market, and the innovating firm.
The results should be of obvious interest to those who depend onpatent data in drawing conclusions about innovation and technologicalchange. The finding that larger, i.e. more novel and significant, productinnovations are patented more frequently than smaller ones should becomforting news from the perspective of using patents as an economicindicator of innovation since it implies that large innovations enter thepatent indicator at a relatively high probability. However, the study alsopoints to the weaknesses of patent data by demonstrating that thepropensity to patent varies significantly across firms and technologies.For instance, the evidence in favor of the hypotheses on the presence ofeconomies of scale in the patenting activity and on the relatively highpropensities to patent in startup ventures suggests that patents are arather problematic measure of innovations in the context of testing theSchumpeterian hypotheses.
ISBN 9789513870294 (soft back ed.) ISBN 9789513870300 (URL: http://www.vtt.fi/publications/index.jsp)ISSN 12350621 (soft back ed.) ISSN 14550849 (URL: http://www.vtt.fi/publications/index.jsp)
Julkaisu on saatavana Publikationen distribueras av This publication is available from
VTT VTT VTTPL 1000 PB 1000 P.O. Box 1000
02044 VTT 02044 VTT FI02044 VTT, FinlandPuh. 020 722 4404 Tel. 020 722 4404 Phone internat. + 358 20 722 4404Faksi 020 722 4374 Fax 020 722 4374 Fax + 358 20 722 4374


VTT PUBLICATIONS 646
To patent or not to patent? An innovation-level investigation of the
propensity to patent
Iiro Mäkinen

ISBN 978-951-38-7029-4 (soft back ed.) ISSN 1235-0621 (soft back ed.)
ISBN 978-951-38-7030-0 (URL: http://www.vtt.fi/publications/index.jsp) ISSN 1455-0849 (URL: http://www.vtt.fi/publications/index.jsp)
Copyright © VTT Technical Research Centre of Finland 2007
JULKAISIJA – UTGIVARE – PUBLISHER
VTT, Vuorimiehentie 3, PL 1000, 02044 VTT puh. vaihde 020 722 111, faksi 020 722 4374
VTT, Bergsmansvägen 3, PB 1000, 02044 VTT tel. växel 020 722 111, fax 020 722 4374
VTT Technical Research Centre of Finland, Vuorimiehentie 3, P.O. Box 1000, FI-02044 VTT, Finland phone internat. +358 20 722 111, fax + 358 20 722 4374
VTT, Vuorimiehentie 5, PL 1000, 02044 VTT puh. vaihde 020 722 111, faksi 020 722 5888
VTT, Bergsmansvägen 5, PB 1000, 02044 VTT tel. växel 020 722 111, fax 020 722 5888
VTT Technical Research Centre of Finland, Vuorimiehentie 5, P.O. Box 1000, FI-02044 VTT, Finland phone internat. +358 20 722 111, fax +358 20 722 5888
Technical editing Leena Ukskoski Cover photo: Kuvaario Edita Prima Oy, Helsinki 2007
3
Mäkinen, Iiro. To patent or not to patent? An innovation-level investigation of the propensity to patent. Espoo 2007. VTT Publications 646. 95 p. + app. 13 p.
Keywords patents, innovations, patenting, econometric analysis, propensity, models, estimation, testing, Sfinno, product innovations
Abstract
This study seeks to shed new light on the complex relationship between patents and innovations that has remained extremely elusive thus far. The objective of the present study is to contribute to our understanding of which innovations are patented – and which are not – by analyzing the patenting decision for circa 800 Finnish innovations. With the help of econometric methods, the study seeks to shed new light on the question of how the propensity to patent an innovation is affected by the characteristics of the innovation, the market, and the innovating firm.
For empirical purposes, the propensity to patent is defined as the fraction of innovations for which at least one patent application is filed, while an innovation is defined as an invention that has been commercialized on the market by a business firm or an equivalent. The innovation-level model for the propensity to patent is derived in the spirit of random utility models. The emerging probit model is estimated on a sample of 791 Finnish innovations using a quasi-maximum likelihood estimator called the partial maximum likelihood estimator, which allows for within-firm correlation in the data.
The data sample of 791 Finnish innovations used in the study is drawn from the Sfinno database compiled at VTT Innovation Studies (formerly VTT Group for Technology Studies). In an effort to compile the Sfinno database, a systematic review of 18 carefully selected trade and technical journals from the period 1985–1998 has been complemented with a review of annual reports of large firms from the same period as well as with expert opinion-based identification of innovations. Since the Sfinno approach heavily relies on public sources in the identification of innovations, it is clearly more conducive to studying product than process innovations. Hence innovations only developed for the firm’s internal use are not included in the Sfinno database.

4
The results from the econometric analysis indicate that various characteristics of the innovation, the market, and the innovating firm have a significant effect on the propensity to patent. First, the estimation results suggest that larger, i.e. more novel and significant, innovations are patented more frequently than smaller ones. Second, technologically very complex innovations appear to be patented less often than others, while the fragmentation of intellectual property rights to cumulatively developing technology seems to entail high propensities to patent. Third, the results indicate that the propensity to patent varies across technology classes and declines with product market competition. Fourth, collaboration with scientific institutions appears to have a positive impact on the propensity to patent, while the estimations fail to produce evidence that public R&D support or collaboration with other types of partners would affect the propensity to patent. Finally, there appears to be a U-shaped relationship between firm size and the propensity to patent, which can be attributed to a relatively large extent to economies of scale in the patenting activity as well as to the relatively important role of patenting in start-up ventures.

5
Preface
This report is based on my Master’s thesis prepared for the Department of Economics at Helsinki School of Economics (HSE). The study was carried out within the CIPCI (Changes in innovation processes and characteristics of innovations during the different phases of economic development) project at VTT Innovation Studies. Moreover, the study would not have been possible without the unique innovation-level database, called Sfinno, compiled within the Sfinno project at VTT. Both of the above-mentioned projects have been funded by VTT and Tekes.
This report has benefited from discussions with a number of people. I would like to thank the people at VTT Innovation Studies for an inspiring working environment and intriguing discussions. I am also indebted to all the people who have contributed to the compilation of the Sfinno database. The members of the CIPCI project, and especially the project manager Jani Saarinen, deserve special thanks for their support and comments and for stimulating discussions on innovation and technological change. I would also like to thank my Master’s thesis supervisor Heli Koski from ETLA and Professor Pekka Ilmakunnas from HSE for their insightful comments in different phases of my Master’s thesis work. All responsibility for any errors and omissions is naturally solely mine.
Finally, I wish to thank my wife Elina and my daughter Salma for their love, encouragement, and understanding. Their support was crucial throughout the Master’s thesis project.
Iiro Mäkinen
Helsinki, May 29, 2007

6
Contents
Abstract ...................................................................................................................... 3
Preface........................................................................................................................ 5
1. Introduction ......................................................................................................... 9 1.1 Patenting decision and the propensity to patent ....................................10 1.2 Objective and method .............................................................................14 1.3 Main findings...........................................................................................15 1.4 Structure of the study ..............................................................................16
2. Propensity to patent – background to the empirical study .............................17 2.1 Empirical literature on the propensity to patent ....................................17
2.1.1 Patents, R&D, and the patent production function...................18 2.1.2 Surveys on the patenting behavior of firms ..............................21 2.1.3 Propensity to patent at the innovation level..............................24
2.2 Hypotheses on the determinants of the propensity to patent ................26 2.2.1 Characteristics of the firm..........................................................26 2.2.2 Characteristics of the innovation and the market .....................29
3. Sfinno methodology and data...........................................................................35 3.1 The Sfinno approach ...............................................................................35 3.2 Variables of interest ................................................................................38
4. Econometric analysis ........................................................................................45 4.1 Modeling the propensity to patent at the innovation level....................45 4.2 Methods for estimation and testing ........................................................47
4.2.1 Pooled estimation with unobserved effects and omitted heterogeneity...............................................................................48
4.2.2 Random effects probit estimation..............................................54 4.2.3 Possible endogeneity of the patenting-scale variable...............55 4.2.4 Possible problem of heteroscedasticity .....................................57
4.3 Results from estimation and testing .......................................................58 4.3.1 Results from the pooled probit model .......................................58 4.3.2 Testing for endogeneity and heteroscedasticity........................68 4.3.3 Comparison of results with alternative models ........................71

7
5. Conclusion.........................................................................................................76
References................................................................................................................80
Appendices A–G


9
1. Introduction
The patent system is one of the main instruments of public policy that can be used to affect the allocation of resources for innovative activities and the diffusion of the results of those activities. As the role of innovation and technological change in economic development and growth has received increasing attention among economists since the seminal contributions of Joseph Schumpeter (1912, 1942) and Robert Solow (1956, 1957)1, economists have also become more and more interested in the implications of the patent system for innovation and technological change.
As Nelson (1959) and Arrow (1962) point out, the distinctive characteristics of knowledge as an economic good, such as its public-good properties, can severely limit the innovators’ ability to appropriate the social value of their innovations in a competitive economy, thus leading to underinvestment in R&D2. When the social value of an innovation spills over to other economic agents as enabling information or consumer surplus, the private incentives to innovate are diluted. The patent system provides a possible – though imperfect – means for mitigating this market failure (see, e.g., Wright 1983; Gallini and Scotchmer 2001; and Scotchmer 2004 for discussions on the relative merits of patents vis-à-vis other solutions to the appropriability problem). The traditional reward theory of
1 Growth accounting (e.g., Abramovitz 1956; Solow 1957), the new growth theory (e.g., Romer 1986; Lucas 1988), and evolutionary economics (e.g., Nelson and Winter 1982) have all identified technological development as the primary driver of economic growth. Moreover, economic historians such as Landes (1969), Rosenberg (1982), and Mokyr (1990) have emphasized the role of technological change in the processes of economic development and growth. 2 The theoretical literature on R&D under rivalry implies that when firms race to be the first to develop a given innovation in winner-take-most or winner-take-all settings or when new innovations cannibalize the profits of rivals in a process of Schumpeterian creative destruction, private firms may have an incentive to over-invest in R&D relative to the social optimum (e.g., Scherer 1967; Barzel 1968; Kamien and Schwartz 1972; Loury 1979; Lee and Wilde 1980; Dasgupta and Stiglitz 1980a, 1980b; Fudenberg et al. 1983; Tandon 1983; see also Tirole 1988; and Reinganum 1989 for surveys of this literature). However, empirical investigations into the private and social rates of return to R&D lend support for the underinvestment argument and show that the social rate of return generally exceeds the private one (e.g., Mansfield et al. 1977; Bernstein and Nadiri 1988, 1989; Jones and Williams 1998, 2000; see also Griliches 1992, 1995, 1998; and Hall 1996 for surveys of the relevant literature).

10
patents holds that patents are needed to encourage investment in innovative activities. The patent system rewards innovators by granting temporary monopolies in the form of legal rights to exclude others from commercially exploiting the patented inventions3. This function of the patent system has dominated much of the economic literature on patents, but other rationales for patent protection have also been proposed4 (see, e.g., Mazzoleni and Nelson 1998a, 1998b; Gallini 2002; and Langinier and Moschini 2002 for reviews of the economic rationale for patent protection).
1.1 Patenting decision and the propensity to patent
To patent or not to patent: that is the question innovators face when they succeed in developing novel products or processes. The innovators need to contemplate whether it is better to seek patent protection or strive to appropriate returns to innovation through other means such as secrecy, first mover advantages, and complementary capabilities. In the theoretical economic literature on patents, this dilemma is modeled as a profit-maximizing choice between patenting and not patenting5,6 (e.g., Horstmann et al. 1985; Choi 1990; Scotchmer and Green
3 The maximum duration of a patent is generally twenty years from the filing of the application, and in order to maintain the right for the maximum period, the patent owner must also pay the renewal fees. For more information on intellectual property law, see e.g. WIPO (2004). 4 The patent system can, for instance, facilitate the diffusion of new technologies by reducing transaction costs in the markets for technology (e.g., Ordover 1991; Arora et al. 2001), help to avoid socially wasteful innovation races by providing broad property rights for initial inventions that open up possibilities for further innovations (e.g., Kitch 1977), and encourage dissemination of innovative knowledge by rewarding disclosure with legal monopoly (e.g., Denicolò and Franzoni 2003). 5 Firms may also find it optimal to randomize on the patenting decision (see, e.g., Horstmann et al. 1985 and Langinier 2005). 6 Much of the theoretical work on patents leaves the decision to patent unmodeled and assumes that all (patentable) innovations are patented. This approach is adopted, e.g., in Nordhaus (1969, 1972); Scherer (1972); Kamien and Schwartz (1974); Tandon (1982); Gilbert and Shapiro (1990); Klemperer (1990); Denicolò (1996, 1999); Wright (1999); and Takalo (2001), who study patents in the context of one-time innovation, and in Chang (1995); Green and Scotchmer (1995); Matutes et al. (1996); Scotchmer (1996); Van Dijk (1996); O´Donoghue et al. (1998); Denicolò (2000); and Denicolò and Zanchettin (2002), who study patents in the context of cumulative innovation.

11
1990; Waterson 1990; Gallini 1992; Harter 1994; Saarenheimo 1994; Takalo 1998; Denicolò and Franzoni 2003, 2004; Anton and Yao 2004; Langinier 2005; Kultti et al. 2007). As a result of such deliberate decision-making by innovators, some innovations are patented while others are not; thus the propensity to patent, i.e. the fraction of innovations that are patented, is positive but less than one.
Various scholars have noted that the propensity to patent differs across industries, firms, and kinds of innovations (e.g., Comanor and Scherer 1969; Pavitt 1985; Basberg 1987; Griliches 1990; Patel and Pavitt 1995; Archibugi and Pianta 1996; Kleinknecht et al. 2002; Van der Panne and Kleinknecht 2005). However, precious little is known about the origins of such differences, especially at the level of innovations, and several issues remain ambiguous in both theoretical and empirical literature on the propensity to patent.
Much of the theoretical work that incorporates the patenting decision is primarily concerned with the optimal design and welfare effects of the patent system on a very general level (e.g., Scotchmer and Green 1990; Waterson 1990; Gallini 1992; Takalo 1998; Denicolò and Franzoni 2003, 2004; Kultti et al. 2007). Hence most theoretical models abstract from the heterogeneity of industries, firms, and innovations, and provide relatively little insight into the determinants of the differences in the propensity to patent. And when relevant predictions emerge from the theoretical work, they can be very sensitive to the assumptions of the specific models. The Anton and Yao (2004) model, for instance, implies that small innovations are patented while large innovations are kept secret, whereas the Horstmann et al. (1985) and the Denicolò and Franzoni (2003) models arrive at the opposite conclusion7. Consequently, empirical investigation of the decision to patent is warranted for testing such contradictory hypotheses and for shedding new light on the determinants of the propensity to patent.
7 Following the relevant theoretical literature (Denicolò and Franzoni 2003; Anton and Yao 2004), the term size (large vs. small) of an innovation is adopted in the present study instead of relatively synonymous alternatives such as the radicalness (radical vs. incremental) of an innovation. Issues related to the definition and measurement of the size of innovations will be discussed in Chapter 3.

12
Empirical investigations such as Scherer (1965, 1983), Schmookler (1966), Taylor and Silberston (1973), Bound et al. (1984), Mansfield (1986), König and Licht (1995), Arundel and Kabla (1998), Duguet and Kabla (1998), Licht and Zoz (1998), Brouwer and Kleinknecht (1999), Cohen et al. (2000), Hall and Ziedonis (2001), and Arora et al. (2003) are important contributions to our understanding of the variations in the propensity to patent. However, these studies have been confined to the use of industry and firm level data, and we have very little idea of how the propensity to patent varies across different innovations8. Moreover, due to different and sometimes problematic definitions of the propensity to patent in these studies, the results are not readily comparable, and when comparisons are attempted, contradictory conclusions seem to emerge. The results of Schmookler (1966), Taylor and Silberston (1973), and Bound et al. (1984), for instance, suggest that the propensity to patent decreases with the scale of activities, while Mansfield (1986), Arundel and Kabla (1998), Duguet and Kabla (1998), and Arora et al. (2003) find support for the opposite conclusion. Hence further empirical research is required to broaden and deepen our understanding of the variations in the propensity to patent.
De Melto et al. (1980), Saarinen (2005), and Van der Panne and Kleinknecht (2005) are exceptions in that they provide information on the variations in the propensity to patent across innovations. These studies, however, do not take the analysis of the propensity to patent very far. De Melto et al. (1980) and Saarinen (2005) address differences in the propensity to patent in the context of Canadian and Finnish innovations, respectively, by cross-tabulating the percentage of innovations patented against other variables of interest. Van der Panne and Kleinknecht (2005) seek to take the analysis a step further by analyzing a sample of Dutch innovations. However, their logit analysis of factors affecting the propensity to patent an innovation is confined by a limited number of observations (N = 216) and explanatory variables. The findings emerging from the empirical literature on the propensity to patent will be reviewed in Chapter 2.
8 Arundel and Kabla (1998) and Cohen et al. (2000) are exceptions in that they differentiate between product and process innovations.

13
The variations in the propensity to patent are not a trivial matter, but they do have important implications for researchers and policy makers with an interest in innovation policy. To begin with, a more thorough understanding of the differences in the propensity to patent across industries, firms, and kinds of innovations should be of great value to researchers, policy makers, and others who depend on patent data in drawing conclusions about innovation and technological change. The fact that not all innovations are patented is often pointed out as a major limitation to the use of patent statistics as an economic indicator of innovative activities (see, e.g., Acs and Audretsch 1989; Griliches 1990; Archibugi and Pianta 1996; Hall et al. 2001; Jaffe and Trajtenberg 2002; Kleinknecht et al. 2002), and new information on the variations in the propensity to patent could clearly advance our understanding of what patent statistics really measure. Whether small innovations are patented while large ones are kept secret, as suggested by Anton and Yao (2004), or vice versa, as suggested by Horstmann et al. (1985) and Denicolò and Franzoni (2003), should have major implications for the utilization of patent data in economic research. Moreover, understanding the relationship between firm size and the propensity to patent is essential in interpreting empirical studies on the Schumpeterian hypotheses9 that use patents as a measure of innovation (see Kamien and Schwartz 1982; Cohen and Levin 1989; and Cohen 1995 for surveys of the empirical work on the Schumpeterian hypotheses).
Furthermore, an innovation-level investigation of the propensity to patent could provide information about the extent to which the patent system is utilized by different firms to appropriate returns to different innovations. The variations in the propensity to patent are interesting, for instance, in the context of the contract theory of patents, which holds that the purpose of the patent system is to encourage dissemination of innovative knowledge by rewarding disclosure with legal monopoly. Denicolò and Franzoni (2003) find that the disclosure rationale alone suffices to justify the existence of the patent system. Scotchmer and Green (1990), Denicolò and Franzoni (2004), and Kultti et al. (2007) suggest that, in general, patenting is socially preferable to secrecy, whilst the survey results of
9 Two famous hypotheses associated with Schumpeter (1942) claim that (1) innovation increases more than proportionally with firm size and (2) there is a positive relationship between innovation and market concentration.

14
Cohen et al. (2000) imply that secrecy has become more heavily employed as an appropriability mechanism since the early 1980s (cf. Levin et al. 1987). Hence it might be socially desirable to encourage patenting when the propensity to patent is low and innovators have a tendency to resort to secrecy. Information on the propensity to patent should prove useful to policy makers, for instance, in designing and targeting policies for encouraging diffusion of innovative knowledge through patent documents (cf. Arundel and Kabla 1998). When the propensity to patent is high, encouraging the use of patent data can enhance diffusion, but when the propensity to patent is low, diffusion of knowledge through patent documents also requires policy measures for encouraging the patenting of innovations.
1.2 Objective and method
As Hall et al. (2001:4) point out: “Unfortunately, we have very little idea of the extent to which patents are representative of the wider universe of inventions, since there is no systematic data about inventions that are not patented. This is an important, wide-open area for future research.” The objective of the present study is to contribute to our understanding of which innovations are patented – and which are not – by analyzing the patenting decision for circa 800 Finnish innovations contained in a unique innovation database compiled at VTT Innovation Studies (formerly VTT Group for Technology Studies). With the help of econometric methods, this study aims to shed new light on the following question: How is the propensity to patent an innovation affected by the characteristics of the innovation, the market, and the innovating firm?
Arundel and Kabla (1998) use firm-level data to study the propensity to patent in Europe’s largest industrial firms, but in a footnote to their article they suggest that: “Another method for determining patent propensity rates is to identify all major innovations, for example, by using new product announcements in trade and technical journals. One could then determine the percentage of these that were patented.” The Sfinno database compiled at VTT Innovation Studies enables such an approach. At VTT Innovation Studies a systematic review of 18 carefully selected trade and technical journals from the period 1985–1998 has been complemented with a review of annual reports of large firms from the same period as well as with expert opinion-based identification of innovations in an

15
effort to compile a rich database of Finnish innovations (see Palmberg et al. 1999, 2000; and Saarinen 2005 for details). Because the Sfinno approach heavily relies on public sources in the identification of innovations, it is more conducive to studying product than process innovations. Hence innovations only developed for the firm’s internal use are not included in the Sfinno database. In line with the Schumpeterian definitions (Schumpeter 1912) and drawing loosely upon the Oslo Manual (OECD 1992, 1997, 2005), an innovation is defined as an invention that has been commercialized on the market by a business firm or an equivalent, and the inclusion of an innovation in the database has required that the innovation is a technologically new or significantly enhanced product compared to the firm’s previous products (Palmberg et al. 2000). This study draws upon the survey portion of the Sfinno data that contains detailed information on the characteristics of some 800 Finnish innovations as well as the innovating firms.
Because in reality an innovation can be protected by a number of patents, a single patent can cover numerous innovations, and not all patents relate to innovations, a complete investigation of the extent to which patents are representative of different innovations is beyond the scope of this study. The present study contributes to our understanding of the relationship between innovations and patents by analyzing how various factors affect the innovator’s decision of whether or not to file at least one patent application for a given product innovation. For empirical purposes, the propensity to patent is defined as the fraction of innovations for which at least one patent application is filed, and an innovation-level model for the propensity to patent is derived in the spirit of random utility models (RUMs). The resulting probit model is estimated using a quasi-maximum likelihood estimator that Wooldridge (2002) calls the partial maximum likelihood estimator (PMLE).
1.3 Main findings
The results from the econometric analysis indicate that various characteristics of the innovation, the market, and the innovating firm have a significant effect on the propensity to patent. First, the estimation results suggest that larger – that is, more novel and significant – innovations are patented more frequently than smaller ones. Second, technologically very complex innovations appear to be

16
patented less often than others, while the fragmentation of intellectual property rights to cumulatively developing technology seems to entail high propensities to patent. Third, the results indicate that the propensity to patent varies across technology classes and declines with product market competition. Fourth, collaboration with scientific institutions appears to have a positive impact on the propensity to patent, while the estimations fail to produce evidence that public R&D support or collaboration with other types of partners would affect the propensity to patent. Finally, there appears to be a U-shaped relationship between firm size and the propensity to patent, which can be attributed to a relatively large extent to economies of scale in the patenting activity as well as to the relatively important role of patenting in start-up ventures.
1.4 Structure of the study
This study is structured as follows. Chapter 2 presents the background to the empirical study by reviewing the existing empirical literature on the propensity to patent and outlining the hypotheses to be tested in the empirical investigation. Chapter 3 briefly introduces the Sfinno methodology and data. Chapter 4 presents the econometric modeling, the methods for estimation and testing, and the estimation results. Chapter 5 concludes.

17
2. Propensity to patent – background to the empirical study
This chapter lays out the background to the empirical study. Section 2.1 reviews the existing empirical literature on the propensity to patent, and Section 2.2 presents the hypotheses on the determinants of the propensity to patent.
2.1 Empirical literature on the propensity to patent
The relationships between ideas, innovations, and patents are not as clear and simple as they appear in the theoretical literature. Ideally, a firm encounters an idea or investment opportunity and decides whether it is worthwhile investing in developing it into an innovation. And if the firm is successful in developing the idea into an innovation, it then decides whether or not the innovation should be patented. (See, e.g., Gallini 1992; Takalo 1998, 1999; Kultti et al. 2007.) In such a stylized context the definition of the propensity to patent as the fraction of innovations that are patented is straightforward and unambiguously defines the relationship between innovations and patents. In reality, however, it is possible that inventions that are not commercialized and thus do not qualify as innovations10 are nevertheless patented. On the other hand, not all inventions are patentable11 and patent protection might not be available even though the invention is successfully introduced to the market. It can even happen that the innovator decides to patent but the patent examiner deems the innovation unpatentable and denies the application. Figure 1 illustrates the relationship between ideas, inventions, innovations, and patents. Furthermore, even when innovations are protected by patents, a clear-cut one-to-one mapping between
10 This study follows the Sfinno-project in defining an innovation as an invention that has been commercialized on the market by a business firm or an equivalent (Palmberg et al. 1999:38, 2000:10; Saarinen 2005:19–20). This definition draws upon the Oslo Manual (OECD 1992, 1997, 2005) and is in line with the Schumpeterian definitions (Schumpeter 1912). 11 In order to be patentable, an invention has to be industrially applicable and of patentable subject matter (cf. Patents Act of Finland: Section 1), and it needs to satisfy the requirements of novelty and non-obviousness (cf. Patents Act of Finland: Section 2). For more information on intellectual property law, see e.g. WIPO (2004).

18
them is not possible because a single innovation can be protected by a myriad of patents, while one patent can protect a set of innovations. The complexity in the relationships between innovations and patents, together with problems related to the definition and measurement of innovation, give rise to a number of different definitions of the propensity to patent in the empirical literature.
Figure 1. Ideas, inventions, innovations, and patents12.
The following three subsections introduce three different approaches to empirically studying the propensity to patent. The first approach builds upon estimation of the patent production function, the second seeks to tackle the issue of patenting propensity through firm-level surveys, and the third investigates whether specific innovations have been patented.
2.1.1 Patents, R&D, and the patent production function
Scherer (1965) uses the number of patents received per thousand R&D employees to measure the differences in the propensity to patent, even though he acknowledges this to be a crude measure of the patented proportion of the
12 Figure 1 is a refined version of the figure in Basberg (1987:133).

19
innovation output. Scherer finds that the propensity to patent varies across industries and that government R&D support correlates negatively with the propensity to patent at the industry level. Moreover, he discovers that patenting is generally less concentrated among the largest firms than R&D employment, except that the industry leaders usually exhibit high propensities to patent. Taylor and Silberston (1973) and Scherer (1983) take a relatively similar approach and define the propensity to patent in terms of patents obtained per unit of R&D expenditure. In accordance with Scherer’s (1965) earlier findings, Taylor and Silberston detect inter-industry variation in the propensity to patent and find a negative relationship between the propensity to patent and the scale of R&D activities. Scherer (1983) also discovers inter-industry variation in the propensity to patent, but finds a proportional relationship between patents and R&D in most industries. The extensive empirical literature on the relationship between patents and R&D sheds some light on the propensity to patent, when interpreted in this manner (e.g., Schmookler 1966; Bound et al. 1984; Hausman et al. 1984; Pakes and Griliches 1984; Hall et al. 1986; Acs and Audretsch 1989; König and Licht 1995; Cincera 1997; Crépon and Duguet 1997a, 1997b; Licht and Zoz 1998; Hall and Ziedonis 2001; Suzuki et al. 2006). On the basis of the extensive literature, Cohen and Klepper (1996:930) conclude that the number of patents per unit of R&D expenditure decreases with firm size and/or the scale of R&D activities, even though the evidence is not completely unambiguous (see also Cohen 1995).
The results on the relationship between patents and R&D are very complex to interpret, however, because they can be affected either by the productivity of R&D or the propensity to patent the results of that R&D13. In fact, much of the research on the patents-R&D relationship is primarily concerned with the productivity of R&D, while variations in the propensity to patent are only discussed because they can compromise the interpretability of the results obtained. For instance, it is a matter of speculation whether the negative relationship between the ratio of patents to R&D and the scale of R&D activities or firm size – observed in a number of studies – arises as a result of declining
13 The results may also be biased due to the shortcomings of R&D expenditure as an indicator of innovation inputs; formal R&D is only one of the innovation inputs and standard innovation surveys tend to underestimate the R&D activities of small firms (see, e.g., Patel and Pavitt 1995; Kleinknecht et al. 2002).

20
R&D productivity, decreasing propensity to patent, or something else (see, e.g., Scherer 1965, 1983; Schmookler 1966; Taylor and Silberston 1973; Bound et al. 1984; Pavitt 1985; Griliches 1990).
König and Licht (1995) and Licht and Zoz (1998) acknowledge that various factors affecting the propensity to patent intervene in the relationship between patents and R&D. Hence they specify the patent production function as a product of a function that represents the propensity to patent and the invention production function. The patent production function is estimated using a hurdle model for count data, and the key estimation results are the following. First, R&D expenditure, the key input in the invention production function, is found to be positively related to R&D, and the elasticity of patents with respect to R&D appears to increase with R&D in such a manner that it only exceeds unity for the large R&D spenders. Second, firms that consider scientific institutions as major sources of information are found to generate more patents than others. This is interpreted as an indication of higher R&D productivity in firms that benefit from public scientific infrastructure. Third, the number of patents is found to increase with firm size and the scale of exporting activities, and this is primarily construed as a sign of a positive relationship between these factors and the propensity to patent. However, the results of König and Licht (1995) and Licht and Zoz (1998) still suffer from the possibility that many of their explanatory variables can have an impact on both the productivity of R&D and the propensity to patent.
In order to distinguish the propensity-to-patent effect from the productivity effects, Brouwer and Kleinknecht (1999) seek to control for the innovation output rather than the innovation inputs by including the sales of innovative products as a control variable in their patent production function. Brouwer and Kleinknecht arrive at the following results by estimating a hurdle model for count data. First, there is a clear positive relationship between patents and the sales of innovative products as expected. Second, there is inter-industry variation in the propensity to patent with high technological opportunity sectors experiencing higher patenting propensities than low opportunity sectors. Third, firms that engage in R&D collaboration exhibit higher patenting propensities than others. Fourth, the probability of having applied for at least one patent increases more than proportionately with firm size, while the number of applications increases less than proportionately with firm size among patenting

21
firms. Fifth, R&D intensity has a positive impact on the probability that the firm seeks patent protection, but it fails to have a statistically significant impact on the number of patent applications.
2.1.2 Surveys on the patenting behavior of firms
Instead of seeking to make inferences about the propensity to patent by estimating the patent production function, several innovation surveys have directly asked the firms about the fraction of innovations they generally patent. Such surveys include Mansfield’s (1986) survey of 100 US manufacturing firms, the PACE Survey of Europe’s largest industrial firms (Arundel et al. 1995; Arundel and Kabla 1998), the French survey of appropriation (EFAT) (Duguet and Kabla 1998), and the Carnegie Mellon Survey of R&D labs in the US manufacturing sector (Cohen et al. 2000; Arora et al. 2003). The survey approach allows for construction of a direct measure of the propensity to patent that is closely in line with the theoretical definition of the propensity to patent as the fraction of innovations that are patented. Mansfield (1986) defines the propensity to patent as the percentage of patentable inventions that are patented. The PACE, EFAT, and Carnegie Mellon surveys employ a modified version of Mansfield’s definition and define the propensity to patent as the percentage of innovations for which a patent application is filed14. When operationalized in such a manner, the propensity to patent can be viewed as a direct result of the innovation-specific decisions to patent.
The key findings related to the propensity to patent emerging from the analysis of the above mentioned survey data include the following. First, the propensity to patent varies across industries as expected (Mansfield 1986; Arundel et al. 1995; Arundel and Kabla 1998; Duguet and Kabla 1998; Cohen et al. 2000; Arora et al. 2003). Second, the propensity to patent increases with the scale of
14 Using the percentage of innovations, rather than inventions, overcomes the drawback – inherent in Mansfield’s definition – that many inventions are never commercialized and hence have little economic significance. Moreover, the innovations of interest should not be limited to patentable innovations because the propensity to patent figures are of interest as an indicator of the extent to which patents represent the whole population of innovations. (Arundel and Kabla 1998.)

22
activities – that is, with firm size or R&D expenditure (Mansfield 1986; Arundel and Kabla 1998; Duguet and Kabla 1998; Arora et al. 2003). Third, firms that also sell products in foreign markets exhibit a higher propensity to patent (Arundel and Kabla 1998). Fourth, firms that consider the compulsory disclosure of technical information associated with patenting as an important obstacle to patenting patent a smaller fraction of their innovations than others (Duguet and Kabla 1998); such firms probably seek to appropriate returns to innovation through secrecy instead. Fifth, the propensity to patent increases with the importance of patents for appropriating returns to innovation (Arundel and Kabla 1998; Cohen et al. 2000; Arora et al. 2003), but decreases with the importance of secrecy in the context of product innovations (Arundel and Kabla 1998); the importance of secrecy appears to have the opposite effect, or no effect at all, for process innovations (Ibid).
The ability of an innovator to bar potential competitors from entering the market for the newly introduced innovation has major implications for the innovator’s ability to profit from her innovation. Consequently, the effectiveness of patents and other appropriability mechanisms in protecting innovations and appropriating returns to innovative activities has received considerable attention among scholars of innovation. Since the effectiveness of different appropriability mechanisms is a significant driver of the value of patent protection, it should be a major consideration in the patenting decision and thus an important determinant of the propensity to patent. Hence the finding that the propensity to patent increases with the importance of patents for appropriating returns to innovation seems rather evident and not very interesting as such. In order to provide information on the underlying factors that affect the effectiveness of patent protection and thus the propensity to patent, the key results from several appropriability surveys are summarized below.
A number of innovation surveys have collected data on the perceived effectiveness of different appropriability mechanisms in securing returns to innovation. The Yale Survey (Levin et al. 1987) and the Carnegie Mellon Survey (Cohen et al. 2000) have provided data for the United States, whereas the PACE Survey (Arundel et al. 1995), the French survey of appropriation (Combe and Pfister 1999), and the Community Innovation Surveys (e.g., König and Licht 1995; Brouwer and Kleinknecht 1999; Arundel 2001; Sattler 2002; Barros 2004) have collected data for several European countries. In addition, separate

23
appropriability surveys have been carried out, for instance in Switzerland (Harabi 1995), Japan (Cohen et al. 2002), and Germany (Blind et al. 2006).
Table 1. The relative importance of different appropriability mechanisms*.
* The appropriability mechanisms are ranked from the most important (1) to the least important (4).
Despite various problems in constructing measures of effectiveness of different appropriability mechanisms from survey responses, several conclusions emerge from the survey data. First, the survey results demonstrate that patents are neither the only nor the most important means for appropriating returns to innovation in many cases. Appropriability mechanisms such as secrecy, lead time advantages, learning-curve effects, and superior sales and service capabilities are often perceived as more effective than patenting in protecting the competitive advantages of innovations (cf. Table 1). Second, the importance of patents and other appropriability mechanisms varies across industries, as suggested by earlier empirical investigations of the patent system (e.g., Taylor and Silberston 1973; Mansfield et al. 1981; Mansfield 1986); patents are generally perceived to be effective means of appropriation, for instance, in pharmaceuticals and other chemicals. Third, the relative effectiveness of different appropriability mechanisms varies between product and process innovations; patents, for instance, are regarded as being more effective in protecting product than process innovations, while the opposite appears to hold for secrecy (cf. Table 1). Fourth, there appears to be a positive relationship between firm size and the effectiveness of patent protection (e.g., Arundel et al. 1995; Cohen et al. 2000; Combe and Pfister 2000; Sattler 2002; Barros 2004). Fifth, the importance of patents tends to increase with the R&D intensity of the firm (Combe and Pfister 2000; Sattler 2002; Barros 2004) and with participation in R&D collaboration (Sattler 2002; Barros 2004).
Product Process Product Process Product Process Product Process Product Process Product Process Product Process
Patents 3 4 4 4 2 3 4 4 2 3 2 4 4 4Secrecy 4 3 2 1 4 1 3 3 3 1 4 1 2 3Lead Time 2 1 1 2 1 2 2 1 1 4 1 3 1 1Sales & Service 1 2 3 3 3 4 1 2 - - - - - -Complexity - - - - - - - - 4 2 3 2 3 2
1987 2000 2002 1995Levin et al. Cohen et al. Harabi Arundel et al. Combe & Pfister ArundelCohen et al.
EuropeJapan France1995 1999 2001
US US
N=650 N=1118/1087 N=721 N=2849N=567/522
Switzerland
N=358 N=840
7 European countries

24
Further analyses of the survey data can also reveal interesting insights into the factors that affect the effectiveness of different appropriability mechanisms. Arundel (2001) uses data from the 1993 European Community Innovation Survey (CIS) to study the relative effectiveness of patents and secrecy for appropriation. The question of the relative effectiveness of patents and secrecy is of particular interest because those two appropriability mechanisms are often considered mutually exclusive since patenting entails public disclosure of the technical details of the innovation. Arundel finds that the probability that a firm views patenting as being more effective than secrecy increases with firm size in the context of product innovations. Moreover, he finds (weak) evidence that firms engaged in R&D collaboration tend to value patenting more relative to secrecy than others in protecting product innovations.
2.1.3 Propensity to patent at the innovation level
Confined to the use of industry and firm level data, empirical research on the propensity to patent has primarily concentrated on studying the effects of the scale of activities, market structure, and appropriability conditions on patenting. De Melto et al. (1980), Saarinen (2005), and Van der Panne and Kleinknecht (2005) are exceptions in that they provide information on the variations in the propensity to patent at the innovation level. The key findings of these studies are outlined below.
De Melto et al. (1980) surveyed 170 firms from five Canadian industries15 in an effort to collect data on their major innovations developed during the 1960–1979 period. The survey produced data on approximately 300 innovations. Cross-tabulations of the propensity to patent against various variables of interest point towards the following results. First, new innovations are patented more frequently than incremental improvements, and the propensity to patent is higher for original than for imitative innovations. Second, the propensity to patent increases with the development costs of the innovation. Third, innovations based
15 The industries were Telecommunications Equipment and Components, Electrical Industrial Equipment, Plastics Compounds and Synthetic Resins, Nonferrous Smelting and Refining, and Crude Petroleum Production.

25
on externally acquired technology are patented more often than innovations developed in-house. Fourth, large firms appear to patent a larger fraction of their innovations than smaller ones. Fifth, the propensity to patent varies over time.
In a major effort to investigate industrial renewal in Finland during the period 1945–1998 from the perspective of innovations, Saarinen (2005) complemented the Sfinno database compiled at VTT Innovation Studies by collecting data for the period 1945–1984. Taken together, Sfinno and Saarinen’s H-inno contain data on over 3000 Finnish innovations. Cross-tabulations of the propensity to patent against the firm size and age for the period 1985–1998 suggest that the propensity to patent decreases with firm age, while there appears to be a U-shaped relationship between firm size and the propensity to patent. However, Saarinen’s data indicates that these relationships have not been stable over time. For the period 1967–1984, for instance, the propensity to patent appears to increase with both firm size and age. Such findings highlight the need for a more detailed investigation of the propensity to patent at the innovation level that simultaneously considers the relevant factors that affect the propensity to patent.
Van der Panne and Kleinknecht (2005) seek to take the innovation-level analysis of the propensity to patent a step further by performing a multivariate analysis of factors affecting the propensity to patent on a sample of Dutch innovations. Their logit analysis, however, is confined by a limited number of observations (N = 216) and explanatory variables (5). Van der Panne and Kleinknecht’s results suggest that the propensity to patent declines with firm age or size and increases with the number of partners in R&D collaboration. Moreover, they find that innovators with products that are radically new – rather than incremental improvements – and new to the market – rather than only to the firm – tend to have a higher propensity to patent.
Before turning to the empirical analysis of the propensity to patent in Chapter 4, the main hypotheses on the determinants of the propensity to patent are outlined in Section 2.2 and the Sfinno methodology and data presented in Chapter 3.

26
2.2 Hypotheses on the determinants of the propensity to patent
The equilibrium search model of innovation developed by Kultti et al. (2007) implies that for intermediate levels of patent strength there exists a mixed equilibrium in which identical innovations are patented by some firms and kept secret by others. Notwithstanding the possibility of observing an equilibrium propensity to patent between zero and one in the context of homogeneous innovations and innovators, in reality the empirically observed propensities to patent are likely to be shaped to a great extent by the heterogeneity of innovations, markets, and innovators. To the extent that the characteristics of innovations, markets, and innovators influence the costs and benefits of patenting, they also affect the propensity to patent. Hence it should be possible to identify several attributes of the firm, the market, and the innovation that are of interest in a model for the propensity to patent. The purpose of this section is to outline the main hypotheses on the determinants of the propensity to patent emerging from both empirical and theoretical literature. The first subsection addresses hypotheses related to the characteristics of the innovating firm, while the second discusses those related to the characteristics of the innovation and the market.
2.2.1 Characteristics of the firm
The relationship between firm size and the propensity to patent has been a subject of interest for quite some time (see, e.g., Scherer 1965, 1983; Schmookler 1966; Taylor and Silberston 1973; Bound et al. 1984; Mansfield 1986; König and Licht 1995; Arundel and Kabla 1998; Duguet and Kabla 1998; Licht and Zoz 1998; Brouwer and Kleinknecht 1999; Arora et al. 2003), but the evidence remains inconclusive. Even though recent research suggests a positive relationship between firm size and patenting propensity (Arundel and Kabla 1998; Duguet and Kabla 1998; Arora et al. 2003), there are reasons to believe that the relationship might not be as clear-cut as it seems at first sight. For one thing, the smallest firms are missing from most of the firm-level studies, while the innovation-level studies of Saarinen (2005) and Van der Panne and Kleinknecht (2005) suggest that very small (young) firms can exhibit high propensities to patent. On the other hand, firm size might not be independent of

27
the characteristics of innovations developed in the firm. Reinganum (1983) and Henderson (1993), for instance, demonstrate that entrants have greater incentives to invest in “sufficiently radical innovations”. Similarly, Holmström (1989) shows that internal organization problems and capital market pressures can handicap large firms in inherently risky innovation activities, while it is generally acknowledged that radical innovation is more uncertain than incremental innovation (e.g., Kline and Rosenberg 1986; Reinganum 1983; Henderson 1993). In accordance with these suggestions, Tanayama’s (2002) analysis of the Sfinno data indicates that firm size has a negative impact on the probability of an innovation being radical. Conversely, different arguments have also arisen. Schmookler (1966:35) argues that “one cannot doubt that the largest-scale inventions are usually attempted in large firms”, and Duguet and Kabla (1998) suggest that the research effort of a firm might be correlated with the magnitude of its innovations.
All in all, it seems clear that the differences in the observed propensities to patent in the firm-level investigations might also reflect differences in the characteristics of innovations, not only some inherent firm size-related patenting propensities. Hence it is of great importance to control for the characteristics of innovations when investigating the impact of firm-level factors on the propensity to patent, and vice versa. This will be attempted in the empirical investigation in Chapter 4.
A natural explanation for the positive relationship between firm size and the propensity to patent is that economies of scale exist in patenting due to the fixed cost of maintaining a legal department dealing with intellectual property rights (e.g., Scherer 1965; Comanor and Scherer 1969; Lerner 1995; Arundel and Kabla 1998; Duguet and Kabla 1998; Licht and Zoz 1998; Cohen et al. 2000; Hall and Ziedonis 2001). There may also be potential for learning curve benefits in the patenting process. Lerner (1995), for instance, suggests that firms learn to manage internal and external counsel more efficiently when they accumulate experience of litigation. This gives rise to a significant learning curve in the patent litigation process. Moreover, it has been argued that small firms cannot utilize the patent system as efficiently as larger firms because obtaining and enforcing patents might be prohibitively costly for many small firms with minimal patent portfolios (e.g., Kitching and Blackburn 1999; Cohen et al. 2000; Lanjouw and Schankerman 2004). Lanjouw and Schankerman (2004), for

28
instance, find that the litigation risk declines with the size of the patent portfolio. These considerations give rise to the following hypothesis:
Hypothesis 1: Patenting activity is subject to economies of scale.
Despite the problems that a small firm might experience in obtaining and enforcing patents, there are several reasons why small firms might patent more intensively than others. Levin et al. (1987:797), for instance, argue that “for small, start-up ventures, patents may be a relatively effective means of appropriating R&D returns, in part because some other means, such as investment in complementary sales and service efforts, may not be feasible”. Similarly, Griliches (1990:1676–1677) suggests that for small firms
“… patents may represent their major hope for ultimate success and hence would lead them to pursue them with more vigor. A well-established major firm does not depend as much on current patenting for its viability or the survival of its market position. Thus, even at an equal underlying inventiveness rates, the propensity to patent may be lower for large firms, at least relative to the successful new entrants in their field.”
Small start-ups may often be unable to commercialize their innovations efficiently in embodied form (Cohen and Klepper 1996), and they thus seek to exploit their innovative technologies through licensing or through a complete transfer of intellectual property. In such situations patents are important for reducing transaction costs and facilitating trade in immaterial property (Arora et al. 2001). Hall and Ziedonis (2001), for instance, find that in the US semiconductor industry specialized design firms entering the industry since 1982 – when the “pro-patent” Court of Appeals for the Federal Circuit was established in the US – patent more intensively than the older market incumbents. Moreover, patents can play an important role as signals of attributes of the firm and the innovations that are deemed positive by outsiders such as venture capitalists and potential collaborators (e.g., Cohen et al. 2000; Kortum and Lerner 2000; Long 2002; Hall 2005). The need for external funding in start-up ventures can also encourage patenting because in order to attract funding the innovator must usually disclose the details of the innovation (Kortum and Lerner 2000). This can render secrecy a problematic means for appropriation, making

29
formal property rights such as patents an attractive alternative. Hence the following hypothesis is proposed:
Hypothesis 2: Start-up ventures exhibit a high propensity to patent.
The above discussion implies that the relationship between firm size and the propensity to patent may well be non-monotonic. Disentangling of the different size-related effects proposed in Hypotheses 1 and 2 is attempted in the empirical part of this study.
Furthermore, the above discussion suggests that small start-up ventures are more dependent on patent protection than larger firms while experiencing a disadvantage in obtaining and enforcing patents. If such an imbalance in the value and cost of patent protection across different firms exists in reality, it should have important implications for the optimal design of the patent system. The ideas model of innovation (Green and Scotchmer 1995; O’Donoghue et al. 1998; Scotchmer 2004) highlights the importance of also providing small start-ups with sufficient incentives to innovate. The ideas model assumes that ideas for innovation are scarce and exogenous, while the materialization of an innovation requires both an idea as well as an investment in it. In this context it is highly probable that not all valuable ideas originate in the research labs of large corporations, and thus also small entities need to be provided with sufficient incentives for developing their ideas into innovations.
2.2.2 Characteristics of the innovation and the market
The previous subsection discussed the characteristics of the firm that affect the propensity to patent, while this subsection outlines the hypotheses related to characteristics of the innovation and the market. Innovation and market characteristics are discussed together since they are highly interdependent. Innovations can redefine existing markets, change the market structure, or even create totally new markets. On the other hand, the value of innovations is determined to a great extent by the characteristics of the market, such as demand and competition. Furthermore, patents, as legal rights to exclude, naturally intervene in this relationship.

30
Theoretical economic literature suggests that the size16 of an innovation can have an effect on the propensity to patent the innovation. Denicolò and Franzoni (2003) assess the impact of the size of an innovation on the propensity to patent in the context of the contract theory of patents and find that under the assumption of a linear demand function, innovations are more likely to be patented if they are large. This is because the rival has a greater incentive to duplicate the innovation if it is large, while patenting can be used to block duplication and secure monopoly profit for the duration of the patent. Horstmann et al. (1985) arrive at a similar conclusion when studying patents as information transfer mechanisms. That is, they model a game of strategic patenting in which the rival can draw inferences about the innovator’s private information on the basis of the patenting decision. Their reasoning for the finding is, however, very different from that of Denicolò and Franzoni (2003). Horstmann et al. (1985) argue that, in the context of a cost-reducing innovation, a greater cost reduction raises the innovator’s output in the product market and thus makes imitation less attractive. Hence the decision to patent need not convey such a strong signal of unprofitability of imitation and patenting can be allowed to occur more often. Anton and Yao (2004), on the other hand, arrive at the opposite conclusion on the basis of their model of cost-reducing innovation. In the Anton and Yao model patents offer limited protection while entailing disclosure of enabling knowledge to rivals as well as providing a signal of the total knowledge of the innovator. Anton and Yao (Ibid:3) argue that “… weak property rights imply disclosure incentives that are relatively stronger for smaller innovations, and as a result, larger innovations are protected more through secrecy as a response to the problem of imitation”.
Protection from imitation – rather than signaling of cost-efficiency to competitors, which plays a central role in the Anton and Yao (2004) model – is constantly reported as the primary motive for patenting in innovation surveys (e.g., Arundel et al. 1995; Duguet and Kabla 1998; Combe and Pfister 1999; Cohen et al. 2000, 2002; Blind et al. 2006). Hence the hypothesis about the
16 Following the relevant theoretical literature (Denicolò and Franzoni 2003; Anton and Yao 2004), the term size (large vs. small) of an innovation is adopted in the present study instead of relatively synonymous alternatives such as the radicalness (radical vs. incremental) of an innovation. Issues related to the definition and measurement of the size of innovations in the empirical context will be discussed in Chapter 3.

31
relationship between the size of an innovation and the propensity to patent is based on the findings of Denicolò and Franzoni (2003) and Horstmann et al. (1985), which are also in line with the empirical investigations of De Melto et al. (1980) and Van der Panne and Kleinknecht (2005). This expectation is further buttressed when the assumption of the theoretical models that all innovations are patentable is relaxed. In order to be patentable, an invention has to be industrially applicable and of patentable subject matter (cf. Patents Act of Finland: Section 1), and it needs to satisfy the requirements of novelty and non-obviousness (cf. Patents Act of Finland: Section 2). Consequently, firms are likely to expect that patents are granted for large innovations with a higher probability than for smaller ones, and this is probably taken into account when making the patenting decision. On the basis of these considerations, the following hypothesis is put forth:
Hypothesis 3: Large innovations are patented more frequently than smaller ones.
Another attribute of innovations that can affect the propensity to patent is the complexity of an innovation. Scherer (1983) and Levin et al. (1987), for instance, suggest that patenting of complex technological systems is more difficult than patenting of more discrete innovations. Levin et al. (1987) argue that the novelty of a discrete innovation can be relatively easily demonstrated in a patent application and infringement is relatively easy to verify when innovations are discrete. This is clearly more difficult to do for complex systems. Moreover, technological complexity can make innovations more difficult to imitate, thus reducing the need for patent protection. Scherer (1983) finds empirical evidence that innovations described as systems or subsystems yield fewer patents per unit of R&D expenditure than others. These arguments give rise to the following hypothesis:
Hypothesis 4: Very complex innovations are patented less often than others.
The reasoning that led to Hypothesis 4 drew upon the impact of the technological and physical character of an innovation on the effectiveness and attractiveness of patents as a means for appropriating returns to innovation. On the other hand, complex technologies that are developed cumulatively may be subject to a high-degree of technological interdependence between competing

32
firms (e.g., Cohen et al. 2000; Hall and Ziedonis 2001). In such environments firms can be highly dependent on cross-licensing for developing and marketing their innovative products as the intellectual property rights required to market a certain product get fragmented to a number of players. This is because such technological environments give rise to what Shapiro (2000:1–2) calls a patent thicket – that is, “a dense web of overlapping intellectual property rights that a company must hack its way through in order to actually commercialize new technology”. Thus firms may enter into patent portfolio races in order to improve their bargaining positions relative to others, leading them to patent inventions that would otherwise be left unpatented (Hall and Ziedonis 2001). Cohen et al. (2000) find that firms in complex product industries are more likely to obtain patents for using them in cross-licensing negotiations than firms in discrete product industries. Such behavior is likely to lead to higher propensities to patent; hence the following hypothesis is suggested:
Hypothesis 5: Cumulative technologies entail high propensities to patent.
Disentangling of the different complexity-related effects discussed in relation to Hypotheses 4 and 5 is attempted in the empirical part of this study.
One of the most robust findings emerging from the empirical literature reviewed in Section 2.1 is that the propensity to patent varies across industrial sectors. The origins of such differences are not entirely clear, however, since the variations can arise, for instance, as a result of the technological nature of the innovations or the characteristics of the markets such as the degree of competition. The software industry, for instance, probably experiences low propensities to patent because of issues related to the patentability of software rather than because of other attributes of the industry such as concentration. On the other hand, Denicolò and Franzoni (2003) argue that tight competition in the product market discourages duplication by the rival and thus makes patenting less attractive relative to secrecy for the innovator. Hence the degree of competition also affects the propensity to patent. These considerations lead to the following hypotheses:
Hypothesis 6: The propensity to patent varies across technology classes.
Hypothesis 7: The propensity to patent declines with product market competition.

33
The results of Brouwer and Kleinknecht (1999), Arundel (2001), Van der Panne and Kleinknecht (2005), and Peeters and Van Pottelsberghe de la Potterie (2006) indicate that firms that engage in R&D collaboration exhibit higher propensities to patent than others. It is argued that this is due to the need to protect proprietary knowledge in the face of collaborative knowledge sharing and to clarify issues of ownership over co-developed innovations (e.g., Brouwer and Kleinknecht 1999; Peeters and Van Pottelsberghe de la Potterie 2006). Moreover, collaboration with scientific institutions may result in high propensities to patent as the researchers’ incentives to publish the underlying findings can render secrecy an unattainable means for appropriation. This gives rise to the following hypothesis:
Hypothesis 8: Innovations developed in collaboration with external partners are patented more often than others.
Scherer (1965, 1983) found that the more government R&D support an industry received, the less patents it obtained per unit of R&D. According to Scherer (1965:1099), this was “… no doubt because exclusive rights cannot be retained for patents received in connection with government contacts”. In Scherer’s studies government R&D support meant to a large extent public procurement of defense and space applications. In the context of the present study, on the other hand, public R&D support mainly takes the form of R&D subsidies that do not pose obstacles for obtaining property rights on the inventions. Quite the contrary in fact: public R&D support can often be complemented with immaterial support such as legal advice on intellectual property protection, which can lower the costs of obtaining patent protection. Moreover, since the reporting requirements associated with public R&D support imply some disclosure of the innovators activities, public funding can encourage patenting. Patenting of the underlying invention may also be used to signal the novelty of the invention and the capability of the innovator when applying for public support. Hence the following hypothesis is proposed:
Hypothesis 9: Innovations developed with the help of public R&D support are patented more frequently than others.
34
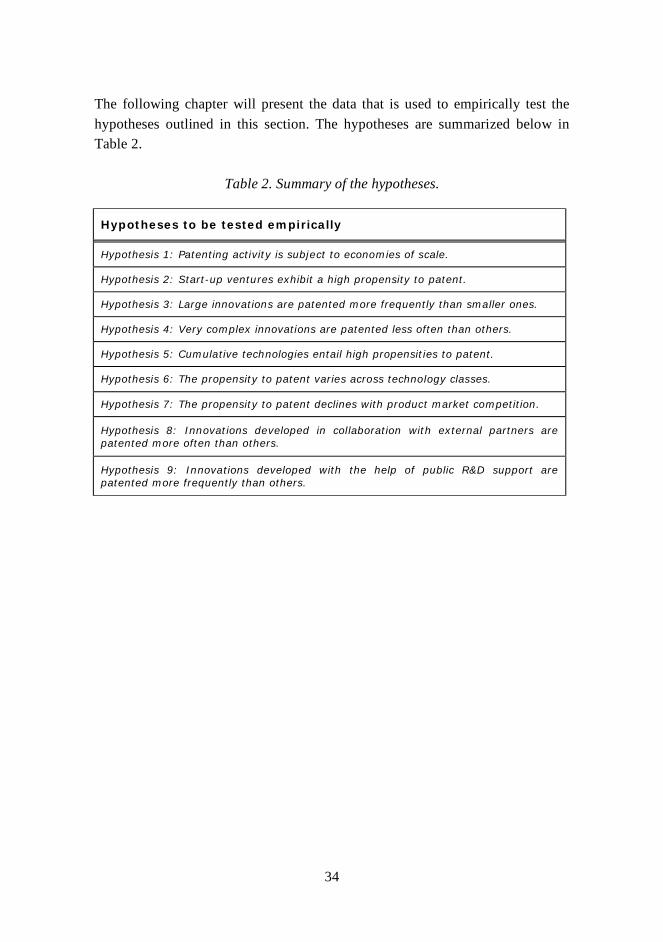
The following chapter will present the data that is used to empirically test the hypotheses outlined in this section. The hypotheses are summarized below in Table 2.
Table 2. Summary of the hypotheses.
Hypotheses to be tested empirically
Hypothesis 1: Patenting activity is subject to economies of scale.
Hypothesis 2: Start-up ventures exhibit a high propensity to patent.
Hypothesis 3: Large innovations are patented more frequently than smaller ones.
Hypothesis 4: Very complex innovations are patented less often than others.
Hypothesis 5: Cumulative technologies entail high propensities to patent.
Hypothesis 6: The propensity to patent varies across technology classes.
Hypothesis 7: The propensity to patent declines with product market competition.
Hypothesis 8: Innovations developed in collaboration with external partners are patented more often than others.
Hypothesis 9: Innovations developed with the help of public R&D support are patented more frequently than others.

35
3. Sfinno methodology and data
As evidenced by the literature review in Section 2.1, patenting has thus far been studied primarily at the level of industries and firms. However, the failure to control for innovation-level factors in these studies makes interpretation of the empirical results subject to speculation. Moreover, the absence of innovation-level variables has rendered innovation-related hypotheses emerging from the theoretical literature untestable in the industry and firm level studies. Hence innovation-level data is needed to advance our understanding of the variations in the propensity to patent across firms, industries, and innovations. The Sfinno database compiled at VTT Innovation Studies (formerly VTT Group for Technology Studies) contains approximately 1600 Finnish innovations and provides detailed information on roughly 800 of these combined with data on the corresponding firms responsible for bringing the innovations to market. The Sfinno approach and data are discussed in detail, for instance, in Palmberg et al. (1999, 2000), Tanayama (2002), and Saarinen (2005). This chapter briefly introduces the Sfinno approach (Section 3.1) and describes the variables of interest for the present study (Section 3.2).
3.1 The Sfinno approach
The Sfinno approach builds upon the object-based method of collecting data on innovative activities directly at the level of individual innovations. Pioneering endeavors in collecting innovation data using the object-based method include – but are not limited to – the compilation of extensive innovation databases at the Science Policy Research Unit (SPRU) at the University of Sussex in the UK (e.g., Pavitt 1983, 1984) and at the Furures Group in the US (e.g., Acs and Audretsch 1990, 1993). At SPRU the identification of innovations was based on the opinion of experts knowledgeable about innovative activities in their respective areas of expertise, while the Futures Group used the literature-based method and identified innovations from trade and technical journals. The literature-based approach has later been followed, for instance, in the Netherlands (Kleinknecht et al. 1993), Austria (Fleissner et al. 1993), Ireland (Cogan 1993), the UK (Steward 1993; Coombs et al. 1996), and Italy (Santarelli and Piergiovanni 1996).

36
The Sfinno methodology combines the literature-based method with the expert opinion method in order to produce a comprehensive dataset with a good coverage across different industries and firm size groups (Palmberg et al. 2000). A systematic review of 18 carefully selected trade and technical journals from the period 1985–1998 has been complemented with a review of annual reports of large firms from the same period as well as with expert opinion-based identification of innovations (see Palmberg et al. 1999, 2000; and Saarinen 2005 for details). The review of trade and technical journals resulted in the identification of some 1100 innovations, while the review of annual reports and expert-opinion yielded about 500 additional innovations giving rise to a dataset of approximately 1600 innovations. In line with the Schumpeterian definitions (Schumpeter 1912) and drawing loosely upon the Oslo Manual (OECD 1992, 1997, 2005), the Sfinno approach defines an innovation as an invention that has been commercialized on the market by a business firm or an equivalent, and the inclusion of an innovation in the database requires that the innovation is a technologically new or significantly enhanced product compared to the firm’s previous products (Palmberg et al. 1999, 2000). Moreover, since the Sfinno-approach relies heavily on public sources in the identification of innovations, it is clearly more conducive to studying product than process innovations. Hence innovations only developed for the firm’s internal use are not included in the Sfinno database (Ibid).
In order to collect additional data on the innovations and the development processes, a survey questionnaire was designed and sent to respondents knowledgeable about the specific innovations in question. Identification of an allegedly relevant respondent was possible for some 1300 innovations and around 800 questionnaires were returned, giving rise to a response rate of over 60 percent (Tanayama 2002). Moreover, the survey data was complemented with firm-specific data from firm registers and patent databases. This study is based on a sample of the survey data for which the relevant variables are available. The sample contains 791 innovations from 555 firms. Figure 2 shows the number of firms in the sample with a given number of innovations in the sample. The fact that the data contains several innovations from certain firms suggests that the observations may be subject to within-firm correlation. This issue will be addressed in Chapter 4.

37
Figure 2. Firms in the sample with a given number of innovations.
An important limitation to innovation-level data collection is that it cannot be based on standard statistical sampling since the underlying population of innovations is unknown (e.g., Palmberg et al. 1999, 2000; Leppälahti 2000; Palmberg 2001; Tanayama 2002; Kleinknecht et al. 2002). Hence, as Tanayama (2002) points out, there is clearly a trade-off between obtaining innovation-level data and collecting data with the desired statistical properties. According to Palmberg (2001:3), data collection in the spirit of the Sfinno approach could instead be described as “a designed census with the aim of identifying all possible products adhering to the specific definition used”. Furthermore, Palmberg (2001) argues that “the coverage of the [Sfinno] database in terms of industries and firm size groups is nonetheless relatively representative of innovative activity in Finnish industry” (cf. Leppälahti 2000; Palmberg et al. 2000). All in all, it can be argued that the Sfinno database is relatively representative of significant Finnish product innovations and using it to test the hypotheses presented in the previous chapter should advance our understanding of factors affecting the propensity to patent.
01
00
20
03
00
40
05
00
Num
ber
of
firm
s in t
he s
am
ple
1 2 3-5 6-10 11-20 more (22)Number of innovations in the sample by the firm

38
3.2 Variables of interest
Given the innovation-level nature of the data and the definition of the propensity to patent as the fraction of innovations for which at least one patent application is filed, the dependent variable for the econometric analysis of Chapter 4 takes the form of a binary variable (PATAPP) indicating whether or not at least one patent application was filed for the innovation of interest. It is already of considerable interest as such that patent protection was sought for less than 60 percent of the 791 relatively significant product innovations contained in the data sample (see Table 3 at the end of this section). Patenting is clearly not a self-evident outcome of an innovation process that results in the commercialization of an innovation. In Chapter 2 various characteristics of the innovation, the market, and the innovating firm were hypothesized to have an effect on the propensity to patent. The purpose of this section is to introduce the variables designed to capture these characteristics. The variables are based on the data obtained from the Sfinno survey as well as on the complementary data available in the Sfinno database (see, e.g., Palmberg et al. 1999 for a description of the information included in the Sfinno database).
In order to disentangle the different size-related effects proposed in Hypotheses 1 and 2, a number of size-related variables need to be constructed. First, the number of employees in the innovating firm at the year the innovation was commercialized (EMP) is used as a measure of firm size17. Furthermore, the observations are classified into four categories on the basis of this measure. The categories of less than 10 employees, 10–99 employees, 100–999 employees, and 1000 or more employees give rise to four dummy variables (EMP1, EMP2, EMP3, and EMP4). Second, R&D intensity of the innovating firm is measured as the ratio of R&D to sales (R&DINT). Third, an innovating firm is defined as an innovative start-up if the idea for the innovation had arisen before or during the year in which the firm was established18. The start-up status is coded as a
17 If the data is missing for the commercialization year, data from the closest available year is used. 18 The underlying logic behind this definition is that a firm is an innovative start-up if the idea for the innovation arose before the firm was established. However, since information is available only on the year in which the idea originated, it is not possible to specify whether the idea arose before or after the establishment of the firm for the

39
binary variable (STARTUP). Fourth, in order to address the presence of economies of scale in the patenting activity, a measure of the scale of patenting is needed. Unfortunately, construction of such a measure is problematic because the data does not contain information on the date a patent application was (possibly) filed for the innovation. Hence it is possible that the decision to patent affects the variable designed to measure the scale of prior patenting, causing simultaneous causality. Two measures of the scale of the patenting activity are constructed that should not be very sensitive to simultaneous causality. The decision of whether or not to file a patent application for the innovation of interest should not have much of an impact on whether the innovating firm had filed more than 60 patent applications during the six-year period leading to the commercialization of the innovation. Firms that had filed more than 60 applications are considered to possess a large patent portfolio and the occurrence of such a portfolio is coded as a binary variable (LARGEPP). Similarly, the patenting decision of interest should not have much of an impact on the number of patent applications the firm filed the year before the development of the innovation began (PATENTS). The annual counts of patent applications used in constructing these variables are coded as the higher of the number of patent applications the firm filed with either the National Board of Patents and Registration of Finland or the European Patent Office during the given year. The problem of simultaneous causality related to these variables will be addressed in Chapter 4.
Measurement of the size of innovations or classification of innovations with respect to their size is a problematic issue even from the theoretical perspective. The complex and multidimensional nature of technological change makes it difficult to distinguish between large and small innovations, especially as innovations can be large in some dimensions while being small in others, as demonstrated by Henderson (1993). The size – or radicalness – of an innovation can be defined, for instance, in terms of the technological novelty or magnitude of improvement and the socio-economic impact of the innovation (e.g., Schumpeter 1912; Freeman and Perez 1988), the magnitude of cost reduction
observations that had the same year for the arousal of the idea and the establishment of the firm. Hence the firms established during the year in which the idea arose are also regarded as start-ups in the empirical investigation.

40
and the economic implications of the innovation on the market structure (e.g., Arrow 1962), or the effect the innovation has on the competencies of firms (see, e.g., Abernathy and Clark 1985; Tushman and Anderson 1986).
Furthermore, even if a certain theoretical definition of the size of an innovation is adopted, empirical measurement of the size is hardly straightforward. In order to address Hypothesis 3, the present study seeks to measure the size of the innovations by introducing four binary variables that capture different dimensions of the novelty and significance of the innovations. The variable NOVFIRM is coded as one for innovations that were specified as entirely new rather than major or minor improvements relative to the innovating firm’s existing product by the survey respondent from the firm. Similarly, NOVMARK is coded as one if the innovation was specified to be new on the world market rather than just on the Finnish market. The variable SCIENCE seeks to proxy the technological novelty of the innovation. SCIENCE is coded as one if a new scientific breakthrough was specified as an important or very important (on a four-point Likert scale) factor for initiating the development of the innovation. Finally, the variable SIGNIF is introduced to pick out the truly significant innovations. This variable is based on a survey of experts drawn from industry, academia, and the public sector (see Hyvönen 2001 for details on the survey and the data). The experts were asked to evaluate the significance19 of the Sfinno innovations relating to their area of expertise on a four-point Likert scale (1–4). SIGNIF is coded as one if the mean score for the innovation is 3.5 or more.
In order to disentangle the different complexity-related effects proposed in Hypotheses 4 and 5, two binary variables are constructed. First, the variable COMPLEX is designed to capture the technological and physical complexity of the innovations relevant for testing Hypothesis 4. COMPLEX is coded as one if the innovation was classified as highly complex in Hyvönen’s 4-category taxonomy (e.g., Tanayama 2002:56–57; Saarinen 2005:160–161) by the VTT researchers. Hyvönen’s definition of a highly complex innovation is identical to the corresponding definition by Kleinknecht (1993:44). Highly complex
19 The definition of a significant innovation adopted for the survey is that the innovation has to be economically and technologically significant and apart from economic success may have had significant impact on the industry (Hyvönen 2001:4).
41
innovations are defined as systems consisting of numerous parts or components originating from different disciplines. Second, the variable CUMULTECH is designed to proxy the technological interdependence resulting from fragmentation of intellectual property rights (IPR) to cumulatively developing technologies (cf. Hypothesis 5). CUMULTECH is coded as one if availability of a license was specified as an important or very important (on a four-point Likert scale) factor for initiating the development of the innovation.
In Chapter 2 product market competition was hypothesized to have a negative impact on the propensity to patent (cf. Hypothesis 7). Unfortunately, empirical measurement of the degree of competition is a prevailing challenge in empirical industrial organization. Measures of market concentration such as the Herfindahl–Hirschman index and concentration ratios follow standard definitions and can be objectively measured once the markets of interest are identified. However, such data is usually only readily available for industrial sectors and on a given level of aggregation and thus does not necessarily correspond to the relevant markets of interest. Consequently, a rough proxy emerging from the Sfinno data is used to measure the degree of competition in this study, instead of measures such as concentration ratios20. The binary variable PRICOMP is coded as one if price competition was specified as an important or very important (on a four-point Likert scale) factor for initiating the development of the innovation. The usefulness of this variable as a proxy for the degree of product market competition hinges on the assumption that the ex post product market competition – that is, competition after the innovation is introduced to the market – correlates strongly enough with the ex ante competition – that is, competition before the market introduction of the innovation.
The answers to the Sfinno survey questions on whether the development of the innovation had involved public funding or collaboration give rise to binary variables PUBFUND and COLLAB respectively. Moreover, collaboration in general is disaggregated into collaboration with customers, subcontractors,
20 Concentration ratios (e.g., CR3, CR5, CR10) based on the NACE classification (General Industrial Classification of Economic Activities within the European Communities) at the three-digit level were also tested as measures of product market competition but they failed to be statistically significant in any of the specifications by a wide margin. Hence the variable PRICOMP was adopted for the present study.
42
universities and research institutes, and competitors. The binary variables CUSTCOLLAB, SUBCONCOLLAB, RINSTCOLLAB, and COMPCOLLAB are coded as ones if collaboration with foreign or domestic customers, subcontractors, universities or research institutes, or competitors, respectively, was specified as important or very important (on a four-point Likert scale) for the development of the innovation.
In addition to the variables introduced above, sets of dummy variables are introduced to control for differences in the propensity to patent across technology classes and time periods. Furthermore, the technology class dummies allow for a test of Hypothesis 6. Ten technology class dummies are constructed on the basis of the technology classification presented in Appendix A. The dummies refer to the one-digit technology classes with the exception that the two-digit classes of ‘agrochemistry and foodchemistry’ and ‘environmental technology’ are picked out from their respective one-digit classes because the propensity to patent in these two-digit classes differs significantly from the propensity to patent in the rest of the one-digit class. Moreover, eleven time period dummies are constructed so that for the early years as well as for the most recent years the time periods contain more than one year. Such classification is used in order to have a sufficient number of observations in each time period class since the observations are not uniformly distributed in time, as shown in Figure 3.

43
Figure 3. Distribution of observations over time.
The variables of interest introduced above are summarized in Table 3. In addition to listing the variables and their definitions, Table 3 also presents the means and standard deviations of all the variables.
02
04
06
08
0
Num
ber
of
innovati
ons in t
he s
am
ple
before 1980 1980 1985 1990 1995 2000Commercialization year of the innovation

44
Table 3. Summary of the variables of interest.
Dependent variable Definition Type Mean St. Dev.
PATAPP Patent application was filed for the innovation (yes/no) 1/0 0.5740 0.4948
Explanatory variables
Firm characteristics
EMP Number of employees in the firm at the year of the commercialization # 1113.873 2495.891
EMP1 0-9 employees in the firm at the year of the commercialization (yes/no) 1/0 0.3552 0.4789
EMP2 10-99 employees in the firm at the year of the commercialization (yes/no) 1/0 0.2149 0.4110
EMP3 100-999 employees in the firm at the year of the commercialization (yes/no) 1/0 0.2048 0.4038
EMP4 1000 or more employees in the firm at the year of the commercialization (yes/no) 1/0 0.2250 0.4179
R&DINT Ratio of R&D expenditures to sales at the year of the commercialization # 0.1321 0.2006
STARTUP The firm was defined as a start-up developing an innovation (yes/no) 1/0 0.3603 0.4804
PATENTS Number of patent applications filed by the firm the year before the development of the innovation started # 3.4463 11.5744
LARGEPP The firm had a large patent portfolio at the year of the commercialization (yes/no) 1/0 0.0885 0.2842
SIGNIF The innovation was specified as very significant by experts (yes/no) 1/0 0.0518 0.2218
NOVFIRM The innovation was entirely new to the firm (yes/no) 1/0 0.6157 0.4867
NOVMARK The innovation was new to the world market (yes/no) 1/0 0.7206 0.4490
SCIENCE Scientific breakthrough was important for initiating the development of the innovation (yes/no) 1/0 0.1555 0.3626
COMPLEX The innovation was specified as very complex by experts (yes/no) 1/0 0.0291 0.1681
CUMULTECH Availability of a license was important for initiating the development of the innovation (yes/no) 1/0 0.0582 0.2342
PRICOMP Price competition was important for initiating the development of the innovation (yes/no) 1/0 0.2781 0.4484
PUBFUND Public funding was received for the development of the innovation (yes/no) 1/0 0.6498 0.4773
COLLAB Collaboration was associated with the development of the innovation (yes/no) 1/0 0.8698 0.3368
CUSTCOLLAB Collaboration with customers was important for the development of the innovation (yes/no) 1/0 0.6561 0.4753
SUBCONCOLLAB Collaboration with subcontractors was important for the development of the innovation (yes/no) 1/0 0.3578 0.4796
RINSTCOLLAB Collaboration with universities or research institutes was important for the development of the innovation (yes/no) 1/0 0.4513 0.4979
COMPCOLLAB Collaboration with competitors was important for the development of the innovation (yes/no) 1/0 0.0822 0.2748
Technology classes
CONSUM The innovation belongs to 1-digit technology class 60 'Consumption goods and equipment' (yes/no) 1/0 0.0329 0.1784
ELECTRO The innovation belongs to 1-digit technology class 10 'Electrotechnology' (yes/no) 1/0 0.0860 0.2805
INSTRU The innovation belongs to 1-digit technology class 20 'Instruments' (yes/no) 1/0 0.1416 0.3489
CHEM The innovation belongs to 1-digit technology class 30 'Chemistry, pharmaceutical technology' excluding 35 (yes/no) 1/0 0.0594 0.2366
AGRI&FOODCHEM The innovation belongs to 2-digit technology class 35 'Agrochemistry, foodchemistry' (yes/no) 1/0 0.0544 0.2269
PROCTECH The innovation belongs to 1-digit technology class 40 'Process technology, special equipment' exluding 48 (yes/no) 1/0 0.2579 0.4378
ENVIRO The innovation belongs to 2-digit technology class 48 'Environmental technology' (yes/no) 1/0 0.0253 0.1571
MACH The innovation belongs to 1-digit technology class 50 'Mechanical engineering, equipment' (yes/no) 1/0 0.1884 0.3913
EARTH&WATER The innovation belongs to 1-digit technology class 70 'Earth construction and hydraulic engineering, mining' (yes/no) 1/0 0.0367 0.1881
SOFT The innovation belongs to 1-digit technology class 80 'Software' (yes/no) 1/0 0.1176 0.3223
Time periods
PRE1986 The innovation was commercialized before 1986 (yes/no) 1/0 0.1264 0.3325
YEARS86-87 The innovation was commercialized in 1986-87 (yes/no) 1/0 0.0645 0.2458
YEARS88-89 The innovation was commercialized in 1988-89 (yes/no) 1/0 0.0619 0.2412
YEARS90-91 The innovation was commercialized in 1990-91 (yes/no) 1/0 0.0809 0.2729
YEAR1992 The innovation was commercialized in 1992 (yes/no) 1/0 0.0683 0.2524
YEAR1993 The innovation was commercialized in 1993 (yes/no) 1/0 0.0872 0.2824
YEAR1994 The innovation was commercialized in 1994 (yes/no) 1/0 0.0885 0.2842
YEAR1995 The innovation was commercialized in 1995 (yes/no) 1/0 0.0910 0.2878
YEAR1996 The innovation was commercialized in 1996 (yes/no) 1/0 0.1113 0.3146
YEAR1997 The innovation was commercialized in 1997 (yes/no) 1/0 0.0999 0.3000
POST1997 The innovation was commercialized after 1997 (yes/no) 1/0 0.1201 0.3253
Innovation and market characteristics

45
4. Econometric analysis
This chapter first lays out the econometric model to be estimated (Section 4.1), then outlines the methods for estimation and testing (Section 4.2), and finally presents the results from estimation and testing of the econometric model (Section 4.3).
4.1 Modeling the propensity to patent at the innovation level
Formulation of a model for the propensity to patent at the level of innovations requires an innovation-level definition of the propensity to patent. Following the frequency interpretation of probability associated with probability theorists such as John Venn (1876), the probability of an event can be interpreted as the relative frequency of occurrences of the event within a reference class. Hence the definition of the propensity to patent as ‘the fraction of innovations for which at least one patent application is filed’ gives rise to a corresponding probability interpretation. The propensity to patent can be understood as the probability that at least one patent application is filed for an innovation belonging to a given reference class (cf. Arora et al. 2003:6). More formally, the propensity to patent an innovation can be defined as the conditional probability:
!
Pr y =1x[ ],
where y =1 if at least one patent application is filed, and
0 otherwise,
" # $
and x % x1 ,x2 ,...,xK( ) is a vector of K variables that determines
the reference class.
(1)
Since the objective of the present study is to investigate how the propensity to patent is affected by the characteristics of the innovation, the market, and the innovating firm, the primary interest lies in how the propensity to patent changes in response to changing the reference class – that is, the primary interest lies in the estimation of the partial effects. The partial effect of a continuous variable xj is defined as the partial derivative

46
!
"Pr y =1x[ ] "x j , (2)
while the partial effect of a binary variable xj is defined as the difference in the propensities to patent
!
Pr y =1x" j ,x j =1[ ] " Pr y =1x" j ,x j = 0[ ],
where x" j # x1 ,x2 ,...,x j"1 ,x j+1 ,...,xK( ).
(3)
In what follows, an econometric model is formulated that allows for the estimation of the partial effects of x on the propensity to patent.
The probability definition of the propensity to patent allows for a formulation of a model for the propensity to patent in the spirit of random utility models (RUMs) pioneered by Marschak (1960). Following Train (2003:18–21), the model is specified as follows:
i. An innovating firm files a patent application for its innovation if the (expected) utility from the innovation given the patent application, U1, is higher than the (expected) utility when no patent application is filed, U0.
ii. U1 and U0 are known to the innovating firm, but not to the researcher. Instead, the researcher observes x, a vector of observable attributes of the innovation, the market, and the innovating firm.
iii. Following the random utility formulation, the utilities are decomposed as
!
U1 =V1(x) +!1 ,
U0 =V0(x) +! 0 , (4)
where V1(x) and V0(x) are functions that relate the observed attributes, x, to the utilities U1 and U0, respectively, and e1 and e0 capture the differences between U1 and V1(x), and U0 and V0(x), respectively. Because e1 and e0 are not known to the researcher, they are treated as random variables.
iv. The propensity to patent conditional on the observable attributes of the innovation, the market, and the innovating firm, x, can now be specified as

47
!
Pr y =1x[ ] = Pr U1 >U0[ ]
= Pr V1(x) +!1 >V0(x) +! 0[ ]
= Pr ! 0 "!1 <V1(x) "V0(x)[ ]
= F V1(x) "V0(x)( ),
!
where F is the cumulative distribution function of ! " ! 0 #!1 .
(5)
On the basis of this formulation of the propensity to patent it is possible to specify an econometric model that allows for inference on how the propensity to patent an innovation varies as a function of x. This requires the specification of V1(x) and V0(x) as well as the distribution of e1 and e0. Following the conventional econometric practice, V1(x) and V0(x) are assumed to be linear in parameters – that is, V1(x) = x´β1 and V0(x) = x´β0. A natural behavioural assumption for e1 and e0 is that they are normally distributed, which implies that e
!
" e0 – e1 is also normally distributed. Furthermore, an innocent normalization of the mean of e to zero and the variance to unity is possible as long as the model contains a constant term (e.g., Greene 2003:669). Under these assumptions, the model for the propensity to patent becomes the standard probit model for binary choice:
!
Pr y =1x[ ] = F V1(x) "V0(x)( )
= F # x $1 " $ 0( )( )= F # x $( )
=% # x $( ),
!
where " is the standard normal cumulative distribution
function and # $ #1 % # 0 is the vector of parameters to be
estimated.
(6)
4.2 Methods for estimation and testing
In order to draw statistical inferences on how the observable attributes of the innovation, the market, and the innovating firm affect the propensity to patent, the probit model formulated in the previous section (4.1) needs to be estimated on a sample of data. The maximum likelihood estimation (MLE) methods

48
pioneered by R. A. Fisher (1922, 1925) provide a means for estimating the parameters, but several properties of the data can cause complications for obtaining an unbiased and consistent estimator and a valid asymptotic variance matrix. First, owing to the object-based method of data collection, the Sfinno data contains multiple innovations from certain firms; thus the observations are potentially subject to within-firm correlation due to unobserved firm-specific effects. Hence the standard assumption of independency of observations fails and the cluster sample characteristics of the data must be accounted for when the model is estimated. Second, if exogeneity of the explanatory variables is compromised as a result of problems such as correlation with omitted variables, measurement error, and simultaneous causality, the probit estimator naturally becomes biased and inconsistent. Third, as Yatchew and Griliches (1985) point out, while complications such as heteroscedasticity of the error term and omission of variables that are independent of the included explanatory variables leave OLS estimates unbiased and consistent, they result in inconsistent parameter estimates in the context of probit models estimated with MLE methods.
The following subsections will first present the methods for estimating the probit model in the context of unobserved firm effects (Subsections 4.2.1 and 4.2.2) and then discuss the problems of endogeneity and heteroscedasticity (Subsections 4.2.3 and 4.2.4).
4.2.1 Pooled estimation with unobserved effects and omitted heterogeneity
This subsection demonstrates that as long as the unobserved firm effects and omitted heterogeneity are independent of the included explanatory variables, they do not pose serious problems for the econometric analysis. The subsection primarily draws upon the material in Wooldridge (2002) and Cameron and Trivedi (2005) that is relevant for estimation with data that suffers from within-cluster correlation. Notation follows Wooldridge (2002). In what follows, i indexes the cluster, i.e. the firm, g indexes the unit, i.e. the innovation, and N is the total number of firms and Gi the total number of innovations by firm i in the data. The index i is suppressed to simplify notation when the interest lies in the properties of the underlying model rather than in the estimation of the model on a sample of data.

49
In order to account for the within-firm correlation that probably arises as a result of unobserved firm effects in the Sfinno data, firms are treated as clusters in the econometric analysis. Because of the within-cluster correlation, the standard assumption of independence of observations fails and specification of the joint distribution of yi
!
" (yi1,…,yiGi) conditional on xi
!
" (xi1,…,xiGi) for each cluster i becomes complicated. Hence the traditional maximum likelihood estimator (MLE) based on specification of f(yx;β), the full joint density of y given x, cannot be readily utilized. However, the pooled probit model
!
Pr yig =1x ig[ ] =" # x ig$( ), g =1,...,Gi (7)
can be consistently estimated by a quasi-MLE, which Wooldridge (2002) calls the partial maximum likelihood estimator (PMLE), given that the univariate densities fg(ygxg;β) are correctly specified for each g. Consistency of the PMLE does not require that Πg fg(ygxg;β) is the density of y given some set of conditioning variables. However, dependence of y1,…,yGi results in a failure of the information matrix equality; thus cluster-robust asymptotic variance matrix and cluster-robust test statistics need to be computed instead of the usual ones.
The partial maximum likelihood estimator and the corresponding asymptotic variance matrix can be obtained as follows. Let β0 denote the true value of β and define the partial log likelihood for each cluster i as li(β)
!
" ∑g log fg(yigxig;β). Moreover, let the hat symbol refer to an estimate. The PMLE for the pooled probit model is obtained by solving the following maximization problem:
!
max"
log fg yig x ig;"( )g=1
Gi
#i=1
N
# ,
where log fg yig x ig;"( ) = yig log$ % x ig"( )+ 1& yig( )log 1&$ % x ig"( )[ ].
(8)
Following Wooldridge (2002:406), the asymptotic variance matrix for the PMLE can be defined as follows:

50
!
V ˆ " [ ] = A0
#1B0A0
#1N , where
A0 = #E $"2l i (" 0)[ ] = # E $"
2l ig(" 0)[ ]
g=1
Gi
% = E A ig(" 0)[ ]g=1
Gi
% ,
B0 = E s i (" 0)s i (" 0 & ) [ ] = E s ig(" 0)
g=1
Gi
%'
( ) )
*
+ , ,
s ig(" 0)
g=1
Gi
%'
( ) )
*
+ , ,
&-
. /
0 /
1
2 /
3 / ,
A ig(" 0) = #E $"2l ig(" 0) x ig[ ], and
s ig(" ) =$"l ig(" & ) .
(9)
Since the information matrix equality cannot be expected to hold, B0 ≠ A0 and thus separate estimates are needed for A0 and B0. Hence the asymptotic variance matrix is estimated by the sandwich estimate
!
ˆ V [
!
ˆ " ]
!
= ˆ A 0"1 ˆ B 0
ˆ A 0"1
/N – associated with Huber (1967) and White (1980, 1982) – that is generalized to account for dependence within clusters (e.g., Williams 2000; Wooldridge 2002:406–408). The cluster-robust estimator of the asymptotic variance matrix provides cluster-robust standard errors for the estimated parameters and allows for computation of cluster-robust Wald tests. The cluster-robust Wald test statistic, W, for testing a null hypothesis with Q restrictions, H0: c(β0) = 0, can be computed as
!
W = c( ˆ " # ) ˆ C ̂ V ˆ " [ ] # ˆ C ( )$1
c( ˆ " ),
where ˆ C %&" c(" )"= ˆ "
and ˆ V ˆ " [ ] is the cluster - robust estimator
of the asymptotic variance matrix
(10)
(e.g., Cameron and Trivedi 2005:226; Greene 2003:486–488; Wooldridge 2002:362). This test statistic is asymptotically x2 distributed under the null hypothesis with Q degrees of freedom (Ibid).
The parameter estimates that result from the estimation of the pooled model are generally referred to as population averaged since the cluster-specific effects are averaged out (Cameron and Trivedi 2005:787). For the sake of understanding the logic behind the population-averaged parameter estimates, it is useful to model the cluster-specific unobserved effects explicitly. In order to incorporate the unobserved firm effects into the model for the propensity to patent, the

51
decomposition of utilities from patenting and not patenting, shown in (4), should be modified as follows:
!
!
U1 =V1(x) +c1 +!1 ,
U0 =V0(x) +c0 +! 0 ,
where c1 and c0 are unobserved firm-specific attributes.
(11)
Just like e1 and e0, c1 and c0 are not known to the researcher and are thus treated as independent normally distributed random variables. Under these additional assumptions, the model for the propensity to patent becomes:
!
Pr y =1x,c[ ] = Pr U1 >U0[ ]
= Pr V1(x) +c1 +!1 >V0(x) +c0 +! 0[ ]
= Pr ! 0 "!1 <V1(x) +c1 "V0(x) "c0[ ]
=# V1(x) +c1 "V0(x) "c0( )
=# $ x %1 " % 0( )+c1 "c0( )=# $ x % +c( ),
!
where c " c1 #c0 ~ N 0, ! c
2[ ].
(12)
The assumption that c has a zero mean can be made without loss of generality as long as x contains a constant term.
Furthermore, it is assumed that once the unobserved effect of firm i, ci, is conditioned on, only xig appears in the response probability for the innovation g of firm i – that is, xig is strictly exogenous conditional on ci (Wooldridge 2002:483). Hence the unobserved effects model for the propensity to patent becomes:
!
Pr yig =1x i ,ci[ ] = Pr yig =1x ig ,ci[ ] =" # x ig$ +ci( ), g =1,...,Gi ,
where ci x i ~ N 0, ! c
2[ ].
(13)
A comparison of models (7) and (13) demonstrates that estimation of the pooled probit model of (7) results in an omission of the variable c from the model. Since omission of variables renders the probit estimates inconsistent, even if the omitted variables are independent of the included explanatory variables (cf.

52
Yatchew and Griliches 1985), the parameters of the pooled probit model can be expected to differ from those of the unobserved effects model. In fact, it can be shown that
!
" c = " 1+! c
2 , where βc and β are the vectors of parameters of the pooled and the unobserved effects models respectively (Wooldridge 2002:470–472, 483–486).
Despite the fact that the pooled probit consistently estimates the population-averaged parameters, βc, rather than β , estimation of the pooled model is sufficient as long as the interest lies in the signs of the parameters and in the average partial effects (APEs)21 rather than in the parameters as such. First, given that
!
1+! c
2 must be positive, one can obtain the signs of the parameters by estimating just the pooled model. Second, as Wooldridge (2002:472) points out, in order to obtain average partial effects, one can just estimate the model for Pr[y = 1x] since the partial effects of Pr[y = 1x] are always the average partial effects of Pr[y = 1x,c] across the distribution of c. For instance, for the unobserved effects model of (13), the average partial effect for a continuous variable xgj evaluated at the point
!
x g = x g* is
!
E "Pr y =1x g ,c[ ] "xgj xg=xg*{ } = #cj$
!
x g*"# c
$
% &
'
( ) ,
!
where "c# " 1+!
c
2,
!
" is the standard normal density function, and the expectation is taken with respect to the distribution of c.
(14)
The corresponding average partial effect for a binary variable xgj is
!
E Pr y =1x g1,c[ ] " Pr y =1x g
0,c[ ]{ } =# x g
1 $% c
&
' (
)
* + "# x g
0$% c
&
' (
)
* + ,
where
!
" c # " 1+! c
2 , the expectation is taken with respect to the distribution of c, and
!
x g1 and
!
x g0 denote vectors where xgj
equals 1 and 0 respectively, while other variables are fixed at the values at which the average partial effect is to be estimated.
(15)
21 Average partial effects (APEs) refer to the partial effects averaged across the population distribution of c (see, e.g., Wooldridge 2002:22–24, 470–472, 483–486).

53
The equations (14) and (15) clearly imply that consistent estimation of the population-averaged parameters is sufficient for consistently estimating the average partial effects of the unobserved effects model.
The delta method for obtaining the asymptotic variance matrix of a nonlinear function of parameters can be used to compute standard errors for the average partial effects. Let c(β) be the nonlinear function of interest, such as the vector of average partial effects. The asymptotic variance matrix of
!
c( ˆ " ) can be written as
!
V c( ˆ " )[ ] =C0Vˆ " [ ]C0
#,
where C0 $%" c(" ) "="0 and V ˆ " [ ] is the asymptotic variance
matrix of ˆ " .
(16)
The appropriate estimator of
!
V c( ˆ " )[ ] is
!
ˆ V c( ˆ " )[ ] = ˆ C ̂ V ˆ " [ ] ˆ C #,
where ˆ C $%" c(" ) "= ˆ " and ˆ V ˆ " [ ] is the appropriate estimator
of the asymptotic variance matrix of ˆ " .
(17)
(See, e.g., Cameron and Trivedi 2005:231; and Wooldridge 2002:43–45 for details.)
These results for the firm-specific unobserved effect c can be generalized to omission of any variables that are independent of the included explanatory variables. If the correct model is
!
Pr y =1x,z[ ] =" # x $ +!z( ),
where z is independent of x and z ~ N 0,"2[ ],
(18)
omitting z leads to the model
!
Pr y =1x[ ] =" # x $ !( ),
where !2 %"
2#
2 +1.
(19)

54
Hence, the model which omits z consistently estimates
!
" z = " ! rather than β . However, since s must be positive and the partial effects of Pr[y = 1x] are the average partial effects of Pr[y = 1x,z] across the population distribution of z, the signs of the parameters and the average partial effects can be estimated directly from the model that omits z. (Wooldridge 2002:470–472.) Hence, as Wooldridge (2002:470–472) concludes, omitted heterogeneity is not a problem in probit models as long as the heterogeneity is independent of x and there is no special reason to be interested in the magnitude of the parameters β as such.
4.2.2 Random effects probit estimation
Conditional maximum likelihood estimation of the unobserved effects model of (13), reproduced here as (20)
!
Pr yig =1x i ,ci[ ] = Pr yig =1x ig ,ci[ ] =" # x ig$ +ci( ), g =1,...,Gi ,
where ci x i ~ N 0, ! c
2[ ],
(20)
is also possible if an additional assumption is imposed on the model. Further assuming that yi1,…,yiGi are independent conditional on (xi,ci) allows the density of yi
!
" (yi1,…,yiGi) conditional on (xi,ci) to be written as
!
f y i x i ,ci;"( ) = f yig x ig ,ci;"( )g=1
Gi
# ,
where f yig x ig ,ci;"( ) =$ % x ig" +ci( )yig
1&$ % x ig" +ci( )[ ]1&yig
.
(21)
Now ci can be eliminated from the likelihood function by integrating over its distribution:
!
f y i x i;" ,! c2( ) = f y i x i ,ci;"( ) 1 ! c( )
#$
$
%
!
" ci ! c( ) dci . (22)
The integral can be approximated by Gauss–Hermite quadrature (see Butler and Moffitt 1982 for a detailed discussion in the context of the random effects probit

55
model), and
!
" and
!
! c
2 can be consistently estimated by solving the following maximization problem:
!
max" , !c
2log f y i x i;" ,! c
2( )i=1
N
# . (23)
(See, e.g., Cameron and Trivedi 2005:785–786, 795–796; Greene 2003:690–693; and Wooldridge 2002:483–486 for details.)
Estimation of the random effects probit model enables the computation of partial effects at c = 0 as well as the computation of the average partial effects (APEs) presented in (14) and (15). Moreover, the relative contribution of the unobserved cluster effect to the total variance can be measured as
!
! =" c
2
" c
2+1
(24)
which is also the intracluster correlation between the composite latent error
!
ci +! ig across any two units g. The null hypothesis of no unobserved effect can be tested by examining the statistical significance of either
!
ˆ ! c (Greene 2003:693) or
!
ˆ ! (Wooldridge 2002:488).
Unfortunately, the Sfinno data does not lend itself very well to random effects estimation. The data is extremely unbalanced and the majority of clusters only includes one observation and thus contains no information regarding the intracluster correlation (cf. Figure 2 in Chapter 3). Consequently, the pooled model constitutes the primary tool for analysis in the present study and the random effects model is estimated solely for comparison purposes and for formally testing for the presence of unobserved cluster effects.
4.2.3 Possible endogeneity of the patenting-scale variable
The problem with measuring the firms’ patenting activities prior to the patenting decision under investigation compromises the exogeneity of the variable designed to account for the scale of patenting activities. Because the data does not contain information on the date of the patent application, it is possible that

56
the decision to patent affects the variable designed to measure the scale of prior patenting, causing simultaneous causality. In order to mitigate this problem the scale of patenting is proxied by a binary variable (LARGEPP) indicating that the firm had acquired a large patent portfolio during the six-year period leading to the commercialization of the innovation. LARGEPP is coded as one if the firm obtained more than 60 patents during the six-year period that covered the commercialization year of the innovation and the five years prior to that. This measure of the scale of patenting activities should not be very sensitive to the patenting decision for the individual innovation, but it does not eliminate the potential for endogeneity completely. Hence the severity of this problem will be assessed by testing for the endogeneity of LARGEPP by a two-step procedure in the spirit of Smith and Blundell (1986) and Rivers and Vuong (1988). In practice, the test can be applied as follows (see Wooldridge 2002:472–478 for details). First, the potentially endogenous variable is regressed (using the standard OLS method) on the exogenous variables of the probit model and at least one additional instrument. Second, the probit model is estimated with the exogenous variables, the potentially endogenous variable, and the residuals of the first-stage regression as explanatory variables. Then the test of the null hypothesis of exogeneity can be based on the significance of the residual in the second-stage probit. Since the distribution of the first-stage error term plays no role under the null, such a test is valid without assuming normality or homoscedasticity of the first-stage error term and the test can be applied very broadly, even if the potentially endogenous variable is a binary variable (Wooldridge 2002:474).
An alternative measure of the scale of patenting activities that should not be very sensitive to simultaneous causality is the number of patent applications the firm filed the year before the development of the innovation started (PATENTS). This is based on the assumption that some development work needs to be undertaken before the original idea can be translated into a patentable application. The results from using PATENTS will be compared to those obtained by using LARGEPP, and the endogeneity of PATENTS will also be tested in the manner outlined above.
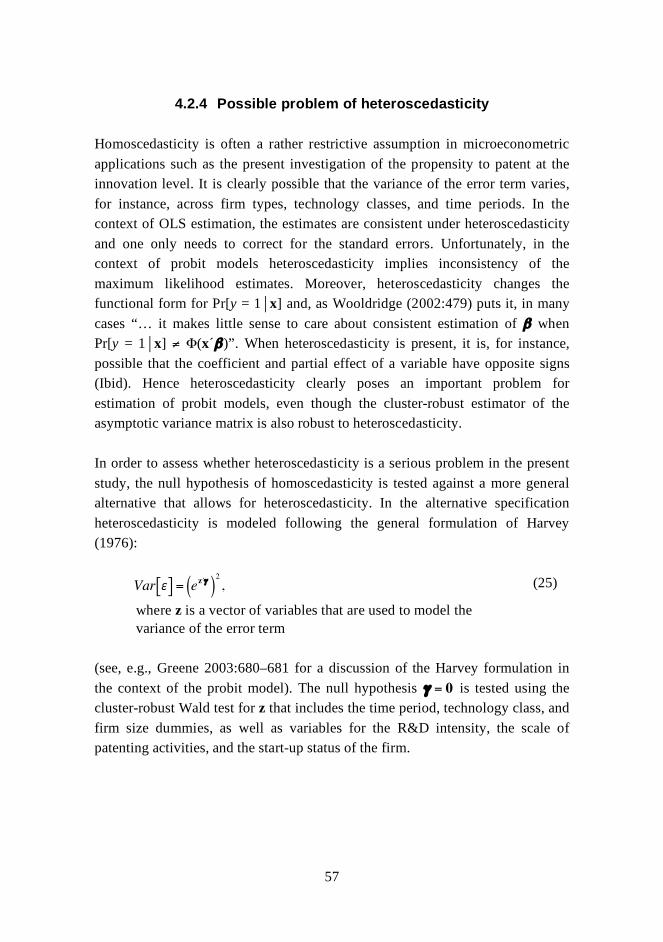
57
4.2.4 Possible problem of heteroscedasticity
Homoscedasticity is often a rather restrictive assumption in microeconometric applications such as the present investigation of the propensity to patent at the innovation level. It is clearly possible that the variance of the error term varies, for instance, across firm types, technology classes, and time periods. In the context of OLS estimation, the estimates are consistent under heteroscedasticity and one only needs to correct for the standard errors. Unfortunately, in the context of probit models heteroscedasticity implies inconsistency of the maximum likelihood estimates. Moreover, heteroscedasticity changes the functional form for Pr[y = 1x] and, as Wooldridge (2002:479) puts it, in many cases “… it makes little sense to care about consistent estimation of β when Pr[y = 1x] ≠ Φ(x´β)”. When heteroscedasticity is present, it is, for instance, possible that the coefficient and partial effect of a variable have opposite signs (Ibid). Hence heteroscedasticity clearly poses an important problem for estimation of probit models, even though the cluster-robust estimator of the asymptotic variance matrix is also robust to heteroscedasticity.
In order to assess whether heteroscedasticity is a serious problem in the present study, the null hypothesis of homoscedasticity is tested against a more general alternative that allows for heteroscedasticity. In the alternative specification heteroscedasticity is modeled following the general formulation of Harvey (1976):
!
Var ![ ] = e" z #( )
2
,
where z is a vector of variables that are used to model the variance of the error term
(25)
(see, e.g., Greene 2003:680–681 for a discussion of the Harvey formulation in the context of the probit model). The null hypothesis
!
" = 0 is tested using the cluster-robust Wald test for z that includes the time period, technology class, and firm size dummies, as well as variables for the R&D intensity, the scale of patenting activities, and the start-up status of the firm.

58
4.3 Results from estimation and testing
This section presents the results from estimation and testing of the econometric model. Subsection 4.3.1 lays out the estimation results from the pooled probit model, Subsection 4.3.2 presents the results from the tests for endogeneity and heteroscedasticity, and Subsection 4.3.3 compares the results with alternative models.
4.3.1 Results from the pooled probit model
This subsection presents the results from the estimation of the pooled probit model with a few different specifications. Tables 4 and 5 contain the partial maximum likelihood estimates for four different specifications. The estimates with respect to the dummy variables designed to control for differences in the propensity to patent across technology classes and time periods are predominantly suppressed from these tables and are, instead, presented in Appendix B. The coefficient estimates are accompanied by the corresponding cluster-robust standard errors and partial effects estimated at a point where firm size, technology class, and time period dummies are all zero and other variables are assigned their mean values. The partial effects are estimated at a point where variables belonging to a set of dummy variables are all zero in order to make the interpretation of the partial effects with respect to these variables meaningful. For comparison purposes, Appendix C presents the partial effects evaluated at the means of all the variables as well as the means of the partial effects computed over the observations. The partial effects are computed as partial derivatives for continuous variables and as discrete changes in the propensity to patent for binary variables. The significance level notation for the partial effects is based on standard errors computed using the delta method. As discussed in the previous section, the partial effects estimated from the pooled model can be interpreted as the average partial effects (APEs) – that is, as partial effects averaged across the population distribution of the firm-specific heterogeneity. Moreover, Tables 4 and 5 present the results from computation of cluster-robust Wald tests of several joint hypotheses as well as a number of measures relating to the goodness of fit of the models.

59
Table 4 presents the estimates for two specifications of the pooled probit model that do not contain other innovation or market-level variables than the technology class dummies. The purpose of this endeavor is to check whether the findings emerging from the Sfinno sample are consistent with the previous firm-level studies if the innovation-level characteristics are ignored. Moreover, estimation of these models provides a point of reference for examining how the results change when innovation-level characteristics are accounted for.
Table 4. Estimation results for Pooled Probit 1 and 2.
Dependent variable: PATAPP
Independent variables Robust Partial Robust Partial
Coef. Std. Err. effect Coef. Std. Err. effect
Firm size classes
(ref. EMP1)
EMP2 -0.2660** 0.1341 -0.1041** -0.1248 0.1455 -0.0477
EMP3 -0.4331*** 0.1468 -0.1706*** -0.3173** 0.1600 -0.1237**
EMP4 -0.1807 0.2327 -0.0702 -0.1945 0.2182 -0.0749
Other firm characteristics
R&DINT 0.6027** 0.2947 0.2288** 0.5534* 0.3054 0.2073*
STARTUP 0.4151*** 0.1256 0.1512***
LARGEPP 0.6186* 0.3359 0.2029**
Technology classes
(ref. CONSUM)
ELECTRO -0.2360 0.3100 -0.0921 -0.3256 0.3109 -0.1270
INSTRU -0.1678 0.2931 -0.0651 -0.2683 0.3001 -0.1042
CHEM 0.1314 0.3731 0.0487 0.0421 0.3742 0.0156
AGRI&FOODCHEM -0.5822* 0.3499 -0.2290* -0.5706* 0.3437 -0.2241*
PROCTECH 0.0523 0.2921 0.0197 -0.0131 0.2915 -0.0049
ENVIRO 1.0368** 0.4648 0.2883** 0.9239** 0.4654 0.2608**
MACH 0.1663 0.2878 0.0613 0.1134 0.2920 0.0415
EARTH&WATER -0.0425 0.3445 -0.0162 -0.1578 0.3504 -0.0605
SOFT -1.6392*** 0.4030 -0.5308*** -1.7864*** 0.3834 -0.5626***
Time periods (10 dummies)
Constant 0.2349 0.3008 0.0777 0.3081
Robust Wald tests for joint hypotheses !2 (df) p-value !
2 (df) p-value
H0: All coefs zero (exc. constant) 83.85 (23) 0.0000 133.14 (25) 0.0000
H0: All firm size class coefs zero 9.54 (3) 0.0229 3.96 (3) 0.2663
H0: All tech. class coefs zero 48.89 (9) 0.0000 54.64 (9) 0.0000
H0: All time period coefs zero 21.24 (10) 0.0195 21.10 (10) 0.0204
Number of observations 791 791
Log pseudolikelihood -462.56144 -452.20421
McFadden's pseudo R2 0.143 0.162
Efron's pseudo R2 0.183 0.203
McKelvey and Zavoina's pseudo R2 0.284 0.319
Percent correctly predicted
for observations with PATAPP=1 88.11 85.46
for observations with PATAPP=0 42.14 50.45
for all observations 68.52 70.54
See Appendix B for the estimates See Appendix B for the estimates
Pooled Probit 1 Pooled Probit 2
Significance level notation: *** 1%, ** 5%, * 10%. The partial effects are estimated at a point where firm size, technology class, and time period dummies are all zero and other variables are assigned their mean values. For comparison purposes, Appendix C presents the partial effects evaluated at the means of all the variables as well as the means of the partial effects computed over the observations. The partial effects are computed as partial derivatives for continuous variables and as discrete changes in the propensity to patent for binary variables. The significance level notation for the partial effects is based on standard errors computed using the delta method.

60
The estimation results in Table 4 show a nonlinear U-shaped relationship between firm size and the propensity to patent that can be captured to a relatively large extent by the binary variables for start-up ventures (STARTUP) and firms with large patent portfolios (LARGEPP). When STARTUP and LARGEPP are included in the model, the null hypothesis of the coefficients of the firm size dummies all being zero can no longer be rejected at any meaningful level of significance. The coefficients of both STARTUP and LARGEPP can be judged to be different from zero at least at the 10 percent significance level, while the estimated partial effects lend even stronger support for their positive impact on the propensity to patent. The results can be argued to be in accordance with the survey evidence of the positive relationship between firm size and the propensity to patent (e.g., Arundel and Kabla 1998; Duguet and Kabla 1998; Arora et al. 2003) since the firm-level surveys have ignored the small start-up ventures. The estimation results for Pooled Probit 1 (see Table 4) suggest that among the relatively large firms the propensity to patent increases with firm size. While being ignored in the firm-level studies, small start-ups are well represented in the Sfinno sample and Table 4 provides significant evidence of relatively high propensities to patent in start-up ventures.
Firm size is modeled using a set of dummy variables in order to allow flexibility in the relationship between firm size and the propensity to patent. An alternative approach is to use nonlinear transformations of the number of employees (EMP) to model the relationship. Appendix D presents the estimation results for specifications that are similar to those of Table 4, except that the set of firm size dummies is replaced by the logarithm of the number of employees (LNEMP) and the second power of the logarithm (LNEMP2)22. Figure 4 shows the relationship between the propensity to patent and firm size based on the estimation results of Appendix D, with technology class and time period dummies all fixed to zero and other variables (R&DINT in both specifications and STARTUP and LARGEPP in Pooled Probit 2b) to their means. Using continuous variables instead of the dummies does not significantly change any of the results nor does it improve the fit of the model. The firm size dummies are
22 Various specifications with the number of employees (EMP) and its powers as well as the logarithm of EMP and its powers were tested, but none of them significantly improved upon the model presented in Appendix D.
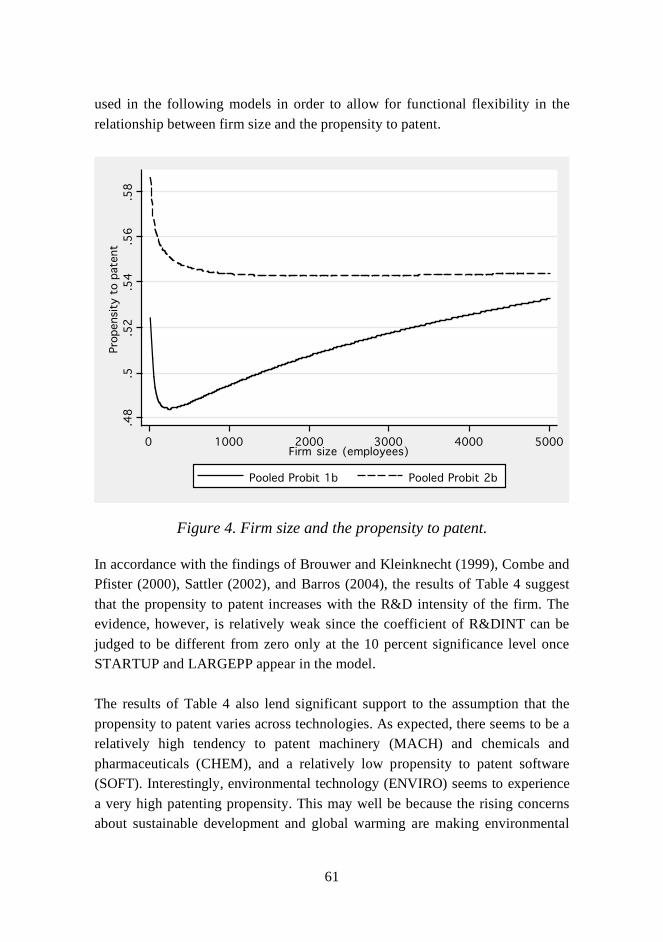
61
.48
.5.5
2.5
4.5
6.5
8
Pro
pensit
y t
o p
ate
nt
0 1000 2000 3000 4000 5000Firm size (employees)
Pooled Probit 1b Pooled Probit 2b
used in the following models in order to allow for functional flexibility in the relationship between firm size and the propensity to patent.
Figure 4. Firm size and the propensity to patent.
In accordance with the findings of Brouwer and Kleinknecht (1999), Combe and Pfister (2000), Sattler (2002), and Barros (2004), the results of Table 4 suggest that the propensity to patent increases with the R&D intensity of the firm. The evidence, however, is relatively weak since the coefficient of R&DINT can be judged to be different from zero only at the 10 percent significance level once STARTUP and LARGEPP appear in the model.
The results of Table 4 also lend significant support to the assumption that the propensity to patent varies across technologies. As expected, there seems to be a relatively high tendency to patent machinery (MACH) and chemicals and pharmaceuticals (CHEM), and a relatively low propensity to patent software (SOFT). Interestingly, environmental technology (ENVIRO) seems to experience a very high patenting propensity. This may well be because the rising concerns about sustainable development and global warming are making environmental

62
technology increasingly important, and the early innovators in this growing field might seek to secure a share of returns to the later-generation innovations in the course of cumulative development of the technology in the future.
The estimation results presented in Table 4 lend support to Hypotheses 1, 2, and 6, which propose that patenting activity is subject to economies of scale, start-up ventures exhibit a high propensity to patent, and the propensity to patent varies across technology classes, respectively. In what follows the objective is to investigate how innovation and market-level characteristics affect the propensity to patent, and whether or not the conclusions emerging from the results of Table 4 change when innovation and market-level characteristics are controlled for.
Table 5 presents the estimation results for two specifications that extend upon the specifications of Table 4 by incorporating various innovation and market-level variables in the model. Pooled Probit 4 differs from Pooled Probit 3 in that it seeks to disaggregate collaboration in general into collaboration with specific types of partners.

63
Table 5. Estimation results for Pooled Probit 3 and 4.
Dependent variable: PATAPP
Independent variables Robust Partial Robust Partial
Coef. Std. Err. effect Coef. Std. Err. effect
Innovation and market characteristics
SIGNIF 0.6389** 0.2944 0.2359** 0.5415* 0.3009 0.2043**
NOVFIRM 0.4397*** 0.1275 0.1740*** 0.4345*** 0.1281 0.1720***
NOVMARK 0.8429*** 0.1116 0.3244*** 0.8096*** 0.1131 0.3122***
SCIENCE 0.3008** 0.1432 0.1178** 0.2638* 0.1465 0.1038*
COMPLEX -0.6263** 0.2505 -0.2398*** -0.6275** 0.2554 -0.2396***
CUMULTECH 0.5557** 0.2305 0.2087** 0.5217** 0.2304 0.1977**
PRICOMP -0.2439* 0.1306 -0.0970* -0.2640** 0.1344 -0.1050**
PUBFUND 0.2706** 0.1288 0.1076** 0.1870 0.1215 0.0745
COLLAB -0.1342 0.1498 -0.0531
CUSTCOLLAB -0.1401 0.1309 -0.0557
SUBCONCOLLAB 0.0313 0.1122 0.0125
RINSTCOLLAB 0.3265** 0.1311 0.1293**
COMPCOLLAB 0.1310 0.2168 0.0519
Firm size classes
(ref. EMP1)
EMP2 -0.0180 0.1570 -0.0072 -0.0178 0.1607 -0.0071
EMP3 -0.1858 0.1753 -0.0740 -0.2081 0.1824 -0.0828
EMP4 -0.1945 0.2173 -0.0774 -0.2197 0.2198 -0.0873
Other firm characteristics
R&DINT 0.0126 0.3054 0.0050 -0.0471 0.3044 -0.0188
STARTUP 0.2768* 0.1421 0.1094** 0.2854** 0.1446 0.1129**
LARGEPP 0.5885* 0.3563 0.2209* 0.6441* 0.3459 0.2403**
Technology classes (9 dummies)
Time periods (10 dummies)
Constant -1.0490*** 0.3715 -1.1547*** 0.3698
Robust Wald tests for joint hypotheses !2 (df) p-value !
2 (df) p-value
H0: All coefs zero (exc. constant) 208.52 (34) 0.0000 203.34 (37) 0.0000
H0: All firm size class coefs zero 1.76 (3) 0.6236 2.16 (3) 0.5396
H0: All tech. class coefs zero 50.67 (9) 0.0000 47.96 (9) 0.0000
H0: All time period coefs zero 21.75 (10) 0.0164 20.54 (10) 0.0245
H0: PUBFUND=CUSTCOLLAB=
SUBCONCOLLAB=COMPCOLLAB=0- - 3.87 (4) 0.4246
Number of observations 791 791
Log pseudolikelihood -392.08695 -387.64693
McFadden's pseudo R2 0.273 0.282
Efron's pseudo R2 0.340 0.349
McKelvey and Zavoina's pseudo R2 0.475 0.488
Percent correctly predicted
for observations with PATAPP=1 85.68 85.46
for observations with PATAPP=0 68.25 67.06
for all observations 78.26 77.62
Pooled Probit 3 Pooled Probit 4
See Appendix B for the estimates
See Appendix B for the estimates
See Appendix B for the estimates
See Appendix B for the estimates
Significance level notation: *** 1%, ** 5%, * 10%. The partial effects are estimated at a point where firm size, technology class, and time period dummies are all zero and other variables are assigned their mean values. For comparison purposes, Appendix C presents the partial effects evaluated at the means of all the variables as well as the means of the partial effects computed over the observations. The partial effects are computed as partial derivatives for continuous variables and as discrete changes in the propensity to patent for binary variables. The significance level notation for the partial effects is based on standard errors computed using the delta method.
The estimation results presented in Table 5 provide support for Hypothesis 3, which proposes that large innovations are patented more often than others. All

64
variables designed to capture different dimensions of the size of the innovation (SIGNIF, NOVFIRM, NOVMARK, SCIENCE) display positive coefficients and sizeable positive partial effects (see also partial effects computed at means of all the variables and the means of partial effects computed over the observations presented in Appendix C). Variables for innovations entirely new to the firm (NOVFIRM) and new to the world market (NOVMARK) have coefficients and partial effects that can be concluded to differ from zero even at the 1 percent significance level. Moreover, the variables for very significant innovations (SIGNIF) and innovations triggered by scientific breakthroughs (SCIENCE) also display coefficients and partial effects that can be judged to differ from zero at least at the 10 percent significance level.
Furthermore, the estimation results presented above lend support to the hypotheses related to the effect of the complexity of innovations on the propensity to patent. The variables designed to capture the technological complexity of the innovations (COMPLEX) and the fragmentation of intellectual property rights (IPR) to cumulatively developing technology (CUMULTECH) help to disentangle the opposite complexity-related effects on the propensity to patent discussed in Section 2.2. First, the coefficient and partial effect of COMPLEX are negative and statistically different from zero (at least at the 5 percent significance level), suggesting that very complex innovations are patented less often than others – as proposed in Hypothesis 4. Second, the coefficient and partial effect of CUMULTECH are positive and statistically different from zero (at least at the 5 percent significance level). The finding that dependence on the availability of a license in the development of an innovation increases the propensity to patent indicates that fragmentation of IPR encourages patenting and supports the proposition of Hypothesis 5 that cumulative technologies entail high propensities to patent.
Incorporation of firm and market-level variables into the model does not change the result that the propensity to patent varies across technology classes as proposed in Hypothesis 6. Environmental technology (ENVIRO) remains to experience a significantly high propensity to patent, while software (SOFT) appears to be patented relatively rarely as expected (see Appendix B).
Table 5 shows a negative coefficient for the variable designed as a proxy for the degree of competition in the product market. The coefficient and partial effect

65
appear to differ from zero at least at the 10 percent significance level, lending some support to Hypothesis 7, which proposes that the propensity to patent declines with competition in the product market. However, this result needs to be taken with a grain of salt since price competition in the product market might be expected to trigger product differentiation and incremental change rather than development of large innovations (cf. Tanayama 2002). If the variables designed to measure the size of the innovation fail to capture the effect of the size on the propensity to patent in its entirety, it is possible that price competition is negatively associated with the propensity to patent because it affects the type of innovative activity rather than the propensity to patent directly.
Assessment of Hypotheses 8 and 9 is somewhat problematic because public R&D support and collaboration, especially with universities and other research institutes, are associated with each other as well as with the size of the innovation. Tekes (Finnish Funding Agency for Technology and Innovation), the main public funding organization for R&D in Finland, for instance, favors projects that include collaboration with other firms or universities and research institutes23. Public funding and collaboration with universities and research institutes, on the other hand, are probably associated with relatively large innovations (cf. Tanayama 2002). Pooled Probit 3 seems to lend support to Hypothesis 9 on the positive effect of public R&D support (PUBFUND) on the propensity to patent, while it fails to generate evidence that collaboration (COLLAB) would affect the propensity to patent (cf. Hypothesis 8). Pooled Probit 4, on the other hand, suggests that collaboration with universities and other research institutes (RINSTCOLLAB) has a positive effect on the propensity to patent, while it fails to produce evidence that public support (PUBFUND) or collaboration with partners of other types (CUSTCOLLAB, SUBCONCOLLAB, COMPCOLLAB) would affect the propensity to patent in one direction or the other.
The observation that the coefficient of PUBFUND fails to differ from zero in a statistically significant manner when collaboration in general is disaggregated into collaboration with specific types of partners suggests that public R&D
23See http://www.tekes.fi/eng/tekes/rd/evaluation_criteria.htm for the evaluation criteria Tekes uses in its R&D funding decisions.

66
support may correlate with factors that affect the propensity to patent, such as collaboration with universities and other research institutes, rather than strongly affecting it directly. In the discussion leading to Hypothesis 8, it was argued that the need to protect proprietary knowledge in the face of collaborative knowledge sharing and to clarify issues of ownership over co-developed innovations increases the propensity to patent in firms that engage in R&D collaboration. Peeters and Van Pottelsberghe de la Potterie (2006) refer to this as the ‘need’ effect and argue that this should be of particular importance in collaboration with competitors. Furthermore, they argue that the ‘novelty’ effect – that is, the tendency of R&D collaboration to lead to the generation of more ‘fundamental and breakthrough knowledge’ than in-house R&D – would dominate in partnerships with scientific institutions. The finding that collaboration with universities and other research institutes (RINSTCOLLAB) has a positive effect on the propensity to patent, while collaboration with competitors (COMPCOLLAB) does not appear to affect the propensity to patent, suggests that it is the ‘novelty’ effect rather than the ‘need’ effect which has a significant effect on the propensity to patent (cf. Peeters and Van Pottelsberghe de la Potterie 2006). This indicates that the finding of a positive relationship between R&D collaboration and the propensity to patent in studies such as Brouwer and Kleinknecht (1999) might be due to the ‘novelty’ effect rather than the ‘need’ effect. An alternative explanation for the significant impact of collaboration with universities and other research institutes on the propensity to patent is that collaboration with scientific institutions may result in high propensities to patent because the researchers’ incentives to publish the underlying findings can render secrecy an unattainable means for appropriation.
The findings with regard to Hypotheses 1 and 2, which propose that patenting activity is subject to economies of scale and start-up ventures exhibit a high propensity to patent, remain consistent with those obtained from estimating the model without innovation and market-level variables. The coefficients of both STARTUP and LARGEPP are judged to be different from zero at least at the 10 percent significance level, while the estimated partial effects of Pooled Probit 4 provide somewhat stronger support for their positive impact on the propensity to patent. In contrast to the results obtained from estimation without innovation and market-level variables, R&D intensity (R&DINT) no longer appears to have a positive impact on the propensity to patent in the specifications of Table 5. This finding suggests that the positive impact of R&D intensity on the propensity to

67
patent observed in studies such as Brouwer and Kleinknecht (1999) may be due to the effect R&D intensity has on the size of innovations rather than directly affecting the propensity to patent. Similarly, the positive relationship between exporting activities and the propensity to patent observed, for instance, in Licht and Zoz (1998) and Arundel and Kabla (1998) may result from exporting firms developing larger innovations – or better yet, firm’s with larger innovations choosing to export them – rather than having an inherently higher propensity to patent (see Appendix E for some evidence).
As discussed in Subsection 4.2.3, the variable designed to account for the scale of patenting activities may be subject to simultaneous causality. Such endogeneity can compromise the validity of the result that patenting activity is subject to economies of scale. However, it is somewhat reassuring that if LARGEPP is excluded from the model, the coefficient of EMP4 increases as expected. An alternative measure of the scale of patenting activities to LARGEPP that should not be very sensitive to simultaneous causality is the number of patent applications the firm filed the year before the development of the innovation started (PATENTS). The results obtained by using either PATENTS or LARGEPP are very similar (see Appendix F for results of specifications with PATENTS), while using PATENTS provides somewhat stronger support for the economies of scale hypothesis. The endogeneity of LARGEPP is tested for in the following subsection.
The null hypothesis that the coefficients of all the time period dummies are zero can be rejected in all of the specifications of Tables 4 and 5. Somewhat surprisingly, the estimated coefficients of all the time period dummies (see Appendix B) are positive, suggesting that the propensity to patent has been the lowest during the most recent period (after 1997), even though the number of patent applications filed in Finland by domestic applicants has been growing relatively steadily from 1980 to 2000 (cf. Figure 5). However, cluster-robust Wald tests of the null hypothesis that the coefficients of all the time period dummies, except the one for the pre-1986 period (PRE1986), are zero yields p-values of 0.1498 and 0.1444 for Pooled Probit 3 and 4 respectively. Hence such a hypothesis cannot be rejected, even at the 10 percent significance level. The relatively high propensity to patent in the pre-1986 period, on the other hand, might reflect the size of the innovations that made it to the Sfinno sample, despite the fact that they were commercialized prior to the period covered by the

68
journals reviewed in collecting the Sfinno data (1985–1998). Nevertheless, there appears to be no evidence that the increase in the number of patent applications would be due to a general increase in the propensity to patent significant product innovations (cf. the explanations for the recent surge in patenting in the US presented, e.g., in Kortum and Lerner 1999; Hall and Ziedonis 2001; and Hall 2005).
Figure 5. The number of patent applications filed in Finland by domestic applicants 24.
4.3.2 Testing for endogeneity and heteroscedasticity
The endogeneity of the patenting-scale variable LARGEPP is formally tested in the spirit of Smith and Blundell (1986) and Rivers and Vuong (1988) as described in Subsection 4.2.3. In practice, this means that first LARGEPP is
24 Data source: National Board of Patents and Registration of Finland.
10
00
15
00
20
00
25
00
Num
ber
of
pate
nt
applic
ati
ons f
iled b
y d
om
esti
c a
pplic
ants
1980 1985 1990 1995 2000Year
69
regressed on the exogenous explanatory variables of the probit model and at least one additional instrument, and then the probit model is estimated with the residual of the first-stage regression as an additional explanatory variable.
Identification of the second-stage probit requires that at least one of the explanatory variables of the first-stage regression be excluded from the probit model. The firm size dummies as well as the R&D intensity variable are natural candidates for instruments to be excluded from the probit model since they are important determinants of the scale of patenting (cf. Subsection 2.1.1) but are not expected to affect the propensity to patent directly. The size-related hypotheses of Chapter 2 propose that the start-up status and the scale of patenting are responsible for the association between size and scale and the propensity to patent, while the null hypotheses that firm size and R&D intensity can be excluded from the innovation-level model for the propensity to patent cannot be rejected once these factors are controlled for (cf. Table 5). Furthermore, firm size and R&D intensity should not be subject to simultaneous causality that threatens the patenting-scale variable since the decision of whether or not to patent an innovation hardly affects the size or R&D intensity of the innovating firm.
Table 6 presents the results for three specifications of the test for endogeneity. The first excludes the set of firm size dummies, the second the R&D intensity variable, and the third both of them from the probit model (cf. Pooled Probit 4 in Table 5). Table 6 reports the cluster-robust asymptotic t-statistics and the corresponding p-values for the null hypothesis that the first-stage residuals have no explanatory power in the second-stage probit model. The test results indicate that the null hypothesis of exogeneity of LARGEPP cannot be rejected at meaningful levels of significance (p-values range from 0.380 to 0.877). The findings with regard to the endogeneity of the variable PATENTS are very similar to those obtained here for LARGEPP as shown in Appendix F. The validity of these tests naturally hinges on the assumption that the instruments for the potentially endogenous variable are themselves exogenous.

70
Table 6. Testing for endogeneity of LARGEPP.
Dependent variable in the probit model: PATAPP
Test 1 Test 2 Test 3
Explanatory variables in the probit model
Potentially endogenous variable LARGEPP LARGEPP LARGEPP
Exogenous variables SIGNIF SIGNIF SIGNIF
NOVFIRM NOVFIRM NOVFIRM
NOVMARK NOVMARK NOVMARK
SCIENCE SCIENCE SCIENCE
COMPLEX COMPLEX COMPLEX
CUMULTECH CUMULTECH CUMULTECH
PRICOMP PRICOMP PRICOMP
PUBFUND PUBFUND PUBFUND
CUSTCOLLAB CUSTCOLLAB CUSTCOLLAB
SUBCONCOLLAB SUBCONCOLLAB SUBCONCOLLAB
RINSTCOLLAB RINSTCOLLAB RINSTCOLLAB
COMPCOLLAB COMPCOLLAB COMPCOLLAB
STARTUP STARTUP STARTUP
R&DINT
Firm size dummies (3)
Technology class dummies (9) Technology class dummies (9) Technology class dummies (9)
Time period dummies (10) Time period dummies (10) Time period dummies (10)
Instruments excluded from the probit model
Firm size dummies (3) R&DINT R&DINT
Firm size dummies (3)
Test of exogeneity of LARGEPP
H0: Coef of the OLS residual zero in the
probit model
Robust asymptotic t-statistic 0.88 0.15 0.88
p-value 0.380 0.877 0.380
The null hypothesis of homoscedasticity of the error term is tested here against a more general alternative, which allows for heteroscedasticity modeled in the spirit of Harvey (1976), as discussed in Subsection 4.2.4. Table 7 presents the results for such a test with regard to the probit models of Table 5. The cluster-robust Wald tests of the null hypothesis that all the coefficients of the variables in the variance function are zero do not provide significant evidence against the null (p-values range from 0.4422 to 0.8741). Hence the hypothesis of homoscedasticity cannot be rejected in the light of this evidence.

71
Table 7. Testing for heteroscedasticity.
Specification under H0 Pooled Probit 3 Pooled Probit 4
Variables in the variance function (vector z)
R&DINT R&DINT
STARTUP STARTUP
LARGEPP LARGEPP
Firm size dummies (3) Firm size dummies (3)
Technology class dummies (9) Technology class dummies (9)
Time period dummies (10) Time period dummies (10)
Robust Wald test for heteroscedasticity
H0: All coefs in the variance function zero
!2 (df) 25.36 (25) 17.21 (25)
p-value 0.4422 0.8741
4.3.3 Comparison of results with alternative models
As discussed in Subsection 4.2.2, the unobserved effects model for the propensity to patent can also be estimated using the random effects formulation, given that certain additional assumptions hold (see Subsection 4.2.2). However, the Sfinno data does not lend itself very well to random effects estimation since the data is extremely unbalanced and the majority of clusters only includes one observation and thus contains no information about the intracluster correlation. Hence the random effects probit is estimated solely for comparison purposes and for testing for the presence of unobserved firm effects.
Table 8 presents the results from the estimation of a pooled probit model and a corresponding random effects model. The explanatory variable specification in the estimated models is a restricted version of Pooled Probit 4 of Table 5. The variables for public funding and for collaboration with partners other than universities and research institutes are excluded as they fail to be statistically significant (both individually and jointly) in Pooled Probit 4. The restricted model is also preferred to both Pooled Probit 3 and 4 on the basis of Akaike and Bayesian information criteria. Moreover, a comparison of Pooled Probit 4 with the restricted model, labeled Pooled Probit 5 in Table 8, shows that the exclusion of these variables has very little impact on the estimation results with regard to the other variables. The findings emerging from the estimation of the random effects model are very similar to those obtained from the pooled models. As expected on the basis of the mathematical relationship between the population-
72
averaged parameters, which can be estimated from the pooled model, and the true parameters, which can be estimated from the random effects model, the population-averaged parameters are generally lower in absolute value terms (cf. Section 4.2). However, once the average partial effects (APEs) – which, in theory, are equivalent to the partial effects estimated from the pooled model – are used for the comparison, the results appear very similar. More or less the only meaningful difference is that the random effects model assigns a lower impact for SIGNIF and a higher impact for RINSTCOLLAB in affecting the propensity to patent. This is not very surprising, however, since both of these variables are expected to capture the effect of the size of the innovation on the propensity to patent and are thus probably somewhat collinear. Appendix G shows that once RINSTCOLLAB is excluded from the random effects model the estimated effect of the other variables designed to proxy the size of the innovation increases.
The primary reason for estimating the random effects model is that it allows for a formal test of the presence of unobserved firm effects, as discussed in Subsection 4.2.2. The results presented in Table 8 provide significant evidence against the null hypothesis of no unobserved effects. For instance, the likelihood ratio (LR) test of the null hypothesis that the relative importance of the unobserved effect, r, is zero yields significant evidence against the null (p-value is 0.000). This evidence of the presence of the unobserved effects highlights the importance of computing cluster-robust standard errors as well as cluster-robust test statistics in the pooled estimations.

73
Table 8. Estimation results for Pooled Probit 5 and Random Effects Probit.
Dependent variable: PATAPP
Independent variables Robust Partial Partial
Coef. Std. Err. effect Coef. Std. Err. effect APE
Innovation and market characteristics
SIGNIF 0.5619* 0.3030 0.2101** 0.4991 0.3327 0.1851 0.1513
NOVFIRM 0.4472*** 0.1264 0.1769*** 0.5708*** 0.1464 0.2242*** 0.1794***
NOVMARK 0.8330*** 0.1124 0.3211*** 1.0256*** 0.1603 0.3904*** 0.3160***
SCIENCE 0.2494* 0.1482 0.0980* 0.2807 0.1964 0.1087 0.0875
COMPLEX -0.6429** 0.2556 -0.2458*** -0.8477** 0.3738 -0.3176*** -0.2585**
CUMULTECH 0.5418** 0.2259 0.2036** 0.6426** 0.3112 0.2317** 0.1912**
PRICOMP -0.2548* 0.1313 -0.1013* -0.3469** 0.1513 -0.1375** -0.1097**
RINSTCOLLAB 0.3456*** 0.1297 0.1366*** 0.5157*** 0.1455 0.2010*** 0.1613***
Firm size classes
(ref. EMP1)
EMP2 -0.0462 0.1574 -0.0184 -0.1226 0.1978 -0.0488 -0.0389
EMP3 -0.2421 0.1790 -0.0962 -0.3232 0.2129 -0.1283 -0.1023
EMP4 -0.2598 0.2255 -0.1032 -0.3760 0.2518 -0.1489 -0.1188
Other firm characteristics
R&DINT -0.0286 0.3098 -0.0114 -0.0480 0.3805 -0.0190 -0.0152
STARTUP 0.3049** 0.1436 0.1203** 0.3046* 0.1595 0.1192* 0.0955*
LARGEPP 0.6251* 0.3503 0.2328** 0.7220** 0.3342 0.2580** 0.2136**
Technology classes
Time periods (10 dummies)
Constant -1.1294*** 0.3622 -1.3429*** 0.4477
!c - 0.7608*** 0.1457" - 0.3666*** 0.0889
LR test for unobserved effects (df) p-value
H0: "=0 23.29 (01) 0.000
Wald tests for joint hypotheses #2 (df) p-value #
2 (df) p-value
H0: All coefs zero (exc. constant) 198.83 (33) 0.0000 110.97 (33) 0.0000
H0: All firm size class coefs zero 2.57 (3) 0.4623 3.27 (3) 0.3515
H0: All tech. class coefs zero 48.88 (9) 0.0000 63.23 (9) 0.0000
H0: All time period coefs zero 20.26 (10) 0.0269 14.65 (10) 0.1454
Number of observations 791 791
Log likelihood - -377.99857
Log pseudolikelihood -
Percent correctly predicted
for observations with PATAPP=1 84.58 86.12
for observations with PATAPP=0 67.36 66.17
for all observations 77.24 77.62
See Appendix B for the estimates See Appendix B for the estimates
See Appendix B for the estimates See Appendix B for the estimates
Pooled Probit 5 Random Effects Probit
!
# 2
Significance level notation: *** 1%, ** 5%, * 10%.
The partial effects and APEs are estimated at a point where firm size, technology class, and time period dummies are all zero and other variables are assigned their mean values. For comparison purposes, Appendix C presents the partial effects evaluated at the means of all the variables as well as the means of the partial effects computed over the observations. The partial effects and APEs are computed as partial derivatives for continuous variables and as discrete changes in the propensity to patent for binary variables. The significance level notation for the partial effects and APEs is based on standard errors computed using the delta method.
The expression for the propensity to patent took the form of a probit model as the random components of utility (e0 and e1) were assumed to be normally distributed. If, instead, e0 and e1 were assumed to be independent type 1 extreme value distributed, the logit model would have arisen instead of the probit model (see, e.g., Cameron and Trivedi 2005:476–478). However, in empirical investigations such as the present study the choice between the probit and logit formulations usually has very little impact on the findings (e.g., Cameron and

74
Trivedi 2005:471–473; Wooldridge 2002:479). The results from the pooled logit model presented in Table 9 appear very similar to those from the corresponding probit model (cf. Pooled Probit 5 in Table 8). Moreover, Table 9 presents the estimation results for a pooled linear probability model (LPM) estimated using ordinary least squares (OLS). Even though the linear probability model produces smaller estimates of the partial effects than the probit and logit models25, the qualitative findings remain robust under the LPM.
25 Note that in the context of the probit and logit models the magnitude of the partial effects depends on the point at which they are estimated, while for the LMP they are simply equal to the coefficients.

75
Table 9. Estimation results for Pooled Logit and Pooled LPM.
Significance level notation: *** 1%, ** 5%, * 10%.
The partial effects are estimated at a point where firm size, technology class, and time period dummies are all zero and other variables are assigned their mean values. For comparison purposes, Appendix C presents the partial effects evaluated at the means of all the variables as well as the means of the partial effects computed over the observations. The partial effects are computed as partial derivatives for continuous variables and as discrete changes in the propensity to patent for binary variables. The significance level notation for the partial effects is based on standard errors computed using the delta method.
Dependent variable: PATAPP
Independent variables Robust Partial Robust
Coef. Std. Err. effect Coef. Std. Err.
Innovation and market characteristics
SIGNIF 1.0942* 0.6055 0.2428** 0.1595** 0.0702
NOVFIRM 0.7520*** 0.2208 0.1856*** 0.1276*** 0.0378
NOVMARK 1.4322*** 0.1983 0.3415*** 0.2631*** 0.0353
SCIENCE 0.4229 0.2631 0.1031* 0.0653 0.0409
COMPLEX -1.1060** 0.4344 -0.2613*** -0.1859** 0.0870
CUMULTECH 0.9368** 0.3951 0.2134** 0.1471*** 0.0552
PRICOMP -0.4506** 0.2242 -0.1121** -0.0846** 0.0396
RINSTCOLLAB 0.5905*** 0.2268 0.1454*** 0.0974** 0.0382
Firm size classes
(ref. EMP1)
EMP2 -0.0680 0.2707 -0.0169 -0.0159 0.0463
EMP3 -0.3959 0.3097 -0.0986 -0.0688 0.0526
EMP4 -0.4628 0.4007 -0.1150 -0.0885 0.0695
Other firm characteristics
R&DINT -0.0243 0.5348 -0.0060 -0.0218 0.0862
STARTUP 0.4894* 0.2568 0.1203* 0.0770* 0.0432
LARGEPP 1.0716 0.6919 0.2413* 0.1819* 0.0996
Technology classes (9 dummies)
Time periods (10 dummies)
Constant -1.8965*** 0.6150 0.1903* 0.1104
Robust Wald tests for joint hypotheses !2 (df) p-value F (df1,df2) p-value
H0: All coefs zero (exc. constant) 162.65 (33) 0.0000 17.82 (33,554) 0.0000
H0: All firm size class coefs zero 2.46 (3) 0.4827 0.89 (3,554) 0.4465
H0: All tech. class coefs zero 41.49 (9) 0.0000 9.31 (9,554) 0.0000
H0: All time period coefs zero 20.53 (10) 0.0246 1.95 (10,554) 0.0368
Number of observations 791
Log pseudolikelihood -388.3252
R2
McFadden's pseudo R2 0.280
Efron's pseudo R2 0.348
McKelvey and Zavoina's pseudo R2 0.462
Percent correctly predicted
for observations with PATAPP=1 84.36
for observations with PATAPP=0 67.66
for all observations 77.24
Pooled Logit Pooled LPM (OLS)
65.88
791
-
0.324
-
77.75
See Appendix B for the estimates
See Appendix B for the estimates
See Appendix B for the estimates
See Appendix B for the estimates
-
-
86.56

76
5. Conclusion
Thus far most of the empirical investigations into the propensity to patent have been confined to the use of industry and firm-level data, and the failure to control for innovation-level factors has made the interpretation of the results somewhat problematic. The observed variations in the propensity to patent across industries and firms might reflect differences in the characteristics of innovations developed in these industries and firms rather than some inherent differences in the propensity to patent. Moreover, the absence of innovation-level variables has rendered innovation-related hypotheses emerging from the theoretical literature untestable in the industry and firm-level studies. This study seeks to shed new light on the propensity to patent at the innovation level, while also contributing to the long tradition of research on the relationship between firm size and the propensity to patent. By taking the analysis to the innovation level, this study also brings the empirics closer to the theoretical work on the propensity to patent.
The present study set out to cast new light on the question of how the propensity to patent an innovation is affected by the characteristics of the innovation, the market, and the innovating firm. For empirical purposes, the propensity to patent was defined as the fraction of innovations for which at least one patent application is filed, while an innovation was defined as an invention that has been commercialized on the market by a business firm or an equivalent. The innovation-level model for the propensity to patent was derived in the spirit of random utility models. The emerging probit model was estimated on a sample of 791 Finnish innovations using a quasi-maximum likelihood estimator called the partial maximum likelihood estimator, which allows for within-firm correlation in the data.
The data sample of 791 Finnish innovations used in this study was drawn from the Sfinno database compiled at VTT Innovation Studies (formerly VTT Group for Technology Studies). In an effort to compile the Sfinno database, a systematic review of 18 carefully selected trade and technical journals from the period 1985–1998 has been complemented with a review of annual reports of large firms from the same period as well as with expert opinion-based identification of innovations. Since the Sfinno approach heavily relies on public

77
sources in the identification of innovations, it is clearly more conducive to studying product than process innovations. Hence innovations only developed for the firm’s internal use are not included in the Sfinno database. The inclusion of an innovation in the database has required that the innovation is a technologically new or significantly enhanced product compared to the firm’s previous products. Despite the important limitation to collecting innovation-level data that standard statistical sampling is not possible since the underlying population of innovations is unknown, the Sfinno database has been argued to be relatively representative of significant Finnish product innovations. Hence, even though the estimation results cannot be directly generalized to the population of innovations, the application of the Sfinno data to test hypotheses on the determinants of the propensity to patent emerging from the literature can clearly contribute to our understanding of factors affecting the propensity to patent.
The empirical investigation of the propensity to patent at the innovation level produced a number of important findings. To begin with, it is already of considerable interest as such that patent protection was sought for less than 60 percent of the 791 relatively significant product innovations contained in the data sample. Patenting is clearly not a self-evident outcome of an innovation process that results in the commercialization of an innovation. Moreover, the results from the econometric analysis indicate that various characteristics of the innovation, the market, and the innovating firm have a significant effect on the propensity to patent. First, the estimation results suggest that larger – that is, more novel and significant – innovations are patented more frequently than smaller ones. Second, technologically very complex innovations appear to be patented less often than others, while the fragmentation of intellectual property rights to cumulatively developing technology seems to entail high propensities to patent. Third, the results indicate that the propensity to patent varies across technology classes and declines with product market competition. The evidence on the effect of competition on the propensity to patent needs to be taken with a grain of salt, however, since intense price competition in the product market might indirectly affect the propensity to patent by affecting the size of the innovations rather than by having a direct impact on the propensity to patent. Fourth, collaboration with scientific institutions appears to have a positive impact on the propensity to patent, while the estimations fail to produce evidence that public R&D support or collaboration with other types of partners would affect the propensity to patent. The collaboration with scientific

78
institutions can also be expected to have an indirect impact on the propensity to patent as it is probably associated with the technological novelty of the innovation. Finally, there appears to be a U-shaped relationship between firm size and the propensity to patent, which, to a relatively large extent, can be attributed to economies of scale in the patenting activity as well as to the relatively important role of patenting in start-up ventures.
The results from the empirical investigation can be interpreted as being in accordance with the survey evidence of the positive relationship between firm size and the propensity to patent since the firm-level surveys have generally ignored the small start-up ventures. The estimation results suggest that among the relatively large firms the propensity to patent increases with firm size as firm size is positively correlated with the scale of patenting. While being ignored in the firm-level studies, small start-ups are well represented in the Sfinno sample and the estimation results provide significant evidence of relatively high propensities to patent in start-up ventures. Moreover, the finding of significant variation in the propensity to patent across technology classes is well in line with the previous research. On the other hand, certain factors – such as R&D intensity – that have appeared to have an impact on the propensity to patent in the firm-level studies fail to have a statistically significant effect when the innovation-level factors are controlled for. This might be indicative of such variables having only an indirect effect on the propensity to patent since they may well be associated with the size of the innovations rather than affecting the propensity to patent directly. While this study seeks to capture different dimensions of the size of innovations with some success using a number of qualitative variables, development of more accurate measures of the size of innovations should make it easier to disentangle the direct effects on the propensity to patent from the indirect effects that influence patenting through the size of the innovations.
The results outlined above should be of obvious interest to those who depend on patent data in drawing conclusions about innovation and technological change. The finding that larger product innovations are patented more frequently than smaller ones should be comforting news from the perspective of using patents as an economic indicator of innovation since it implies that large innovations enter the patent indicator at a relatively high probability. However, the study also points to the weaknesses of patent data by demonstrating that the propensity to patent varies significantly across firms and technologies. For instance, the

79
evidence in favor of the hypotheses on the presence of economies of scale in the patenting activity and on the relatively high propensities to patent in start-up ventures suggests that patents are a rather problematic measure of innovations in the context of testing the Schumpeterian hypotheses.
Moreover, the size-related hypotheses suggest that small start-up ventures are more dependent on patent protection than larger firms while experiencing a disadvantage in obtaining and enforcing patents. This should have important implications for the optimal design of the patent system since it is highly probable that not all valuable ideas originate in the large corporations and thus also small entities need to be provided with sufficient incentives for developing their ideas into innovations. Harnessing the innovative capacity of small firms is clearly an important challenge for any economy.
Because in reality an innovation can be protected by a number of patents, a single patent can cover numerous innovations, and not all patents relate to innovations, a complete investigation of the extent to which patents are representative of different innovations is beyond the scope of this study. Furthermore, the nature of the data used in this study does not allow for consideration of process innovations only developed for the firms’ internal use. Clearly, further research is needed to paint a clear picture of the relationship between innovations and patents and to answer the question of the extent to which patents are representative of the wider universe of innovations. All in all, the study provides a rather encouraging perspective of the potential of innovation-level investigations in contributing to our understanding of the features and patterns of technological activities. This study is just a small step in trying to shed light on the complex relationship between patents and innovations that has been remained extremely elusive thus far. Nevertheless, the results indicate that this line of research can prove a very valuable complement to different industry and firm-level investigations.
80
References
Abernathy, W.J. and Clark, K.B. (1985): Innovation: Mapping the Winds of Creative Destruction, Research Policy, 14, 3–22.
Abramovitz, M. (1956): Resource and Output Trends in the United States since 1870, American Economic Review (Papers and Proceedings), 46, 5–23.
Acs, Z.J. and Audretsch, D.B. (1989): Patents as a Measure of Innovative Activity, Kyklos, 42, 171–180.
Acs, Z.J. and Audretsch, D.B. (1990): Innovation and Small Firms, MIT Press, Cambridge, MA.
Acs, Z.J. and Audretsch, D.B. (1993): Analysing Innovation Output Indicators: The US Experience, in Kleinknecht, A. and Bain, D. (Eds.): New Concepts in Innovation Output Measurement, Macmillan Press, Houndmills.
Anton, J.J. and Yao, D.A. (2004): Little Patents and Big Secrets: Managing Intellectual Property, RAND Journal of Economics, 35, 1–22.
Archibugi, D. and Pianta, M. (1996): Measuring Technological Change through Patents and Innovation Surveys, Technovation, 16, 451–468.
Arora, A., Ceccagnoli, M. and Cohen, W.M. (2003): R&D and the Patent Premium, NBER Working Paper No. 9431.
Arora, A., Fosfuri, A. and Gambardella, A. (2001): Markets for Technology, MIT Press, Cambridge, MA.
Arrow, K. (1962): Economic Welfare and the Allocation of Resources for Invention, in Nelson, R. (Ed.): The Rate and Direction of Inventive Activity: Economic and Social Factors, Princeton University Press, Princeton.
Arundel, A. (2001): The Relative Effectiveness of Patents and Secrecy for Appropriation, Research Policy, 30, 611–624.

81
Arundel, A. and Kabla, I. (1998): What Percentage of Innovations Are Patented? Empirical Estimates for European Firms, Research Policy, 27, 127–141.
Arundel, A., Van de Paal, G. and Soete, L. (1995): Innovation Strategies of Europe’s Largest Industrial Firms: Results of the PACE Survey for Information Sources, Public Research, Protection of Innovation and Government Programmes, EIMS Publication N° 23.
Barros, H.M. (2004): Are Patents Important? Evidence from the UK CIS 3, A Paper Presented at the DRUID Summer Conference 2004 on Industrial Dynamics, Innovation and Development, Elsinore, Denmark, June 14–16, 2004.
Barzel, Y. (1968): Optimal Timing of Innovations, Review of Economics and Statistics, 50, 348–355.
Basberg, B.L. (1987): Patents and the Measurement of Technological Change: A Survey of the Literature, Research Policy, 16, 131–141.
Bernstein, J.I. and Nadiri, M.I. (1988): Interindustry R&D Spillovers, Rates of Return, and Production in High-Tech Industries, American Economic Review (Papers and Proceedings), 78, 429–434.
Bernstein, J.I. and Nadiri, M.I. (1989): Research and Development and Intra-industry Spillovers: An Empirical Application of Dynamic Duality, Review of Economic Studies, 56, 249–267.
Blind, K., Edler, J., Frietsch, R. and Schmoch, U. (2006): Motives to Patent: Empirical Evidence from Germany, Research Policy, 35, 655–672.
Bound, J., Cummins, C., Griliches, Z., Hall, B.H. and Jaffe, A. (1984): Who Does R&D and Who Patents? in Griliches, Z. (Ed.): R&D, Patents, and Productivity, University of Chicago Press, Chicago, IL.
Brouwer, E. and Kleinknecht, A. (1999): Innovative Output and a Firm’s Propensity to Patent. An Exploration of CIS Micro Data, Research Policy, 28, 615–624.

82
Butler, J.S. and Moffitt, R. (1982): A Computationally Efficient Quadrature Procedure for the One-Factor Multinomial Probit Model, Econometrica, 50, 761–764.
Cameron, A.C. and Trivedi, P.K. (2005): Microeconometrics: Methods and Applications, Cambridge University Press, Cambridge.
Chang, H.F. (1995): Patent Scope, Antitrust Policy, and Cumulative Innovation, RAND Journal of Economics, 26, 34–57.
Choi, J.P. (1990): Market Structure, Incentive to Patent and the Pace of Innovation, Economics Letters, 34, 277–283.
Cincera, M. (1997): Patents, R&D, and Technological Spillovers at the Firm Level: Some Evidence from Econometric Count Models for Panel Data, Journal of Applied Econometrics, 12, 265–280.
Cogan, D.J. (1993): The Irish Experience with Literature-based Innovation Output Indicators, in Kleinknecht, A. and Bain, D. (Eds.): New Concepts in Innovation Output Measurement, Macmillan Press, Houndmills.
Cohen, W.M. (1995): Empirical Studies of Innovative Activity, in Stoneman, P. (Ed.): Handbook of the Economics of Innovation and Technological Change, Blackwell Publishers, Oxford.
Cohen, W., Goto, A., Nagata, A., Nelson, R.R. and Walsh, J.P. (2002): R&D Spillovers, Patents and the Incentives to Innovate in Japan and the United States, Research Policy, 31, 1349–1367.
Cohen, W.M. and Klepper, S. (1996): A Reprise of Size and R&D, Economic Journal, 106, 925–951.
Cohen, W.M. and Levin, R.C. (1989): Empirical Studies of Innovation and Market Structure, in Schmalensee, R. and Willig, R.D. (Eds.): Handbook of Industrial Organization, Volume II, Elsevier Science Publishers, Amsterdam.

83
Cohen, W.M., Nelson, R.R. and Walsh, J.P. (2000): Protecting their Intellectual Assets: Appropriability Conditions and Why U.S. Manufacturing Firms Patent (or Not), NBER Working Paper No. 7552.
Comanor, W.S. and Scherer, F.M. (1969): Patent Statistics as a Measure of Technical Change, Journal of Political Economy, 77, 392–398.
Combe, E. and Pfister, E. (1999): The Effectiveness of Intellectual Property Rights: New Evidence from French Survey Data, CESSEFI-TEAM, mimeo.
Combe, E. and Pfister, E. (2000): Patents Against Imitators: An Empirical Investigation on French Data, Paris I – Economie Mathematique et Applications Papers, No. 2000.01.
Coombs, R., Narandren, P. and Richards, A. (1996): A Literature-based Innovation Output Indicator, Research Policy, 25, 403–413.
Crépon, B. and Duguet, E. (1997a): Estimating the Innovation Function from Patent Numbers: GMM on Count Panel Data, Journal of Applied Econometrics, 12, 243–263.
Crépon, B. and Duguet, E. (1997b): Research and Development, Competition and Innovation: Pseudo-Maximum Likelihood and Simulated Maximum Likelihood Methods Applied to Count Data Models with Heterogeneity, Journal of Econometrics, 79, 355–378.
Dasgupta, P. and Stiglitz, J. (1980a): Uncertainty, Industrial Structure, and the Speed of R&D, Bell Journal of Economics, 11, 1–28.
Dasgupta, P. and Stiglitz, J. (1980b): Industrial Structure and the Nature of Innovative Activity, Economic Journal, 90, 266–293.
De Melto, D.P., McMullen, K.E. and Wills, R.M. (1980): Preliminary Report: Innovation and Technological Change in Five Canadian Industries, Economic Council of Canada, Discussion Paper No. 176.

84
Denicolò, V. (1996): Patent Races and Optimal Patent Breadth and Length, Journal of Industrial Economics, 44, 249–265.
Denicolò, V. (1999): The Optimal Life of a Patent when the Timing of Innovation is Stochastic, International Journal of Industrial Organization, 17, 827–846.
Denicolò, V. (2000): Two-Stage Patent Races and Patent Policy, RAND Journal of Economics, 31, 488–501.
Denicolò, V. and Franzoni, L.A. (2003): The Contract Theory of Patents, International Review of Law and Economics, 23, 365–380.
Denicolò, V. and Franzoni, L.A. (2004): Patents, Secrets, and the First-Inventor Defense, Journal of Economics & Management Strategy, 13, 517–538.
Denicolò, V. and Zanchettin, P. (2002): How Should forward Patent Protection Be Provided? International Journal of Industrial Organization, 20, 801–827.
Duguet, E. and Kabla, I. (1998): Appropriation Strategy and the Motivations to use the Patent System: An Econometric Analysis at the Firm Level in French Manufacturing, Annales D’Économie et de Statistique, 49/50, 289–327.
Fisher, R.A. (1922): On the Mathematical Foundations of Theoretical Statistics, Philosophical Transactions of the Royal Society of London, A, 222, 309–368.
Fisher, R.A. (1925): Theory of Statistical Estimation, Proceedings of the Cambridge Philosophical Society, 22, 700–725.
Fleissner, P., Hofkirchner, W. and Pohl, M. (1993): The Austrian Experience with Literature-based Innovation Output Indicators, in Kleinknecht, A. and Bain, D. (Eds.): New Concepts in Innovation Output Measurement, Macmillan Press, Houndmills.
Freeman, C. and Perez, C. (1988): Structural Crises of Adjustment: Business Cycles and Investment Behaviour, in Dosi, G., Freeman, C., Nelson, R., Silverberg, G. and Soete, L. (Eds.): Technical Change and Economic Theory, Pinter Publishers, London.

85
Fudenberg, D., Gilbert, R., Stiglitz, J. and Tirole, J. (1983): Preemption, Leapfrogging and Competition in Patent Races, European Economic Review, 22, 3–31.
Gallini, N.T. (1992): Patent Policy and Costly Imitation, RAND Journal of Economics, 23, 52–63.
Gallini, N.T. (2002): The Economics of Patents: Lessons from Recent U.S. Patent Reform, Journal of Economic Perspectives, 16, 131–154.
Gallini, N. and Scotchmer, S. (2001): Intellectual Property: When is it the Best Incentive System? in Jaffe, A., Lerner, J. and Stern, S. (Eds.): Innovation Policy and the Economy, Volume 2, MIT Press, Cambridge, MA.
Gilbert, R. and Shapiro, C. (1990): Optimal Patent Length and Breadth, RAND Journal of Economics, 21, 106–112.
Green, J.R. and Scotchmer, S. (1995): On the Division of Profit in Sequential Innovation, RAND Journal of Economics, 26, 20–33.
Greene, W.H. (2003): Econometric Analysis (5th Ed.), Prentice Hall, Upper Saddle River, NJ.
Griliches, Z. (1990): Patent Statistics as Economic Indicators: A Survey, Journal of Economic Literature, 28, 1661–1707.
Griliches, Z. (1992): The Search for R&D Spillovers, Scandinavian Journal of Economics, 94, Supplement, 29–47.
Griliches, Z. (1995): R&D and Productivity: Econometric Results and Measurement Issues, in Stoneman, P. (Ed.): Handbook of the Economics of Innovation and Technological Change, Blackwell Publishers, Oxford.
Griliches, Z. (1998): R&D and Productivity: The Econometric Evidence, University of Chicago Press, Chicago, IL.
86
Hall, B.H. (1996): The Private and Social Returns to Research and Development, in Smith, B.L.R. and Barfield, C.E. (Eds.): Technology, R&D, and the Economy, Brookings Institution Press, Washington, DC.
Hall, B.H. (2005): Exploring the Patent Explosion, Journal of Technology Transfer, 30, 35–48.
Hall, B.H., Griliches, Z. and Hausman, J. (1986): Patents and R and D: Is There a Lag? International Economic Review, 27, 265–283.
Hall, B.H., Jaffe, A.B. and Trajtenberg, M. (2001): The NBER Patent Citations Data File: Lessons, Insights and Methodological Tools, NBER Working Paper No. 8498.
Hall, B.H. and Ziedonis, R.H. (2001): The Patent Paradox Revisited: An Empirical Study of Patenting in the U.S. Semiconductor Industry, 1979–1995, RAND Journal of Economics, 32, 101–128.
Harabi, N. (1995): Appropriability of Technical Innovations: An Empirical Analysis, Research Policy, 24, 981–992.
Harter, J.F.R. (1994): The Propensity to Patent with Differentiated Products, Southern Economic Journal, 61, 195–201.
Harvey, A.C. (1976): Estimating Regression Models with Multiplicative Heteroscedasticity, Econometrica, 44, 461–465.
Hausman, J., Hall, B.H. and Griliches, Z. (1984): Econometric Models for Count Data with and Application to the Patents-R&D Relationship, Econometrica, 52, 909–938.
Henderson, R. (1993): Underinvestment and Incompetence as Responses to Radical Innovation: Evidence from the Photolithographic Alignment Equipment Industry, RAND Journal of Economics, 24, 248–270.
Holmström, B. (1989): Agency Costs and Innovation, Journal of Economic Behavior & Organization, 12, 305–327.

87
Hortsmann, I., MacDonald, G.M. and Slivinski, A. (1985): Patents as Information Transfer Mechanisms: To Patent or (Maybe) Not to Patent, Journal of Political Economy, 93, 837–858.
Huber, P.J. (1967): The Behavior of Maximum Likelihood Estimates under Nonstandard Conditions, in Neyman, J. (Ed.): Proceedings of the Fifth Berkeley Symposium on Mathematical Statistics and Probability, 1, 221–233, University of California Press, Berkeley, CA.
Hyvönen, J. (2001): Significant Innovations in Finland, A Paper Prepared for the ETIC Session, Strasbourg, France, October 8–18, 2001.
Jaffe, A.B. and Trajtenberg, M. (2002): Patents, Citations, and Innovations, MIT Press, Cambridge, MA.
Jones, C.I. and Williams, J.C. (1998): Measuring the Social Return to R&D, Quarterly Journal of Economics, 113, 1119–1135.
Jones, C.I. and Williams, J.C. (2000): Too Much of a Good Thing? The Economics of Investment in R&D, Journal of Economic Growth, 5, 65–85.
Kamien, M.I. and Schwartz, N.L. (1972): Timing of Innovations Under Rivalry, Econometrica, 40, 43–60.
Kamien, M.I. and Schwartz, N.L. (1974): Patent Life and R and D Rivalry, American Economic Review, 64, 183–187.
Kamien, M.I. and Schwartz, N.L. (1982): Market Structure and Innovation, Cambridge University Press, Cambridge.
Kitch, E.W. (1977): The Nature and Function of the Patent System, Journal of Law and Economics, 20, 265–290.
Kitching, J. and Blackburn, R. (1999): Intellectual Property Management in the Small and Medium Enterprise (SME), Journal of Small Business and Enterprise Development, 5, 327–335.

88
Kleinknecht, A., Reijnen, J.O.N. and Smits, W. (1993): Collecting Literature-based Innovation Output Indicators: The Experience in the Netherlands, in Kleinknecht, A. and Bain, D. (Eds.): New Concepts in Innovation Output Measurement, Macmillan Press, Houndmills.
Kleinknecht, A., Van Montfort, K. and Brouwer, E. (2002): The Non-trivial Choice between Innovation Indicators, Economics of Innovation and New Technology, 11, 109–121.
Klemperer, P. (1990): How Broad Should the Scope of Patent Protection Be? RAND Journal of Economics, 21, 113–130.
Kline, S.J. and Rosenberg, N. (1986): An Overview of Innovation, in Landau, R. and Rosenberg, N. (Eds.): The Positive Sum Strategy: Harnessing Technology for Economic Growth, National Academic Press, Washington, DC.
Kortum, S. and Lerner, J. (1999): What Is Behind the Recent Surge in Patenting? Research Policy, 28, 1–22.
Kortum, S. and Lerner, J. (2000): Assessing the Contribution of Venture Capital to Innovation, RAND Journal of Economics, 31, 674–692.
Kultti, K., Takalo, T. and Toikka, J. (2007): Secrecy vs. Patenting, forthcoming in RAND Journal of Economics.
König, H. and Licht, G. (1995): Patents, R&D and Innovation: Evidence from the Mannheim Innovation Panel, Ifo-Studien, 33, 521–543.
Landes, D.S. (1969): The Unbound Prometheus, Cambridge University Press, Cambridge.
Langinier, C. (2005): Using Patents to Mislead Rivals, Canadian Journal of Economics, 38, 520–545.
Langinier, C. and Moschini, G. (2002): The Economics of Patents, in Rothschild, M. and Newman, S. (Eds.): Intellectual Property Rights in Animal Breeding and Genetics, CAPI Publishing, Wallingford.

89
Lanjouw, J.O. and Schankerman, M. (2004): Protecting Intellectual Property Rights: Are Small Firms Handicapped? Journal of Law and Economics, 47, 45–74.
Lee, T. and Wilde, L.L. (1980): Market Structure and Innovation: A Reformulation, Quarterly Journal of Economics, 94, 429–436.
Leppälahti, A. (2000): Comparisons of Finnish Innovation Surveys, Statistics Finland, Science, Technology and Research 2000:1.
Lerner, J. (1995): Patenting in the Shadow of Competitors, Journal of Law and Economics, 38, 463–495.
Levin, R.C., Klevorick, A.K., Nelson, R.R., and Winter, S.G. (1987): Appropriating the Returns from Industrial R&D, Brookings Papers on Economic Activity, 3, 783–820.
Licht, G. and Zoz, K. (1998): Patents and R&D: An Econometric Investigation Using Applications for German, European and US Patents by German Companies, Annales D’Économie et de Statistique, 49/50, 329–360.
Long, C. (2002): Patent Signals, University of Chicago Law Review, 69, 625–679.
Loury, G.C. (1979): Market Structure and Innovation, Quarterly Journal of Economics, 93, 395–410.
Lucas, R.E. Jr. (1988): On the Mechanics of Economic Development, Journal of Monetary Economics, 22, 3–42.
Mansfield, E. (1986): Patents and Innovation: An Empirical Study, Management Science, 32, 173–181.
Mansfield, E., Rapoport, J., Romeo, A., Wagner, S., and Beardsley, G. (1977): Social and Private Rates of Return from Industrial Innovations, Quarterly Journal of Economics, 91, 221–240.
Mansfield, E., Schwartz, M. and Wagner, S. (1981): Imitation Costs and Patents, An Empirical Study, Economic Journal, 91, 907–918.

90
Marschak, J. (1960): Binary-Choice Constraints and Random Utility Indicators, in Arrow, K., Karlin, S. and Suppes, P. (Eds.): Mathematical Methods in the Social Sciences, 1959, Stanford University Press, Stanford, CA.
Matutes, C., Regibeau, P. and Rockett, K. (1996): Optimal Patent Design and the Diffusion of Innovations, RAND Journal of Economics, 27, 60–83.
Mazzoleni, R. and Nelson, R.R. (1998a): Economic Theories about the Benefits and Costs of Patents, Journal of Economic Issues, 32, 1031–1052.
Mazzoleni, R. and Nelson, R.R. (1998b): The Benefits and Costs of Strong Patent Protection: A Contribution to the Current Debate, Research Policy, 27, 273–284.
Mokyr, J. (1990): The Lever of Riches, Oxford University Press, New York.
Nelson, R. (1959): The Simple Economics of Basic Scientific Research, Journal of Political Economy, 67, 297–306.
Nelson, R. and Winter, S. (1982): An Evolutionary Theory of Economic Change, Belknap Press, Cambridge, MA.
Nordhaus, W. (1969): Invention, Growth and Welfare, MIT Press, Cambridge, MA.
Nordhaus, W. (1972): The Optimum Life of a Patent: Reply, American Economic Review, 62, 428–431.
O’Donoghue, T., Scotchmer, S. and Thisse, J.-F. (1998): Patent Breadth, Patent Life and the Pace of Technological Progress, Journal of Economics and Management Strategy, 7, 1–32.
OECD (1992): Oslo Manual, OECD/GD (92)26.
OECD (1997): Proposed Guidelines for Collecting and Interpreting Technological Innovation Data: The Oslo Manual, OECD and Eurostat, Paris.

91
OECD (2005): Oslo Manual: Guidelines for Collecting and Interpreting Innovation Data (3rd Ed.), OECD and Eurostat, Paris.
Ordover, J.A. (1991): A Patent System for Both Diffusion and Exclusion, Journal of Economic Perspectives, 5, 43–60.
Pakes, A. and Griliches, Z. (1984): Patents and R&D at the Firm Level: A First Look, in Griliches, Z. (Ed.): R&D, Patents and Productivity, University of Chicago Press, Chicago, IL.
Palmberg, C. (2001): Sectoral Patterns of Innovation and Competence Requirements: A Closer Look at Low-Tech Industries, Sitra Reports Series, No. 8.
Palmberg, C., Leppälahti, A., Lemola, T. and Toivanen, H. (1999): Towards a Better Understanding of Innovation and Industrial Renewal in Finland – a New Perspective, VTT Group for Technology Studies, Working Paper No. 41/99.
Palmberg, C., Niininen, P., Toivanen, H. and Wahlberg, T. (2000): Industrial Innovation in Finland: First Results of the Sfinno-project, VTT Group for Technology Studies, Working Paper No. 47/00.
Patel, P. and Pavitt, K. (1995): Patterns of Technological Activity: their Measurement and Interpretation, in Stoneman, P. (Ed.): Handbook of the Economics of Innovation and Technological Change, Blackwell Publishers, Oxford.
Pavitt, K. (1983): Characteristics of Innovative Activities in British Industry, OMEGA The International Journal of Management Science, 11, 113–130.
Pavitt, K. (1984): Sectoral Patterns of Technical Change: Towards a Taxonomy and a Theory, Research Policy, 13, 343–373.
Pavitt, K. (1985): Patent Statistics as Indicators of Innovative Activities: Possibilities and Problems, Scientometrics, 7, 77–99.
Peeters, C. and Van Pottelsberghe de la Potterie, B. (2006): Innovation Strategy and the Patenting Behavior of Firms, Journal of Evolutionary Economics, 16, 109–135.

92
Reinganum, J.F. (1983): Uncertain Innovation and the Persistence of Monopoly, American Economic Review, 73, 741–748.
Reinganum, J. (1989): The Timing of Innovation: Research, Development, and Diffusion, in Schmalensee, R. and Willig, R.D. (Eds.): Handbook of Industrial Organization, Volume I, Elsevier Science Publishers, New York.
Rivers, D. and Vuong, Q.H. (1988): Limited Information Estimators and Exogeneity Tests for Simultaneous Probit Models, Journal of Econometrics, 39, 347–366.
Romer, P.M. (1986): Increasing Returns and Long-Run Growth, Journal of Political Economy, 94, 1002–1037.
Rosenberg, N. (1982): Inside the Black Box: Technology and Economics, Cambridge University Press, Cambridge.
Saarenheimo, T. (1994): Studies on Market Structure and Innovation, Doctoral Dissertation, University of Helsinki, Bank of Finland Publications, Series B:49.
Saarinen, J. (2005): Innovations and Industrial Performance in Finland 1945–1998, Doctoral Dissertation, Lund University, Lund Studies in Economic History.
Santarelli, E. and Piergiovanni, R. (1996): Analyzing Literature-based Innovation Output Indicators: The Italian Experience, Research Policy, 25, 689–711.
Sattler, H. (2002): Appropriability of Product Innovations: An Empirical Analysis for Germany, Research Papers on Marketing and Retailing – University of Hamburg, No. 003.
Scherer, F.M. (1965): Firm Size, Market Structure, Opportunity, and the Output of Patented Inventions, American Economic Review, 55, 1097–1125.
Scherer, F.M. (1967): Research and Development Resource Allocation Under Rivalry, Quarterly Journal of Economics, 81, 359–394.
Scherer, F.M. (1972): Nordhaus’ Theory of Optimal Patent Life: A Geometric Reinterpretation, American Economic Review, 62, 422–427.

93
Scherer, F.M. (1983): The Propensity to Patent, International Journal of Industrial Organization, 1, 107–128.
Schmookler, J. (1966): Invention and Economic Growth, Harvard University Press, Cambridge, MA.
Schumpeter, J. (1912): Theorie der wirtschaftlichen Entwicklung, Duncker & Humboldt, Leipzig, English translation (1934): The Theory of Economic Development, Harvard University Press, Cambridge, MA.
Schumpeter, J. (1942): Capitalism, Socialism and Democracy, Harper and Brothers, New York, NY.
Scotchmer, S. (1996): Protecting Early Innovators: Should Second-Generation Products be Patentable? RAND Journal of Economics, 27, 322–331.
Scotchmer, S. (2004): Innovation and Incentives, MIT Press, Cambridge, MA.
Scotchmer, S. and Green, J. (1990): Novelty and Disclosure in Patent Law, RAND Journal of Economics, 21, 131–146.
Shapiro, C. (2000): Navigating the Patent Thicket: Cross Licenses, Patent Pools, and Standard-Setting, Competition Policy Center, University of California, Berkeley, Working Paper No. CPC00-11.
Smith, R.J. and Blundell, R.W. (1986): An Exogeneity Test for a Simultaneous Equation Tobit Model with an Application to Labor Supply, Econometrica, 54, 679–686.
Solow, R.M. (1956): A Contribution to the Theory of Economic Growth, Quarterly Journal of Economics, 70, 65–94.
Solow, R.M. (1957): Technical Change and the Aggregate Production Function, Review of Economics and Statistics, 39, 312–320.

94
Steward, F. (1993): Extracting Significant Innovations from Published Sources in Great Britain, in Kleinknecht, A. and Bain, D. (Eds.): New Concepts in Innovation Output Measurement, Macmillan Press, Houndmills.
Suzuki, J., Gemba, K., Tamada, S., Yasaki, Y. and Goto, A. (2006): Analysis of Propensity to Patent and Science-Dependence of Large Japanese Manufacturers of Electrical Machinery, Scientometrics, 68, 265–288.
Takalo, T. (1998): Innovation and Imitation under Imperfect Patent Protection, Journal of Economics, 67, 229–241.
Takalo, T. (1999): Essays on the Economics of Intellectual Property Protection, Doctoral Dissertation, University of Helsinki, Dissertationes Oeconimicae.
Takalo, T. (2001): On the Optimal Patent Policy, Finnish Economic Papers, 14, 33–40.
Tanayama, T. (2002): Empirical Analysis of Processes Underlying Various Technological Innovations, VTT Publications, No. 463.
Tandon, P. (1982): Optimal Patents with Compulsory Licensing, Journal of Political Economy, 90, 470–486.
Tandon, P. (1983): Rivalry and the Excessive Allocation of Resources to Research, Bell Journal of Economics, 14, 152–165.
Taylor, C.T. and Silberston, Z.A. (1973): The Economic Impact of the Patent System, Cambridge University Press, Cambridge.
Tirole, J. (1988): The Theory of Industrial Organization, MIT Press, Cambridge, MA.
Train, K.E. (2003): Discrete Choice Methods with Simulation, Cambridge University Press, Cambridge.
Tushman, M.L. and Anderson, P. (1986): Technological Discontinuities and Organizational Environments, Administrative Science Quarterly, 31, 439–465.

95
Van der Panne, G. and Kleinknecht, A. (2005): The Propensity to Patent an Innovation. An Empirical Investigation, A Paper Presented at the Fourth European Meeting on Applied Evolutionary Economics (EMAEE), Utrecht, The Netherlands, 19–21 May 2005.
Van Dijk, T. (1996): Patent Height and Competition in Product Improvements, Journal of Industrial Economics, 44, 151–167.
Venn, J. (1876): The Logic of Chance (2nd Ed.), Macmillan, London.
Waterson, M. (1990): The Economics of Product Patents, American Economic Review, 80, 860–869.
White, H. (1980): A Heteroskedasticity-Consistent Covariance Matrix Estimator and a Direct Test for Heteroskedasticity, Econometrica, 48, 817–830.
White, H. (1982): Maximum Likelihood Estimation of Misspecified Models, Econometrica, 50, 1–26.
Williams, R.L. (2000): A Note on Robust Variance Estimation for Cluster-Correlated Data, Biometrics, 56, 645–646.
WIPO (2004): WIPO Intellectual Property Handbook: Policy, Law and Use (2nd Ed.), WIPO Publication No. 489 (E), Geneva.
Wooldridge, J.M. (2002): Econometric Analysis of Cross Section and Panel Data, MIT Press, Cambridge, MA.
Wright, B.D. (1983): The Economics of Invention Incentives: Patents, Prizes, and Research Contracts, American Economic Review, 73, 691–707.
Wright, D.J. (1999): Optimal Patent Breadth and Length with Costly Imitation, International Journal of Industrial Organization, 17, 419–436.
Yatchew, A. and Griliches, Z. (1985): Specification Error in Probit Models, Review of Economics and Statistics, 67, 134–139.


A1
Appendix A: Technology classification
Table A1. Technology classification, VTT Innovation Studies.
Technology class IPC-class
10 Electrotechnology 11 Electrical machinery and
equipment, electric energy F21; G05F; H01B,C,F,G,H,J,K,M, R,T; H02; H05B,C,F,K
12 Audiovisual technology G09F,G; G11B; H03F,G,J; H04N-003,-005,-009,-013,015,-017,R,S
13 Telecommunications G08C; H01P,Q; H03B,C,D,H,K, L,M; H04B,H,J,K,L,M,N-001,-007,-011,Q
14 Information technology G06; G11C; G10L 15 Semiconductors H01L 20 Instruments 21 Optics G02; G03B,C,D,F,G,H; H01S 22 Analysis, measurement, and
control technology G01B,C,D,F,G,H,J,K,L,M,N,P,R,S,V,W; G04; G05B,D; G07; G08B,G; G09B,C,D; G12
23 Healthcare technology A61B,C,D,F,G,H,J,L,M,N 24 Nuclear technology G01T; G21; H05G,H 30 Chemistry, pharmaceutical
technology
31 Organic chemistry C07C,D,F,H,J,K 32 Macromolecule chemistry,
polymer chemistry C08B,F,G,H,K,L; C09D,J; C13L
33 Pharmaceutical technology, cosmetics
A61K
34 Biotechnology C07G; C12M,N,P,Q,R,S 35 Agrochemistry,
foodchemistry A01H; A21D; A23B,C,D,F,G,J, K,L; C12C,F,G,H,J; C13D,F,J,K
36 Petrochemistry, basic material chemistry
C09B,C,F,G,H,K; C10B,C,F,G,H,J, K,L,M; C11B,C,D
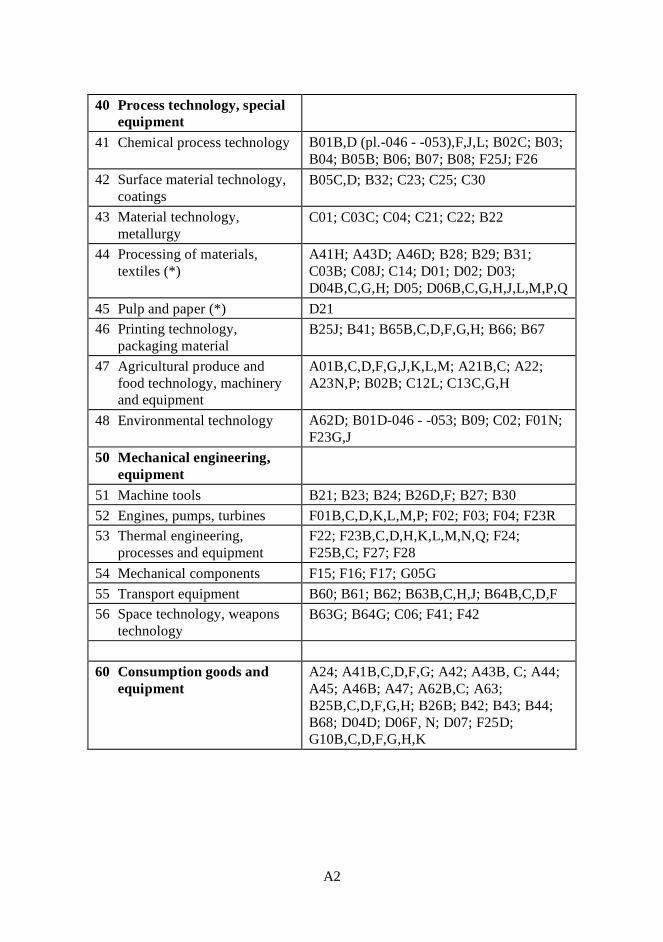
A2
40 Process technology, special
equipment
41 Chemical process technology B01B,D (pl.-046 - -053),F,J,L; B02C; B03; B04; B05B; B06; B07; B08; F25J; F26
42 Surface material technology, coatings
B05C,D; B32; C23; C25; C30
43 Material technology, metallurgy
C01; C03C; C04; C21; C22; B22
44 Processing of materials, textiles (*)
A41H; A43D; A46D; B28; B29; B31; C03B; C08J; C14; D01; D02; D03; D04B,C,G,H; D05; D06B,C,G,H,J,L,M,P,Q
45 Pulp and paper (*) D21 46 Printing technology,
packaging material B25J; B41; B65B,C,D,F,G,H; B66; B67
47 Agricultural produce and food technology, machinery and equipment
A01B,C,D,F,G,J,K,L,M; A21B,C; A22; A23N,P; B02B; C12L; C13C,G,H
48 Environmental technology A62D; B01D-046 - -053; B09; C02; F01N; F23G,J
50 Mechanical engineering, equipment
51 Machine tools B21; B23; B24; B26D,F; B27; B30 52 Engines, pumps, turbines F01B,C,D,K,L,M,P; F02; F03; F04; F23R 53 Thermal engineering,
processes and equipment F22; F23B,C,D,H,K,L,M,N,Q; F24; F25B,C; F27; F28
54 Mechanical components F15; F16; F17; G05G 55 Transport equipment B60; B61; B62; B63B,C,H,J; B64B,C,D,F 56 Space technology, weapons
technology B63G; B64G; C06; F41; F42
60 Consumption goods and
equipment A24; A41B,C,D,F,G; A42; A43B, C; A44; A45; A46B; A47; A62B,C; A63; B25B,C,D,F,G,H; B26B; B42; B43; B44; B68; D04D; D06F, N; D07; F25D; G10B,C,D,F,G,H,K

A3
70 Earth construction and
hydraulic engineering, mining
E01; E02; E03; E04; E05; E06; E21
80 Software (not IPC-class compatible) 81 Applications software 82 Artificial intelligence 83 Databases 84 Data processing 85 Security technology 86 Data management systems 87 Network software, network
management
88 Programming and programming languages
90 'Problems' 91 Ambiguous case 92 Classification not applicable
(service etc.)
99 No information Sources: 10–70 Fraunhofer ISI / Jan 17, 1997 (* = own classification) 80 Vereinigung der Technologiezentren Österreichs: http://www.tcs.co.at/vtoe/firmen/tcc/tcc.htm IPC-classification: http://www.wipo.int/eng/clssfctn/ipc/ipc6en/index.htm


B1
Appendix B: Estimation results for the technology class and time period dummies
Table B1. Results for time periods in Pooled Probit 1 and 2.
Robust Partial Robust Partial
Coef. Std. Err. effect Coef. Std. Err. effect
Time periods
(ref. POST1997)
PRE1986 0.6518*** 0.2029 0.2096*** 0.6283*** 0.2018 0.1985***
YEARS86-87 0.1826 0.2511 0.0670 0.0821 0.2511 0.0303
YEARS88-89 0.3520 0.2235 0.1240 0.3393 0.2339 0.1175
YEARS90-91 0.1177 0.2220 0.0438 0.0691 0.2325 0.0255
YEAR1992 0.4188* 0.2224 0.1449* 0.4541* 0.2387 0.1521*
YEAR1993 0.3597* 0.2109 0.1265* 0.3710* 0.2076 0.1274*
YEAR1994 0.4336* 0.2274 0.1494* 0.4263* 0.2280 0.1440*
YEAR1995 0.1529 0.1959 0.0565 0.1570 0.1983 0.0570
YEAR1996 0.0375 0.2032 0.0141 0.0449 0.2069 0.0167
YEAR1997 0.0694 0.1998 0.0260 0.0761 0.2051 0.0281
Pooled Probit 1 Pooled Probit 2
Table B2. Results for time periods and technology classes in Pooled Probit 3 and 4.
Robust Partial Robust Partial
Coef. Std. Err. effect Coef. Std. Err. effect
Technology classes
(ref. CONSUM)
ELECTRO -0.1878 0.3351 -0.0748 -0.1551 0.3412 -0.0618
INSTRU -0.1344 0.3186 -0.0536 -0.0885 0.3243 -0.0353
CHEM 0.0004 0.3970 0.0001 -0.0041 0.4041 -0.0016
AGRI&FOODCHEM -0.3425 0.3573 -0.1352 -0.2810 0.3665 -0.1114
PROCTECH 0.3024 0.3143 0.1174 0.3398 0.3180 0.1315
ENVIRO 1.0744** 0.5397 0.3463** 1.1169** 0.5468 0.3572**
MACH 0.4527 0.3181 0.1716 0.4741 0.3230 0.1796
EARTH&WATER 0.0553 0.3601 0.0220 0.0919 0.3687 0.0365
SOFT -1.4486*** 0.4019 -0.4434*** -1.4454*** 0.4201 -0.4401***
Time periods
(ref. POST1997)
PRE1986 0.6267*** 0.2078 0.2293*** 0.6063*** 0.2139 0.2237***
YEARS86-87 0.1083 0.2580 0.0429 0.0494 0.2589 0.0196
YEARS88-89 0.3835 0.2617 0.1471 0.3727 0.2602 0.1436
YEARS90-91 0.1377 0.2432 0.0544 0.1508 0.2425 0.0596
YEAR1992 0.5801** 0.2434 0.2145** 0.6042** 0.2474 0.2231**
YEAR1993 0.4411** 0.2106 0.1675** 0.4603** 0.2187 0.1748**
YEAR1994 0.4522* 0.2474 0.1714* 0.4400* 0.2497 0.1677*
YEAR1995 0.1884 0.2181 0.0741 0.1690 0.2135 0.0667
YEAR1996 0.0180 0.2044 0.0072 0.0459 0.2021 0.0182
YEAR1997 0.0831 0.2196 0.0329 0.0521 0.2181 0.0207
Pooled Probit 3 Pooled Probit 4

B2
Table B3. Results for time periods and technology classes in Pooled Probit 5 and Random Effects Probit.
Robust Partial Partial
Coef. Std. Err. effect Coef. Std. Err. effect APE
Technology classes
(ref. CONSUM)
ELECTRO -0.1025 0.3390 -0.0409 -0.1917 0.4130 -0.0763 -0.0608
INSTRU -0.0554 0.3255 -0.0221 -0.0403 0.3922 -0.0160 -0.0127
CHEM 0.0663 0.4044 0.0263 0.1670 0.4579 0.0650 0.0522
AGRI&FOODCHEM -0.2664 0.3596 -0.1058 -0.3726 0.4659 -0.1476 -0.1178
PROCTECH 0.3474 0.3181 0.1338 0.4494 0.3843 0.1669 0.1363
ENVIRO 1.1743** 0.5436 0.3647** 1.5065** 0.6512 0.3964** 0.3618***
MACH 0.5239 0.3238 0.1956 0.5780 0.3880 0.2085 0.1721
EARTH&WATER 0.0524 0.3725 0.0208 0.0487 0.4865 0.0192 0.0153
SOFT -1.4187*** 0.4090 -0.4400*** -2.0136*** 0.4621 -0.5230*** -0.4750***
Time periods
(ref. POST1997)
PRE1986 0.5729*** 0.2090 0.2117*** 0.6923** 0.2780 0.2424** 0.2022**
YEARS86-87 0.0022 0.2545 0.0009 0.0229 0.3183 0.0090 0.0072
YEARS88-89 0.3475 0.2576 0.1338 0.4407 0.3251 0.1640 0.1339
YEARS90-91 0.1137 0.2370 0.0450 0.2742 0.2969 0.1052 0.0849
YEAR1992 0.5874** 0.2455 0.2164** 0.6415** 0.3127 0.2277** 0.1890**
YEAR1993 0.4140* 0.2136 0.1577* 0.4962* 0.2850 0.1825* 0.1496*
YEAR1994 0.4358* 0.2456 0.1655* 0.5642* 0.2912 0.2042* 0.1683**
YEAR1995 0.1196 0.2123 0.0473 0.1803 0.2764 0.0701 0.0563
YEAR1996 0.0237 0.2019 0.0094 0.0513 0.2609 0.0202 0.0162
YEAR1997 0.0508 0.2175 0.0202 0.0343 0.2728 0.0135 0.0108
Pooled Probit 5 Random Effects Probit
Table B4. Results for time periods and technology classes in Pooled Logit and Pooled LPM.
Robust Partial Robust
Coef. Std. Err. effect Coef. Std. Err.
Technology classes
(ref. CONSUM)
ELECTRO -0.2218 0.5714 -0.0554 -0.0458 0.1057
INSTRU -0.1634 0.5572 -0.0408 -0.0276 0.1002
CHEM 0.0970 0.7014 0.0240 0.0169 0.1194
AGRI&FOODCHEM -0.5587 0.6001 -0.1382 -0.1112 0.1045
PROCTECH 0.5244 0.5409 0.1250 0.0847 0.0966
ENVIRO 2.0449* 1.0699 0.3620** 0.2565** 0.1187
MACH 0.8266 0.5516 0.1889 0.1355 0.0982
EARTH&WATER 0.0028 0.6283 0.0007 0.0082 0.1159
SOFT -2.5676*** 0.7721 -0.4560*** -0.4286*** 0.1065
Time periods
(ref. POST1997)
PRE1986 1.0309*** 0.3738 0.2275*** 0.1703*** 0.0609
YEARS86-87 0.0337 0.4358 0.0084 0.0223 0.0814
YEARS88-89 0.7137 0.4457 0.1659* 0.1218* 0.0714
YEARS90-91 0.2423 0.4083 0.0594 0.0506 0.0701
YEAR1992 1.0684** 0.4177 0.2342*** 0.1863*** 0.0708
YEAR1993 0.6965* 0.3571 0.1623* 0.1151* 0.0656
YEAR1994 0.8193* 0.4297 0.1874* 0.1397* 0.0724
YEAR1995 0.2108 0.3577 0.0518 0.0450 0.0654
YEAR1996 0.0752 0.3463 0.0186 0.0161 0.0634
YEAR1997 0.0808 0.3792 0.0200 0.0343 0.0660
Pooled Logit Pooled LPM (OLS)

C1
Appendix C: Partial effects at means and means of partial effects
Table C1. Partial effects at means and means of partial effects for Pooled Probit 1 and 2.
Dependent variable: PATAPP
Independent variables Partial effect Mean of Partial effect Mean of
at means partial effect at means partial effect
Firm size classes
(ref. EMP1)
EMP2 -0.1052** -0.0893* -0.0492 -0.0407
EMP3 -0.1711*** -0.1473*** -0.1255** -0.1051*
EMP4 -0.0713 -0.0605 -0.0768 -0.0635
Other firm characteristics
R&DINT 0.2363** 0.2121** 0.2168* 0.1717*
STARTUP 0.1595*** 0.1343***
LARGEPP 0.2207** 0.1846**
Technology classes
(ref. CONSUM)
ELECTRO -0.0936 -0.0798 -0.1291 -0.1075
INSTRU -0.0664 -0.0563 -0.1062 -0.0879
CHEM 0.0509 0.0432 0.0164 0.0136
AGRI&FOODCHEM -0.2284* -0.2005* -0.2241* -0.1915*
PROCTECH 0.0204 0.0174 -0.0051 -0.0043
ENVIRO 0.3209*** 0.2805*** 0.2961*** 0.2533***
MACH 0.0644 0.0550 0.0441 0.0367
EARTH&WATER -0.0167 -0.0142 -0.0625 -0.0518
SOFT -0.5437*** 0.5200*** -0.5726*** -0.5399***
Time periods
(ref. POST1997)
PRE1986 0.2338*** 0.2010*** 0.2260*** 0.1905***
YEARS86-87 0.0703 0.0594 0.0319 0.0264
YEARS88-89 0.1320* 0.1119* 0.1273 0.1055
YEARS90-91 0.0457 0.0387 0.0269 0.0223
YEAR1992 0.1552** 0.1315** 0.1669** 0.1385**
YEAR1993 0.1351* 0.1147* 0.1389* 0.1154*
YEAR1994 0.1608** 0.1366** 0.1581** 0.1314**
YEAR1995 0.0591 0.0500 0.0606 0.0501
YEAR1996 0.0146 0.0124 0.0175 0.0145
YEAR1997 0.0270 0.0229 0.0296 0.0245
Pooled Probit 1 Pooled Probit 2
Significance level notation: *** 1%, ** 5%, * 10%.
The partial effects are computed as partial derivatives for continuous variables and as discrete changes in the propensity to patent for binary variables. The significance level notation for the partial effects is based on standard errors computed using the delta method.

C2
Table C2. Partial effects at means and means of partial effects for Pooled Probit 3 and 4.
Dependent variable: PATAPP
Independent variables Partial effect Mean of Partial effect Mean of
at means partial effect at means partial effect
Innovation and market characteristics
SIGNIF 0.2217*** 0.1672** 0.1923** 0.1424**
NOVFIRM 0.1717*** 0.1281*** 0.1696*** 0.1249***
NOVMARK 0.3264*** 0.2600*** 0.3141*** 0.2467***
SCIENCE 0.1136** 0.0832** 0.1000* 0.0724*
COMPLEX -0.2451*** -0.1798** -0.2456*** -0.1780**
CUMULTECH 0.1972*** 0.1473*** 0.1864** 0.1376**
PRICOMP -0.0958* -0.0696* -0.1037* -0.0745**
PUBFUND 0.1060** 0.0780** 0.0732 0.0529
COLLAB -0.0516 -0.0372
CUSTCOLLAB -0.0542 -0.0387
SUBCONCOLLAB 0.0122 0.0087
RINSTCOLLAB 0.1262** 0.0922***
COMPCOLLAB 0.0503 0.0359
Firm size classes
(ref. EMP1)
EMP2 -0.0070 -0.0051 -0.0070 -0.0050
EMP3 -0.0730 -0.0529 -0.0819 -0.0586
EMP4 -0.0764 -0.0551 -0.0864 -0.0615
Other firm characteristics
R&DINT 0.0049 0.0002 -0.0183 -0.0021
STARTUP 0.1065** 0.0781** 0.1098** 0.0795**
LARGEPP 0.2089* 0.1550* 0.2256** 0.1667**
Technology classes
(ref. CONSUM)
ELECTRO -0.0741 -0.0534 -0.0611 -0.0435
INSTRU -0.0528 -0.0380 -0.0347 -0.0247
CHEM 0.0001 0.0001 -0.0016 -0.0011
AGRI&FOODCHEM -0.1357 -0.0989 -0.1113 -0.0799
PROCTECH 0.1153 0.0841 0.1290 0.0933
ENVIRO 0.3216*** 0.2554*** 0.3289*** 0.2608***
MACH 0.1681 0.1242 0.1754 0.1286
EARTH&WATER 0.0214 0.0155 0.0354 0.0253
SOFT -0.5065*** -0.4221*** -0.5060*** -0.4168***
Time periods
(ref. POST1997)
PRE1986 0.2229*** 0.1664*** 0.2164*** 0.1598***
YEARS86-87 0.0417 0.0301 0.0191 0.0137
YEARS88-89 0.1413 0.1034 0.1375 0.0996
YEARS90-91 0.0529 0.0382 0.0578 0.0413
YEAR1992 0.2052*** 0.1520*** 0.2123*** 0.1562***
YEAR1993 0.1614** 0.1186** 0.1677** 0.1220**
YEAR1994 0.1651** 0.1214** 0.1609* 0.1170*
YEAR1995 0.0719 0.0521 0.0646 0.0463
YEAR1996 0.0070 0.0051 0.0178 0.0127
YEAR1997 0.0321 0.0232 0.0202 0.0144
Pooled Probit 3 Pooled Probit 4
Significance level notation: *** 1%, ** 5%, * 10%. The partial effects are computed as partial derivatives for continuous variables and as discrete changes in the propensity to patent for binary variables. The significance level notation for the partial effects is based on standard errors computed using the delta method.

C3
Table C3. Partial effects at means and means of partial effects for Pooled Probit 5, Random Effects Probit, and Pooled Logit.
Significance level notation: *** 1%, ** 5%, * 10%.
The partial effects are computed as partial derivatives for continuous variables and as discrete changes in the propensity to patent for binary variables. The significance level notation for the partial effects is based on standard errors computed using the delta method.
Dependent variable: PATAPP
Independent variables Partial effect Mean of Partial effect Mean of Partial effect Mean of
at means partial effect at means partial effect at means partial effect
Innovation and market characteristics
SIGNIF 0.1987** 0.1478** 0.1763* 0.1138 0.2261** 0.1637**
NOVFIRM 0.1745*** 0.1292*** 0.2209*** 0.1441*** 0.1824*** 0.1264***
NOVMARK 0.3228*** 0.2551*** 0.3918*** 0.2810*** 0.3433*** 0.2579***
SCIENCE 0.0948* 0.0688* 0.1051 0.0664 0.0988* 0.0675*
COMPLEX -0.2512*** -0.1833** -0.3250** -0.2127** -0.2681*** -0.1841**
CUMULTECH 0.1928*** 0.1431*** 0.2193** 0.1439** 0.1998*** 0.1426***
PRICOMP -0.1001* -0.0722* -0.1356** -0.0857** -0.1103** -0.0744**
RINSTCOLLAB 0.1335*** 0.0981*** 0.1960*** 0.1271*** 0.1411*** 0.0972***
Firm size classes
(ref. EMP1)
EMP2 -0.0181 -0.0129 -0.0477 -0.0297 -0.0165 -0.0110
EMP3 -0.0953 -0.0686 -0.1268 -0.0797 -0.0972 -0.0652
EMP4 -0.1023 -0.0732 -0.1475 -0.0919 -0.1136 -0.0758
Other firm characteristics
R&DINT -0.0111 -0.0006 -0.0186 -0.0017 -0.0059 -0.0001
STARTUP 0.1171** 0.0853** 0.1159** 0.0734** 0.1163** 0.0794*
LARGEPP 0.2200** 0.1629** 0.2439*** 0.1602** 0.2257** 0.1611*
Technology classes
(ref. CONSUM)
ELECTRO -0.0402 -0.0288 -0.0752 -0.0469 -0.0544 -0.0363
INSTRU -0.0217 -0.0155 -0.0156 -0.0097 -0.0399 -0.0266
CHEM 0.0256 0.0184 0.0631 0.0396 0.0233 0.0156
AGRI&FOODCHEM -0.1055 -0.0760 -0.1473 -0.0931 -0.1383 -0.0932
PROCTECH 0.1318 0.0957 0.1667 0.1062 0.1229 0.0839
ENVIRO 0.3388*** 0.2714*** 0.3724*** 0.2817*** 0.3359*** 0.2697***
MACH 0.1925* 0.1418* 0.2076* 0.1338 0.1859* 0.1299
EARTH&WATER 0.0203 0.0146 0.0187 0.0117 0.0007 0.0005
SOFT -0.4992*** -0.4122*** -0.6240*** -0.5039*** -0.5308*** -0.4318***
Time periods
(ref. POST1997)
PRE1986 0.2059*** 0.1521*** 0.2388*** 0.1558*** 0.2216*** 0.1571***
YEARS86-87 0.0009 0.0006 0.0088 0.0055 0.0081 0.0055
YEARS88-89 0.1289 0.0935 0.1582 0.1007 0.1583* 0.1098*
YEARS90-91 0.0438 0.0314 0.1020 0.0640 0.0573 0.0386
YEAR1992 0.2074*** 0.1527*** 0.2197** 0.1421** 0.2234*** 0.1592***
YEAR1993 0.1522** 0.1109** 0.1768* 0.1130* 0.1557** 0.1078**
YEAR1994 0.1596* 0.1164* 0.1981** 0.1275** 0.1799** 0.1258**
YEAR1995 0.0460 0.0330 0.0681 0.0427 0.0501 0.0337
YEAR1996 0.0092 0.0066 0.0197 0.0123 0.0181 0.0121
YEAR1997 0.0197 0.0141 0.0132 0.0082 0.0194 0.0130
Random Effects Probit Pooled LogitPooled Probit 5


D1
Appendix D: Pooled Probit 1 and 2 with continuous firm size variables
Table D1. Estimation results for Pooled Probit 1b and 2b. Dependent variable: PATAPP
Independent variables Robust Partial Robust Partial
Coef. Std. Err. effect Coef. Std. Err. effect
LNEMP -0.1508* 0.0799 -0.0722 0.0760
LNEMP2 0.0136 0.0106 0.0047 0.0094
R&DINT 0.6216** 0.2938 0.2480** 0.5631* 0.3055 0.2233*
STARTUP 0.4171*** 0.1246 0.1629***
LARGEPP 0.6465* 0.3327 0.2369**
Technology classes
(ref. CONSUM)
ELECTRO -0.1979 0.3113 -0.0784 -0.3043 0.3124 -0.1208
INSTRU -0.1289 0.2934 -0.0513 -0.2486 0.3013 -0.0989
CHEM 0.1811 0.3717 0.0719 0.0717 0.3727 0.0283
AGRI&FOODCHEM -0.5534 0.3453 -0.2094 -0.5652* 0.3409 -0.2193*
PROCTECH 0.0701 0.2929 0.0279 -0.0018 0.2918 -0.0007
ENVIRO 1.0631** 0.4614 0.3578** 0.9506** 0.4626 0.3120**
MACH 0.1916 0.2880 0.0760 0.1271 0.2930 0.0499
EARTH&WATER -0.0110 0.3460 -0.0044 -0.1336 0.3514 -0.0532
SOFT -1.6073*** 0.4018 -0.4431*** -1.7624*** 0.3839 -0.4942***
Time periods
(ref. POST1997)
PRE1986 0.6401*** 0.2013 0.2397*** 0.6188*** 0.2009 0.2232***
YEARS86-87 0.1661 0.2523 0.0660 0.0673 0.2503 0.0266
YEARS88-89 0.3587 0.2264 0.1403 0.3443 0.2361 0.1314
YEARS90-91 0.1190 0.2212 0.0474 0.0755 0.2323 0.0298
YEAR1992 0.3998* 0.2212 0.1556* 0.4442* 0.2410 0.1665*
YEAR1993 0.3760* 0.2096 0.1468* 0.3846* 0.2065 0.1458*
YEAR1994 0.4208* 0.2276 0.1634* 0.4151* 0.2275 0.1565*
YEAR1995 0.1497 0.1950 0.0596 0.1552 0.1973 0.0608
YEAR1996 0.0131 0.2039 0.0052 0.0247 0.2062 0.0098
YEAR1997 0.0470 0.2002 0.0188 0.0641 0.2037 0.0253
Constant 0.2950 0.3121 0.1011 0.3190
Robust Wald tests for joint hypotheses !2 (df) p-value !
2 (df) p-value
H0: All coefs zero (exc. constant) 86.66 (22) 0.0000 136.09 (24) 0.0000
H0: Coefs of LNEMP and LNEMP2 zero 6.45 (2) 0.0397 2.19 (2) 0.3343
H0: All tech. class coefs zero 51.24 (9) 0.0000 56.6 (9) 0.0000
H0: All time period coefs zero 22.43 (10) 0.0131 21.5 (10) 0.0179
Number of observations 791 791
Log pseudolikelihood -464.17879 -453.20337
McFadden's pseudo R2 0.140 0.160
Efron's pseudo R2 0.180 0.201
McKelvey and Zavoina's pseudo R2 0.279 0.315
Percent correctly predicted
for observations with PATAPP=1 88.33 85.68
for observations with PATAPP=0 42.73 48.07
for all observations 68.90 69.66
Pooled Probit 1b Pooled Probit 2b
0.0000145 -0.0000021
Significance level notation: *** 1%, ** 5%, * 10%.
The partial effects are estimated at a point where technology class and time period dummies are all zero and other variables are assigned their mean values. The partial effects are computed as partial derivatives for continuous variables and as discrete changes in the propensity to patent for binary variables. The significance level notation for the partial effects is based on standard errors computed using the delta method.
NOTE: Partial effects are calculated at the mean number of employees (EMP) rather than at the mean values of LNEMP and LNEMP2. Moreover, no separate partial effects are calculated for LNEMP and LNEMP2, but the partial effect is calculated with respect to EMP, the number of employees.


E1
Appendix E: Pooled Probit 2 and 3 with the exporting status of the innovation
The Sfinno survey asked the respondents from the innovating firms whether or not the innovations of interest had been introduced to foreign markets. Hence, it is possible to construct a binary variable INNOEXPORTED coded as one if the innovation had been exported. INNOEXPORTED has a mean of 0.6523 and a standard deviation of 0.4765.
Table E1. Estimation results for Pooled Probit 2 and 3 with INNOEXPORTED.
Dependent variable: PATAPP
Independent variables Robust Partial Robust Partial
Coef. Std. Err. effect Coef. Std. Err. effect
Innovation and market characteristics
INNOEXPORTED 0.2279** 0.1119 0.0845** 0.0501 0.1163 0.0199
SIGNIF 0.6305** 0.2924 0.2321**
NOVFIRM 0.4432*** 0.1280 0.1753***
NOVMARK 0.8313*** 0.1158 0.3207***
SCIENCE 0.3031** 0.1434 0.1184**
COMPLEX -0.6321** 0.2506 -0.2424***
CUMULTECH 0.5528** 0.2304 0.2068**
PRICOMP -0.2447* 0.1305 -0.0974*
PUBFUND 0.2719** 0.1288 0.1081**
COLLAB -0.1433 0.1508 -0.0566
Firm size classes
(ref. EMP1)
EMP2 -0.1494 0.1461 -0.0562 -0.0225 0.1581 -0.0090
EMP3 -0.3618** 0.1642 -0.1397** -0.1947 0.1780 -0.0775
EMP4 -0.2265 0.2242 -0.0862 -0.1987 0.2190 -0.0791
Other firm characteristics
R&DINT 0.5217* 0.3105 0.1911 0.0103 0.3069 0.0041
STARTUP 0.4016*** 0.1265 0.1427*** 0.2745* 0.1424 0.1084*
LARGEPP 0.6177** 0.3382 0.1954** 0.5887* 0.3562 0.2201*
Technology classes (9 dummies)
Time periods (10 dummies)
Constant -0.0030 0.3089 -1.0540*** 0.3714
Number of observations 791 791
Log pseudolikelihood -450.07056 -392.00572
McFadden's pseudo R2 0.166 0.274
Percent correctly predicted
for observations with PATAPP=1 85.90 85.24
for observations with PATAPP=0 50.45 68.55
for all observations 70.80 78.13
Pooled Probit 2 with INNOEXPORTED Pooled Probit 3 with INNOEXPORTED
Estimates not reported Estimates not reported
Estimates not reported Estimates not reported
Significance level notation: *** 1%, ** 5%, * 10%.
The partial effects are estimated at a point where firm size, technology class, and time period dummies are all zero and other variables are assigned their mean values. The partial effects are computed as partial derivatives for continuous variables and as discrete changes in the propensity to patent for binary variables. The significance level notation for the partial effects is based on standard errors computed using the delta method.


F1
Appendix F: Pooled Probit 3 and 4 with PATENTS
Table F1. Estimation results for Pooled Probit 3b and 4b.
Significance level notation: *** 1%, ** 5%, * 10%.
The partial effects are estimated at a point where firm size, technology class, and time period dummies are all zero and other variables are assigned their mean values. The partial effects are computed as partial derivatives for continuous variables and as discrete changes in the propensity to patent for binary variables. The significance level notation for the partial effects is based on standard errors computed using the delta method.
Dependent variable: PATAPP
Independent variables Robust Partial Robust Partial
Coef. Std. Err. effect Coef. Std. Err. effect
Innovation and market characteristics
SIGNIF 0.6417** 0.2968 0.2145** 0.5396* 0.3009 0.2073**
NOVFIRM 0.4382*** 0.1316 0.1733*** 0.4344*** 0.1324 0.1716***
NOVMARK 0.8623*** 0.1121 0.3283*** 0.8281*** 0.1136 0.3155***
SCIENCE 0.2962** 0.1476 0.1171** 0.2584* 0.1498 0.1025*
COMPLEX -0.5631** 0.2688 -0.2145** -0.5599** 0.2675 -0.2125**
CUMULTECH 0.5335** 0.2301 0.2045** 0.5024** 0.2299 0.1941**
PRICOMP -0.2429* 0.1309 -0.0965* -0.2606* 0.1349 -0.1034*
PUBFUND 0.2715** 0.1289 0.1079** 0.1868 0.1206 0.0743
COLLAB -0.1465 0.1476 -0.0583
CUSTCOLLAB -0.1425 0.1354 -0.0568
SUBCONCOLLAB 0.0350 0.1126 0.0140
RINSTCOLLAB 0.3144** 0.1303 0.1249**
COMPCOLLAB 0.0840 0.2179 0.0335
Firm size classes
(ref. EMP1)
EMP2 -0.0115 0.1584 -0.0046 -0.0114 0.1626 -0.0045
EMP3 -0.1926 0.1778 -0.0764 -0.2125 0.1849 -0.0840
EMP4 -0.1961 0.2452 -0.0778 -0.2125 0.2498 -0.0840
Other firm characteristics
R&DINT 0.0646 0.2905 0.0258 0.0138 0.2864 0.0055
STARTUP 0.2792** 0.1412 0.1109** 0.2836** 0.1436 0.1127**
PATENTS 0.0162** 0.0076 0.0065** 0.0169** 0.0068 0.0068**
Technology classes (9 dummies)
Time periods (10 dummies)
Constant -1.1270*** 0.3674 -1.2359*** 0.3671
Robust Wald tests for joint hypotheses !2 (df) p-value !
2 (df) p-value
H0: All coefs zero (exc. constant) 191.68 (34) 0.0000 189.59 (37) 0.0000
H0: All firm size class coefs zero 1.77 (3) 0.6210 2.06 (3) 0.5593
H0: All tech. class coefs zero 45.79 (9) 0.0000 43.58 (9) 0.0000
H0: All time period coefs zero 24.51 (10) 0.0064 23.65 (10) 0.0086
Number of observations 791 791
Log pseudolikelihood -391.03733 -387.07203
McFadden's pseudo R2 0.275 0.2827
Efron's pseudo R2 0.342 0.351
McKelvey and Zavoina's pseudo R2 0.478 0.489
Percent correctly predicted
for observations with PATAPP=1 85.46 86.12
for observations with PATAPP=0 68.25 66.47
for all observations 78.13 77.75
Estimates not reported Estimates not reported
Pooled Probit 3b Pooled Probit 4b
Estimates not reported Estimates not reported

F2
Table F2. Testing for endogeneity of PATENTS.
Dependent variable in the probit model: PATAPP
Test 1 Test 2 Test 3
Explanatory variables in the probit model
Potentially endogenous variable PATENTS PATENTS PATENTS
Exogenous variables SIGNIF SIGNIF SIGNIF
NOVFIRM NOVFIRM NOVFIRM
NOVMARK NOVMARK NOVMARK
SCIENCE SCIENCE SCIENCE
COMPLEX COMPLEX COMPLEX
CUMULTECH CUMULTECH CUMULTECH
PRICOMP PRICOMP PRICOMP
PUBFUND PUBFUND PUBFUND
CUSTCOLLAB CUSTCOLLAB CUSTCOLLAB
SUBCONCOLLAB SUBCONCOLLAB SUBCONCOLLAB
RINSTCOLLAB RINSTCOLLAB RINSTCOLLAB
COMPCOLLAB COMPCOLLAB COMPCOLLAB
STARTUP STARTUP STARTUP
R&DINT
Firm size dummies (3)
Technology class dummies (9) Technology class dummies (9) Technology class dummies (9)
Time period dummies (10) Time period dummies (10) Time period dummies (10)
Instruments
Firm size dummies (3) R&DINT R&DINT
Firm size dummies (3)
Test of exogeneity of PATENTS
H0: Coef of the OLS residual zero in the
probit model
Robust asymptotic t-statistic 0.77 -0.05 0.77
p-value 0.441 0.962 0.440

G1
Appendix G: Random Effects Probit without RINSTCOLLAB
Table G1. Estimation results for Random Effects Probit without RINSTCOLLAB.
Dependent variable: PATAPP
Independent variables Partial
Coef. Std. Err. effect APE
Innovation and market characteristics
SIGNIF 0.6273* 0.3238 0.2301** 0.1956**
NOVFIRM 0.5707*** 0.1409 0.2245*** 0.1868***
NOVMARK 1.0258*** 0.1532 0.3888*** 0.3271***
SCIENCE 0.3461* 0.1885 0.1344* 0.1122*
COMPLEX -0.8094** 0.3577 -0.3022*** -0.2554**
CUMULTECH 0.6578** 0.2999 0.2401** 0.2044**
PRICOMP -0.3065** 0.1440 -0.1217** -0.1010**
Firm size classes
(ref. EMP1)
EMP2 -0.0934 0.1880 -0.0372 -0.0308
EMP3 -0.2923 0.2025 -0.1160 -0.0963
EMP4 -0.3228 0.2397 -0.1279 -0.1062
Other firm characteristics
R&DINT 0.1130 0.3624 0.0449 0.0372
STARTUP 0.3031** 0.1525 0.1194** 0.0993**
LARGEPP 0.6370** 0.3178 0.2351** 0.1995**
Technology classes (9 dummies)
Time periods (10 dummies)
Constant -1.1942 0.4225
!c 0.6766*** 0.1437" 0.3140*** 0.0915
LR test for unobserved effects (df) p-value
H0: " =0 19.22 (01) 0.000
Wald tests for joint hypotheses #2 (df) p-value
H0: All coefs zero (exc. constant) 117.36 (32) 0.0000
H0: All firm size class coefs zero 2.89 (3) 0.4091
H0: All tech. class coefs zero 64.17 (9) 0.0000
H0: All time period coefs zero 15.10 (10) 0.1286
Number of observations 791
Log likelihood -385.02362
Percent correctly predicted
for observations with PATAPP=1 87.00
for observations with PATAPP=0 66.47
for all observations 78.26
Random Effects Probit without RINSTCOLLAB
Estimates not reportedEstimates not reported
!
# 2
Significance level notation: *** 1%, ** 5%, * 10%.
The partial effects and APEs are estimated at a point where firm size, technology class, and time period dummies are all zero and other variables are assigned their mean values. The partial effects and APEs are computed as partial derivatives for continuous variables and as discrete changes in the propensity to patent for binary variables. The significance level notation for the partial effects and APEs is based on standard errors computed using the delta method.

Series title, number and report code of publication
VTT Publications 646 VTT-PUBS-646
Author(s) Mäkinen, Iiro Title
To patent or not to patent? An innovation-level investigation of the propensity to patent
Abstract This study seeks to shed new light on the complex relationship between patents and innovations that has remained extremely elusive thus far. The objective of the present study is to contribute to our understanding of which innovations are patented – and which are not – by analyzing the patenting decision for circa 800 Finnish innovations. With the help of econometric methods, the study seeks to shed new light on the question of how the propensity to patent an innovation is affected by the characteristics of the innovation, the market, and the innovating firm.
For empirical purposes, the propensity to patent is defined as the fraction of innovations for which at least one patent application is filed, while an innovation is defined as an invention that has been commercialized on the market by a business firm or an equivalent. The innovation-level model for the propensity to patent is derived in the spirit of random utility models. The emerging probit model is estimated on a sample of 791 Finnish innovations using a quasi-maximum likelihood estimator called the partial maximum likelihood estimator, which allows for within-firm correlation in the data.
The data sample of 791 Finnish innovations used in the study is drawn from the Sfinno database compiled at VTT Innovation Studies (formerly VTT Group for Technology Studies). In an effort to compile the Sfinno database, a systematic review of 18 carefully selected trade and technical journals from the period 1985–1998 has been complemented with a review of annual reports of large firms from the same period as well as with expert opinion-based identification of innovations. Since the Sfinno approach heavily relies on public sources in the identification of innovations, it is clearly more conducive to studying product than process innovations. Hence innovations only developed for the firm’s internal use are not included in the Sfinno database.
The results from the econometric analysis indicate that various characteristics of the innovation, the market, and the innovating firm have a significant effect on the propensity to patent. First, the estimation results suggest that larger, i.e. more novel and significant, innovations are patented more frequently than smaller ones. Second, technologically very complex innovations appear to be patented less often than others, while the fragmentation of intellectual property rights to cumulatively developing technology seems to entail high propensities to patent. Third, the results indicate that the propensity to patent varies across technology classes and declines with product market competition. Fourth, collaboration with scientific institutions appears to have a positive impact on the propensity to patent, while the estimations fail to produce evidence that public R&D support or collaboration with other types of partners would affect the propensity to patent. Finally, there appears to be a U-shaped relationship between firm size and the propensity to patent, which can be attributed to a relatively large extent to economies of scale in the patenting activity as well as to the relatively important role of patenting in start-up ventures.
ISBN 978-951-38-7029-4 (soft back ed.) 978-951-38-7030-0 (URL: http://www.vtt.fi/publications/index.jsp)
Series title and ISSN Project number
VTT Publications 1235-0621 (soft back ed.) 1455-0849 (URL: http://www.vtt.fi/publications/index.jsp)
20514
Date Language Pages June 2007 English 95 p. + app. 13 p.
Name of project Commissioned by CIPCI
Keywords Publisher patents, innovations, patenting, econometric analysis, propensity, models, estimation, testing, Sfinno, product innovations
VTT Technical Research Centre of Finland P.O. Box 1000, FI-02044 VTT, Finland Phone internat. +358 20 722 4404 Fax +358 20 722 4374

VTT PU
BLICATIO
NS 646
To patent or not to patent? An innovationlevel investigation of the...
Iiro Mäkinen
ESPOO 2007 VTT PUBLICATIONS 646
Iiro Mäkinen
To patent or not to patent?
An innovationlevel investigation of thepropensity to patent
This study seeks to shed new light on the complex relationship betweenpatents and innovations that has remained extremely elusive thus far. Theobjective of the study is to contribute to our understanding of whichinnovations are patented – and which are not – by analyzing the patentingdecision for circa 800 Finnish innovations. The data is drawn from theSfinno database compiled at VTT Innovation Studies. With the help ofeconometric methods, the study seeks to shed new light on the questionof how the propensity to patent an innovation is affected by thecharacteristics of the innovation, the market, and the innovating firm.
The results should be of obvious interest to those who depend onpatent data in drawing conclusions about innovation and technologicalchange. The finding that larger, i.e. more novel and significant, productinnovations are patented more frequently than smaller ones should becomforting news from the perspective of using patents as an economicindicator of innovation since it implies that large innovations enter thepatent indicator at a relatively high probability. However, the study alsopoints to the weaknesses of patent data by demonstrating that thepropensity to patent varies significantly across firms and technologies.For instance, the evidence in favor of the hypotheses on the presence ofeconomies of scale in the patenting activity and on the relatively highpropensities to patent in startup ventures suggests that patents are arather problematic measure of innovations in the context of testing theSchumpeterian hypotheses.
ISBN 9789513870294 (soft back ed.) ISBN 9789513870300 (URL: http://www.vtt.fi/publications/index.jsp)ISSN 12350621 (soft back ed.) ISSN 14550849 (URL: http://www.vtt.fi/publications/index.jsp)
Julkaisu on saatavana Publikationen distribueras av This publication is available from
VTT VTT VTTPL 1000 PB 1000 P.O. Box 1000
02044 VTT 02044 VTT FI02044 VTT, FinlandPuh. 020 722 4404 Tel. 020 722 4404 Phone internat. + 358 20 722 4404Faksi 020 722 4374 Fax 020 722 4374 Fax + 358 20 722 4374