Embed Size (px)
Citation preview

“…to raise new ideas and improve policy debates through quality information and analysis on issues shaping New Hampshire’s future.”
Kicking Into a Higher Gear
Exeter Area Chamber of Commerce
Wednesday, January 28, 2015
Board of DirectorsJames Putnam, Chair
David Alukonis
Eric Herr
Dianne Mercier
Catherine A. Provencher
Todd I. Selig
Michael Whitney
Daniel Wolf
Martin L. Gross, Chair Emeritus
Directors Emeritus William H. Dunlap
Sheila T. Francoeur
Stuart V. Smith, Jr.
Donna Sytek
Brian F. Walsh

Anecdotal evidence from Fed Bank of Boston,
January 14, 2015• Sales or revenues are ahead of year-earlier levels according to
most New England business contacts in the manufacturing, retail, and advertising and consulting sectors.
• Commercial real estate markets are steady to improving and most residential real estate markets in the region continue to see price increases and sales declines.
• With a few exceptions, manufacturers and retailers are not increasing employment, while advertising and consulting firms continue to add modestly to headcounts.
• Cost pressures vary, with selective price increases planned by several respondents.
• The 2015 outlook is positive for almost all responding firms.

NH – Less of a decline, but a slower recovery
92.0
93.0
94.0
95.0
96.0
97.0
98.0
99.0
100.0
101.0
102.0
Dec
200
7 =
100
Index of Total NonFarm Employment (Seasonally Adjusted)
US NE NH
New England
United States
New Hampshire

Manufacturing, construction and financial activities have not
recovered, government shrinks
Source: NH Economic and Labor Market Information Bureau
-8,700
-3,500
-5,100
-3,600
1,100
4,700
100
-4,500
-400 -100
5,200
1,200
4,100 4,1004,900
-2,700
-10,000
-8,000
-6,000
-4,000
-2,000
0
2,000
4,000
6,000
Change in New Hampshire Jobs
Oct 08 to Oct 11
Oct 11 to Oct 14

2011-2013 job growth still leans toward below average wage jobs
Source: NH Economic and Labor Market Information Bureau
5,803
7,089
0
1,000
2,000
3,000
4,000
5,000
6,000
7,000
8,000
Above Average Wage Below Average Wage
Change in NH Jobs from 2011 to 2013 by Average Wage Paid

Portsmouth Area growth in Finance and Health Care
Rockingham County unemployment declines as employment increases

New Hampshire Job Creation – Region and US
Percent Change in Payroll Employment Over Previous Ten Years
-10%
0%
10%
20%
30%
40%
50%
60%
70%
1/1/
1979
1/1/
1981
1/1/
1983
1/1/
1985
1/1/
1987
1/1/
1989
1/1/
1991
1/1/
1993
1/1/
1995
1/1/
1997
1/1/
1999
1/1/
2001
1/1/
2003
1/1/
2005
1/1/
2007
1/1/
2009
1/1/
2011
1/1/
2013
US NE NH
New Hampshire
New England
United States
The Great Convergence

Migration slowed in last decade
-20,000
-15,000
-10,000
-5,000
0
5,000
10,000
15,000
20,000
25,000
30,000
35,000
Net Migration Into and Out of New Hampshire
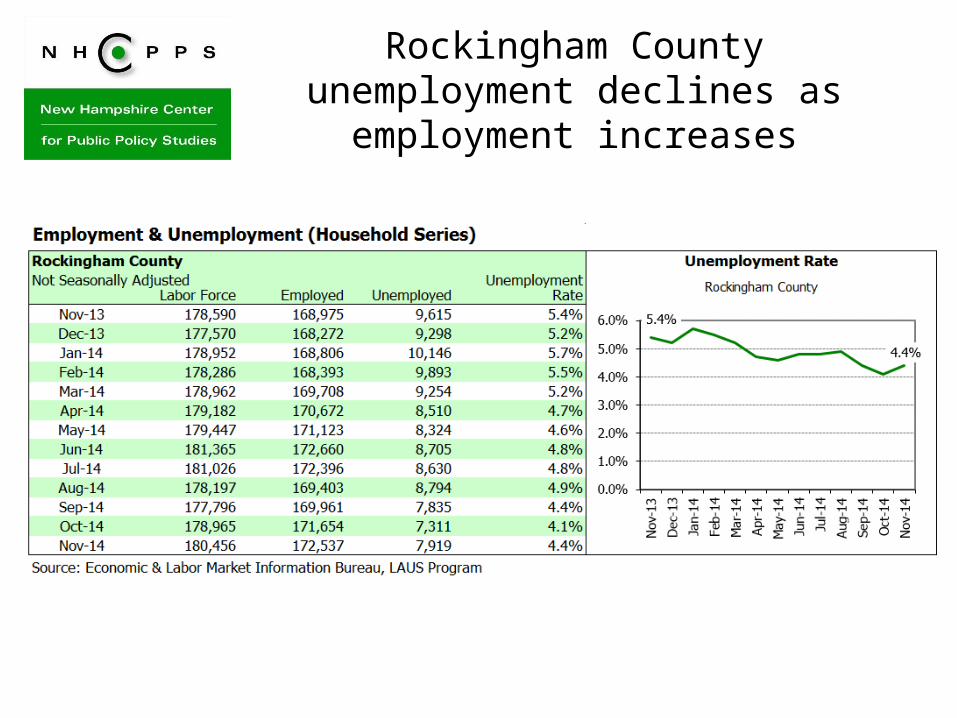
NH Residential Real Estate Sales and Prices
10
$0
$50,000
$100,000
$150,000
$200,000
$250,000
$300,000
0
5,000
10,000
15,000
20,000
25,000
1998 1999 2000 2001 2002 2003 2004 2005 2006 2007 2008 2009 2010 2011 2012 2013 2014
NH Single-Family Residential Home Sales and Price (MLS)Source: NH Association of REALTORS
Units sold Median Price
Median Home Price
Number of Units Sold
Decline from the Peak:Sales -40% from 2004Price -25% from 2005
2014 YTD thru Nov.

Similar trends in Rockingham County
11
Rockingham County
0
1,000
2,000
3,000
4,000
5,000
6,000
$150,000
$170,000
$190,000
$210,000
$230,000
$250,000
$270,000
$290,000
$310,000
2003 2004 2005 2006 2007 2008 2009 2010 2011 2012 2013
Nu
mb
er S
old
Med
ian
So
ld P
rice
MLS Residential Property Sales By Year
Median Price Number Sold
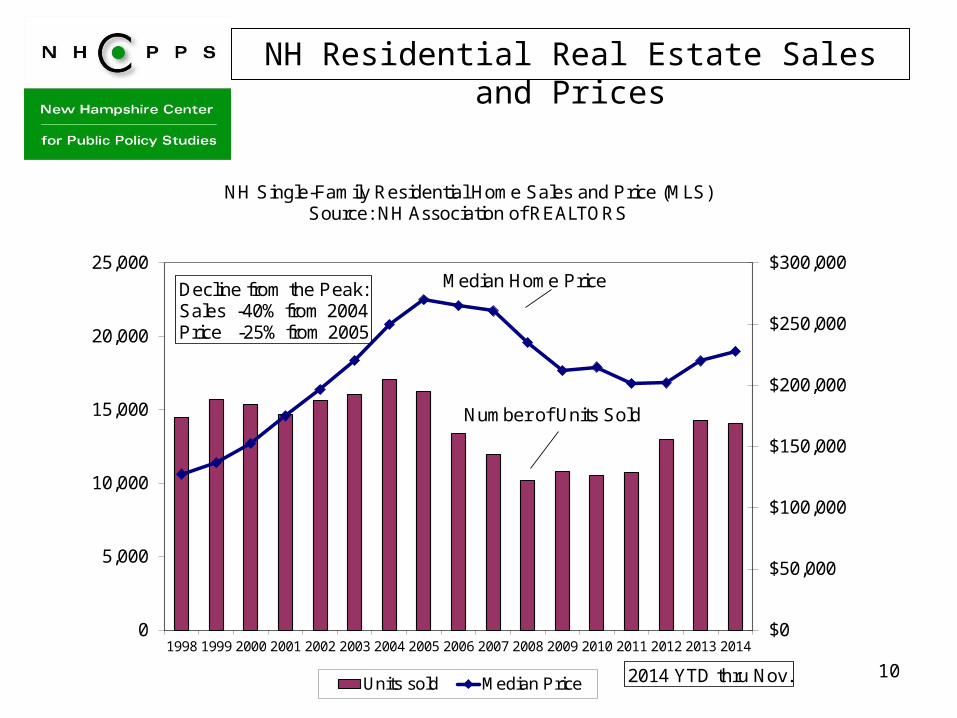
Home Prices Return to the Long Term Trend:
$134,749
$141,372
$152,500
$170,158
$188,089
$206,266
$227,807
$237,976
$226,354
$216,598
$187,954
$170,164
$169,787
$154,410
$151,504
$162,622
$165,787
$0
$50,000
$100,000
$150,000
$200,000
$250,000
$300,000
1998 1999 2000 2001 2002 2003 2004 2005 2006 2007 2008 2009 2010 2011 2012 2013 2014
NH Single-Family Residential Home Price (MLS)Source: NH Association of REALTORS
Median Price 2000 Inflation Adjusted
Median Home Price
Inflation Adjusted Price

1313
But Rental Prices Have Continued to Rise
New Hampshire Rents – NHHFA SurveysState of New Hampshire
$400
$500
$600
$700
$800
$900
$1,000
$1,100
$1,200
Ren
t
Median Gross Rental Cost
All Units 2-Bedroom Units
1414
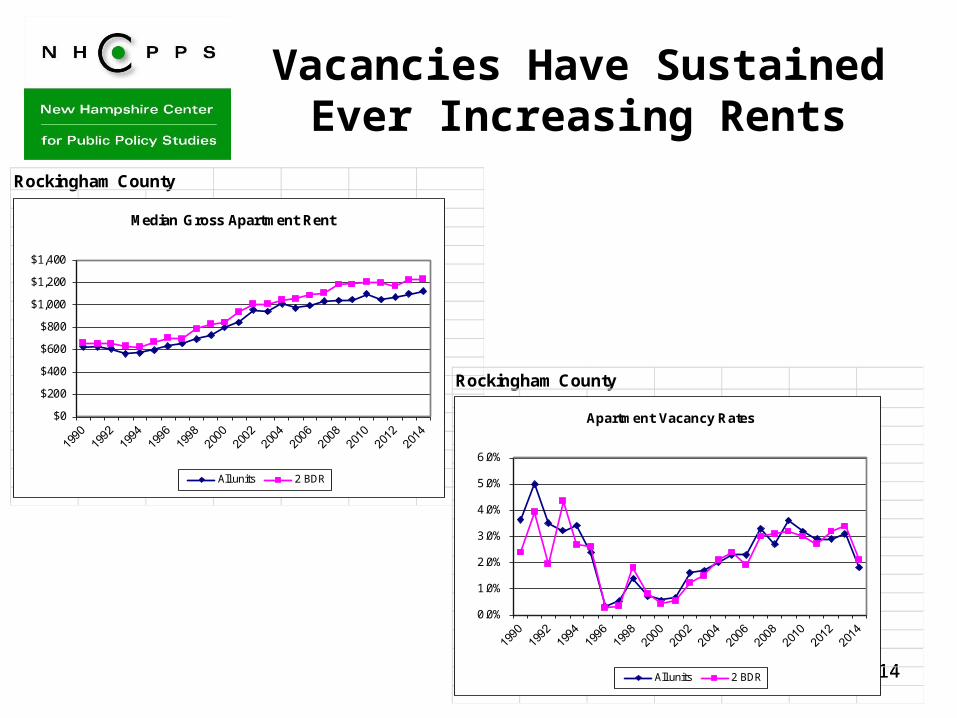
Vacancies Have Sustained Ever Increasing Rents
Rockingham County
$0
$200
$400
$600
$800
$1,000
$1,200
$1,400
Median Gross Apartment Rent
All units 2 BDR
Rockingham County
0.0%
1.0%
2.0%
3.0%
4.0%
5.0%
6.0%
Apartment Vacancy Rates
All units 2 BDR

1515
Another Sign of a “Normal” Housing Market
1.00
1.20
1.40
1.60
1.80
2.00
2.20
2.40
Ratio of Existing Home Price to Median 2BDRrent
Rockingham CountyNew Hampshire
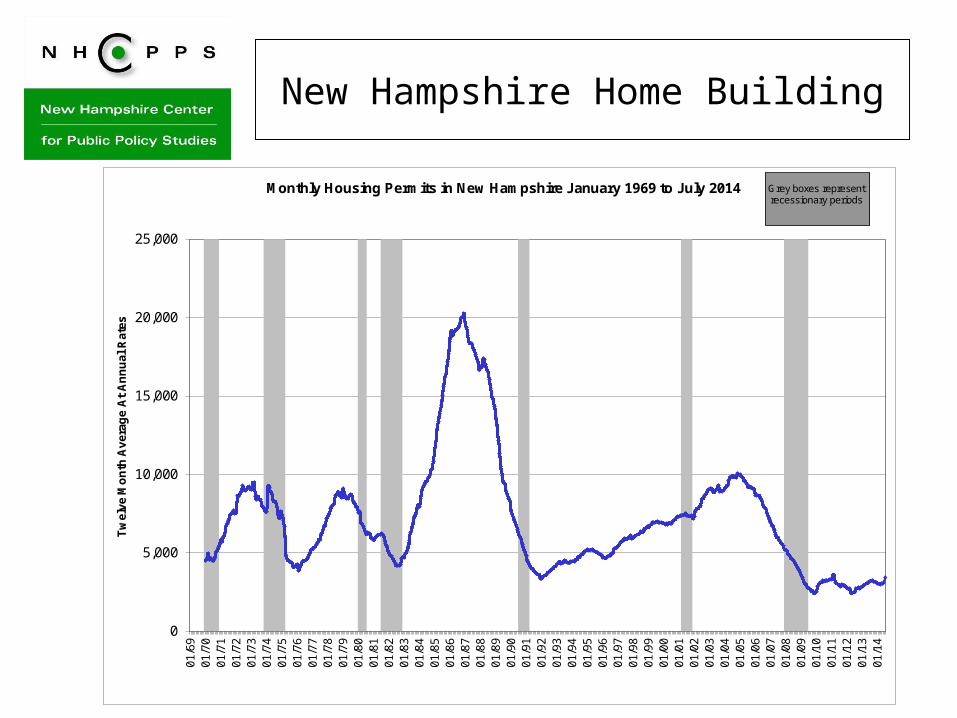
New Hampshire Home Building
0
5,000
10,000
15,000
20,000
25,000
01/6
901
/70
01/7
101
/72
01/7
301
/74
01/7
501
/76
01/7
701
/78
01/7
901
/80
01/8
101
/82
01/8
301
/84
01/8
501
/86
01/8
701
/88
01/8
901
/90
01/9
101
/92
01/9
301
/94
01/9
501
/96
01/9
701
/98
01/9
901
/00
01/0
101
/02
01/0
301
/04
01/0
501
/06
01/0
701
/08
01/0
901
/10
01/1
101
/12
01/1
301
/14
Tw
elv
e M
on
th A
ver
age
At
An
nu
al R
ates
Monthly Housing Permits in New Hampshire January 1969 to July 2014 Grey boxes represent recessionary periods

NH Foreclosures – Worst is Over
0
100
200
300
400
500
600
Jan-
05
Jul-0
5
Jan-
06
Jul-0
6
Jan-
07
Jul-0
7
Jan-
08
Jul-0
8
Jan-
09
Jul-0
9
Jan-
10
Jul-1
0
Jan-
11
Jul-1
1
Jan-
12
Jul-1
2
Jan-
13
Jul-1
3
Jan-
14
Jul-1
4
Source: Real Data Corp. compiled by NH Housing
NH Monthly Foreclosure Deeds
Actual Trend

Real Estate Activity 40% below the Peak
$0
$20
$40
$60
$80
$100
$120
$140
$160
$180Ju
l-99
Jul-0
0
Jul-0
1
Jul-0
2
Jul-0
3
Jul-0
4
Jul-0
5
Jul-0
6
Jul-0
7
Jul-0
8
Jul-0
9
Jul-1
0
Jul-1
1
Jul-1
2
Jul-1
3
Jul-1
4
Jul-1
5
Mill
ion
s
12 Month Running
Real Estate Transfer
New Hampshire State Revenue
Source: Monthly Revenue Focus, NH Dept. of Admin Services
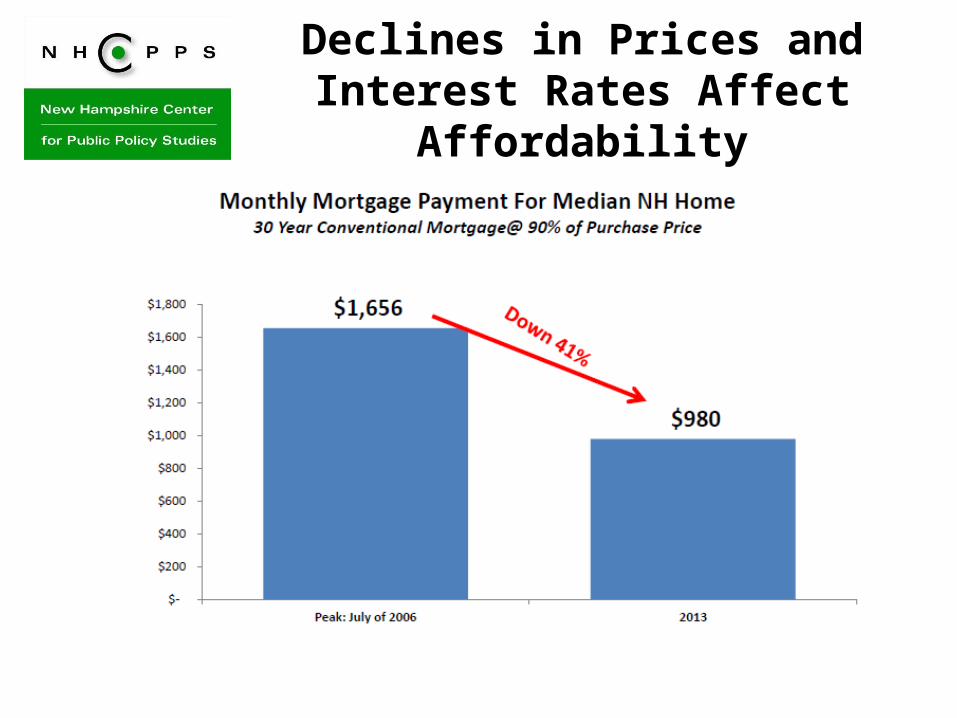
Declines in Prices and Interest Rates Affect Affordability
But…….
• NH’s Young households are burdened by highest level of student debt in the Nation;
• Lending standards are more rigorous—Qualifying Mortgage, 43% debt to income limit, etc.;
• With rents rising and mediocre job quality, more difficult to save and qualify;
• Nearly 20,000 foreclosed units in past several years in the state—some will not qualify;
• Lack of liquidity is keeping boomers in larger houses than they need;
• Prices and interest rates are rising in past several months, blunting recent affordability improvements.

2121
NH’s Changing Housing Environment Has Consequences
• New Hampshire’s population growth is slowing down
• Job quality is poor• Elders will be increasingly
larger share of owners and renters
• Young home buyers are challenged
• Recent trend away from ownership and towards rental
• Different problems in different regions
• General public, town officials and business are not aware of issues affecting NH’s housing
• Fewer new households, and fewer families
• Overpayment problems for low income renters
• Elder overpayment, and Elders not aware of options available
• Future home owners not aware of ownership pitfalls and advantages
• Multi-family production shortages
• Geographic diversity more important than urban core.
• Town officials not comfortable changing existing regulations.
Environment Consequences
Full report at: http://www.nhpolicy.org/report/housing-in-nh-pt-1-big-houses-small-households
NEEP Forecast for New Hampshire October 2014
• The Granite State will add only a few hundred manufacturing jobs over the next five years. However, it is expected that Granite State manufacturing output will continue to increase in the forecast period as it has in the past five years.
• In the private services sector employment will increase by about 2.0 percent annually in the forecast period. The fastest rate of growth will occur in Professional and Business Services, followed by Leisure & Hospitality, and Education and Health Services employment.
• The New Hampshire real estate market has finally seen a return to normal (pre housing bubble) price appreciation and sales growth, according to state realtors. Foreclosure recordings declined steadily over the past year. The state rental market remains strong with rental costs leveling and vacancies remaining below 5 percent in most areas.
Look to an Improving National Economy, Pushed by Housing
and Low Energy Prices

Labor Market Improves

Businesses Have Never Been as Profitable…
Sources: BEA, Moody’s Analytics
After-tax corporate profit margin, %

26
…And Have a Significant Energy Advantage
Sources: Country sources, Moody’s Analytics
Natural gas price, $ mmbtu
Industrial electricity prices, $ Mwh
U.S.
China
Italy
Korea
Japan
India
Germany
U.K.
France
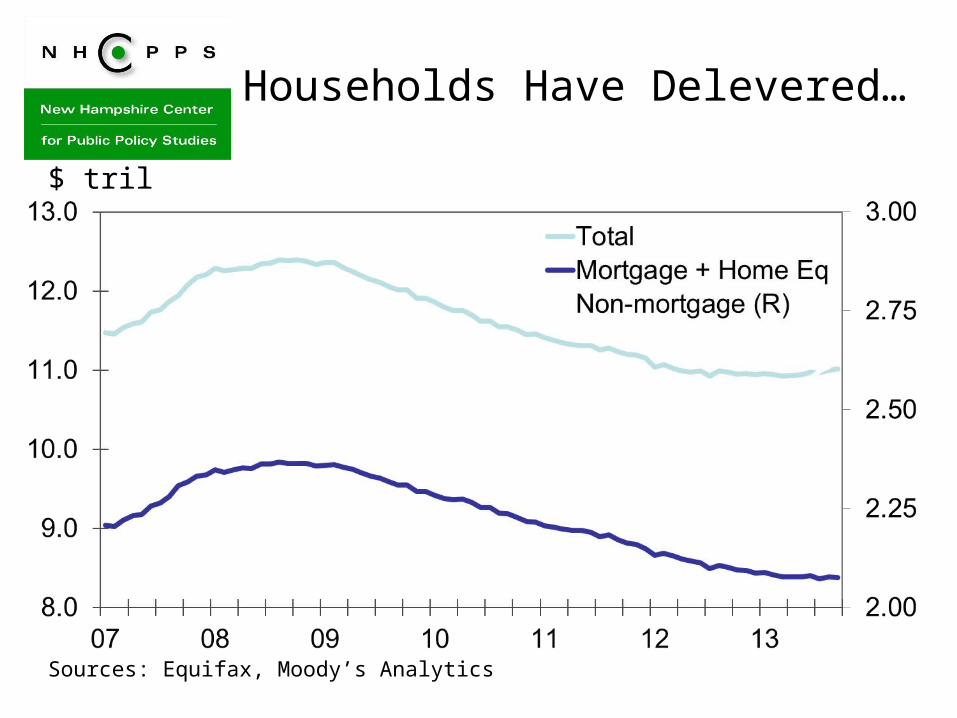
Households Have Delevered…
Sources: Equifax, Moody’s Analytics
$ tril

Sources: Census, Moody’s Analytics
Vacant homes for sale, for rent and held off market, ths
Housing Will Provide the Catalyst…
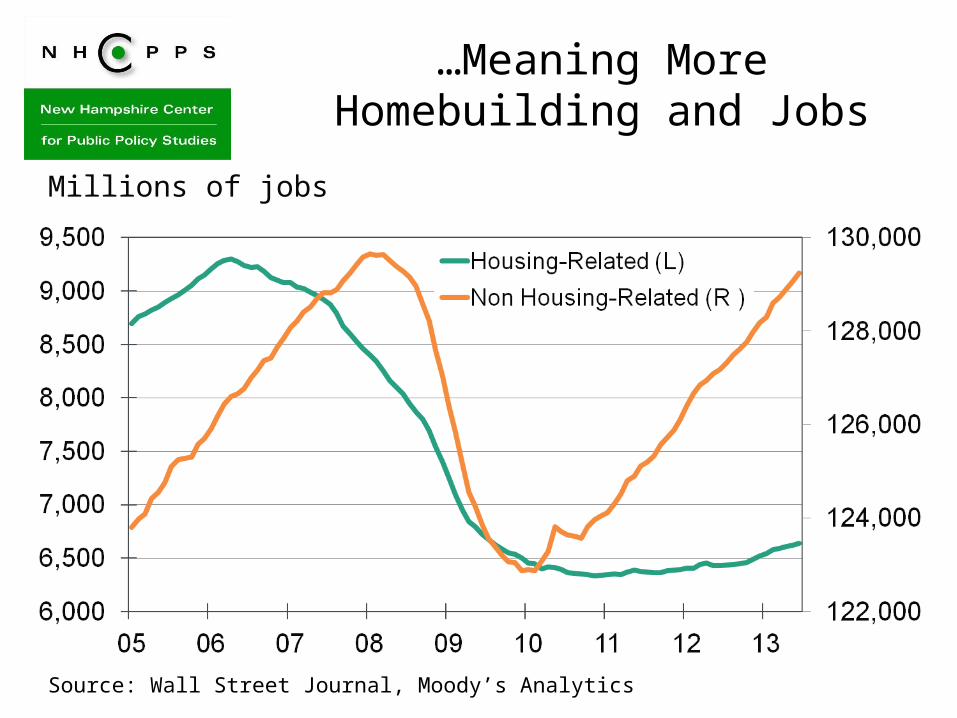
…Meaning More Homebuilding and Jobs
Source: Wall Street Journal, Moody’s Analytics
Millions of jobs

New Hampshire Center for New Hampshire Center for Public Policy StudiesPublic Policy Studies
Want to learn more?• Online: nhpolicy.org• Facebook: facebook.com/nhpolicy• Twitter: @nhpublicpolicy• Our blog: policyblognh.org• (603) 226-2500
“…to raise new ideas and improve policy debates through quality information and analysis on issues shaping New Hampshire’s future.”
30
Board of DirectorsJames Putnam, Chair
David Alukonis
Eric Herr
Dianne Mercier
Catherine A. Provencher
Todd I. Selig
Michael Whitney
Daniel Wolf
Martin L. Gross, Chair Emeritus
Directors Emeritus William H. Dunlap
Sheila T. Francoeur
Stuart V. Smith, Jr.
Donna Sytek
Brian F. Walsh

NH excels on “current climate” indicators
Area Indicator NH RankWFHousing Homeownership rates 2Regulatory Pollution Abatement / $ Value Added 3EdWorkFrc High School grad rate 4Cultural Voter turnout rate 4EdWorkFrc Pct of pop in Science & Engineering workforce 5EdWorkFrc Pct w/Associates+ 6EdWorkFrc Percent of children aged 3-4 in preschool 6Fiscal State Business Tax Climate Index 7Fiscal Public health/welfare spending per person in poverty 7GrowthReten Manufacturing Supercluster Concentration (LQ) 7
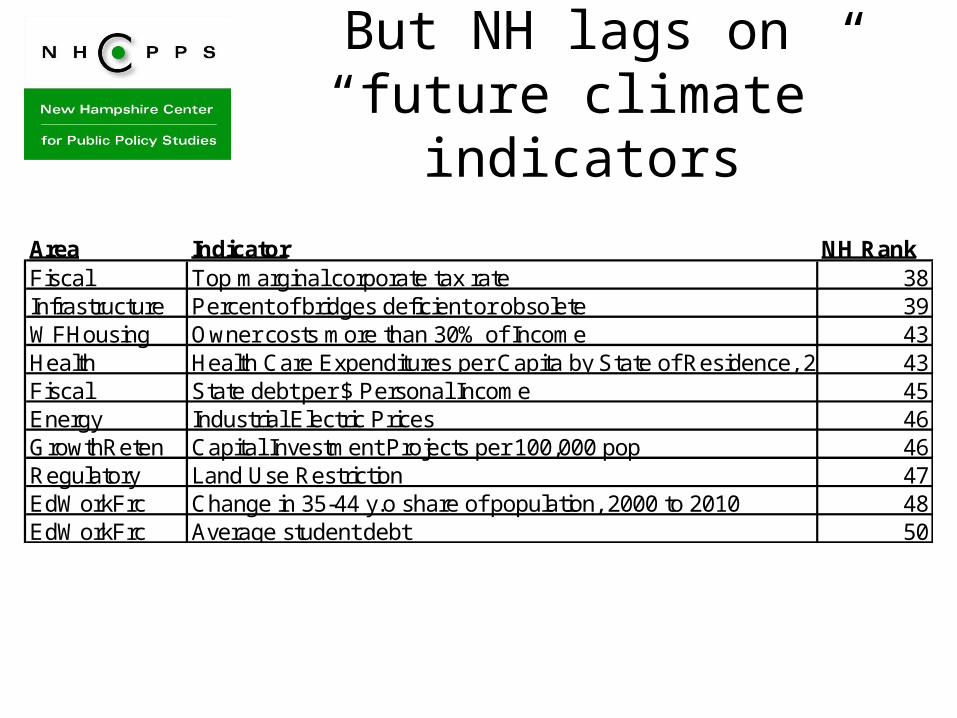
But NH lags on “future climate” indicators
Area Indicator NH RankFiscal Top marginal corporate tax rate 38Infrastructure Percent of bridges deficient or obsolete 39WFHousing Owner costs more than 30% of Income 43Health Health Care Expenditures per Capita by State of Residence, 2009 43Fiscal State debt per $ Personal Income 45Energy Industrial Electric Prices 46GrowthReten Capital Investment Projects per 100,000 pop 46Regulatory Land Use Restriction 47EdWorkFrc Change in 35-44 y.o share of population, 2000 to 2010 48EdWorkFrc Average student debt 50