Embed Size (px)
Citation preview
1
To what extent does the opinion and attitude on dogs, of employees who work in an office with a dog
influence their organizational commitment?
MSc major thesis research paper
Management studies, Facility Management
Wageningen University and Research Centre
Odette van Woensel
Final version
20 March 2019

2
MSc major thesis research paper
Student: O.C.J. van Woensel
Student number: 920320968060
Study: Animal Sciences
Specialization: Management Studies
Department: Facility Management
Course code: MST-80436
ECTS: 36
First supervisor: dr. H.B. Kok
Second supervisor: dr. G. van der Velde

3
Abstract
A growing trend regarding office welfare is allowing dogs in the office. Literature has proven many benefits regarding stress, interaction in the office environment and approachability of fellow employees. However, the link with employees and their organizational commitment has not been made yet. This study explored the relationship between employees who work at an office where a dog is present and their self-reported organizational commitment through the validated Organizational Commitment Questionnaire. Data was collected by setting out a questionnaire. The participants were acquired by posting a message on LinkedIn calling all companies who allow dogs in the office to participate. A total of 103 employees from 13 different companies filled out the questionnaire. In this questionnaire, control variables were included, the opinion of the employees on dogs was gathered and the Organizational Commitment Questionnaire was conducted. Multiple linear regression analysis was used to analyse the data. There were no significant influences on the Organizational Commitment Score of employees compared to their views on dogs in general and dogs in the office environment. This indicates that having dogs in the office does not affect the organizational commitment of employees. However, this indicates that it does not negatively influence employees organizational commitment even though almost thirteen percent indicated that they feel negatively towards having dogs in the office. This suggest that having dogs in the office environment could still be beneficial for companies when taking into consideration the benefits that other studies have found that come from allowing dogs in the office.
Keywords: allow dogs, office environment, employee, Organizational Commitment Questionnaire.

4
Management summary
It is a growing trend that companies are allowing their employees to bring their pets with them into the office. Research has shown that pets are perceived to improve the mood of employees and customers and increase social interaction (Perrine & Wells, 2006). When comparing work groups who either had a dog present or not, it was found that the behaviour of the groups with a dog present was more cooperative, comfortable, friendly, active, enthusiastic and attentive (Colarelli et al., 2017). A study within a university has shown that students perceived a professor and the office as more approachable when a dog was present, compared to when there was no animal or a cat present (Wells & Perrine, 2001)b. Another study was done with employees from one company where they measured the amount of salivary cortisol in employees who own a pet and non-pet owners. The amount of stress measured in the dog owners who had their dogs present at work during the day showed significantly less stress compared to the other groups. When the dog owners did not have their dog present during the day they displayed a similar pattern to the non-pet owners. (Barker et al., 2012) Employees were found to be more involved in the company and were more likely to stay with the company if that company allowed pets in the office. (Niven, 2007; McConnell et al., 2011; Barker et al., 2012; Hare & Woods, 2013) There appear to be many benefits to having dogs in the office environment. However, the influence of dogs in the office on organizational commitment is still unknown. Having employees with a high organizational commitment has many benefits (Stazyk et al., 2011). This study therefore explored the relationship between employees who work at an office where a dog is present and their organizational commitment. Literature research was conducted to investigate which validated manners existed for measuring organizational commitment. Organizational commitment has been defined as the strong emotional bond an employee has to the organization (Meyer and Allen, 1991). Organizations with committed employees have a higher performance and morale (Stazyk et al., 2011). Employees organizational commitment is also important for organizations because low or no commitment leads to employees that are more likely to skip work, come later or leave the workplace. Organizational commitment leads to a decrease in absenteeism and employee turnover (Atak, 2011). To test organizational commitment the validated Organizational Commitment Questionnaire (OCQ) by Mowday, Steers and Porter (1979) was used. The total questionnaire consisted of a general part and the OCQ. Control variables were included in the general part of the questionnaire. These social and demographic variables were included due to the influence they have on the answers given on the Organizational Commitment Questionnaire according to literature (Mathieu and Zajac, 1990; Jafari et al., 2015; Labrague et al., 2018). These variables were age, sex, education level, rank and work experience (Mathieu and Zajac, 1990; Jafari et al., 2015; Labrague et al., 2018). We were interested in what the opinion of employees, who work in an office environment with dogs, is on dogs in general, on dogs in the office environment, and whether the employees would allow dogs in the office if it was up to them. We were also interested in the interaction the employees have with the dog in the office because being close to a dog in the office has been proven to improve the stress level of employees (Barker et al., 2012). The OCQ is a questionnaire consisting of 15 items of which 6 were reverse scored to counter response bias. The 15 scale items give an indicator of employees commitment to their organization. (Mowday et al., 1979) A multiple linear regression was calculated and 10.3% of the variation was explained by the function of employees and the age of the employees. When the employees were higher in rank they had a higher self-reported organizational commitment score. The employees that had an age between 41 and 50 had a higher self-reported organizational commitment score. Unfortunately the opinion of employees on dogs in general, opinion on dogs in the office, whether they would allow a dog if it

5
were up to them and the interaction of the employees with the dog did not have any significant effect on the self-reported organizational commitment score of the employees. However, it was also found that although almost thirteen percent indicated that they do not like dogs in the office, they do work in an office environment where dogs are present. Thus there is a factor negatively influencing their work environment, which doesn’t affect their organizational commitment score. This suggest that having dogs in the office environment, looking at all the benefits from literature, could still be beneficial for companies. For companies I would recommend to look into allowing dogs in the office. Although this study has not found an effect of allowing dogs in the office on employees organizational commitment, literature has proven that allowing dogs in the office has many benefits on for example the amount of interaction between co-workers and the health and stress levels of employees. For future research it is recommended to continue on this research and compare the data with the organizational commitment of employees that work at similar companies who do not allow dogs into their office environment. On average the study population scored relatively high on the organizational commitment scale, however this mean score was set in 1979 (Mowday et al., 1979), which means that many developments have taken place in the office environment, and these changes could all influence the outcome of the OCQ.
6
Table of Contents Abstract ................................................................................................................................................... 3
Management summary ........................................................................................................................... 4
List of figures and tables.......................................................................................................................... 7
List of figures ....................................................................................................................................... 7
List of tables ........................................................................................................................................ 7
1. Introduction ......................................................................................................................................... 8
1.1 Background information ................................................................................................................ 8
1.2 Conceptual research design .......................................................................................................... 8
2. Literature study ................................................................................................................................. 11
2.1 Conceptual model ....................................................................................................................... 14
3. Method .............................................................................................................................................. 16
3.1 Introduction ................................................................................................................................. 16
3.2 Method of data collection ........................................................................................................... 16
3.3 Data analysis ............................................................................................................................... 17
3.4 Reliability and validity ................................................................................................................. 17
4. Results ............................................................................................................................................... 19
4.2 Descriptives ................................................................................................................................. 19
4.3 Multiple linear regression ........................................................................................................... 21
5. Discussion .......................................................................................................................................... 23
5.1 Control variables ......................................................................................................................... 23
5.2 Opinion and attitude of employees towards dog ....................................................................... 25
5.3 Interesting findings ...................................................................................................................... 26
5.4 Limitations of the study ............................................................................................................... 26
6. Conclusion and recommendations .................................................................................................... 28
Acknowledgement ................................................................................................................................. 29
References ............................................................................................................................................. 30
Appendix I English questionnaire .......................................................................................................... 34
Appendix II Dutch Questionnaire .......................................................................................................... 41
Appendix III Messages ........................................................................................................................... 48
Appendix IV Data output Organizational Commitment Questionnaire ................................................ 50

7
List of figures and tables
List of figures
Figure 1. Research framework .............................................................................................................. 10
Figure 2. Conceptual framework ........................................................................................................... 15
Figure 3. LinkedIn message ................................................................................................................... 48
List of tables
Table 1. Overview participating companies .......................................................................................... 19
Table 2. Descriptives.............................................................................................................................. 20
Table 3. Correlations opinion questions.............................................................................................. 221
Table 4. Results multiple regression analysis ............................................ Error! Bookmark not defined.
Table 5. Data respondents Organizational Commitment Questionnaire .............................................. 52

8
1. Introduction
1.1 Background information
It is a growing trend that companies are allowing their employees to bring their pets with them into the office (Wells & Perrine, 2001; Barker et al., 2012). Research has shown that pets are perceived to improve the mood of employees and customers and increase social interaction (Perrine & Wells, 2006). When comparing work groups who either had a dog present or not, it was found that the behaviour of the groups with a dog present were more cooperative, comfortable, friendly, active, enthusiastic and attentive (Colarelli et al., 2017). A study within a university has shown that students perceived a professor and the office as more approachable when a dog was present, compared to when there was no dog present (Wells & Perrine, 2001)b. Another study was done with employees from one company where they measured the amount of salivary cortisol in employees who own a pet and non-pet owners. Dog owners who had their dogs present at work during the day showed significantly lower stress levels compared to the other groups. When the dog owners did not have their dog present during the day they displayed a similar pattern of the non-pet owners (Barker et al., 2012). Employees were found to be more involved in the company and were more likely to stay with the company if that company allowed pets in the office (Niven, 2007; McConnell et al., 2011; Barker et al., 2012; Hare & Woods, 2013). Researchers have indicated in their recommendations that it might be interesting to study what the impact is of having dogs into the office on a variety of factors, such as employee morale, employee productivity, employee well-being, employee attitude, employee mood and performance (Foreman et al., 2017). All these studies indicate that there is still more to investigate regarding the effects of having dogs in the office on the employees. The effect of having dogs in the office on the organizational commitment of employees has not been researched yet. It could be beneficial for companies to have an answer because organizations with committed employees have a higher performance and morale (Stazyk et al., 2011). Employees’ organizational commitment is also important for organizations because low or no commitment leads to employees that are more likely to skip work, come later or leave the workplace. Organizational commitment leads to a decrease in absenteeism and employee turnover (Atak, 2011). Organizational commitment has been defined as the strong emotional bond an employee has to the organization Meyer and Allen (1991). To summarize, the relationship between having dogs in the office and the effect those dogs have on the organizational commitment is still unknown. This research aims to give more insight and inspire more research regarding this specific field.
1.2 Conceptual research design
This chapter includes the problem statement, the objective of the research, the main research question and the sub-research questions and the research framework. Problem statement Managers have to make a deliberate decision regarding whether they allow their employees to bring their dogs to the office. Many things have to be taken into consideration. Especially regarding the employees who don’t like dogs in the office environment. Now, managers have to make a gut feeling decision on whether allowing the dog will influence the dog-disliking employees in such a manner that their commitment to the organization will decrease. This decrease could for instance result in the dog-disliking employees to work less hard or even find another job. This research will check if

9
there is a difference in the employees reported organizational commitment and their opinion on dogs in general, in the office and being employed at an organization that allows dogs in the office. This may help management to make more informed decisions on having dogs in the office environment. Objective The aim of this study is to find out whether the opinion of office employees regarding dogs in the office influences their organizational commitment to their company that allows dogs in the office. This will allow companies to make more informed decisions regarding their dog related office policies. The main research question is formulated as follows: “To what extent does the opinion and attitude on dogs, of employees who work in an office with a dog influence their organizational commitment?” In order to answer the main research question, five sub-research questions were composed. First, it was important to do research about organizational commitment. When the theory on organizational commitment was clear, empirical questions could be formed regarding the results. Theoretical sub-research questions 1. How can organizational commitment be defined and measured? 2. Which factors influence the organizational commitment of employees? Empirical sub-research questions 3. Do the factors influence the organizational commitment expressed by the employees in accordance with the factors from validated literature? 4. To what extent does the opinion of employees that work in an office environment where a dog is present, influence their self-reported organizational commitment? 5. Does the amount of interaction the employees have with the dog, have an effect on their self-reported organizational commitment within a company that allows dogs? Research framework The research framework is presented in Figure 1. The first step is to acquire information from literature and previous studies done on dogs in the office. The survey will be composed. A field study will be done where a company will ask their employees to fill out the survey. Afterwards the quantitative data that follows from this field research will be analysed using regression analysis using IBM SPSS Statistics 23. Then, the answer to the main research question will be formulated as a conclusion to the study.

10
Figure 1. Research framework

11
2. Literature study
2.1 Introduction First organizational commitment was explained. Then the Organizational Commitment Questionnaire was addressed. Then the theory about dogs in the office and dogs in general was explored. Lastly, the conceptual model was addressed. 2.2 Organizational commitment Organizational commitment has been defined as the strong emotional bond an employee has to the organization, according to Meyer and Allen (1991). Assessing employees organizational commitment has been well documented as is its importance of measuring it (Mowday et al., 1979; Meyer and Allen, 1997; Barker et al, 2012). Organizational commitment is built up by a number of factors. It is related to the employees belief in the values and goals of the organization they work for, but also the amount of effort the employee is willing to go through for the company and their attitude towards it. It is also highly related to the desire an employee feels to remain with their current company. (Trofimov et al., 2016) Luthans and colleagues (1985) framed it that an employee that is highly committed to an organization has the intention of staying employed at this company and will work hard towards the goals of the company. Dick and Metcalfe (2001) specified it even further indicating that organizational commitment can be seen as the degree to which employees identify with not only the goals of the organization but also the managers. This also encompasses how much willingness they display to invest in the company, to what degree they make an effort, the manner in which they participate in decision making and lastly the internalisation of managerial values (Dick and Melcalfe, 2001). According to Meyer and Allen’s (1991), organizational commitment can be classified into three dimensions. They are affective commitment, continuance and normative commitment. Affective commitment describes the emotional connection the employee has to the organization. Continuance describes the costs the employee perceives if they were to exit the organization. Normative commitment describes the moral obligation the employee feels to stay in the organization. (Meyers and Allen., 1991) Employees organizational commitment is also important for organizations because low or no commitment leads to employees that are more likely to skip work, come later or leave the workplace. Organizational commitment leads to a decrease in absenteeism and employee turnover. (Atak, 2011) Organizational commitment plays an important role in retention of employees. 2.3 Organizational commitment questionnaire Two widely used tools to assess organizational commitment are the Organizational Commitment Questionnaire (Mowday et al., 1979) and the Three-Component Organizational Commitment Scale (Meyer and Allen, 1991). (Starnes and Truhon, 2006) The Organizational Commitment Questionnaire by Mowday and colleagues is validated and consists of 15 items. The 15 scale items give an indicator of employees commitment to their organization. (Mowday et al., 1979) The Organizational Commitment Questionnaire was used by Rentsch and Steel (1992) to check for correlations on job satisfaction compared to organizational commitment. The Organizational Commitment Questionnaire was used by Porter et al. (1974) among 60 employees to test if there was a significant relationship between attitudes and turnover. Organizational commitment indicated stayers and leavers better than measuring job satisfaction did. Luthans et al. (1985) used the Organizational Commitment Questionnaire (OCQ) to test whether the level of commitment to the employing company varied between American, Japanese and Korean employees. The employees from the U.S. scored on average 3.61, the employees from Japan scored 3.21 and the Korean employees scored 3.29, indicating there are differences between different nationalities as they found that nationality accounted for 7 percent in the variance.

12
When looking at the article published by Mowday, Steers and Porter (1979), an average mean can be deducted from their results. They report the mean scores of their Organizational Commitment Questionnaire that was conducted among 2,563 employees working in nine different organizations with a wide variety of jobs. The reported mean score ranged from 4.0 (low) to 6.1 (high). They indicated that the mean scores are typically slightly above the midpoint of the 7-point Likert scale which is 4.0. (Mowday et al., 1979) When using the Organizational Commitment Questionnaire, it was found that social and demographic variables can influence the reported organizational commitment score (Mathieu and Zajac, 1990; Jafari et al., 2015; Labrague et al., 2018). These variables are age, gender, education level, rank and work experience (Mathieu and Zajac, 1990; Jafari et al., 2015; Labrague et al., 2018). Mathieu and Zajac (1990) analysed previous studies regarding organizational commitment. They found that age is positively correlated to organizational commitment, indicating that the older the individual the higher their commitment. This is also what they hypothesized due to the assumption that employees that are older and have worked for an organization longer have invested more and are thus higher committed to the organization. They did indicate that the employees would also need to be satisfied by the pay they receive and the received promotional chances. (Mathieu and Zajac, 1990) Jafari and his colleagues (2015) researched the organizational commitment of nurses working at the intensive care in a hospital in Iran. They found that age and work experience had a significant effect on the commitment of the nurses. Nurses that were over the age of forty had a higher organizational commitment as did nurses with high levels of work experience. All the other age categories had no significant effect. The authors did not elaborate on the possible reason behind their results. (Jafari et al., 2015) Labrague and his colleagues (2018) researched the organizational commitment of 166 nurses in the Philippines. They found an increase in organizational commitment regarding the rank, gender, academic degree, age and work experience. Females with a master’s degree that were over the age of 40 and had more than five years of work experience also had a significantly higher organizational commitment. They hypothesized that due to the commitment the nursing profession requires, females might have more commitment to their career as nurses due to the fact that life-long commitment and dedication are more female trades than male trades. The researchers hypothesized that younger nurses might not have invested much emotionally in their job, they also get lower pay and high workload and that this could result in lower commitment levels. Nurses with a lower education level had a lower commitment and this could again be due to lower pay and less career opportunities. Nurses that held a higher position such as a managerial position had a higher commitment. This study was conducted in the Philippines and the researchers stated that nurses that have a higher position also have more benefits that have been known to increase a person’s organizational commitment. These benefits are higher pay, better career opportunities and involvement in decision making. (Labrague et al., 2018) Kumari and Priya (2017) also found that organizational commitment was higher in the top level managers compared to the middle and lower level managers. A study conducted among 2,031 employees of social service departments in the UK also found that the higher the level of management was, the higher their commitment was (McLean and Andrew, 1999). Not all researchers found the same influencing demographics. For example, Mathieu and Zajac (1990) didn’t find a significant effect of the gender of participants and Jafari and his colleagues (2015) did find a significant effect. There are many other factors that can influence the organizational commitment of employees. These are job related characteristics such as work experience (Jafari et al., 2015). Other factors were challenge, job scope and leader communication to name a few (Dey et al., 2014). Mathieu (1991) found that a strong effect on commitment was caused by general satisfaction. Hotel managers (N=62) who had indicated they were dissatisfied with their salary also

13
had a lower commitment score of 3.34 compared to 3.84 (Maxwell and Steele, 2003). Stress was also found to be of influence of the commitment of employees according to McLean and Andrew (1999). Dogs and commitment It is a growing trend that companies are allowing their employees to bring their dogs with them into the office as stated by Wells and Perrine (2001) and Barker and colleagues (2012). In 2015 a survey was conducted and they found that eight percent of the respondents were allowed to bring their dogs to work, compared to five percent in 2013 (Foreman et al., 2017). Different researchers suggested that it might be interesting to research what the impact is of having dogs in the office on a variety of factors, such as employee morale, employee productivity, employee well-being, employee attitude, the mood of the employee and performance (Foreman et al., 2017). In 2012, Barker and colleagues had a group of 75 employees and they looked among other things at the perceived productivity of the employees and the affective commitment of the employees when taking into account that a dog was present at the office. The employees were divided into three groups. Group one owned a dog and brought it to work, group two owned a dog but did not bring it to work and the participants of group three did not own a dog and thus did not bring it to work. One of the things they researched was whether bringing/having a dog in the workplace affected employee productivity. They found that none of the participants in group one (own and bring a dog) rated having a dog in the office had a negative influence on their productivity. However of groups two and three, at least 21 percent reported that a dog in the office influenced their productivity in a negative manner. (Barker et al., 2012) This perceived impression of the employees of dog presence on the productivity didn’t take the opinion of the employees into account, they only compared dog ownership and presence of dog with a dog owner. Barker and colleagues (2012) also researched the affective commitment of the participants to the company using the method by Allen and Meyer (1991). They didn’t find any significant differences between the three groups (own and bring dog, own and not bring dog and no dog). Allowing dogs Global companies such as Google and Amazon allow their employees to bring their dogs to the office because they believe that allowing dogs in the office brings benefits to its employees (Foreman et al., 2017). Mars is one of the companies that allows their employees to bring their pets to the office. With the help of Banfield pet Hospital a Pet friendly workplace PAWrometer was developed. This encases a survey that was filled out by employees and specifically human resource employees to find out what the perception is of these employees of pets in the office. This was done with a total of 1,006 employees from both pet-friendly and non-pet-friendly workplaces all located in the United States. The following reasons for allowing pets in their offices were determined: greater scheduling flexibility and a clearer conscience, a decrease in stress levels for both human and pet, no restriction in people to hire from, less employees being absent, an increase in productivity, a higher collaborating working atmosphere and they found it was beneficial for pets to come to the office with their owner. (Banfield Pet Hospital, 2016) According to their website, Purina from Nestlé allows pets into the office since 2003 in all their offices in Europe. They also investigated within other companies in Europe that allow pets into the office what the benefits are of allowing pets in the office and they surveyed thousands of pet lovers on their opinion. They found that employees performed better and had an increased productivity, were more involved, were more likely to stay with the company, had better welfare and reduced stress. They even found that people found pets inspiring. (2012; Niven, 2007; McConnell et al., 2011; Barker et al., 2012; Hare & Woods, 2013) Dogs in the office Previous research has shown that pets are perceived to improve the mood of employees and customers and increase social interaction. However, the office was viewed as less professional, safe

14
and clean. It was also found that there were few differences in how the participants viewed the different breeds of dogs and cats. (Perrine & Wells, 2006) From thirty one company’s 193 employees completed a questionnaire. The results showed that having pets in the office reduced stress and affected the health of the employees and the organisation positively. The study also indicated that employees who brought their pet to work experienced higher benefits than those who did not bring their pets or owned pets. (Wells & Perrine, 2001a) Research that compared work groups that either had a dog present or not, found that the behaviour of the groups with a dog present was more cooperative, comfortable, friendly, active, enthusiastic and attentive (Colarelli et al., 2017). This indicates a positive influence of dogs on groups. According to Foreman and colleagues (2017), more studies have found this social aspect when testing an individual with a dog that person had more social encounters with strangers. Other research showed that the obstacles people experienced when a dog as present in the office were the suitability of the office space and people expressed health and safety concerns (Hall et al., 2017). A study within a university has shown that students (N=257) perceived a professor and the office as more approachable when a dog was present, compared to when there was no animal or a cat present (Wells & Perrine, 2001)b. This finding could also be applicable in the office environment and would align with what Colarelli and his colleagues found (2017). Another study was done with employees from one company where they measured the amount of salivary cortisol in employees who own a pet and non-pet owners. The amount of stress measured in the dog owners who had their dogs present at work during the day showed significantly less stress compared to the other groups. When the dog owners did not have their dog present during the day they displayed a similar pattern to the non-pet owners. (Barker et al., 2012) This shows that when an employee has their own dog present in the office, it significantly reduces the amount of stress they experience both self-reported and on a hormonal level. A study found that employees were found to be more involved in the company and were more likely to stay with the company if that company allowed pets in the office. (Niven, 2007; McConnell et al., 2011; Barker et al., 2012; Hare & Woods, 2013) This shows that there are many benefits to having dogs in the office environment. Reasons to disallow dogs For some companies it would be unwise to allow employees to bring a pet to work. Construction or other companies with a dangerous or a loud environment could end up giving the animals more stress and put them at risk of getting injured. Other companies that deal in food and medicine have safety concerns and have therefore more to consider than companies that don’t. Despite many advantages found in literature about allowing dogs in the office, researchers have found negative aspects on the matter. An office environment was viewed as less professional, safe and clean when a pet was present. They checked for differences between breeds and dog versus cat differences and found that there were few differences in how the participants viewed the different breeds of dogs and cats. (Perrine & Wells, 2006) Research showed that the obstacles people experienced when a dog was present in the office were the suitability of the office space and people expressed health and safety concerns (Hall et al., 2017). According to the Dutch law, companies are required to enable a healthy office environment (Hogervorst, 1999). This means that as soon as someone is allergic, a dog can no longer be permitted to come into the office. Some people don’t like pets, are afraid of them or have religious or cultural objections (Barker, 2005). When the boss or someone from management has one of these objections, than those companies are less likely to adopt a dog friendly office environment. Some companies rent their office space and when the landlord doesn’t allow dogs on the perimeter than there is no option for dogs to come to the workplace.
2.1 Conceptual model
Based on the theoretical framework, figure 2 displays the conceptual framework. It shows the possible relations between Organizational Commitment the influencing factors from literature and the opinion of employees. Literature has indicated that individual aspects such as age, gender,

15
education level, rank and work experience can influence the outcome of the Organization Commitment Questionnaire (Mathieu and Zajac, 1990; Jafari et al., 2015; Labrague et al., 2018).
Figure 2. Conceptual framework

16
3. Method
This chapter will address the methodology of the study. The following topics will be discussed: the design of the study, the method of data collection, the data analysis and the reliability and validity of the study.
3.1 Introduction
For this research a quantitative research design was chosen. According to Sahu (2013, p.8) this type of research is most suited for exploring causal relationships between variables. This research is descriptive in nature due to the fact that probable causes of an effect are being researched (Sahu, 2013, p.7). Population, sampling technique and sample size The study’s respondents consisted of people working in an office environment where a dog was allowed and present at least once a week. The sampling strategy was to set out a message on LinkedIn(c) (see Appendix III for the message as posted and the personal message people received when expressing interest) and used the researchers own network to acquire as many respondents as possible. This is a small representation of the total study population. Due to its size it is also not a representable part of the population. Also, only the part of the population that is willing to participate in such studies are part of the respondents. These could also be more easy going people and this in turn could have an effect on the outcome. However, this method was chosen due to the difficulty of reaching this particular population. There is no registry with a list of companies that allow dogs in their offices therefore it was needed to reach this population by expanding the network and using acquaintances of other acquaintances. The message was viewed by over 14,000 people.
3.2 Method of data collection
A questionnaire is a useful tool for acquiring people’s opinions and attitudes which is data that is not available from published sources (McLafferty, 2003). The questionnaire was structured so the order was made logical for respondents and it was non disguised, meaning that the objective of the question was clear to the respondents and did not test an ulterior motive (Sahu, 2013). For this research the Organizational Commitment Questionnaire (OCQ) by Mowday, Steers and Porter (1979) was used. This because we are interested in one OCQ score and not on three different levels of organizational commitment as the questionnaire by Allen and Meyers (1991) provides three scales of commitment. Organizational commitment was measured using the validated Organizational Commitment Questionnaire (Mowday et al., 1979). The Organizational Commitment Questionnaire consists of 15 questions that are based on a 7-point Likert scale ranging from (1) strongly disagree; (2) moderately disagree; (3) slightly disagree; 4) neither disagree nor agree; (5) slightly agree; (6) moderately agree; (7) strongly agree. Nine questions are normally formatted and six questions are inversely related. The 15 items are scored and added up, this score is then divided by 15 to provide an overall commitment score. (Bearden and Netemeyer, 1999, Mowday et al., 1979) The questionnaire was provided to participants in both an English and a Dutch version since all but one of the participating companies were companies located in the Netherlands. The one company that participated that was not located in the Netherlands was from Belgium. Both full questionnaires are included in Appendices I and II. The questionnaire consisted of a general part and the Organizational Commitment Questionnaire (Mowday et al., 1979).

17
Control variables were included in the general part of the questionnaire. These social and demographic variables were included due to the influence they can have on the answers given on the Organizational Commitment score. These variables were age, gender, education level, rank and work experience (Mathieu and Zajac, 1990; Jafari et al., 2015; Labrague et al., 2018). Age can be a sensitive topic therefore respondents are more likely to answer truthfully when the answering options are categorized broadly instead of a specific number (McLafferty, 2003). Therefore, these aspects will be included in the questionnaire and checked against the employees scores of the Organization Commitment Questionnaire. Finally the employees opinions towards dogs will be tested against the answers of the OCQ. This will be done by checking their opinion of dogs in general, dogs in the office, whether they would allow dogs in the office and if they interact with the dog that is present in the office. The question on whether the employee would allow dogs in the office if the choice was theirs was included because people might not like dogs in the office personally, but they might see advantages why they would not necessarily disallow dogs even if they dislike dogs. For example, they might see an improvement in the office mood as Colarelli et al. (2017) found. The question about the interaction with the dog is to see whether actual contact with the office dog influences the organizational commitment score.
3.3 Data analysis
Afterwards the quantitative data that followed from this field research was analysed using a multiple regression analysis using IBM SPSS Statistics 23. Multiple regression analysis is suited for analysing the relationship and determine whether an independent variable influences a dependent variable (Sahu, 2013, p. 125). In the conceptual framework that was discussed in chapter 2 the relations between different variables that will be checked can be viewed. Multiple regression analysis was also used by Porter and colleagues (1974) to determine if for example age explained a significant amount of their organizational commitment scores. Dummy variables were used to utilize the information in a category. This enabled the use of this information in a standard regression. (Hardy, 1993) The first category of the variables was used as the dummy variable. Cronbach alpha was used to test the reliability and internal consistency of the Organizational Commitment Questionnaire (Tavakol and Dennick, 2011).
3.4 Reliability and validity
The replicability is not high. The data is measured in a specific moment in time. Small events in the office environment could influence employees level of organizational commitment. However these events should not cause employees to suddenly change their commitment to their organization. It is something that develops consistently over time (Mowday et al., 1979). The opinion of the office workers could change due to a negative experience with a dog. However, if the Cronbach’s Alpha is high this could indicate high reliability (Tavakol and Dennick, 2011). Therefore the replicability could be influenced by a number of factors resulting in a medium/high reliability. The internal validity describes the relationship between variables and with how much confidence these relationships can be explained (Ferguson, 2004). Because this research only focuses on the dog aspect of the organization a lot of other factors that can influence employees organizational commitment such as employee engagement (Hanaysha, 2016) and for example rewards both financial and non-financial (Khaliq et al., 2016) are not taken into account.

18
External validity refers to the generalizability of the data and of the observed effects (Ferguson, 2004) The external validity of this research is high. The aimed sample size will be at least 100 responses which is higher than 30. Therefore the information applies to the central limit theorem therefore the generalization of the results is not restricted. (Sahu, 2013, p.26)

19
4. Results
In this chapter the results of the questionnaire that was filled out by 103 office workers will be addressed. First some background information is provided about the questionnaire, then an overview of the output is provided, than the results of the regression analysis are presented in two parts. First the general part is checked for variance that explains the reported organization commitment. Then the opinion questions are checked for variance that explains the reported organizational commitment. 4.1 Response analysis In total 105 employees filled out the questionnaire. However, two respondents were excluded for not filling out the complete Organizational Commitment Questionnaire. So, the useful data consisted of 103 respondents. Employees from fourteen companies have participated in the questionnaire as shown in table 1. Both RMMBR and Elephant Road and both Bespeak and Visavi were grouped together due to the fact that their offices are on the same address. Both managers and regular employees were requested to participate in filling out the questionnaire.
Company Sector N (103) %
Bespeak/ Visavi E-learning 12 11.7% Corion Management consulting 11 10.7% RMMBR/Elephant Road E-learning 14 13.6% LifeTec Group Medical equipment 8 7.8% Mars Confectionery 1 1.0% Google Internet 1 1.0% Stratego Human resource 4 3.9% Picnic Supermarket 1 1.0% Youwe Internet 13 12.6% InBrain E-learning 15 14.6% Celsius Benelux B.V. Industrial automation 1 1.0% Humanagement Facility management 13 12.6% Fonkel Strategic communication agency 9 8.7%
Table 1. Overview participating companies
4.2 Descriptives
The total response of the participants per question can be viewed in the first column of table 2 behind the description of the question. For the full questions that the participants got, see Appendices I and II. The data of question “15 Interaction” was later combined. Employees could fill out in which manner they interacted with the dog present in the office. However it was only interesting to check whether they interacted with the dog at all. Thus the response was changed and all responses from respondents who filled in a specific type of interaction such as “I pet the dog” were changed to “interaction”, as an interaction took place. The responses of the respondents who filled in they do not interact with the dog present in the office in any manner whatsoever, remained unchanged. These two new options were compared. Organizational Commitment Questionnaire. The Organizational Commitment Questionnaire has been checked for Cronbach’s Alpha which tests if multiple items can form one scale. The Cronbach’s Alpha was 0.909 indicating α ≥ 0.90. This means that the internal consistency between the items has a reliable scale. The OCQ was filled in by all 103 participants with a mean of 5.36 on a 7-point Likert scale and a standard deviation of 0.90. In

20
Appendix IV the overview of the outcome of the Organizational Commitment Questionnaire can be viewed in table 4. In table 2 an overview is given about the general part of the questionnaire. The factors that are included are factors that were of interest for the study (e.g. “How do you feel about dogs in the office?”) or factors that have been proven by literature to influence the outcome of the Organizational Commitment Questionnaire (e.g. “How old are you?”). These variables were age, gender, education, rank and work experience (Mathieu and Zajac, 1990; Jafari et al., 2015; Labrague et al., 2018).
Question (total response) Options # response % response
2. Function (103) Employee Manager
81 22
78.6% 21.4%
3. Duration of employment (103) Less than 1 year 1 - 5 yrs 6 - 10 yrs 11 - 20 yrs More than 20 yrs
20 65 14 3 1
19.4% 63.1% 13.6% 2.9% 1.0%
6. Education level (102) Non high school graduate High school graduate Bachelor's degree Master's degree Doctoral degree
1 14 43 39 5
1.0% 13.7% 42.2% 38.2% 4.9%
7. Age (103) Less than 20 yrs 20 - 25 yrs 26 - 30 yrs 31 - 40 yrs 41 - 50 yrs 51 - 60 yrs More than 60 yrs
0 13 31 33 21 3 2
0% 12.6% 30.1% 32.0% 20.4% 2.9% 1.9%
8. Gender (102) Female Male
52 50
51.0% 49.0%
12. Dogs in general (103) Strongly dislike Dislike Somewhat dislike Neither like or dislike Somewhat like Like Strongly like
3 0 8 7 21 34 30
2.9% 0% 7.8% 6.8% 20.4% 33.0% 29.1%
13. Dogs in the office (103) Strongly dislike Dislike Somewhat dislike Neither like or dislike Somewhat like Like Strongly like
2 4 7 7 15 30 38
1.9% 3.9% 6.8% 6.8% 14.6% 29.1% 36.9%
15. Interaction (102) No Yes
10 92
9.8% 90.2%
16. Allow dog (103) Yes No Maybe
73 10 20
70.9% 9.7% 19.4%
Table 2. Descriptives

21
From table 2 it can be viewed that the gender division is equal, 21 percent is a manager and most respondents have been working at their company for 1 to 5 years. In table 2 an overview of the opinion questions is also given. Eleven of all respondents indicated that they feel negative towards dogs in general. Thirteen of all respondents indicated that they feel negatively towards dogs in the office. Interestingly only nine of those participants would actually disallow dogs in the office. One who slightly liked dogs would also disallow dogs if it were up the them and twenty participants were uncertain of what their decision would be.
4.3 Multiple linear regression
First the correlation between two variables was checked due to possible similarity. Then, the multiple regression analysis was run and the full model was checked. 4.3.1 Correlation The correlation between the two variables concerning participants opinions on dogs in general and on dogs in the office were checked. Due to the fact that they are below 0.7 (see table 3) they were not tested separately in the multiple regression analysis.
Opinion dog in general Opinion dog in office
12. Opinion dog in general .577** 13. Opinion dog in office .577**
Table 3. Correlations opinion questions (** Correlation is significant at the 0.01 level (2-tailed))
4.3.2 Multiple regression analysis
The full model was run including all the variables from table 2. The model had a significance of 0.076 (with F=1.602) which is below α = 0.10 indicating it generated significant results indicating a ten percent probability that the results are up to chance. It had an R² of 27.3% and an adjusted R² of 10.3%. This indicates that ten percent of the variation is explained by this regression analysis. This means that there a many other variables that influence the amount of organizational commitment the participants reported. In table 3 the model can be viewed. It can be seen in table 3 that three significant effects were found on the self-reported organization commitment of the participants. These effects were found in the control variables in the function of the employees, the number of years they have been employed and the age category they fall in. There were no significant effects found for the variables of interest, so neither the opinion of the employees on dogs in general or in the office, on whether they would allow dogs and if they interacted with the dog had any significant effect. The function of the employees is of influence on the self-reported organizational commitment. Employees with a manager’s position have a higher self-reported organizational commitment compared to the regular employees. Their self-reported commitment increases with 0.421 when they have a manager’s position. Employees that have been employed between 6 to 10 years have a lower self-reported organizational commitment. Their commitment decreases with 0.645 so they experience a real dip in their organizational commitment. Employees that are between the ages of 41 and 50 had a higher self-reported organizational commitment. Their self-reported organizational commitment increases with 0.755 which is the biggest influencing effect found in this study.

22
Variables B Sig.
Constant 5.527 0 Function 0.421 0.085 Years employed: 1- 5
Years employed: 6 -10 -0.645 0.06 Years employed: 11 - 20
Years employed: longer than 20
Education level: higher education
Education level: bachelor’s degree
Education level: master’s degree
Education level: doctoral degree
Age: 26 – 30
Age: 31 – 40
Age: 41 – 50 0.755 0.037 Age: 51 – 60
Age: older than 60
Gender
Allow dog
Opinion dog in general
Opinion dog in the office
Interaction
Table 4. Results multiple regression analysis
The R square change was reviewed for the three variables, Function, Years employed 6 – 10 and Age 41 – 50, that gave a significant effect on the self-reported organizational commitment score of the participants. Three models were made: a. Function b. Function, Years employed 6 – 10 c. Function, Years employed 6 – 10, Age 41 – 50 When comparing the three models it was found that the first model and the third model had a significant F change and the second model did not. Model a. had a F change of 0.001, model b. had a F change of 0.145 and model c. had a F change of 0.010. When viewing the standardized Beta coefficients of model c. the Beta of Function was 0.276 and the Beta of Age 41 – 50 was 0.247. Years employed 6 – 10 was not found significant.

23
5. Discussion
The primary purpose of this research was to check whether the opinion and attitude of employees who work in an office with a dog would influence employees organizational commitment score. No significant effect was found, so the opinion and attitude of employees who work in an office environment with dogs, did not affect employees organizational commitment. There were however two control variables that influenced the self-reported organizational commitment score of the participants. These were the function of employees and the age of the employees. These results will firstly be addressed. Then the possible reasons of not finding a significant effect on the opinion and attitude will be discussed. After that other interesting findings will be addressed. Lastly the limitations of the study will be addressed.
5.1 Control variables
An alpha of 0.10 was used and a significant effect was found on the self-reported organizational commitment the participants reported. A multiple linear regression was calculated and 10.3% of the variation was explained by the function of employees, the duration of their employment and the age of the employees. When the employees were higher in rank they had a higher self-reported organizational commitment score. The group that had an employment duration of 6 to 10 years had a decrease in their self-reported commitment. The employees that had an age between 41 and 50 had a higher self-reported organizational commitment score. Unfortunately the opinion of employees on dogs in general, opinion on dogs in the office, whether they would allow a dog if it were up to them and the interaction of the employees with the dog did not have any significant effect. 5.1.1 Function The function the employees had within the company had a significant influence on the self-reported organizational commitment score of the participants. The employees who had a managers function had a higher commitment to their company than the regular employees. A study conducted among 2,031 employees of social service departments in the UK also found that the higher the level of management was, the higher their commitment was (McLean and Andrew, 1999) A study amongst nurses in the Philippines found that nurses that held a higher position such as a managerial position had a higher commitment. This study was conducted in the Philippines and the researchers stated that nurses that have a higher position also have more benefits that have been known to increase a person’s organizational commitment. These benefits are higher pay, better career opportunities and involvement in decision making. (Labrague et al., 2018) Kumari and Priya (2017) also found that organizational commitment was higher in the top level managers compared to the middle and lower level managers. This is fairly logical that as a manager you have a higher commitment because there are more responsibilities. 5.1.2 Age In the current study the employees that had an age between 41 and 50 had a higher self-reported organizational commitment score. Similar results were acquired when testing nurses. Jafari and colleagues (2015) questioned nurses that worked in a hospital in Iran on the intensive care and they found that nurses that were over the age of forty had a higher organizational commitment. Labrague and his colleagues (2018) researched the organizational commitment of 166 nurses in the Philippines and found the same results namely that nurses over the age of 40 had a significantly higher organizational commitment. The researchers hypothesized that younger nurses might not have invested much emotionally in their job, they also get lower pay and high workload and that this could result in lower commitment levels. Mathieu and Zajac (1990) analysed previous studies regarding organizational commitment. They found that age is positively correlated to organizational

24
commitment, indicating that the older the individual the higher their commitment. This is also what they hypothesized due to the assumption that employees that are older and have worked for an organization longer have invested more and are thus are higher committed to the organization. Interestingly the two oldest age group in the current study did not have a significant effect (age 51 – 60 and older than 60), while other studies reported that all ages above 40 had a significant effect. It could be that they would have found this effect if they had split their age categories even further. Labrague and colleagues (2018) only specified three categories and the last one was 40 years and older. It could be that these two older categories in the current study didn’t have a significant effect because at the age of over 50, employees work towards their retirement and are less invested then they were in their forties. 5.1.3 Gender, education level and duration of employment Five social and demographic variables were taken into account when testing the organizational commitment score of the participants. These were age, gender, education level, rank and work experience (Mathieu and Zajac, 1990; Jafari et al., 2015; Labrague et al., 2018). The variables that did not have a significant effect were gender, education level and duration of employment. Labraque and colleagues (2018), who researched the organizational commitment of 166 nurses in the Philippines, stated that due to the commitment the nursing profession requires, females might have more commitment to their career as nurses due to the fact that life-long commitment and dedication are female trades. It could be that due to the fact the participants were all office workers instead of nurses the gender did not have a significant effect on the organizational commitment. Previous studies that found a significant effect were studies conducted amongst nurses so it appears these two type of jobs are too different to compare gender influence on the organizational commitment. Education level was also an influencing demographic that was found in the same study by Labrague and colleagues (2018). They found that nurses with a master’s degree had a higher organizational commitment. Further they hypothesized that Nurses with a lower education level had a lower commitment and this could again be due to lower pay and less career opportunities. In the current study the education level did not have any effect on the organizational commitment of employees. The population consisted of many higher educated people. These type of employees tend to work in a pleasant environment where their intellect and input is appreciated. This was associated with high commitment and could thus have resulted in no significant effect. The employment duration of the participants didn’t have a significant effect on the self-reported commitment of the employees. Jafari and his colleagues (2015) researched the organizational commitment of nurses working at the intensive care in a hospital in Iran. They found that work experience had a significant effect on the commitment of the nurses. Nurses with high levels of work experience had a higher organizational commitment compared to the low experienced nurses. Labrague and his colleagues (2018) researched the organizational commitment of 166 nurses in the Philippines. They found an increase in organizational commitment with nurses that had more than five years of work experience. It is possible that no significant effect was found because the distinction between duration of employment and years of experience was not specified. Both of the studies were conducted amongst nurses and when reviewing gender it appeared as if the professions nurse and office employee were not comparable. This could also be the case for work experience. 5.1.4 Low explained variation The R squared was low indicating that the variables researched didn’t account for much of the variation (around 10 percent). This could be due to the fact that a lot of other factors can influence the organizational commitment of employees. As was mentioned before, several studies investigating employees organizational commitment found demographic aspects that influence the organizational commitment of employees, such as age, gender, education level, rank and work experience (Mathieu and Zajac, 1990; Jafari et al., 2015; Labrague et al., 2018). However, some researchers included other personal characteristics such as marital status, positional tenure and organizational tenure (Dey et al., 2014). This is because not all researchers found the same

25
influencing demographics. For example, Mathieu and Zajac (1990) didn’t find a significant effect of the gender of participants while Jafari and his colleagues (2015) did find a significant effect. Other factors have also been found to influence the organizational commitment of employees were: work experience (Jafari et al., 2015), challenge, job scope, leader communication (Dey et al., 2014), general satisfaction (Mathieu, 1991), salary (Maxwell and Steele, 2003) and stress (McLean and Andrew, 1999). All these factors could have influenced the organizational commitment but they were not taken into consideration due to the size of the study and the length of the questionnaire and the depth. The questions from the organizational commitment questionnaire are intense, and the questionnaire needed to stay approachable and doable in a short amount of time to gather as many respondents as possible due to limited participants pool.
5.2 Opinion and attitude of employees towards dog
Unfortunately the opinion of employees on dogs in general, opinion on dogs in the office, whether they would allow a dog if it were up to them and the interaction of the employees with the dog, did not have any significant effect. Based on the many benefits that can be found in literature it was expected that there would have been a significant effect. There are a number of reasons that could explain this outcome. The first is that this is the result of the fact that all employees work with dogs in the office and that because they all experience these benefits, their opinion does not offer a big difference. Therefore it might be interesting to check the organizational commitment of similar companies who do not allow dogs in the office, and check whether their overall organizational commitment score is similar to the average organizational commitment score of the current study. 5.2.1 Compared to other organizational commitment scores When looking at the article published by Mowday, Steers and Porter (1979), an average mean can be deducted from their results. They report the mean scores of their Organizational Commitment Questionnaire that was conducted among 2,563 employees working in nine different organizations with a wide variety of jobs. The reported mean score ranged from 4.0 (low) to 6.1 (high). They indicated that the mean scores are typically slightly above the midpoint of the 7-point Likert scale which is 4.0. (Mowday et al., 1979) The mean score of the employees that participated is 5.4. This is a higher score than the average score but still ranging within the normal range. Because this mean score was set in 1979, it could be outdated. Many developments have taken place in the office environment, and they could all influence the outcome of the OCQ. It could be argued that due to the respondents nationality their overall OCQ score was relatively high. A study amongst American, Japanese and Korean employees showed that their average OCQ score was lower. The employees from the U.S. scored on average 3.61, the employees from Japan scored 3.21 and the Korean employees scored 3.29, indicating there are differences between different nationalities as they found that nationality accounted for 7 percent in the variance. (Luthans et al., 1985) The type of work could explain the high overall reported OCQ score. A high level of responsibility was argued, could lead to a higher commitment to the organization (Meyer and Allen., 1991). This could explain why the overall OCQ score was high. The demography of the study population consisted of employees who allow dogs in the office. This most likely meant that we selected a very small group of organizations which might not be representative of the general office companies. Also because most companies were no multinationals, there is a more intimate atmosphere. If a person is unhappy in such an environment, it is highly possible that they are more likely to leave than when they work with hundreds of other people. 5.2.2 Benefits of allowing dogs in the office No significant effect was found of the opinion and attitude of employees who work in an office environment with dogs. However, previous research has shown that pets are perceived to improve

26
the mood of employees and customers and increase social interaction (Perrine & Wells, 2006). From thirty one company’s 193 employees completed a questionnaire. The results showed that having pets in the office reduced stress and affected the health of the employees and the organisation positively. The study also indicated that employees who brought their pet to work experienced higher benefits than those who did not bring their pets or owned pets. (Wells & Perrine, 2001a) Research that compared work groups that either had a dog present or not, found that the behaviour of the groups with a dog present was more cooperative, comfortable, friendly, active, enthusiastic and attentive (Colarelli et al., 2017). According to Foreman and colleagues (2017), more studies have found this social aspect when testing an individual with a dog that person had more social encounters with strangers. A study within a university has shown that students (N=257) perceived a professor and the office as more approachable when a dog was present, compared to when there was no animal or a cat present (Wells & Perrine, 2001)b. Another study was done with employees from one company where they measured the amount of salivary cortisol in employees who own a pet and non-pet owners. The amount of stress measured in the dog owners who had their dogs present at work during the day showed significantly less stress compared to the other groups. When the dog owners did not have their dog present during the day they displayed a similar pattern to the non-pet owners. (Barker et al., 2012) Lastly, there was a study found that employees were found to be more involved in the company and were more likely to stay with the company if that company allowed pets in the office. (Niven, 2007; McConnell et al., 2011; Barker et al., 2012; Hare & Woods, 2013) This shows that there are many benefits to having dogs in the office environment. For the dogs, it would also provide benefits because they would be less alone and it would give dogs more variation in their day-to-day life. Owners that would not get a dog due to being absent most of the day, could actually get a dog. Off course there are also reasons for companies to disallow dogs. Employees can be allergic, some people don’t like pets, are afraid of them or have religious or cultural objections (Barker, 2005). These reasons can cause companies to not implement a dog friendly office environment.
5.3 Interesting findings
The data showed that thirteen respondents indicated that they feel negatively towards dogs in the office. However, only ten respondents said they would disallow dogs in the office if they had the choice. When checking the individual data it was determined that four out of thirteen were uncertain whether they would disallow dogs in the office, and interestingly there was one person who said they slightly liked dogs in the office who would choose against this if they could decide this. This indicates that four of the thirteen respondents actually did see some sort of benefit of having dogs in the office. It would be interesting to do a qualitative research to determine their reasons.
5.4 Limitations of the study
This study relied on the ability to honestly self-report of the respondents. Also the answers of the respondents depend on how the employee feels about the company at that specific moment. This study used a cross-sectional design and even though measuring organizational commitment is more stable than for example measuring job satisfaction (Mowday et al., 1979), it can have slight differences in outcome, though no major ones as longitudinal studies have shown. (Porter et al., 1974) A longitudinal study would have to be done amongst the same population to check for variation in the data. Some of the original questions of the general part remained unused. For example question 17 (See Appendices I and II). Interestingly many respondents didn’t fill out question 17 of the general part: “Is there a specific reason you don't want a dog in your office?” (only 94 respondents of the 103). It is speculated that this is due to the formulation of the question. People might have interpreted the question as something to not fill in when they had no reason to dislike dogs in the office. There reasons could be that the dislike dogs, or for example that they find the dog a form of distraction or maybe even a completely different reason. These options were not

27
included in the answer form. Despite the fact that the questionnaire was tested by two people, there were still some errors in the formulation of the questions in the general part.

28
6. Conclusion and recommendations
Conclusion It appears that for companies who allow dogs there is no significant difference in organizational commitment score between employees who like dogs and those who do not. Interestingly, the mean organizational commitment score of the employees was relatively high. This means that for companies in general, it does not positively influence employees organizational commitment. However, although almost thirteen percent indicated that they do not like dogs in the office, they do work in an office environment where dogs are present. Thus there is a factor negatively influencing their work environment but this does not influence their organizational commitment score. This suggest that having dogs in the office environment, looking at all the benefits from literature, could still be beneficial for companies. Recommendations For companies I would recommend to look into having dogs in the office, as it does not have an effect on employees organizational commitment. This means that implementing dogs in the office doesn’t bring down the commitment employees feel towards their company. Literature has proven that having a dog in the workplace has many other benefits. For example, the amount of interaction employees have with each other, the health and stress levels of employees. Rules and regulations would have to be put into place and it would take work and the employees would have to be on board. Recommendations for future research For future research it is recommended to continue with this research and compare the data with the organizational commitment of employees that work at similar companies who do not allow dogs in their office environment. It could be that because all the employees of the dog having companies experience the benefits of dogs in the office, as mentioned in literature, that there is no significant difference between this population. There could however be a significant difference compared with companies who don’t allow dogs in the office. On average the study population scored relatively high on the organizational commitment scale. However this mean score was set in 1979 (Mowday et al.), which means that many developments have taken place in the office environment, and they could all influence the outcome of the OCQ. Therefore it should be determined which factor could have influenced this. I recommend looking into the size of the company, the nationality of the study population and the frequency with which the dog is present in the office could also be of influence. As these are factors that could influence the organizational commitment. Another recommendation is to check who the owner of the dog is. This could be an influencing factor on their self-reported organizational commitment. It is interesting to check this with the position the owner of the dog has within the company. The question on what differences employees had to disallow dogs in the office raised an interesting question. Twelve employees indicated that they had (a) different reason(s) for not wanting to allow dogs in the office environment. It could be due to dislike of dogs, or for example that they find the dog a form of distraction or a completely different reason. These options were not included in the answer form. Their reasoning could be something for future research.

29
Acknowledgement
First I would like to thank my supervisors dr. Herman Kok and dr. Gerben van der Velde, without whom this research would not have been possible. I am grateful they received my idea with so much enthusiasm and that they helped me specify the research. Secondly and most importantly, I would like to thank all the participants that took the time to fill out the questionnaire and thus made the results possible.
30
References
Banfield Pet Hospital (2016). Pet-Friendly Workplace PAWrometer™.
Barker, R. T. (2005). On the edge or not? Opportunities for interdisciplinary scholars in business
communication to focus on the individual and organizational benefits of companion animals in the
workplace. The Journal of Business Communication (1973), 42(3), 299-315.
Barker, R. T., Knisely, J. S., Barker, S. B., Cobb, R. K., & Schubert, C. M. (2012). Preliminary
investigation of employee's dog presence on stress and organizational perceptions. International
Journal of Workplace Health Management, 5(1), 15-30.
Bearden, W. O., & Netemeyer, R. G. (1999). Handbook of marketing scales: Multi-item measures for
marketing and consumer behavior research. Sage.
Black, K. (2012). The relationship between companion animals and loneliness among rural
adolescents. Journal of Pediatric Nursing, 27(2), 103-112.
Colarelli, S. M., McDonald, A. M., Christensen, M. S., & Honts, C. (2017). A companion dog increases
prosocial behavior in work groups. Anthrozoös, 30(1), 77-89.
Cunha, M. P. E., Rego, A., & Munro, I. (2018). Dogs in organizations. Human Relations,
0018726718780210.
Dey, T., Kumar, A., & Kumar, Y. L. N. (2014). A new look at the antecedents and consequences of
organizational commitment: a conceptual study.
Dick, G., & Metcalfe, B. (2001). Managerial factors and organisational commitment-A comparative
study of police officers and civilian staff. International Journal of Public Sector Management, 14(2),
111-128.
Ferguson, L. (2004). External validity, generalizability, and knowledge utilization. Journal of Nursing
Scholarship, 36(1), 16-22.
Foreman, A. M., Glenn, M. K., Meade, B. J., & Wirth, O. (2017). Dogs in the workplace: a review of the
benefits and potential challenges. International journal of environmental research and public health,
14(5), 498.
Gordon, M. S. (2007). The examination of correctional officers’ organizational commitment.
Professional Issues in Criminal Justice, 190.

31
Hall, S., Wright, H., McCune, S., Zulch, H., & Mills, D. (2017). Perceptions of dogs in the workplace:
the pros and the cons. anthrozoös, 30(2), 291-305.
Hanaysha, J. (2016). Testing the effects of employee engagement, work environment, and
organizational learning on organizational commitment. Procedia-Social and Behavioral Sciences, 229,
289-297.
Hardy, M. A. (1993). Regression with dummy variables (Vol. 93). Sage.
Hare, B., & Woods, V. (2013). The genius of dogs. Oneworld Publications.
Hogervorst, J. F., (1999) Arbeidsomstandighedenwet Geldend van 01-01-2018 t/m heden.
Jafari, S., Afshin, T., Jafari, K., & Barzegar, M. (2015). Evaluation of organizational commitment among
nurses in Intensive Care Units. Journal of Nursing and Midwifery Sciences, 2(3), 38-43.
Jensen, S., & McIntosh, J. (2007). Absenteeism in the workplace: results from Danish sample survey
data. Empirical Economics, 32(1), 125-139.
Khaliq, I. H., Naeem, B., & Khalid, S. (2016). A study of factors affecting organizational commitment among bank officers in Pakistan. Journal of Business and Financial Affairs, 6(1), 1-5.
Kumari, P., & Priya, B. (2017). Organizational commitment: A comparative study of public and private
sector bank managers. International Journal of Business and Management Invention, 6(1), 38-47.
Labrague, L. J., McEnroe–Petitte, D. M., Tsaras, K., Cruz, J. P., Colet, P. C., & Gloe, D. S. (2018).
Organizational commitment and turnover intention among rural nurses in the Philippines:
Implications for nursing management. International Journal of Nursing Sciences, 5(4), 403-408.
Luthans, F., McCaul, H. S., & Dodd, N. G. (1985). Organizational commitment: A comparison of
American, Japanese, and Korean employees. Academy of Management journal, 28(1), 213-219.
Mathieu, J. E. (1991). A cross-level non recursive model of the antecedents of organizational commitment and satisfaction. Journal of Applied Psychology, 76:607-618
Mathieu, J. E., & Zajac, D. M. (1990). A review and meta-analysis of the antecedents, correlates, and
consequences of organizational commitment. Psychological bulletin, 108(2), 171.
Maxwell, G., & Steele, G. (2003). Organisational commitment: a study of managers in
hotels. International Journal of contemporary hospitality management, 15(7), 362-369.

32
McConnell, A. R., Brown, C. M., Shoda, T. M., Stayton, L. E., & Martin, C. E. (2011). Friends with
benefits: on the positive consequences of pet ownership. Journal of personality and social
psychology, 101(6), 1239.
McLafferty, S. L. (2003). Conducting questionnaire surveys. Key methods in geography, 87-100.
McLean, J., & Andrew, T. (1999). Commitment, satisfaction, stress and control among social services
managers and social workers in the UK. Administration in Social Work, 23(3-4), 93-117.
Meyer, J. P., & Allen, N. J. (1991). A three-component conceptualization of organizational
commitment. Human resource management review, 1(1), 61-89.
Meyer, J. P., Allen, N. J., & Allen, N. J. (1997). Commitment in the workplace (p. 5). Sage Publications.
Nagengast, S. L., Baun, M. M., Megel, M., & Leibowitz, J. M. (1997). The effects of the presence of a
companion animal on physiological arousal and behavioral distress in children during a physical
examination. Journal of Pediatric Nursing, 12(6), 323-330.
Niven, D. (2007). 100 simple secrets why dogs make us happy. HarperCollins Publishers Inc.
O'Haire, M. (2010). Companion animals and human health: Benefits, challenges, and the road
ahead. Journal of Veterinary Behavior: clinical applications and research, 5(5), 226-234.Perrine, R. M.,
& Wells, M. (2006). Labradors to Persians: Perceptions of pets in the workplace. Anthrozoös, 19(1),
65-78.
Perrine, R. M., & Wells, M. (2006). Labradors to Persians: Perceptions of pets in the workplace.
Anthrozoös, 19(1), 65-78.
Porter, L. W., Steers, R. M., Mowday, R. T., & Boulian, P. V. (1974). Organizational commitment, job
satisfaction, and turnover among psychiatric technicians. Journal of applied psychology, 59(5), 603.
Ramírez, M. T. G., & Hernández, R. L. (2014). Benefits of dog ownership: Comparative study of
equivalent samples. Journal of Veterinary Behavior: Clinical Applications and Research, 9(6), 311-315.
Rentsch, J. R., & Steel, R. P. (1992). Construct and concurrent validation of the Andrews and Withey
Job Satisfaction Questionnaire. Educational and Psychological Measurement, 52(2), 357-367.
Sahu, P. K. (2013). Research methodology: a guide for researchers in agricultural science, social
science and other related fields (p. 432). New Delhi: Springer.

33
Stazyk, E. C., Pandey, S. K., & Wright, B. E. (2011). Understanding affective organizational
commitment: The importance of institutional context. The American Review of Public Administration,
41(6), 603-624.
Tavakol, M., & Dennick, R. (2011). Making sense of Cronbach's alpha. International journal of medical
education, 2, 53.
Trofimov, A., Bondar, I., Trofimova, D., Miliutina, K., & Riabchych, I. (2017). Organizational
commitment factors: role of employee work engagement. Revista Espacios, 38(24).
Wells, M., & Perrine, R. (2001)a. Critters in the cube farm: Perceived psychological and organizational
effects of pets in the workplace. Journal of occupational health psychology, 6(1), 81.
Wells, M., & Perrine, R. (2001)b. Pets go to college: The influence of pets on students' perceptions of
faculty and their offices. Anthrozoös, 14(3), 161-168.
Wilkin, C. L., Fairlie, P., & Ezzedeen, S. R. (2016). Who let the dogs in? A look at pet-friendly
workplaces. International Journal of Workplace Health Management, 9(1), 96-109.

34
Appendix I English questionnaire
Questionnaire dogs in the office
This questionnaire is meant to measure what the presence of dogs in the office means for
organizational commitment of employees of a company.
This questionnaire consists of two parts and takes about 5 minutes to complete. The first part
consists of 17 general questions about your company and yourself. Part two will measure your
organizational commitment and consists of 15 statements.
Your answers are anonymous, will exclusively be used for the purpose of this research and will not be
shared with third parties.
1. At what company do you work?
2. What is your role within the company?
Employee
Manager
3. How long have you been employed at this specific company in years?
4. What is the distance between your home and the office?
0 - 5km
6 - 15km
16 - 30km
31 - 50km
More than 50km
5. How do you travel to the office?
By foot
By bicycle
By car
By public transportation
Other
6. What is your education level?
Non high school graduate
High school graduate
Bachelor's degree
Master's degree

35
Doctoral degree
7. What is your age?
Less than 20
20 - 25
26 - 30
31 - 40
41 - 50
51 - 60
More than 60
8. What is your gender?
Female
Male
9. What is your marital status?
Single
In a relationship not living together
In a relationship and living together
Partnership/married
Divorced
Widowed
Not applicable
10. Do you have children?
Yes
No
11. Do you own a dog?
Yes
No
12. How do you feel about dogs in general?
Strongly dislike
Dislike
Somewhat dislike
Neither like or dislike
Somewhat like
Like
Strongly like

36
13. How do you feel about dogs being allowed in the office in general?
Strongly dislike
Dislike
Somewhat dislike
Neither like or dislike
Somewhat like
Like
Strongly like
14. Do you have someone that can take care of your dog during office hours?
Yes, once a week
Yes, 2 - 3 times a week
Yes, 4 - 6 times a week
Yes, everyday
No
15. When there is a dog present in the office, do you interact with it?
No
I pet it
I play with the dog
I walk the dog
I pet and play with the dog
I pet and walk the dog
I play with and walk the dog
I pet, play and walk the dog
16. If it were up to you, would you allow dogs in the office?
Yes
No
Maybe
17. Is there a specific reason you don't want a dog in your office? (More than one answer possible)
No
Yes, I am allergic to dogs
Yes, I have religious reasons
Yes, I am afraid of dogs
Yes, I find them unhygienic
Yes, for another reason

37
Organizational Commitment
This is part two of the questionnaire. It is meant to measure your organizational commitment. 15
statements will be made and you can choose the answer that fits your opinion best.
Your answers are anonymous, will exclusively be used for the purpose of this research and will not be
shared with third parties.
1. I am willing to put in a great deal of effort beyond that normally expected in order to help this
organization be successful.
Strongly disagree
Disagree
Somewhat disagree
Neither agree or disagree
Somewhat agree
Agree
Strongly agree
2. I talk up this organization to my friends as a great organization to work for.
Strongly disagree
Disagree
Somewhat disagree
Neither agree or disagree
Somewhat agree
Agree
Strongly agree
3. I feel very little loyalty to this organization.
Strongly disagree
Disagree
Somewhat disagree
Neither agree or disagree
Somewhat agree
Agree
Strongly agree
4. I would accept almost any type of job assignment in order to keep working for this organization.
Strongly disagree
Disagree
Somewhat disagree
Neither agree or disagree
Somewhat agree

38
Agree
Strongly agree
5. I find that my values and the organization’s values are very similar.
Strongly disagree
Disagree
Somewhat disagree
Neither agree or disagree
Somewhat agree
Agree
Strongly agree
6. I am proud to tell others that I am part of this organization.
Strongly disagree
Disagree
Somewhat disagree
Neither agree or disagree
Somewhat agree
Agree
Strongly agree
7. I could just as well be working for a different organization as long as the type of work was similar.
Strongly disagree
Disagree
Somewhat disagree
Neither agree or disagree
Somewhat agree
Agree
Strongly agree
8. This organization really inspires the very best in me in the way of job performance.
Strongly disagree
Disagree
Somewhat disagree
Neither agree or disagree
Somewhat agree
Agree
Strongly agree
9. It would take very little change in my present circumstances to cause me to leave this organization.
Strongly disagree

39
Disagree
Somewhat disagree
Neither agree or disagree
Somewhat agree
Agree
Strongly agree
10. I am extremely glad that I chose this organization to work for over others I was considering at the
time I joined.
Strongly disagree
Disagree
Somewhat disagree
Neither agree or disagree
Somewhat agree
Agree
Strongly agree
11. There’s not too much to be gained by sticking with this organization indefinitely.
Strongly disagree
Disagree
Somewhat disagree
Neither agree or disagree
Somewhat agree
Agree
Strongly agree
12. Often, I find it difficult to agree with this organization’s policies on important matters relating to
its employees.
Strongly disagree
Disagree
Somewhat disagree
Neither agree or disagree
Somewhat agree
Agree
Strongly agree
13. I really care about the fate of this organization.
Strongly disagree
Disagree
Somewhat disagree
Neither agree or disagree

40
Somewhat agree
Agree
Strongly agree
14. For me this is the best of all possible organizations for which to work.
Strongly disagree
Disagree
Somewhat disagree
Neither agree or disagree
Somewhat agree
Agree
Strongly agree
15. Deciding to work for this organization was a definite mistake on my part.
Strongly disagree
Disagree
Somewhat disagree
Neither agree or disagree
Somewhat agree
Agree
Strongly agree
This is the end of the questionnaire. Thank you very much for your time!

41
Appendix II Dutch Questionnaire
Enquête honden op het kantoor
Deze enquête is bedoeld om te meten wat de aanwezigheid van honden op de werkvloer betekent
voor de betrokkenheid van medewerkers bij een bedrijf.
De enquête bestaat uit twee delen en duurt ongeveer 5 minuten. Het eerste deel bestaat uit 17
algemene vragen over uw bedrijf en uzelf. Deel twee is om uw organisatorische betrokkenheid te
meten en bestaat uit 15 stellingen. Uw antwoorden zijn anoniem, worden uitsluitend gebruikt voor
dit onderzoek en niet gedeeld met derden.
1. Bij welk bedrijf werkt u?
2. Wat is uw functie binnen het bedrijf?
Medewerker
Manager
3. Hoe lang bent u al werkzaam bij dit bedrijf in jaren?
4. Hoe ver reist u van uw huis naar het kantoor?
0 - 5km
6 - 15km
16 - 30km
31 - 50km
Meer dan 50km
5. Hoe reist u naar het kantoor?
Te voet
Op de fiets
Met de auto
Met het openbaar vervoer
Anders
6. Wat is uw hoogst behaalde vooropleiding?
Alleen lager onderwijs
Middelbaar onderwijs
Bachelor
Master
Doctoraal

42
7. Hoe oud bent u?
Jonger dan 20
20 - 25
26 - 30
31 - 40
41 - 50
51 - 60
Ouder dan 60
8. Welk geslacht heeft u?
Vrouw
Man
9. Wat is uw burgerlijke staat?
Single
Niet samenwonend in een relatie
Samenwonend in een relatie
Geregistreerd partnerschap/getrouwd
Gescheiden
Weduwe/weduwnaar
N.v.t.
10. Heeft u kinderen?
Ja
Nee
11. Heeft u een hond?
Ja
Nee
12. Wat vindt u in het algemeen van honden?
Sterke afkeer
Afkeer
Lichte afkeer
Neutraal
Beetje leuk
Leuk
Erg leuk
13. Wat vindt u in het algemeen van het toestaan van honden in een kantoor?
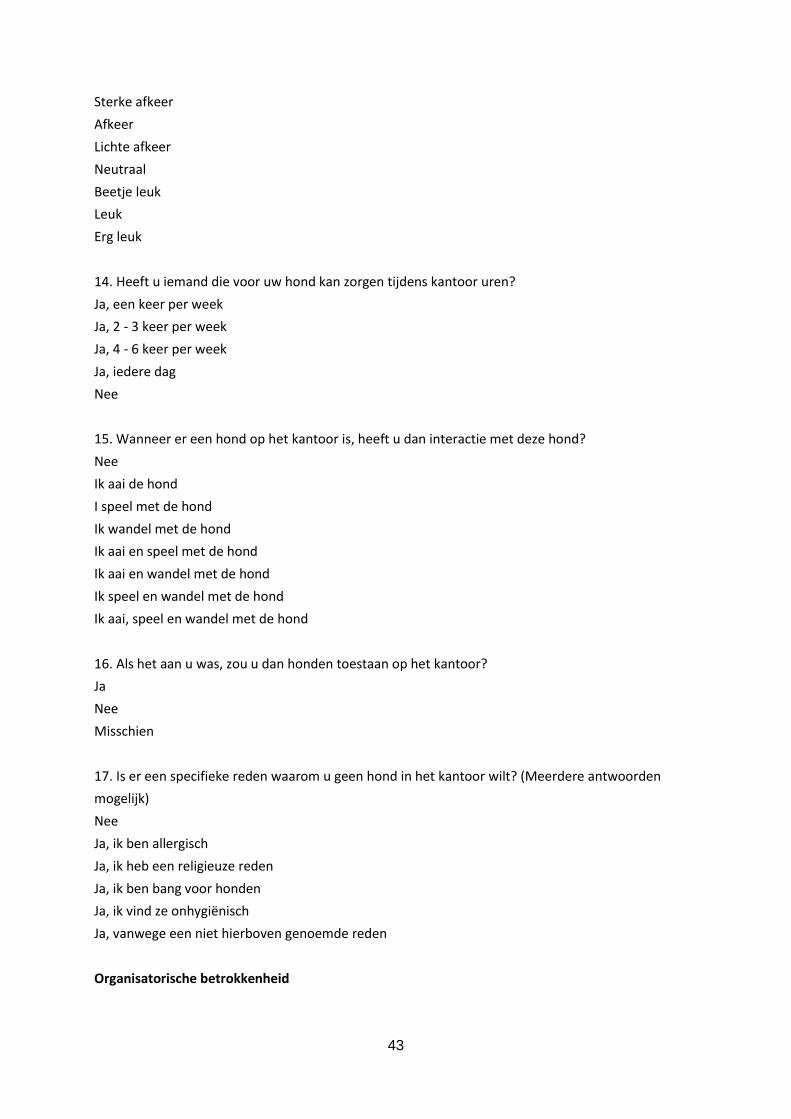
43
Sterke afkeer
Afkeer
Lichte afkeer
Neutraal
Beetje leuk
Leuk
Erg leuk
14. Heeft u iemand die voor uw hond kan zorgen tijdens kantoor uren?
Ja, een keer per week
Ja, 2 - 3 keer per week
Ja, 4 - 6 keer per week
Ja, iedere dag
Nee
15. Wanneer er een hond op het kantoor is, heeft u dan interactie met deze hond?
Nee
Ik aai de hond
I speel met de hond
Ik wandel met de hond
Ik aai en speel met de hond
Ik aai en wandel met de hond
Ik speel en wandel met de hond
Ik aai, speel en wandel met de hond
16. Als het aan u was, zou u dan honden toestaan op het kantoor?
Ja
Nee
Misschien
17. Is er een specifieke reden waarom u geen hond in het kantoor wilt? (Meerdere antwoorden
mogelijk)
Nee
Ja, ik ben allergisch
Ja, ik heb een religieuze reden
Ja, ik ben bang voor honden
Ja, ik vind ze onhygiënisch
Ja, vanwege een niet hierboven genoemde reden
Organisatorische betrokkenheid
44
Dit is deel twee van de enquête. Deze is bedoeld om uw organisatorische betrokkenheid te meten. Er
volgen 15 stellingen over uw bedrijf en u kunt hier aangeven in hoeverre u het eens bent met deze
stellingen.
Uw antwoorden zijn anoniem, worden uitsluitend gebruikt voor dit onderzoek en niet gedeeld met
derden.
1. Ik ben bereid om veel meer te doen dan normaal wordt verwacht, om deze organisatie te helpen
succesvol te zijn.
Sterk oneens
Oneens
Licht oneens
Niet eens of oneens
Licht eens
Eens
Sterk eens
2. Ik prijs deze organisatie aan bij mijn vrienden als een geweldige organisatie om voor te werken.
Sterk oneens
Oneens
Licht oneens
Niet eens of oneens
Licht eens
Eens
Sterk eens
3. Ik voel erg weinig loyaliteit naar deze organisatie.
Sterk oneens
Oneens
Licht oneens
Niet eens of oneens
Licht eens
Eens
Sterk eens
4. Ik zou bijna alle soorten werk accepteren als dit zou betekenen dat ik kan blijven werken voor deze
organisatie.
Sterk oneens
Oneens
Licht oneens
Niet eens of oneens
Licht eens

45
Eens
Sterk eens
5. Ik vind dat mijn waarden en de waarden van de organisatie erg overeenkomen.
Sterk oneens
Oneens
Licht oneens
Niet eens of oneens
Licht eens
Eens
Sterk eens
6. Ik ben er trots op om andere mensen te vertellen dat ik bij deze organisatie hoor.
Sterk oneens
Oneens
Licht oneens
Niet eens of oneens
Licht eens
Eens
Sterk eens
7. Ik zou net zo goed voor een andere bedrijf kunnen werken zolang het maar om soortgelijk werk
gaat.
Sterk oneens
Oneens
Licht oneens
Niet eens of oneens
Licht eens
Eens
Sterk eens
8. Dit bedrijf haalt echt het beste in mij naar voren op het gebied van werkprestatie.
Sterk oneens
Oneens
Licht oneens
Niet eens of oneens
Licht eens
Eens
Sterk eens

46
9. Mijn huidige omstandigheden zouden niet veel hoeven te veranderen om mij ertoe te brengen
deze organisatie te verlaten.
Sterk oneens
Oneens
Licht oneens
Niet eens of oneens
Licht eens
Eens
Sterk eens
10. Ik ben zeer blij dat ik ervoor heb gekozen om voor deze organisatie te gaan werken, in plaats van
bij anderen die ik overwoog toen in in dienst kwam.
Sterk oneens
Oneens
Licht oneens
Niet eens of oneens
Licht eens
Eens
Sterk eens
11. Het is niet in mijn voordeel om voor altijd bij dit bedrijf te blijven omdat ik hier weinig kan
bereiken.
Sterk oneens
Oneens
Licht oneens
Niet eens of oneens
Licht eens
Eens
Sterk eens
12. Vaak vind ik het moeilijk om het eens te zijn met het beleid van dit bedrijf over belangrijke zaken
die werknemers betreffen.
Sterk oneens
Oneens
Licht oneens
Niet eens of oneens
Licht eens
Eens
Sterk eens
13. Ik geef echt om de toekomst van deze organisatie.

47
Sterk oneens
Oneens
Licht oneens
Niet eens of oneens
Licht eens
Eens
Sterk eens
14. Voor mij is dit het best mogelijke bedrijf om voor te werken.
Sterk oneens
Oneens
Licht oneens
Niet eens of oneens
Licht eens
Eens
Sterk eens
15. Het besluit om voor dit bedrijf te gaan werken was een duidelijke vergissing van mij.
Sterk oneens
Oneens
Licht oneens
Niet eens of oneens
Licht eens
Eens
Sterk eens
Dit is het einde van de enquête. Heel erg bedankt voor uw tijd!

48
Appendix III Messages
The message that was send out via LinkedIn.
Figure 3. LinkedIn message
The message that people received when displaying interest in participating:
Onderwerp: Enquête honden op het kantoor
Beste X,
Leuk dat jullie mee willen werken aan het onderzoek naar de impact van honden op de werkvloer op
de betrokkenheid van medewerkers bij de organisatie! Dit onderzoek ik in het kader van mijn master
thesis aan de Universiteit van Wageningen.
Honden op de werkvloer is een onderwerp dat in de belangstelling staat. Bewezen is dat het stress

49
verlagend werkt maar over de relatie met betrokkenheid bij de organisatie is weinig bekend. Met dit
onderzoek hopen wij hierover meer duidelijkheid te krijgen.
We toetsen de impact door middel van een enquête waarbij we zo veel mogelijk reacties willen. De
enquête bestaat uit een algemeen deel en een betrokkenheidsdeel en duurt minder dan 5 minuten.
De enquête is in te vullen in het Nederlands en het Engels door middel van een link en die kan door
iedereen binnen de organisatie gebruikt worden.
Dit is de link naar de Nederlandse enquête:
https://docs.google.com/forms/d/e/1FAIpQLSda4XuzrGlCC06DzkelvyTtVnyKSx88ahdfJm6T04hdCh7_
HQ/viewform?usp=sf_link
Dit is de link naar de Engelse enquête:
https://docs.google.com/forms/d/e/1FAIpQLScz2qgqEGDe5kbzPCikEoVp8auKBNCnjdd8CW02u_7h87
0vBg/viewform?usp=sf_link
Zou je deze links onder kantoormedewerkers willen verspreiden? Het is belangrijk dat ik weet naar
hoeveel personen binnen de organisatie je de enquête verspreidt. We willen de enquête op
woensdag 12 december sluiten dus gelieve de enquête zo snel mogelijk te verspreiden.
Zou je het aantal malen dat de enquête verspreid is en het moment van verspreiding ook even aan
mij door kunnen geven?
Natuurlijk krijgen jullie als alle data zijn geanalyseerd een samenvatting met de resultaten en
conclusies toegestuurd!
Als je nog vragen hebt dan kun je me mailen, een berichtje sturen op LinkedIn of bellen op X.
Alvast heel erg bedankt voor je medewerking!
Met vriendelijke groet,
Odette van Woensel

50
Appendix IV Data output Organizational Commitment
Questionnaire
Data on Organizational Commitment Questionnaire (Mowday et al., 1979) of 103 respondents.
Question (total response) Options # response % response
OCQ question 1 (103) Strongly disagree Disagree Somewhat disagree Neither agree or disagree Somewhat agree Agree Strongly agree
0 3 4 9 25 35 27
0% 2.9% 3.9% 8.7% 24.3% 34.0% 26.2%
OCQ question 2 (103) Strongly disagree Disagree Somewhat disagree Neither agree or disagree Somewhat agree Agree Strongly agree
1 2 3 8 14 41 34
1.0% 1.9% 2.9% 7.8% 13.6% 38.8% 33.0%
OCQ question 3 Reversed (103) Strongly disagree Disagree Somewhat disagree Neither agree or disagree Somewhat agree Agree Strongly agree
3 5 5 2 7 40 41
39.8% 38.8% 6.8% 1.9% 2.9% 4.9% 2.9%
OCQ question 4 (103) Strongly disagree Disagree Somewhat disagree Neither agree or disagree Somewhat agree Agree Strongly agree
18 37 12 12 15 8 1
17.5% 35.9% 11.7% 11.7% 14.6% 7.8% 1.0%
OCQ question 5 (103) Strongly disagree Disagree Somewhat disagree Neither agree or disagree Somewhat agree Agree Strongly agree
0 5 4 7 13 57 17
0% 4.9% 3.9% 6.8% 12.6% 55.3% 16.5%
OCQ question 6 (103) Strongly disagree Disagree Somewhat disagree Neither agree or disagree Somewhat agree Agree Strongly agree
0 3 1 9 13 47 30
0% 2.9% 1.0% 8.7% 12.6% 45.6% 29.1%

51
OCQ question 7 Reversed (103) Strongly disagree Disagree Somewhat disagree Neither agree or disagree Somewhat agree Agree Strongly agree
1 16 16 8 17 35 10
9.7% 34.0% 16.5% 7.8% 15.5% 15.5% 1.0%
OCQ question 8 (103) Strongly disagree Disagree Somewhat disagree Neither agree or disagree Somewhat agree Agree Strongly agree
1 1 12 11 24 37 17
1.0% 1.0% 11.7% 10.7% 23.3% 35.9% 16.5%
OCQ question 9 Reversed (103) Strongly disagree Disagree Somewhat disagree Neither agree or disagree Somewhat agree Agree Strongly agree
0 5 9 15 14 39 21
20.4% 37.9% 13.6% 14.6% 8.7% 4.9% 0%
OCQ question 10 (103) Strongly disagree Disagree Somewhat disagree Neither agree or disagree Somewhat agree Agree Strongly agree
0 0 1 13 13 46 30
0% 0% 1.0% 12.6% 12.6% 44.7% 29.1%
OCQ question 11 Reversed (103) Strongly disagree Disagree Somewhat disagree Neither agree or disagree Somewhat agree Agree Strongly agree
1 11 15 16 10 33 17
16.5% 32.0% 9.7% 15.5% 14.6% 10.7% 1.0%
OCQ question 12 Reversed (103) Strongly disagree Disagree Somewhat disagree Neither agree or disagree Somewhat agree Agree Strongly agree
2 3 16 10 11 42 19
18.4% 40.8% 1.7% 9.7% 15.5% 2.9% 1.9%
OCQ question 13 (103) Strongly disagree Disagree Somewhat disagree Neither agree or disagree Somewhat agree Agree Strongly agree
0 0 2 2 20 45 34
0% 0% 1.9% 1.9% 19.4% 43.7% 33.0%
OCQ question 14 (103) Strongly disagree Disagree Somewhat disagree
0 8 11
0% 7.8% 10.7%

52
Neither agree or disagree Somewhat agree Agree Strongly agree
23 16 33 12
22.3% 15.5% 32.0% 11.7%
OCQ question 15 Reversed (103) Strongly disagree Disagree Somewhat disagree Neither agree or disagree Somewhat agree Agree Strongly agree
1 0 0 2 2 23 75
72.8% 22.3% 1.9% 1.9% 0% 0% 1.0%
Table 5. Data respondents Organizational Commitment Questionnaire


![Bohner Attitude Attitude Change 2011[1]](https://img.pdfslide.net/doc/110x75/577cdc9c1a28ab9e78aaef04/bohner-attitude-attitude-change-20111.jpg)