Embed Size (px)
Citation preview

Increasing Climate Change Awareness at TOBB ETU
Bu yayın Avrupa Birliği’nin yardımıyla hazırlanmıştır. Bu yayının içeriğinden yalnızca TOBB ETÜ sorumlu olup,herhangi bir şekilde AB’nin görüşlerini yansıttığı şeklinde yorumlanamaz.
TOBB EKONOMİ VETEKNOLOJİ ÜNİVERSİTESİ
KARBON AYAKİZİ RAPORU 2017
TOBB UNIVERSITY OF ECONOMICS AND TECHNOLOGY
CARBON FOOTPRINT REPORT 2017

1www.tto.etu.edu.tr
1- YÖNETİCİ ÖZETİ / EXECUTIVE SUMMARY 02
2- GİRİŞ / INTRODUCTION 04
3- TEKNİK YAKLAŞIM / TECHNICAL APPROACH 06
3.1- Metodoloji / Methodology
3.2- Kuruluş ve Faaliyet Sınırları / Organizational and Operational Boundaries
3.2.1- Kuruluş Sınırları / Organizational Boundaries
3.2.2- Faaliyet Sınırları / Operational Boundaries
3.3- Raporlama Dönemi / Reporting Period
3.4- Veri Analizi / Data Analysis
3.4.1- Emisyon Kaynaklarına Ait Veriler / Data of Emission Sources
3.4.2- Emisyon Faktörleri / Emisson Factors
3.4.3- Sera Gazı Emisyonlarının Hesaplanması / Calculation of Greenhouse Gas Emissions
3.4.4- Veri Bütünlüğü ve Kalitesi / Data Integrity and Quality
3.5- Sera Gazı Emisyon Yutakları / Greenhouse Gas Emission Sinks
4- TOBB ETÜ’NÜN KARBON AYAKİZİ / CARBON FOOTPRINT OF TOBB ETU 18
4.1- Kapsamlara Göre Sera Gazı Emisyonları / Greenhouse Gas Emissions by Scope
4.1.1- Kapsam 1: Doğrudan sera gazı emisyonları / Scope 1: Direct greenhouse gas emissions
4.1.2- Kapsam 2: Enerji dolaylı sera gazı emisyonları / Scope 2: Energy indirect greenhouse gas emissions
4.1.3- Kapsam 3: Diğer dolaylı sera gazı emisyonları / Scope 3: Other indirect greenhouse gas emissions
4.2- Emisyon Yoğunluğu / Emission Intensity
5- ÖNERİ ve HEDEFLER / RECOMMENDATIONS AND TARGETS 26
5.1- Kapsamın Genişletilmesi ve Veri Kalitesinin Artırılmasına Yönelik Öneriler /
Recommendations for Scope Extension and Enhancing Data Quality
5.2- Sera Gazı Emisyonlarının Azaltılmasına Yönelik Öneriler /
Recommendations for Reducing Greenhouse Gas Emissions
5.3- Sera Gazı Emisyonlarının Azaltılmasına Yönelik Hedefler /
Targets for Reducing Greenhouse Gas Emissions
İçindekiler Table of Contents

2 www.tto.etu.edu.tr
Şekil 1 - Emisyon Kaynakları
Bu tespitlerden yola çıkılarak emisyon azaltım önerilerinde bulunulmuş, özellikle elektrik tüketiminden kaynaklanan sera gazı emisyonlarının azaltılması için çatı üzeri güneş enerji santrali kurulmasına yönelik teknik ve finansal detayları içeren bir ön fizibilite çalışması hazırlanmıştır. Buna ek olarak, ilerleyen yıllarda sera gazı emisyonu envanterinin kapsamının genişletilmesi için izleme önerilerinde bulunulmuştur.
Son olarak, paydaş temsilcilerinin görüşleri alınarak Avrupa Komisyonu ‘nun belirlemiş olduğu iklim stratejileri ile uyumlu emisyon azaltım hedefleri belirlenmiştir.
Bu çalışma, sürdürülebilir bir kampüs yaratma hedefiyle TOBB Ekonomi ve Teknoloji Üniversitesi’nin (TOBB ETÜ) iklim değişikliğine sebep olabilecek çevresel etkilerinin analizini yapmak ve sera gazı emisyonlarını azaltma potansiyelini belirlemek için hazırlanmıştır. Öncelikle referans bir veri seti oluşturmak amacıyla 2016 yılına ait sera gazı emisyonları hesaplanmıştır. Ardından, sera gazına sebep olan faaliyetlerdeki en güncel değişimi analiz edebilmek için 2017 yılına ait sera gazı emisyonları envantere eklenmiştir. Ortaya çıkan bulgular ışığında TOBB ETÜ’nün karbon ayak izi 2016 yılına kıyasla 2017 yılında %0,78 artmasına karşın akademik personel, idari personel ve öğrenci sayısındaki %4,7 ‘lik artış sebebiyle kişi başına düşen emisyon miktarı %3,78 oranında azalmıştır.
Envanter kapsamında doğalgaz tüketimi, satın alınan elektrik, kampüse ulaşım, kâğıt tüketimi, su tüketimi, kiralık ve TOBB ETÜ’ye ait araçlardan kaynaklanan sera gazı emisyonları hesaplanmış, ana emisyon yükünün doğalgaz tüketimi, satın alınan elektrik ve kampüse ulaşım faaliyetlerinden kaynaklandığı tespit edilmiştir.
1- Yönetici Özeti
2016 (tCO₂e) 2017 (tCO₂e) DEĞİŞİM (%)
Toplam Emisyonlar 16.803,94 16.934,21 %0,78
Kişi Başına Düşen Emisyon Miktarı 2,37 2,28 %-3,78
KampüseUlaşım%48
Doğalgaz%22
Diğer%1
Elektrik%29

3www.tto.etu.edu.tr
Based on these determinations, emission reduction suggestions were made, and a pre-feasibility study including technical and financial details for installation of a rooftop solar power plant was prepared in order to reduce greenhouse gas emissions due to electricity consumption. In addition, monitoring proposals were made for the following years to enlarge the scope of the greenhouse gas emissions inventory.
Finally, emission reduction targets were determined in line with the climate strategies identified by the European Commission, considering the views of the stakeholder representatives.
This study is prepared with the aim of creating a sustainable campus for TOBB University of Economics and Technology (TOBB ETU) by analyzing its environmental effects that could cause climate change and by determining its potential to reduce greenhouse gas emissions. First of all, greenhouse gas emissions were calculated for the year 2016 to form a reference dataset. Afterwards, greenhouse gas emissions for 2017 were added to the inventory to analyze the most recent changes in activities that cause formation of greenhouse gases. In the light of the findings obtained, even though the carbon footprint of TOBB ETU had increased by 0.78% in 2017 compared to 2016, the amount of per capita emissions was decreased by 3.78% due to a 4.7% increase in the number of academic staff, administrative staff and students.
Within the context of the inventory, greenhouse gas emissions originating from natural gas consumption, purchased electricity, transportation to campus, paper consumption, water consumption, and rental and TOBB ETU-owned vehicles were calculated, and it was determined that the main emission load was due to natural gas consumption, purchased electricity, and campus transportation activities.
1- Executive Summary
2016 (tCO₂e) 2017 (tCO₂e) CHANGE (%)
Total Emissions 16.803,94 16.934,21 %0,78
Amount of Emission per Capita 2,37 2,28 %-3,78
Figure 1- Emission Sources
Transportation to Campus
48% NaturalGas 22%
Other%1
Electricity29%

4 www.tto.etu.edu.tr
TOBB ETÜ, Türkiye Odalar ve Borsalar Eğitim ve Kültür Vakfı (TOBEV) tarafından 1 Temmuz 2003 tarihinde kurulmuştur. Üniversitemiz, 2004-2005 Akademik Yılı içerisinde üç fakülte altı bölüm ve 145’i burslu 270 öğrencisi ile eğitim öğretim faaliyetlerine başlamıştır. Söğütözü semtinde idari üniteleri ve eğitim öğretim bloğundan oluşan TOBB ETÜ yerleşkesine ek olarak izleyen yıl sosyal tesisler binası, 2009 yılında Yabancı Diller binası, 2013 yılında Teknoloji Merkezi ve 2014 yılında Tıp Fakültesi Morfoloji Laboratuvarı binası dahil olmuştur.
TOBB ETÜ araştırma-geliştirme faaliyetleri ile ülke ve toplum ihtiyaçlarına yönelmek ve ülkenin ekonomik ve sosyal kalkınmasına katkıda bulunmak misyonu ile kurulmuştur. Misyonu doğrultusunda sadece ülkemizin değil dünyamızın başlıca sorunlarından olan iklim değişikliği konusuna kayıtsız kalmamıştır. İklim değişikliğine yönelik olarak çalışmaların ilkinin Üniversitemizin sera gazı emisyon envanterinin hazırlanması konusunda yapılmasına karar verilmiştir. Bu doğrultuda Avrupa Birliği tarafından desteklenen “Increasing Climate Change Awareness at TOBB ETU” projesi kapsamında Üniversitemizin sera gazı emisyon envanteri hazırlanmıştır. Proje kapsamında öğrencilerimiz, akademik ve idari personelimizle emisyon değerleri paylaşılmış, bu konuda kendilerine eğitim verilmiş ve emisyon azaltım önerileri toplanmıştır. Elinizde tuttuğunuz bu rapor sadece sera gazı envanter analiz sonuçlarını içeren bir metin değil aynı zamanda TOBB ETÜ mensuplarının önerilerini barındıran bir yol haritasıdır. Üniversitemizin tüm çalışmalarına içtenlikle destek veren Mütevelli Heyeti Başkanımız Sayın Rifat HİSARCIKLIOĞLU başta olmak üzere, proje boyunca proje ekibimizden desteğini esirgemeyen Rektörümüz Prof. Dr. Adem ŞAHİN Hocamıza, Teknoloji Transfer Ofisimize, öğrencilerimize, akademik ve idari personelimize teşekkür ederiz.
2- Giriş
Süleyman TURGUTProje Koordinatörü
TOBB ETÜ 2014-2015 MezunuTOBB ETÜ Teknoloji Transfer OfisiProje Yönetimi Birimi, Uzm. Yrd.

5www.tto.etu.edu.tr
TOBB ETU was founded by the Turkey Chambers and Commodity Exchanges Educational and Cultural Foundation (TOBEV) on July 1, 2003. Our university started its education activities in 2004-2005 Academic Year with 3 faculties, 6 departments, and 270 students, 145 of which were scholarship students. In addition to the TOBB ETU campus in Söğütözü district, which consists of administrative units and education and training blocks, social facilities building was included the following year, and Foreign Language Building in 2009, Technology Center in 2013, and the Faculty of Medicine Morphology Laboratory in 2014.
TOBB ETU was founded with the mission of contributing to the needs of the country and society, and to the economic and social development of the country, with its research and development activities. In accordance with its mission, TOBB ETU chose not to be indifferent to climate change problem, which is one of the major problems of our earth. It had been decided that the first of the studies on climate change to be carried out on the preparation of our university’s greenhouse gas emission inventory. Accordingly, our university’s greenhouse gas emission inventory was prepared within the scope of “Increasing Climate Change Awareness at TOBB ETU” project supported by the European Union. Within the scope of this project, the emission values were shared with our students, academicians, and administrative staff, training was provided in this regard, and emission reduction recommendations were gathered. This report is not only a text containing the results of the greenhouse gas inventory analysis, but also a roadmap containing the recommendations of TOBB ETU members. We especially thank Rifat HISARCIKLIOGLU, our chairman of the board of trustees, who sincerely supports all activities of our university, and our president and teacher Prof., Dr. Adem SAHIN, who supported our team throughout the project, our Technology Transfer Office, and our students and academic and administrative staff.
2- Introduction
Süleyman TURGUTProject Coordinator
TOBB ETU 2014-2015 GraduateTOBB ETU Technology Transfer OfficeProject Management Unit, Assistant Specialist

6 www.tto.etu.edu.tr
3.1-Metodoloji
TOBB ETÜ’nün karbon ayak izi analizi World Resources Institute’ün (WRI) belirlemiş olduğu GHG Protocol ve International Organization for Standardization’ın belirlemiş olduğu ISO 14064-1 standartlarıyla uyumlu bir şekilde hazırlanmıştır. Kuruluşların karbon ayak izlerinin izlenmesi ve raporlanması konusunda bu iki standart birbiriyle uyumlu ve birbirini tamamlayacak şekilde tasarlanmıştır. Buna ek olarak GHG Protocol dünya çapında en yaygın olarak kullanılan uluslararası sera gazı emisyonu hesaplama aracıdır.
3.2-Kuruluş ve Faaliyet Sınırları
3.2.1- Kuruluş Sınırları
Sera gazı emisyonlarının hesaplanmasına yönelik olarak belirlenen kuruluş sınırları, kuruluşun iş ve operasyonlarını yürüttüğü sınırları tarif eder. Bu bağlamda kuruluşlar finansal veya operasyonel olarak kontrolünde olan tesislerin sebep olduğu emisyonlarını (1)kontrol yaklaşımına (the control approach) yaklaşımına göre ya da pay sahibi olduğu tesislerden kaynaklanan emisyonları (2)hisse paylaşımı yaklaşımına (the equity share approach) göre raporlamayı tercih edebilir.
TOBB ETÜ’nün karbon ayak izi hesaplaması yapılırken operasyonel kontrol yaklaşımı tercih edilmiştir. Bu kapsamda TOBB ETÜ yerleşkesi içerisinde bulunan üç ayrı bölgedeki bina ve tesislerde gerçekleştirilen ve yönetilen faaliyetler sebebiyle ortaya çıkan sera gazı emisyonları hesaplanmıştır. Bu bölgeler;
1) Fakülte, enstitü ve idari birimlerin yer aldığı Merkez Bölge2) Yabancı Diller Bölümü ve Teknoloji Merkezi Binası’nın yer aldığı YDB Bölgesi3) Öğrenci yurtlarının yer aldığı Öğrenci Konukevi Bölgesi.
2016 yılında TOBB ETÜ’ye bağlanan TOBB ETÜ Özel Hastanesi operasyonel kontrolün TOBB ETÜ’de olmaması sebebiyle hesaplamalara dahil edilmemiştir. Ayrıca, TOBB ETÜ’nün batısında yer alan ve ağaçlandırma, bakım ve rekreasyon maksatlı kullanılmak üzere TOBB ETÜ’ye tahsis edilen Atatürk Orman Çiftliği’ne ait arazide henüz bir faaliyet gerçekleştirilmediği için rapor dışında tutulmuştur. Bunlara ek olarak, Merkez Bölge’de yer alan spor salonunun işletmesi özel bir firma tarafından yürütüldüğü için kuruluş sınırları dışında kalmaktadır.
3- Teknik Yaklaşım
Şekil 2- TOBB ETÜ Master Plan

7www.tto.etu.edu.tr
3.1- Methodology
Carbon footprint analysis of TOBB ETU has been prepared in accordance with the GHG Protocol defined by the World Resources Institute (WRI) and the ISO 14064-1 standard defined by the International Organization for Standardization. These two standards are designed to be compatible with each other and to complement each other in the monitoring and reporting of carbon footprints of organizations. In addition, the GHG Protocol is the world’s most widely used international greenhouse gas emission calculation tool.
3.2- Organizational and Operational Boundaries
3.2.1- Organizational Boundaries
Organizational boundaries determined for the purpose of calculating greenhouse gas emissions refer to the boundaries in which an organization performs its activities and operations. In this context, organizations may prefer to report the emissions caused by the facilities in its own financial or operational control according to (1) the control approach or the emissions caused by the shared facilities according to (2) the equity share approach.
Operational control approach was preferred for calculating the carbon footprint of TOBB ETU. In this context, greenhouse gas emissions resulting from activities carried out and managed in buildings and facilities in three different areas within the TOBB ETU campus have been calculated. These areas are:
1) Central Area where faculties, institutes, and administrative units are located2) YBD Area where Foreign Language Department and Technology Center Building are located3) Student Residence Area where student dormitories are located
TOBB ETU Private Hospital affiliated to TOBB ETU in 2016 has not been included in the calculation because its operational control is not in TOBB ETU. Besides, the field belonging to the Ataturk Forest Farm, which is found west of TOBB ETU and allocated to TOBB ETU for forestation, maintenance, and recreation purposes, is excluded from this report, since there is no activity in the field. In addition, since the operation of the sports center found at the Central Area is made by a private company, it is considered as out of organizational boundaries.
3- Technical Approach
Figure 2- TOBB ETU Master Plan

8 www.tto.etu.edu.tr
3.2.2- Faaliyet Sınırları
Faaliyet sınırlarının belirlenmesi, kuruluşun faaliyetleriyle ilişkili sera gazı emisyonlarını ve uzaklaştırmalarını tespit et-meyi, sera gazı emisyonlarını ve uzaklaştırmalarını doğrudan sera gazı emisyonları, enerji dolaylı sera gazı emisyonları ve diğer dolaylı sera gazı emisyonları olarak sınıflandırmayı ihtiva etmektedir. Faaliyet sınırlarının belirlenmesi ayrıca, diğer dolaylı emisyonların hangisinin hesaplanacağının ve rapor edileceğinin seçilmesini içerir.
Bunun için aşağıdaki tanımlamalar kullanılmıştır;
Kapsam 1: Doğrudan sera gazı emisyonları
Bu kapsamın tanımlaması ISO 14064-1 ve GHG Protocol kılavuzlarında küçük farklılıklar gösterse de bu iki standar-dın birbirini tamamlayıcı olduklarını göz önünde bulundurarak aynı sınırları tarif ettikleri çıkarımını yapabiliriz.
ISO 14064 kılavuzunda bu kapsam “kuruluşun sınırları içerisindeki tesislerden kaynaklanan doğrudan sera gazı emis-yonları ve uzaklaştırmaları” şeklinde tarif edilirken GHG Protocol kılavuzunda “kuruluşa ait veya kuruluş tarafından kontrol edilen kaynakların sebep olduğu sera gazı emisyonları” şeklinde tarif edilmiştir.
Kapsam 2: Enerji dolaylı sera gazı emisyonları
Kuruluş tarafından ithal edilerek (satın alınarak) tüketilen elektrik, ısı veya buharın üretilmesi sırasında oluşan sera gazı emisyonlarını tarif eder.
Kapsam 3: Diğer dolaylı sera gazı emisyonları
Enerji dolaylı sera gazı emisyonundan başka, bir kuruluşun faaliyetlerinin bir sonucu olarak başka kuruluşların sahip olduğu veya kontrol ettiği sera gazı kaynaklarından ortaya çıkan sera gazı emisyonlarını tarif eder.
Diğer dolaylı sera gazı emisyonlarına sebep olan 16 faaliyet ISO 14064-1’in uygulanmasına yönelik kılavuzda detaylı bir şekilde belirtilmiştir.
Bu tanımlar ışığında TOBB ETÜ’nün karbon ayak izinin raporlanması için belirlenen faaliyet sınırları aşağıdaki gibidir;
Kapsam 1: 1.1. TOBB ETÜ yerleşkesindeki binaları ısıtmak ve sıcak su kullanımı için kazanlarda yakılan doğalgaz,1.2. TOBB ETÜ’ye ait olan ulaşım ve taşıma araçlarının kullandığı yakıt,1.3. Klimalarda kullanılan R410A gazının eksilmesinden kaynaklanan sera gazı emisyonları.
Kapsam 2: 2.1. Işıklandırma, iklimlendirme sistemleri, asansör v.b. kullanımı için satın alınan şebeke elektriği.
Kapsam 3: 3.1. Kiralık araçların yakıt tüketimi,3.2. Dışarıdan satın alınan ve ofis işlerinde kullanılan kâğıt tüketimi,3.3. Su tüketimi,3.4. Personel ve öğrencilerin TOBB ETÜ’ye ulaşımında kullanılan ve dışarıdan temin edilen servis hizmeti için kullanılan araçların kat ettiği mesafe,3.5. Personel ve öğrencilerin TOBB ETÜ’ye ulaşımak için toplu taşıma araçları ile kat ettiği mesafe,3.6. Öğrenci ve personele ait şahsi araçların TOBB ETÜ’ye ulaşımında kat ettiği mesafe,

9www.tto.etu.edu.tr
3.2.2- Operational Boundaries
Determining operational boundaries involves identifying greenhouse gas emissions and discharges associated with the activities of the organization, and classifying greenhouse gas emissions and discharges as direct greenhouse gas emissions, energy indirect greenhouse gas emissions and other indirect greenhouse gas emissions. Determination of operational boundaries also includes selecting which of the other indirect emissions will be calculated and reported.
For this purpose, the following definitions are used:
Scope 1: Direct greenhouse gas emissions
Although definition of this scope presents minor differences in ISO 14064-1 and GHG Protocol guidelines, we can deduce that they describe the same boundaries, considering that these two standards are complementary.
In ISO 14064 guideline, this content is described as “direct greenhouse gas emissions and discharges originating from facilities within the boundaries of the organization”, while in the GHG Protocol manual, it is described as “greenhouse gas emissions originating from sources that belong to the organization or are controlled by the organization”.
Scope 2: Indirect energy greenhouse gas emissions
Describes emissions of greenhouse gases generated during the production of electricity, heat, or steam consumed by the organization by importing (by purchasing).
Scope 3: Other indirect greenhouse gas emissions
Other than energy indirect greenhouse gas emission, this refers to greenhouse gas emissions generated due to activities of an organization, but originating from greenhouse gas sources owned by or controlled by other organizations.
16 activities leading to other indirect greenhouse gas emissions have been defined in detail in the guide for the implementation of ISO 14064-1.
In the light of these definitions, the operational boundaries determined for reporting TOBB ETU’s carbon footprint are as follows:
Scope 1: 1.1. Natural gas burnt in boilers for heating the buildings in the TOBB ETU campus and for hot water use,1.2. Fuel used by transportation vehicles belonging to TOBB ETU,1.3. Greenhouse gas emissions originating from the reduction of R410A gas used in air conditioners.
Scope 2: 2.1. Mains electricity purchased for use in illumination, air conditioning systems, and elevators, etc.
Scope 3: 3.1. Fuel consumption of rental vehicles,3.2. Consumption of paper that is purchased from outside and used for office work,3.3. Water consumption,3.4. Distance covered by vehicles, which are procured from outside and used in transportation services of the staff and students to TOBB ETU,3.5. Distance covered by the staff and students by public transportation to reach TOBB ETU,3.6. Distance covered by private vehicles of the staff and students to reach TOBB ETU,
10 www.tto.etu.edu.tr
Sera gazı emisyonu envanteri hazırlanırken tüm emisyon kaynakları detayları bir şekilde tanımlanmış, fakat özellikle Kapsam 3 sınırlarına giren bazı faaliyetler yeterli veri olmaması sebebiyle envantere dahil edilmemiştir. Envanter dışında tutulan başlıca emisyon kaynakları atıklardan, uluslararası ve şehirlerarası seyahatlerden ve konaklamalardan kaynaklanan faaliyetlerdir. Aşağıdaki bölümlerde toplanan data ve uygulanan emisyon faktörleri ile ilgili olarak detaylı açıklamalar yapılmıştır.
TOBB ETÜ karbon ayak izini azaltma fırsatlarını verimli bir şekilde değerlendirmek için kendi faaliyetlerinden kaynaklanan emisyonları daha detaylı olarak izlemeyi ve özellikle Kapsam 3 sınırlarına giren emisyon kaynaklarını daha geniş bir biçimde ele almayı hedeflemektedir. Gelecek yıllar içerisinde özellikle iş seyahatleri ve konaklamalardan kaynaklanan emisyonların da rapora dahil edilmesi için çaba sarf edilecektir. Ayrıca emisyon kaynaklarının daha detaylı incelenmesi ve emisyon azaltım önlemlerinin etkin bir şekilde hayata geçirilebilmesi için sera gazı emisyonuna sebep olan faaliyetlerini daha sık aralıklarla izlenmesi ve kaydedilmesi planlanmaktadır.
Şekil 3- GHG Protocol Faaliyet Sınırları Şeması
3.3- Raporlama Dönemi
Bu rapor birbirini takip eden iki ayrı dönemi kapsamaktadır:
1. Dönem: 01 Ocak 2016 - 31 Aralık 2016 (Temel yıl)2. Dönem: 01 Ocak 2017 - 31 Aralık 2017

11www.tto.etu.edu.tr
While preparing greenhouse gas emission inventory, all the emission sources are defined in detail, but especially some activities that are considered to be within the boundaries of Scope 3 could not be included in the inventory since there is not enough data. Main sources of emissions excluded from inventory are from wastes, international and intercity trips, and accommodation activities. The following sections provide detailed explanations about the collected data and applied emission factors.
TOBB ETU aims to monitor emissions originating from its own activities in more detail in order to make use of opportunities to reduce its carbon footprint, and especially aims to focus on emission sources in the context of scope 3 boundaries. Efforts will be made in the coming years to also include emissions originating especially from business trips and accommodations. In addition, it is planned to monitor and record activities that cause greenhouse gas emissions more frequently so that more detailed analysis of emission sources and emission reduction measures can be taken more effectively.
Figure 3- GHG Protocol Operational Boundary Diagram
3.3- Reporting Period
This report covers two consecutive periods:
1. Period: January 1, 2016 - December 31, 2016 (Base year)2. Period: January 1, 2017 - December 31, 2017

12 www.tto.etu.edu.tr
3.4- Veri Analizi
3.4.1- Emisyon Kaynaklarına Ait Veriler
Emisyon kaynaklarına yönelik olarak toplanan verilerin kaynakları, birimleri ve izleme sıklıkları aşağıdaki tabloda detaylı bir şekilde belirtilmiştir. Bu veriler ağırlıklı olarak birincil kaynak olan TOBB ETÜ idari personelinin sağlamış olduğu bilgi ve belgelerden elde edilmiştir.
KAPSAM EMİSYON KAYNAĞI BİRİM KAYNAK
KAPSAM 1
Doğalgaz Tüketimi (Isınma ve Sıcak Su) m3 Yıllık
Okula Ait Araçların Yakıt Tüketimi (Motorin) Litre Aylık
Kaçak Emisyonlar (Klima – R410 A) kg Yıllık
KAPSAM 2 Satın Alınan Elektrik kWh Aylık
KAPSAM 3
Kiralık Araçların Yakıt Tüketimi (Motorin) Litre Aylık
Kâğıt Tüketimi Miktar-kg Yıllık
Su Tüketimi m3 Yıllık
Okul ve Ring Servisleri (Kat Edilen Mesafe) km Yıllık
Toplu Taşıma Araçlarıyla TOBB ETÜ’ye Geliş-Gidiş km Yıllık
Şahsi Araçlarla TOBB ETÜ’ye Geliş-Gidiş km Yıllık
3.4.2- Emisyon Faktörleri
Emisyon faktörü, emisyon kaynaklarının birim hammadde, birim yakıt, birim hacim, birim zaman veya birim alanda sebep olduğu ortalama sera gazı miktarını belirten katsayıdır. Fakat, diğer taraftan Kyoto Protokolü’nde belirtilen altı sera gazının (Karbon dioksit (CO2), Metan (CH4), Nitröz Oksit (N2O), Hidroflorür karbonlar (HFCs), Perfloro karbonlar (PFCs), Sülfürhekza florid (SF6)) küresel ısınmaya etkisi birbirinden farklıdır. Bazı sera gazları atmosferde daha uzun süre kalmaktadır. Bu nedenle emisyon kaynaklarının sebep olduğu sera gazlarının küresel ısınmaya etkisini tek bir birim üzerinden belirtmek için Karbon dioksit eş değeri (CO2e) ifadesi kullanılır. Sera gazlarının Karbon dioksit eş değerine çevrilmesi için kullanılan katsayıya Küresel ısınmaya etki potansiyeli (KIP) denir.
Tablo 1- TOBB ETÜ Emisyon Kaynakları Verisi

13www.tto.etu.edu.tr
Table 1- TOBB ETU Emission Sources Data
3.4- Data Analysis
3.4.1- Data of Emission Sources
The sources, units, and monitoring frequencies of data collected from emission sources are provided in detail in the below given table. These data are mainly obtained from information and documents provided by the TOBB ETU administrative staff as the primary source.
SCOPE EMISSION SOURCE UNIT MONITORINGFREQUENCY
SCOPE 1
Natural Gas Consumption (Heating and Hot Water) m3 Yearly
Fuel Consumption of School Vehicles (Diesel Oil) Litre Monthly
Fugitive Emissions (Air Conditioner – R410 A) kg Yearly
SCOPE 2 Purchased Electricity kWh Monthly
SCOPE 3
Fuel Consumption of Rental Vehicles (Diesel Oil) Litre Monthly
Paper Consumption Amount-kg Yearly
Water Consumption m3 Yearly
School Bus and ShuttleBus Services (Distance covered) km Yearly
Public Transportation to and from TOBB ETU km Yearly
Transportation to and from TOBB ETU using Personal Vehicles km Yearly
3.4.2- Emisson Factors
Emission factor is the coefficient that indicates the average amount of greenhouse gas emission caused by the unit raw material, unit fuel, unit volume, unit time, or unit area of emission sources. However, on the other hand, the effects of the six greenhouse gases defined in Kyoto Protocol (Carbon dioxide (CO2), Methane (CH4), Nitrous Oxide (N2O), Hydrofluoride carbons (HFCs), Perfluoro carbons (PFCs), Sulphurhexafluoride (SF6)) on global warming are different from each other. Some greenhouse gases remain longer in the atmosphere. Therefore carbon dioxide equivalent (CO2e) unit is used to denote the effect of greenhouse gases on global warming caused by emission sources with a single unit. The coefficient used to convert greenhouse gases to carbon dioxide equivalent is called global warming potential (GWP).

14 www.tto.etu.edu.tr
KAPSAM EMİSYON KAYNAĞI
EMİSYON FAKTÖRÜ (2016-TEMEL YIL)
EMİSYONFAKTÖRÜ
(2017)
TEMELYILA GÖRE
DEĞİŞİMKAYNAK
KAPSAM 1
Doğalgaz Tüketimi (Isınma ve Sıcak Su) 2,028 kgCO₂e/m3 2,097 kgCO₂e/m3 %+3,4 Defra
Okula Ait Araçların Yakıt Tüketimi (Motorin)
2,676 kgCO₂e/litre 2,672 kgCO₂e/litre %-0,2 Defra
Kaçak Emisyonlar(Klima – R410 A) 2.088,000 kgCO₂e/kg 2.088,000 kg
CO₂e/kg - Defra
KAPSAM 2 Satın Alınan Elektrik 0,478 kgCO₂/kWh 0,478 kgCO₂/kWh - IEA
KAPSAM 3
Kiralık Araçların Yakıt Tüketimi (Motorin) 2,676 kgCO₂e/litre 2,672 kgCO₂e/litre %-0,2 Defra
Kâğıt Tüketimi 939,000 kgCO₂e/ton 928,600 kgCO₂e/ton %-1,1 Defra
Su Tüketimi 0,344 kgCO₂e/m3 0,344 kgCO₂e/m3 - Defra
Okul ve RingServisleri (Kat Edilen Mesafe)
0,120 kgCO₂e/(yolcu.km)
0,123 kgCO₂e/(yolcu.km) %2,3 Defra
Toplu Taşıma Araçlarıyla TOBB ETÜ’ye Geliş-Gidiş
0,120 kgCO2e/km 0,120 kgCO₂e/km %2,3 Defra
Şahsi Araçlarla TOBB ETÜ’ye Geliş-Gidiş
0,189 kgCO₂e/km 0,184 kgCO₂e/km %-2,5 Defra
3.4.3- Sera Gazı Emisyonlarının Hesaplanması
TOBB ETÜ idari personeli ve hizmet yüklenicileri (Okul ve Ring Servisleri) tarafından sağlanan veriler ve uluslararası kaynaklardan elde edilen ilgili emisyon faktörleri kullanılarak ile TOBB ETÜ’nün mutlak sera gazı emisyon envanteri hesaplanmıştır. Kişi başına düşen emisyon miktarlarının hesaplanması için de akademisyen, öğrenci ve idari personelin toplamından oluşan Üniversite mensubu kişi sayısı kullanılmıştır.
3.4.4- Veri Bütünlüğü ve Kalitesi
Tablo 2- Emisyon Faktörlerindeki Yıllık Değişim

15www.tto.etu.edu.tr
SCOPE EMISSION SOURCE
EMISSION FACTOR (2016-BASE YEAR)
EMISSION FACTOR (2017)
CHANGE COMPARED
TO THE BASIC YEAR
SOURCE
SCOPE 1
Natural Gas Con-sumption (Heating and Hot Water)
2.028 kgCO₂e/m3 2.097 kgCO₂e/m3 %+ 3.4 Defra
Fuel Consumption of School Vehicles (Diesel Oil)
2.676 kgCO₂e/litre 2.672 kgCO2e/liter %-0.2 Defra
Fugitive Emissions(Air Conditioner – R410 A)
2088.000 kgCO₂e/kg 2088.000 kgCO₂e/kg - Defra
SCOPE 2 PurchasedElectricity 0.478 kgCO₂/kWh 0.478 kgCO₂/kWh - IEA
SCOPE 3
Fuel Consumption of Rental Vehicles (Diesel Oil)
2.676 kgCO₂e/liter 2.672 kgCO₂e/liter %-0.2 Defra
Paper Consumption 939.000 kgCO₂e/ton 928.600 kgCO2e/ton %-1.1 Defra
Water Consumption 0.344 kgCO₂e/m3 0.344 kgCO₂e/m3 - Defra
School Bus and Shuttle Bus Ser-vices (Distance covered)
0.120 kgCO₂e/(passenger.km)
0.123 kgCO₂e/(passenger.km) %2.3 Defra
Public Transpor-tation to and from TOBB ETU
0.120 kgCO₂e/km 0.120 kgCO₂e/km %2.3 Defra
Transportation to and from TOBB ETU using Personal Vehicles
0.189 kgCO₂e/km 0.184 kgCO₂e/km %-2.5 Defra
3.4.3- Calculation of Greenhouse Gas Emissions
TOBB ETU's absolute greenhouse gas emission inventory was calculated using the data provided by the TOBB ETU administrative staff and service contractors (School and Shuttle Bus Services) and the relevant emission factors derived from international sources. For calculation of the amount of emissions per capita, the number of University members consisting of the sum of academicians, students, and administrative staff was used.
3.4.4- Data Integrity and Quality
Table 2- Annual Change in Emission Factors

16 www.tto.etu.edu.tr
3.5- Sera Gazı Emisyon Yutakları
TOBB ETÜ kampüsü içerisinde yaşları 1-15 arasında değişen, aralarında meyve ağaçlarının da bulunduğu çeşitli türlerden yaklaşık 2.000 adet ağaç olduğu tespit edilmiştir. Dağınık bir şekilde kampüs içerisinde yer alan bu ağaçların bakımı TOBB ETÜ personeli tarafından yapılsa da gerekli metodolojik izlemelerin yapılmasının mümkün olmayışından dolayı emisyon yutağı olarak envantere eklenmemiştir.
Bunun dışında herhangi bir emisyon yutağı tespit edilmemiştir.
Zayıf Geliştirilebilir Yeterli
KAPSAM EMİSYON KAYNAĞI BİRİM KAYNAK
KAPSAM 1
Doğalgaz Tüketimi (Isınma ve Sıcak Su) Birincil Veri TOBB ETÜ İdari Personel
Okula Ait Araçların Yakıt Tüketimi (Motorin) Birincil Veri TOBB ETÜ İdari Personel
Kaçak Emisyonlar (Klima – R410 A) Birincil Veri TOBB ETÜ İdari Personel
KAPSAM 2 Satın Alınan Elektrik Birincil Veri TOBB ETÜ İdari Personel
KAPSAM 3
Kiralık Araçların Yakıt Tüketimi (Motorin) Birincil Veri TOBB ETÜ İdari Personel
Kâğıt Tüketimi Birincil Veri TOBB ETÜ İdari Personel
Su Tüketimi Birincil Veri TOBB ETÜ İdari Personel
Okul ve Ring Servisleri (Kat Edilen Mesafe) İkincil Veri Servis Şirketi
Toplu Taşıma Araçlarıyla TOBB ETÜ’ye Geliş-Gidiş İkincil Veri Anket
Şahsi Araçlarla TOBB ETÜ’ye Geliş-Gidiş İkincil Veri Anket
Tablo 3- Veri Kaynağı Analizi

17www.tto.etu.edu.tr
3.5- Greenhouse Gas Emission Sinks
It has been determined that there are about 2,000 trees, including fruit trees, ranging in age from 1 to 15 within the TOBB ETU campus. Even though TOBB ETU staff takes care of these trees, which are scattered in the campus, they are not added into the inventory as emission sinks, since it is not possible to perform the required methodological monitoring.
No other emission sink was detected.
Weak Can be improved Adequate
SCOPE EMISSION SOURCE ACTIVITY DATA SOURCE
SCOPE 1
Natural Gas Consumption (Heating and Hot Water) Primary Data TOBB ETU Administrative Staff
Fuel Consumption of School Vehicles (Diesel Oil) Primary Data TOBB ETU Administrative Staff
Fugitive Emissions (Air Conditioner – R410 A) Primary Data TOBB ETU Administrative Staff
SCOPE 2 Purchased Electricity Primary Data TOBB ETU Administrative Staff
SCOPE 3
Fuel Consumption of Rental Vehicles (Diesel Oil) Primary Data TOBB ETU Administrative Staff
Paper Consumption Primary Data TOBB ETU Administrative Staff
Water Consumption Primary Data TOBB ETU Administrative Staff
School Bus and Shuttle Bus Services (Distance covered)
Secondary Data Service Bus Company
Public Transportation to and from TOBB ETU SecondaryData Survey
Transportation to and from TOBB ETU using Personal Vehicles
SecondaryData Survey
TABLE 3- Data Source Analysis

18 www.tto.etu.edu.tr
4.1- Kapsamlara Göre Sera Gazı Emisyonları
2017 yılı için toplam sera gazı emisyonu miktarı 16.934,21 tCO2e olarak gerçekleşmiştir. Temel yıl olarak kabul edilen bir önceki yıl emisyonları ile kıyaslandığında toplam emisyon miktarı 130,27 tCO2e artış göstermiştir. Oransal olarak bakıldığında bu artış %1’in altındadır. Özellikle TOBB ETÜ’ye mensup insan sayısındaki %4,7 artış göz önünde bulundurulduğunda sera gazı emisyonlarının azaltılmasına yönelik olumlu gelişmeler kaydedilmiştir.
2017 ile 2016 yılı emisyonları kapsamlar bazında kıyaslandığında Kapsam 1 emisyonları 261,72 tCO2e (%6,41) azalmış, Kapsam 2 emisyonları 163,30 tCO2e (%3,38) artmış ve Kapsam 3 emisyonları da 228,70 tCO2e (%2,90) artmıştır.
4- TOBB ETÜ’nün Karbon Ayakizi
KAPSAM EMİSYON KAYNAĞI 2016 (tCO₂e) 2017 (tCO₂e) DEĞİŞİM (%)
KAPSAM 1
Doğalgaz 4.010,11 3.753,14 %-6,41
TOBB ETÜ’ye Ait Araçlar 70,89 66,15 %-6,69
Kaçak Emisyonlar 0,00 0,00 %0,00
KAPSAM 2 Elektrik 4.830,54 4.993,83 %3,38
KAPSAM 3
Kiralık Araçlar 16,68 20,06 %20,26
Kâğıt 19,01 16,02 %-15,76
Su 28,48 34,26 %20,29
Kampüse Ulaşım
Servis 3.189,67 3.262,32 %2,28
Toplu Taşıma 1.038,04 1.111,91 %7,12
Otomobil 3.600,51 3.676,52 %2,11
TOPLAM
Kapsam 1 Toplamı 4.081,00 3.819,28 %-6,41
Kapsam 2 Toplamı 4.830,54 4.993,83 %3,38
Kapsam 3 Toplamı 7.892,39 8.121,09 %2,90
Genel Toplam 16.803,94 16.934,21 %0,78
YOĞUNLUKİnsan Sayısı2 7.081 7.416 %4,7
Kişi Başına Düşen Emisyon 2,37 2,28 %-3,78
Tablo 4- Kapsamlara Göre Sera Gazı Emisyonları

19www.tto.etu.edu.tr
4.1- Greenhouse Gas Emissions by Scope
Total greenhouse gas emissions for 2017 amounted to 16,934.21 tCO2e. Total emission amount has increased by 130.27 tCO2e compared to the previous year emissions, which are considered as the base year. Proportionally, this increase is below 1%. Considering especially the 4.7% increase in the total number of people in TOBB ETU, improvement has been made in reducing greenhouse gas emissions.
When 2017 and 2016 emissions are compared based on the scopes, Scope 1 emissions were reduced by 261.72 tCO2e (6.41%), Scope 2 emissions were increased by 163.30 tCO2e (3.38%), and Scope 3 emissions were also increased by 228.70 tCO2e (2.90%).
4- Carbon Footprint Of TOBB ETU
SCOPE EMISSION SOURCE 2016 (tCO₂e) 2017 (tCO₂e) CHANGE (%)
SCOPE 1
Natural gas 4010.11 3753.14 %-6.41
Vehicles Owned by TOBB ETU 70.89 66.15 %-6.69
Fugitive Emissions 0.00 0.00 %0.00
SCOPE 2 Electricity 4830.54 4993.83 %3.38
SCOPE 3
Rental Cars 16.68 20.06 %20.26
Paper 19.01 16.02 %-15.76
Water 28.48 34.26 %20.29
Transportation to Campus
Service 3189.67 3262.32 %2.28
Public Transpor-tation 1038.04 1111.91 %7.12
Automobile 3600.51 3676.52 %2.11
TOTAL
Scope 1 Total 4081.00 3819.28 %-6.41
Scope 2 Total 4830.54 4993.83 %3.38
Scope 3 Total 7892.39 8121.09 %2.90
General Total 16803.94 16934.21 %0.78
INTENSITYNumber of People: 7081 7416 %4.7%
Emission Per Capita 2.37 2.28 %-3.78
Table 4- Greenhouse Gas Emissions by Scope

20 www.tto.etu.edu.tr
4.1.1- Kapsam 1: Doğrudan sera gazı emisyonları
Doğalgaz: Kapsam 1 emisyonlarının neredeyse tamamı doğalgaz tüketiminden kaynaklanmaktadır. Diğer emisyon kaynaklarının toplam payı %2’nin altındadır. Bu sebeple, 2017 yılında doğalgaz emisyon faktöründeki %3,4’lük artışa rağmen (bkz. Tablo 2) doğalgaz tüketiminin %9,5 oranında azalması, 2017 yılındaki toplam sera gazı emisyonlarının 2016 yılı toplam sera gazı emisyonları ile aynı seviyelerde kalmasını sağlamıştır.
TOBB ETÜ’ye Ait Araçlar: Okula ait araçların sebep olduğu emisyonların Kapsam 1 içerisindeki payı hem 2017 yılı için hem de temel yıl olan 2016 yılı için %1,7’dir. Okul araçlarının 2017 yılı içinde sebep olduğu emisyon miktarı temel yıl envanteri ile karşılaştırıldığında 4,74 tCO2e azalarak 70,89 tCO2e’dan 66,15 tCO2e’a düşmüştür.
Kaçak Emisyonlar: TOBB ETÜ kuruluş ve faaliyet sınırları içerisinde ölçülebilir-izlenebilir tek kaçak emisyon kaynağı klimalar için kullanılan R410A gazıdır. Raporlama dönemlerini kapsayan 2016 ve 2107 yılları içerisinde R410A gazı kaynaklı bir emisyon izlenmemiştir.
4.1.2- Kapsam 2: Enerji dolaylı sera gazı emisyonları
Elektrik: TOBB ETÜ kuruluş ve faaliyet sınırları içerisinde kullanılmak üzere sera gazı emisyonuna sebep olabilecek buhar, ısı, vb. satın alımı yapılmadığı için Kapsam 2 emisyonlarının tamamını elektrik tüketiminden kaynaklanan emisyonlar oluşturmaktadır. Ayrıca, elektrik tüketimi, toplam sera gazı emisyonları içerisindeki yaklaşık %30’luk payıyla ikinci en büyük emisyon kaynağıdır.
2016 yılı ile kıyaslandığında elektrik tüketiminden kaynaklanan emisyonlar 163,30 tCO2e artarak %3,38 oranında yükseliş göstermiştir. Bu artış miktarı envanterdeki diğer ana emisyon kaynakları olan doğalgaz ve kampüse ulaşım emisyonları dışarıda tutulduğunda geriye kalan tüm faaliyetlerin sebep olduğu emisyonların toplamından daha fazladır. Hem 2016 hem de 2017 yılı için kullanılan emisyon faktörlerinde bir farklılık olmamasından dolayı elektrik tüketiminden kaynaklanan emisyonlardaki artışın tek sebebi elektrik tüketiminin artmasıdır. Bununla birlikte 3,0 MW tüketim ve 2,1 MW geri kazanım kapasitesi ile dünyanın en büyük su türbini test ve tasarım merkezini bünyesinde bulunduran TOBB ETÜ’nün, bu tesisin tümüyle faaliyete geçmesi ile birlikte elektrik tüketiminin ve de dolayısıyla emisyonlarının ciddi oranda artacağı öngörülmektedir.
2017 yılına odaklanıldığında, toplam sera gazı emisyonlarının yaklaşık %48’i Kapsam 3 faaliyetleri sebebiyle gerçekleşmiştir. İlerleyen yıllarda Kapsam 3 içerisine giren diğer emisyon kaynaklarının (bkz. Bölüm 5.1) da envantere dahil edilmesi ile Kapsam 3 emisyonlarının oranının %50’nin üzerine çıkması beklenmektedir.
²Akademik Personel + İdari Personel + Öğrenci
Şekil 4- Kapsamlara Göre Sera Gazı Emisyonlarının Dağılımı
Kapsam 1 Kapsam 2 Kapsam 3
48%
29%
23%
21www.tto.etu.edu.tr
4.1.1- Scope 1: Direct greenhouse gas emissions
Natural gas: Almost all of the Scope 1 emissions are due to natural gas consumption. The total share of other emission sources is less than 2%. Therefore, even though there was a 3.4% increase in the natural gas emission factor (see, Table 2), reduction of natural gas consumption by 9.5% had ensured that the total greenhouse gas emissions of 2017 remained at the same level with the total greenhouse gas emissions of 2016.
Vehicles Owned by TOBB ETU: The share of emissions caused by the vehicles owned by the school within Scope 1 is 1.7% for both 2017 and the base year, 2016. The amount of emissions caused by school vehicles in the year 2017 had decreased by 4.74 tCO2e, from 70.89 tCO2e to 66.15 tCO2e, when compared to the base year inventory.
Fugitive Emissions: The only measurable-monitorable fugitive emission source within the organizational and operational boundaries of TOBB ETU is the R410A gas which is used for air conditioners. No emission of R410A gas was monitored during the years of 2016 and 2107, covering the reporting periods.
4.1.2 - Scope 2: Energy indirect greenhouse gas emissions
Electricity: Since vapour, heat, etc. are not purchased to be used within TOBB ETU organizational and operational boundaries, all of the Scope 2 emissions consist of emissions originating from electricity consumption. Moreover, electricity consumption is the second largest source of emission, forming approximately 30% of total greenhouse gas emissions.
When compared to the year 2016, emissions from electricity consumption increased by 163.30 tCO2e, which is 3.38%. The amount of this increase is greater than the sum of all remaining emissions, excluding the two main emission sources in the inventory, natural gas and transportation to campus. Since there is no difference in the emission factors used for both 2016 and 2017, the only reason in increase of emissions due to electricity consumption is directly the increase in electricity consumption. Furthermore, TOBB ETU contains the world's largest water turbine test and design center with 3.0 MW consumption and 2.1 MW recovery capacity, and it is predicted to have significantly increased electricity consumption and thus greenhouse gas emissions when this facility starts operation with full capacity.
Focusing on 2017, approximately 48% of all greenhouse gas emissions were due to Scope 3 activities. In the forthcoming years, Scope 3 emissions are expected to surpass 50% upon inclusion of other emission sources that fall into Scope 3 (see, Section 5.1) into the inventory.
Figure 4- Distribution of GHG Emissions by Scope
Scope 1 Scope 2 Scope 3
48%
29%
23%

22 www.tto.etu.edu.tr
4.1.3- Kapsam 3: Diğer dolaylı sera gazı emisyonları
Kiralık Araçlar: Genellikle TOBB ETÜ bünyesinde yürütülen projeler kapsamında ortaya çıkan ihtiyaçlardan dolayı kullanılan kiralık araçların sebep olduğu sera gazı emisyonlarının toplam sera gazı emisyonları içerisindeki payı %0,1 oranıyla göz ardı edilebilecek kadar düşüktür.
Kâğıt: Kâğıt tüketiminin sebep olduğu sera gazı emisyonları miktarı da hemen hemen kiralık araçların sebep olduğu emisyonlar kadar küçük olduğu için göz ardı edilebilecek niteliktedir. 2016 yılına kıyasla 2017 yılındaki kâğıt kullanımından kaynaklanan sera gazlarının azalmasının ana sebebi 2017 yılında Elektronik Belge Yönetim Sistemi (EBYS)’ ne tümüyle geçilmesinden kaynaklanmaktadır.
Su: Temel yılda 28,48 tCO2e olan su tüketimi kaynaklı sera gazı emisyonları 2017 yılı içerisinde %20,29 artış göstererek 34,26 tCO2e’a ulaşmıştır. 2016 ve 2017 yıllar arasında emisyon faktörü sabit kaldığı için emisyonlardaki artışın sebebi su tüketiminin de %20,29 oranında artmış olmasıdır. Su tüketimine bağlı sera gazı emisyonlarının Kapsam 3 emisyonlarına oranı %0,4, toplam emisyonlara oranı ise %0,2’dir.
Kampüse Ulaşım: TOBB ETÜ mensuplarının ikametgahlarından kampüse motorlu taşıtlarla geliş ve gidişlerinden kaynaklanan sera gazı emisyonlarıdır. 2016 yılında 7.828,22 tCO2e olan toplam kampüse ulaşım emisyonları 2017 yılında %2,8 artışla 8.050,75 tCO2e’a ulaşmıştır. Kampüse geliş-gidişten kaynaklanan sera gazı emisyonları toplam emisyonların % 47,5’ini, Kapsam 3 emisyonlarının ise %99’unu oluşturmaktadır. Bu oranlarla toplam envanter içerisindeki en büyük emisyon kaynağıdır. Üç alt başlıkta incelen bu emisyon kaynağı içerisinde en fazla emisyon otomobil ile ulaşımdan, ikinci olarak servis ile ulaşımdan ve son olarak da toplu taşıma araçlarıyla ulaşımdan kaynaklanmaktadır. TOBB ETÜ mensuplarının TOBB ETÜ’ye ulaşım konusundaki araç tercihlerinin sıralaması da bu sıralama ile paralellik göstermektedir.
4.2- Emisyon Yoğunluğu
Her eğitim kurumunun bulunduğu coğrafik konum, ölçek, kurumun yaşı vb. nedenlerden dolayı sera gazına sebep olan faaliyetleri birbirinden farklıdır. Buna ilaveten envanter kapsamı ve raporlama metodolojileri de farklılık gösterebilir. Sonuç olarak, sera gazı emisyon performanslarını bire bir karşılaştırabilmek için referans noktası oluşturmak oldukça zordur. Bu konudaki en objektif değerlendirmeyi yapabilmek için kurum içerisindeki indikatörler göz önünde bulundurularak bir referans noktası oluşturulmalıdır.
TOBB ETÜ her geçen yıl kendini yenileyen ve geliştiren bir Üniversitedir. Kısa zaman aralıkları içerisinde üniversite bünyesine yeni akademik birimler katılmakta ve buna bağlı olarak da öğrenci, akademisyen ve idari personel sayısı artmaktadır. Bununla birlikte artan nüfusun akademik ve sosyal ihtiyaçlarını karşılamak için gerçekleştirilen faaliyetler sebebiyle sera gazı emisyonlarındaki artış kaçınılmazdır. Bu sebeple artan emisyon miktarlarını artan nüfus ile orantılı olarak değerlendirmek yerinde olacaktır.

23www.tto.etu.edu.tr
4.1.3 - Scope 3: Other indirect greenhouse gas emissions
Rental Vehicles: Generally, rental vehicles are used for the needs that occur within the context of projects implemented in TOBB ETU. Among total greenhouse gas emissions, the share of greenhouse gas emissions caused by rental vehicles is 0.1%, which is negligible.
Paper: The amount of greenhouse gas emissions caused by paper consumption is almost as low as the emissions caused by rental vehicles. As a result these emissions are also negligible. The main reason for the reduction in greenhouse gases originating from paper use in 2017 compared to 2016 is due to the fact that Electronic Document Management System (EDMS) is completely put into use starting from 2017.
Water: Greenhouse gas emissions due to water consumption, which was 28.48 tCO2e in the base year had increased by 20.29% in 2017 to 34.26 tCO2e. As the emission factor remained constant between 2016 and 2017, the reason for the increase in these emissions is directly the 20.29% increase in water consumption. The ratio of greenhouse gas emissions due to water consumption to Scope 3 emissions is 0.4%, and the ratio to total emissions is 0.2%.
Transportation to Campus: It is the greenhouse gas emissions originating from transportation of TOBB ETU members using motor vehicles from their residences to the campus and vice versa. Total emissions for transportation to campus were 7828.22 tCO2e in 2016, which increased by 2.8% in 2017 to 8050.75 tCO2e. The greenhouse gas emissions originating from transportation to and from the campus account for 47.5% of the total emissions and 99% of the Scope 3 emissions. With these rates, it constitutes the largest source of emissions in total inventory. In this source of emission, which is analyzed under three sub-sections, the greatest emission is caused by automobile transportation, and service buses and public transportation come second and third. Vehicle preference of TOBB ETU members in transportation is also parallel with this order.
4.2- Emission Intensity
For each educational institution, activities that cause greenhouse gases are different from each other due to reasons such as their geographical location, scale, and the age of the institution. In addition, inventory scope and reporting methodologies may also vary. As a result, it is quite difficult to establish a reference point for one-to-one comparison in terms of greenhouse gas emission performances of different institutions. In order to make the most objective assessment in this regard, a reference point should be established by considering the indicators within the institution.
TOBB ETU is a University that renews and develops itself every year. Within short periods of time, new academic units are added to the university, and as a result, the number of students, academicians, and administrative staff also increase. Accordingly, increase in greenhouse gas emissions is inevitable due to activities performed to meet the academic and social needs of the increasing population. For this reason, it would be appropriate to evaluate the increasing amount of emissions in direct proportion to the increasing population.

24 www.tto.etu.edu.tr
Emisyon yoğunluğu ifadesi kişi başına düşen sera gazı emisyonlarını ifade etmektedir. Şekil 5’te görüleceği üzere TOBB ETÜ’nün kişi başına düşen emisyon miktarı temel yıl ile karşılaştırıldığında hem toplam emisyonlarda hem de ayrı ayrı tüm kapsamlarda düşüş göstermiştir. Toplam emisyonlar %0,78, Kapsam 2 emisyonları %3,38 ve Kapsam 3 emisyonları %2,90 artış gösterirken Kapsam 1 emisyonları %6,41 oranında azalmış ve buna karşılık olarak da TOBB ETÜ mensubu kişi sayısı %4,7oranında artmıştır. Bu verilerin sonucunda ise kişi başına düşen toplam emisyonlar %3,38 azalarak 2,37 tCO₂e’dan 2,28 tCO₂e’a, kişi başına düşen Kapsam 1 emisyonları %10,64 azalarak 0,58 tCO₂e’dan 0,52 tCO₂e’a, kişi başına düşen Kapsam 2 emisyonları %1,29 azalarak 0,68 tCO₂e’dan 0,67 tCO₂e’a ve kişi başına düşen Kapsam 3 emisyonları da %1,75 azalarak 1,11 tCO₂e’dan 1,10 tCO₂e’a inmiştir.
2,52,42,32,22,121,91,81,71,61,51,41,31,21,110,90,80,70,60,50,40,30,20,10
Kişi
Başın
a dü
şen
emisy
on (t
CO₂e
)Şekil 5- Kişi Başına Düşen Sera Gazı Emisyoları
2016 2017
Toplam Emisyonlar 2,37 2,28
Kapsam 1 0,58 0,52
Kapsam 2 0,68 0,67
Kapsam 1 1,11 1,10

25www.tto.etu.edu.tr
The term "emission intensity" refers to greenhouse gas emissions per capita. As can be seen in Figure 5, the per capita emissions of TOBB ETU have declined in both total emissions and in all scopes individually, when compared to the base year. While total emissions, Scope 2 emissions, and Scope 3 emissions increased by 0.78%, 3.38%, and 2.90%, respectively, and Scope 1 emissions decreased by 6.41%, the number of TOBB ETU members increased by 4.7%. As a result of these data, total per capita emissions decreased by 2.38% from 2.37 tCO2e to 2.28 tCO₂e, while the per capita Scope 1 emissions decreased by 10.64% from 0.58 tCO2e to 0.52 tCO₂e, per capita Scope 2 emissions decreased by 1.29% from 0.68 tCO2e to 0.67 tCO2e, and per capita Scope 3 emissions decreased by 1.75% from 1.11 tCO₂e to 1.10 tCO₂e.
2,52,42,32,22,121,91,81,71,61,51,41,31,21,110,90,80,70,60,50,40,30,20,10
Emiss
ions
Per
Cap
ita (t
CO₂e
)
Figure 5- GHG Emissions Per Capita
2016 2017
Total Emissions 2,37 2,28
Scope 1 0,58 0,52
Scope 2 0,68 0,67
Scope 1 1,11 1,10

26 www.tto.etu.edu.tr
5.1- Kapsamın Genişletilmesi ve Veri Kalitesinin Artırılmasına Yönelik Öneriler
TOBB ETÜ’nün karbon ayak izi envanteri incelemesi yapılırken özellikle Kapsam 1 (doğalgaz, okula ait araçlar ve kaçak emisyonlar-klima gazları) ve Kapsam 2 (elektrik) faaliyetlerine yönelik verilerin düzenli olarak izlendiği ve veri kalitesinin yeterli olduğu görülmüştür. Diğer taraftan, Kapsam 3 içerisine giren faaliyet sayısının artırılarak daha kapsamlı bir karbon ayak izi envanterinin hazırlanması ve erişilebilen verilerin kalitesinin yükseltilmesi için gelecek raporlama dönemlerinde emisyon kaynaklarının izlenmesine yönelik öneriler şu şekildedir:
a) Bu raporda yer alan emisyon kaynakları;
Kâğıt Tüketimi: Kâğıt tüketiminden kaynaklanan emisyonlar fatura verileri kullanılarak hesaplanmıştır. Oysa ki ofis tüketimi için kullanılan bu tarz sarf malzemelerini tamamı satın alındığı yıl içerisinde tüketilememekte ve sonraki yıla kalmaktadır. Tüketimin hangi yıla ait olduğunun daha net olarak görülebilmesi için bu tarz sarf malzemelerinin personele depo çıkış tutanağı ile teslim edilmesi önerilmektedir.
Servis Araçları: TOBB ETÜ mensuplarının kampüse ulaşımının sağlanması için kullanılan servis araçlarına ait yakıt tüketimi veya araçların yaptığı kilometre hizmet sağlayan şirketten yazılı olarak temin edilmelidir.
b) Bu raporda yer almayan emisyon kaynakları
Atık: Her ne kadar ortaya çıkan tıbbi ve tehlikeli atıklarla ilgili bir kayıt sistemi oluşturulmuş olsa da bu veriler karma bir şekilde kayıt altına alındığı için envantere eklenememiştir. Tehlikeli atıkların emisyonlarının hesaplanabilmesi için atık türleri ayrı ayrı sınıflandırılmalı (örn. yağ, pil, plastik vb.) ve depolanmalı, sıvı atıklar için de hacim ölçüsü birimi yerine ağırlık ölçüsü birimi kullanılmalıdır.
Ayrıca tehlikeli olmayan atıklardan kaynaklanan emisyonların da envantere eklenebilmesi için katı atık toplama merkezlerine ve geri dönüşüm tesislerine gönderilen atıkların ağırlıklarının ayrı ayrı kayıt altına alınması gerekmektedir.
İş seyahatleri ve Konaklama: Bu faaliyetin envantere eklenebilmesi için personelin yapmış olduğu seyahatler ve konaklamaların aşağıdaki hususlar dikkate alınarak kayıt altına alınmalıdır;
İş seyahatleri için;- Seyahat türü (havayolu, karayolu veya demiryolu) - Kalkış-varış terminalleri veya şehir bilgisi
Konaklamalar için:- Konaklama yapılan oda sayısı- Konaklama yapılan ülke bilgisi
Kargo: Yapılan gönderilerin sayısı kayıt altına alınmalı ve hizmet sağlayıcı şirketlerden gönderi başına ortalama emisyon değeri talep edilmelidir.
5.2- Sera Gazı Emisyonlarının Azaltılmasına Yönelik Öneriler
Kapsamlardan bağımsız olarak envanter içerisindeki sera gazı emisyon kaynakları tek tek incelendiğinde TOBB ETÜ’nün ana emisyon yükünün sırasıyla kampüse ulaşım, elektrik tüketimi ve doğalgaz tüketiminden kaynaklandığı görülmektedir.
5- Öneri ve Hedefler
27www.tto.etu.edu.tr
5.1- Recommendations for Scope Extension and Enhancing Data Quality
While examining carbon footprint inventory of TOBB ETU, it is seen that data on Scope 1 (natural gas, school vehicles, and fugitive emissions/air conditioning gases) and Scope 2 (electricity) activities were monitored regularly, and data quality was adequate. On the other hand, suggestions are given below for monitoring emission sources in future reporting periods in order to increase the number of activities included in Scope 3 and prepare a more comprehensive carbon footprint inventory, and to improve the quality of accessible data:
a) Emissions sources included in this report;
Paper consumption: Emissions from paper consumption are calculated using invoice data. However, such consumables used for office consumption may not be used completely within the year of purchase, and some of the consumables remain to be used the following year. It is recommended that this type of consumables should be delivered to the staff together with the storage output record so as to be able to see the year of consumption more clearly.
Service Vehicles: Fuel consumption of the service vehicles used by the TOBB ETU members to provide campus access, or the mileage of the vehicles must be obtained in writing from the company providing the service.
b) Emission sources not included in this report
Waste: Although a registration system has been established for generated hazardous wastes, these data could not be added to the inventory since they are recorded without any separation. In order to calculate the emissions of hazardous wastes, they should be classified and stored separately (e.g. oil, battery, plastic, etc.) and for liquid wastes, weight measurement unit should be used, as well.
Moreover, in order to allow addition of emissions originating from non-hazardous wastes to the inventory, the weights of the wastes sent to solid waste collection centers and recycling facilities are required to be recorded separately.
Business trips and accommodation: In order to be able to add this activity to the inventory, the trips made and accommodation used by the staff needs to be recorded taking into account the following aspects;
For business trips;- Type of trip (airline, highway, or railway) - Departure-arrival terminals or city information
For accommodation:- Number of rooms used for accommodation- Country information of the accommodation
Courier: The number of deliveries must be recorded and the average emission value per shipment must be requested from service provider companies.
5.2- Recommendations for Reducing Greenhouse Gas Emissions
When the greenhouse gas emission sources in the inventory are examined individually and independent from the scopes, it is seen that the main emission load of TOBB ETU originates from transportation to campus, electricity consumption, and natural gas consumption, respectively.
5- Recommendations and Targets

28 www.tto.etu.edu.tr
Şekil 6’da da görüldüğü gibi bu emisyon kaynakları toplam emisyonların %99’unu oluşturmaktadır. Bu sebeple sera gazı emisyonlarında ölçeklenebilir azalma sağlamak için bu emisyon kaynaklarına odaklanılmalıdır.
Elektrik: Satın alınan elektrik sebebiyle oluşan emisyonlar toplam emisyonların %30’unu oluşturmaktadır. TOBB ETÜ mensuplarının elektriği tasarruflu kullanması konusunda bilinçlendirilmesi ve bir otokontrolün sağlanması elektrik tüketimi kaynaklı emisyonların azaltılması için oldukça önemlidir.
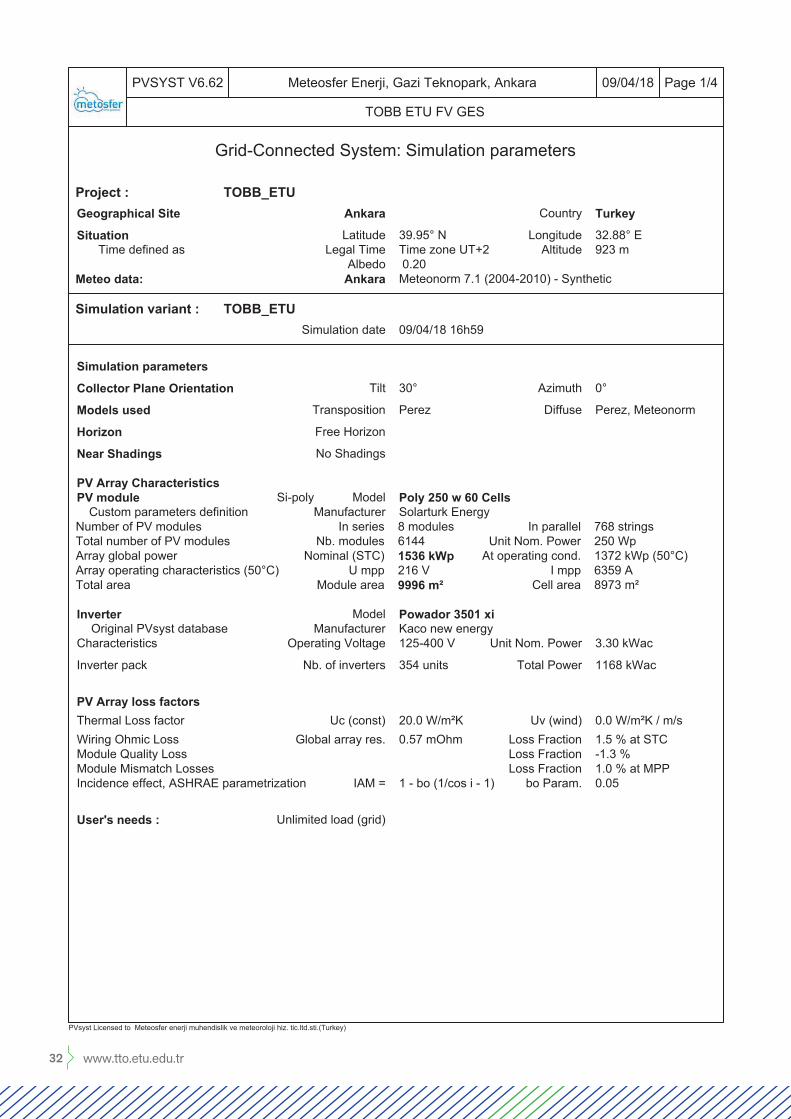
Elektrik tüketiminden kaynaklanan emisyonları azaltmanın diğer bir yöntemi de yenilenebilir enerji kaynaklarından faydalanmaktır. Veri ve gözleme dayanan analizler sonucunda TOBB ETÜ kampüsü içerisinde yer alan binaların çatılarında güneş enerjisinden elektrik üretimi için kullanıma elverişli olan minimum 10.000 m2 alan olduğu tespit edilmiştir. Meteorolojik ölçüm ve yenilenebilir enerji projeleri için danışmanlık hizmetleri veren Metosfer Enerji Mühendislik ve Meteoroloji Hizmetleri Ticaret Ltd. Şti. tarafından yapılan ön fizibilite çalışmasına göre bu alan üzerine yaklaşık 1,5 MW üretim kapasitesine sahip bir güneş enerjisinden elektrik üretim tesisi kurulabilmektedir. Böyle bir tesisin hayata geçirilmesi sonucunda yıllık elektrik üretiminin 2.021 MWh olacağı öngörülmektedir. Bu miktardaki elektrik enerjisinin yenilenebilir bir kaynaktan sağlanması sonucunda elektrik tüketiminden kaynaklanan sera gazı emisyonları %20 oranında azalacaktır.
Yatırım maliyeti, geri dönüş süreleri ve diğer teknik bilgilerin yer aldığı ön fizibilite çalışması Bölüm 6.1’de detaylı bir şekilde incelenebilir.
Doğalgaz: Doğalgaz sebepli emisyonların azaltılması için öncelikle mutlaka teknik danışmanlık alınarak durum tespit çalışması yapılmalı ve kazan sızdırmazlıkları kontrol edilmelidir. Bunun dışında periyodik olarak baca gazı analizörü kullanma alışkanlığı kazanılmalı ve kazan suyu sıcaklığı gereğinden yüksek tutulmamalıdır. Tasfiye edilmiş su ve kondens suyu ile kazan suyu takviye edilmeli ve bu su mümkün olduğu kadar yüksek sıcaklıkta olmalıdır.
Kampüse Ulaşım: TOBB ETÜ’nün sera gazı envanterinde en büyük paya sahip olan emisyonlardır. Bu emisyonlarda azaltıma gidilebilmesi için öğrenciler ve personel mutlaka servis kullanımına teşvik edilmelidir. Özellikle öğrencilerin yaşadıkları bölgelere yönelik bir haritalama çalışması yapılarak optimum servis güzergahları ve sayısı belirlenmelidir.
Toplam sera gazı emisyonları içerisinde ana emisyon kaynakları kadar yer tutmasalar da kâğıt ve su tüketiminin azaltılması konusunda gerekli önlemler alınmalıdır. Unutulmamalıdır ki kâğıdın hammaddesi iklim değişikliği ile mücadelede en önemli enstrümanlardan biri karbon depolama yeteneğine sahip olan ağaçlardır. Su kaynakları ise iklim değişikliğinden etkilenen en önemli ve hayati kaynaktır.
47%
22%
1%
30%22%
6%
19%Elektrik
Doğalgaz
Diğer
Kampüse Ulaşım - Servis
Kampüse Ulaşım - Toplu Taşıma
Kampüse Ulaşım - Otomobil
Şekil 6- Ana Emisyon Kaynakları

29www.tto.etu.edu.tr
As shown in Figure 6, these emission sources constitute 99% of the total emissions. Therefore, these emission sources should be focused on to achieve a scalable reduction in greenhouse gas emissions.
Electricity: Emissions from purchased electricity form 30% of total emissions. Raising awareness of TOBB ETU members about saving electricity and ensuring their autocontrol is quite important for reducing the emissions caused by electricity consumption.
Another method of reducing emissions originating from electricity consumption is to make use of renewable energy sources. As a result of the analyses based on data and observation, it is determined that the roofs of the buildings located within the TOBB ETU campus have a minimum area of 10.000 m2, which is suitable for production of electricity from solar energy. According to the pre-feasibility study made by Metosfer Enerji Mühendislik ve Meteoroloji Hizmetleri Ticaret Ltd. Şti., which provides consultancy services for meteorological measurement and renewable energy projects, a solar energy-based power generation plant with a production capacity of 1.5 MW can be established on this field. As a result of establishing such a facility, it is predicted that annual electricity generation would be 2021 MWh. As a result of supplying such amount of electricity from a renewable source, greenhouse gas emissions originating from electricity consumption will be reduced by 20%.
Preliminary feasibility studies including investment costs, ROI, and other technical information can be examined in detail in Section 6.1.
Natural gas: In order to reduce emissions due to natural gas, first of all, technical consultancy service must be received to assess the situation and boiler sealing should be checked. Apart from this, the habit of periodically using stack gas analyzer should be formed, and the boiler water temperature should not be kept higher than needed. Boiler water should be supplemented with discharged water and this water should be kept at a temperature as high as possible.
Transportation to Campus: These are the emissions that have the largest share in the greenhouse gas inventory of TOBB ETU. Students and staff must be encouraged to use service buses in order to ensure reduction in these emissions. Optimal service bus routes and numbers should be determined by conducting a mapping study especially for the regions where students live.
Necessary measures should also be taken in reducing paper and water consumption, even though they do not take up as much space as the main emission sources among total greenhouse gas emissions. It should be remembered that the raw materials of paper are among of the most significant instruments in the fight against climate change, trees, which have very high carbon-storing capacity. Water resources are the most significant and vital resources that are affected from the climate change.
47%
22%
1%
30%22%
6%
19%Electricity
Natural Gas
Other
Transportation to Campus - Service
Transportation to Campus - Public Transportation
Transportation to Campus - Automobile
Figure 6- Main Emission Sources

30 www.tto.etu.edu.tr
5.3- Sera Gazı Emisyonlarının Azaltılmasına Yönelik Hedefler
Avrupa Komisyonu‘nun belirlemiş olduğu iklim stratejileri ve hedefleri ile paralel olarak TOBB ETÜ 2030 yılına kadar;
• Kullandığı enerjinin %27’sini yenilenebilir enerji kaynaklarından elde etmeyi, ve• Enerji verimliliği uygulamalarıyla %27 oranında enerji tasarrufu yapmayı hedeflemektedir.
Avrupa Komisyonunun bir başka temel hedefi 2030 yılına kadar 1990 yılına kıyasla sera gazı emisyonlarını %40 oranında azaltmaktır. TOBB ETÜ, 2004 yılında eğitim-öğretim faaliyetlerine başlamış ve ilk sera gazı emisyon envanteri hazırlama çalışmaları bu raporla birlikte başlamıştır. Dolayısıyla 1990 yılı ile kıyaslanabilecek bir referans noktası yoktur. Fakat yukarıda belirtilen hedeflerin gerçekleştirilmesi ve paydaşlarla yapılan görüşmeler sonucunda 2030 yılına kadar 2016 yılına kıyasla sera gazı emisyonlarının %20 oranında azaltılması hedeflenmektedir. Diğer taraftan, iklim değişikliği konusunda farkındalığı ve bilinci yüksek öğrenciler yetiştirmeyi hedefleyen TOBB ETÜ, mezunlarının görev aldığı kurumlarda da bu bilincin oluşmasını sağlamayı ve sera gazı emisyonlarının azaltılması konusunda daha geniş bir etki yaratmayı hedeflemektedir.
Gelecek 12 yıl süresince bu hedeflere ulaşmak için projeler üretilecek ve bu projelerin hayata geçirilmesi için gerekli olan finansmana erişim için çaba sarf edilecektir.

31www.tto.etu.edu.tr
5.3- Targets for Reducing Greenhouse Gas Emissions
In parallel with the climate strategies and targets set by the European Commission, until 2030, TOBB ETU aims to;
• Obtain 27% of the energy it consumes, from renewable energy sources, and• Ensure 27% energy saving by energy efficiency applications.
Another fundamental target of the European Commission is to cut its greenhouse gas emissions by 40% by 2030, compared with 1990 levels. TOBB ETU had only started its education activities in 2004, and preparation of first GHG inventory was initiated with this report. Therefore, the required reference point to compare with the 1990 is not available. However, as a result of realizing the above mentioned targets and outcomes of the stakeholder meetings, TOBB ETU aims to reduce its GHG emissions by 20% by 2030, compared with 2016 levels. On the other hand, TOBB ETU aims to train students who have awareness of climate change and aims to create a wider impact on reduction of greenhouse gas emissions by indirectly raising this awareness also in the institutions where its graduates are involved.
Within the next 12 years, projects will be produced to achieve these goals and efforts will be made to access the financing required to realize these projects.
32 www.tto.etu.edu.tr
Page 1/409/04/18PVSYST V6.62 Meteosfer Enerji, Gazi Teknopark, Ankara
TOBB ETU FV GES
Grid-Connected System: Simulation parameters
PVsyst Licensed to Meteosfer enerji muhendislik ve meteoroloji hiz. tic.ltd.sti.(Turkey)
Project : TOBB_ETUGeographical Site Ankara Country Turkey
Situation Latitude 39.95° N Longitude 32.88° ETime defined as Legal Time Time zone UT+2 Altitude 923 m
Albedo 0.20Meteo data: Ankara Meteonorm 7.1 (2004-2010) - Synthetic
Simulation variant : TOBB_ETUSimulation date 09/04/18 16h59
Simulation parameters
Collector Plane Orientation Tilt 30° Azimuth 0°
Models used Transposition Perez Diffuse Perez, Meteonorm
Horizon Free Horizon
Near Shadings No Shadings
PV Array CharacteristicsPV module Si-poly Model Poly 250 w 60 Cells
Manufacturer Solarturk EnergyCustom parameters definitionNumber of PV modules In series 8 modules In parallel 768 stringsTotal number of PV modules Nb. modules 6144 Unit Nom. Power 250 WpArray global power Nominal (STC) 1536 kWp At operating cond. 1372 kWp (50°C)Array operating characteristics (50°C) U mpp 216 V I mpp 6359 ATotal area Module area 9996 m² Cell area 8973 m²
Inverter Model Powador 3501 xiManufacturer Kaco new energyOriginal PVsyst database
Characteristics Operating Voltage 125-400 V Unit Nom. Power 3.30 kWac
Inverter pack Nb. of inverters 354 units Total Power 1168 kWac
PV Array loss factorsThermal Loss factor Uc (const) 20.0 W/m²K Uv (wind) 0.0 W/m²K / m/sWiring Ohmic Loss Global array res. 0.57 mOhm Loss Fraction 1.5 % at STCModule Quality Loss Loss Fraction -1.3 %Module Mismatch Losses Loss Fraction 1.0 % at MPPIncidence effect, ASHRAE parametrization IAM = 1 - bo (1/cos i - 1) bo Param. 0.05
User's needs : Unlimited load (grid)

33www.tto.etu.edu.tr
Page 2/409/04/18PVSYST V6.62 Meteosfer Enerji, Gazi Teknopark, Ankara
TOBB ETU FV GES
Grid-Connected System: Main results
PVsyst Licensed to Meteosfer enerji muhendislik ve meteoroloji hiz. tic.ltd.sti.(Turkey)
Project : TOBB_ETUSimulation variant : TOBB_ETU
Main system parameters System type Grid-ConnectedPV Field Orientation tilt 30° azimuth 0°PV modules Model Poly 250 w 60 Cells Pnom 250 WpPV Array Nb. of modules 6144 Pnom total 1536 kWpInverter Model Powador 3501 xi Pnom 3300 W acInverter pack Nb. of units 354.0 Pnom total 1168 kW acUser's needs Unlimited load (grid)
Main simulation resultsSystem Production Produced Energy 2021 MWh/year Specific prod. 1316 kWh/kWp/year
Performance Ratio PR 82.42 %
Investment Global incl. taxes 1476595 US$ Specific 0.96 US$/WpYearly cost Annuities (Loan 6.0%, 20 years) 128736 US$/yr Running Costs 0 US$/yrEnergy cost 0.06 US$/kWh
Jan Feb Mar Apr May Jun Jul Aug Sep Oct Nov Dec0
1
2
3
4
5
6
7
8
Nor
mal
ized
Ene
rgy
[kW
h/kW
p/da
y]
Normalized productions (per installed kWp): Nominal power 1536 kWp
Yf : Produced useful energy (inverter output) 3.6 kWh/kWp/dayLs : System Loss (inverter, ...) 0.22 kWh/kWp/dayLc : Collection Loss (PV-array losses) 0.55 kWh/kWp/day
Jan Feb Mar Apr May Jun Jul Aug Sep Oct Nov Dec0.0
0.2
0.4
0.6
0.8
1.0
Perf
orm
ance
Rat
io P
R
Performance Ratio PR
PR : Performance Ratio (Yf / Yr) : 0.824
TOBB_ETUBalances and main results
GlobHor DiffHor T Amb GlobInc GlobEff EArray E_Grid PR
kWh/m² kWh/m² °C kWh/m² kWh/m² MWh MWh
January 51.6 27.31 -1.20 76.0 73.9 111.5 104.8 0.897
February 66.0 40.39 0.30 86.4 83.6 127.0 119.8 0.903March 97.6 54.56 5.70 114.5 111.1 160.1 150.8 0.858April 139.5 68.07 10.20 149.6 144.9 204.2 192.7 0.839May 163.8 86.60 15.10 161.1 155.8 214.0 201.8 0.816June 192.0 79.41 19.30 181.5 175.6 233.2 220.0 0.789July 201.2 79.69 23.30 194.6 188.5 246.1 232.2 0.777August 176.1 71.60 23.40 186.5 181.1 235.1 221.9 0.775September 126.9 61.50 17.60 146.3 142.0 190.5 179.7 0.800October 89.0 47.61 12.30 112.8 109.6 151.5 142.7 0.824November 65.3 35.19 5.50 96.6 93.7 137.7 130.0 0.876December 54.8 25.88 0.50 90.3 87.7 131.9 124.4 0.896
Year 1423.9 677.82 11.06 1596.2 1547.6 2142.7 2020.8 0.824
Legends: GlobHor Horizontal global irradiationDiffHor Horizontal diffuse irradiationT Amb Ambient TemperatureGlobInc Global incident in coll. plane
GlobEff Effective Global, corr. for IAM and shadingsEArray Effective energy at the output of the arrayE_Grid Energy injected into gridPR Performance Ratio

34 www.tto.etu.edu.tr
Page 3/409/04/18PVSYST V6.62 Meteosfer Enerji, Gazi Teknopark, Ankara
TOBB ETU FV GES
Grid-Connected System: Loss diagram
PVsyst Licensed to Meteosfer enerji muhendislik ve meteoroloji hiz. tic.ltd.sti.(Turkey)
Project : TOBB_ETUSimulation variant : TOBB_ETU
Main system parameters System type Grid-ConnectedPV Field Orientation tilt 30° azimuth 0°PV modules Model Poly 250 w 60 Cells Pnom 250 WpPV Array Nb. of modules 6144 Pnom total 1536 kWpInverter Model Powador 3501 xi Pnom 3300 W acInverter pack Nb. of units 354.0 Pnom total 1168 kW acUser's needs Unlimited load (grid)
Loss diagram over the whole year
Horizontal global irradiation1424 kWh/m²+12.1% Global incident in coll. plane
-3.0% IAM factor on global
Effective irradiance on collectors1548 kWh/m² * 9996 m² coll.
efficiency at STC = 15.39% PV conversion
Array nominal energy (at STC effic.)2380 MWh-0.8% PV loss due to irradiance level
-6.8% PV loss due to temperature
+1.2% Module quality loss
-1.0% Module array mismatch loss-1.0% Ohmic wiring loss
Array virtual energy at MPP2185 MWh
-5.6% Inverter Loss during operation (efficiency)
-2.1% Inverter Loss over nominal inv. power0.0% Inverter Loss due to power threshold0.0% Inverter Loss over nominal inv. voltage0.0% Inverter Loss due to voltage threshold
Available Energy at Inverter Output2021 MWh
Energy injected into grid2021 MWh

35www.tto.etu.edu.tr
Page 4/409/04/18PVSYST V6.62 Meteosfer Enerji, Gazi Teknopark, Ankara
TOBB ETU FV GES
Grid-Connected System: Economic evaluation
PVsyst Licensed to Meteosfer enerji muhendislik ve meteoroloji hiz. tic.ltd.sti.(Turkey)
Project : TOBB_ETUSimulation variant : TOBB_ETU
Main system parameters System type Grid-ConnectedPV Field Orientation tilt 30° azimuth 0°PV modules Model Poly 250 w 60 Cells Pnom 250 WpPV Array Nb. of modules 6144 Pnom total 1536 kWpInverter Model Powador 3501 xi Pnom 3300 W acInverter pack Nb. of units 354.0 Pnom total 1168 kW acUser's needs Unlimited load (grid)
InvestmentPV modules (Pnom = 250 Wp) 6144 units 116 US$ / unit 714480 US$Supports / Integration 26 US$ / module 161040 US$Inverters (Pnom = 3.3 kW ac) 354 units 335 US$ / unit 118518 US$
Settings, wiring, ... 82599 US$Nakliye & Lojistik 132159 US$Altyapi 115640 US$Kamusal 20000 US$Mühendislik & Isçilik 132159 US$
Substitution underworth 0 US$Gross investment (without taxes) 1476595 US$
FinancingGross investment (without taxes) 1476595 US$Taxes on investment (VAT) Rate 0.0 % 0 US$Gross investment (including VAT) 1476595 US$Subsidies 0 US$Net investment (all taxes included) 1476595 US$Annuities ( Loan 6.0 % over 20 years) 128736 US$/yearAnnual running costs: maintenance, insurances ... 0 US$/year
Total yearly cost 128736 US$/year
Energy costProduced Energy 2021 MWh / year
Cost of produced energy 0.06 US$ / kWh

36 www.tto.etu.edu.tr

Twitt
er.c
om/E
TUG
reen
Mayıs 2018Bu rapor Green Consult and Finance tarafındanTOBB EKONOMİ ve TEKNOLOJİ ÜNİVERSİTESİ adına hazırlanmıştır.
May 2018This report has been prepared by Green Consult and Finance on behalf of theTOBB UNIVERSITY of ECONOMICS and TECHNOLOGY