Embed Size (px)
Citation preview

Token Representation?: Impact of Female Reservations in Panchayati Raj
Institutions in Elections to State and National Legislatures
1 Introduction
Reservations have long formed a fundamental tenet of affirmative action in India. Quotas
for representation of various disadvantaged groups – stratified along lines of caste, economic
status, linguistic identity and gender – proliferate across public educational institutions and
government jobs. However, elections to public office have largely escaped such quotas, except
those that are caste-based.1 A major shift in this status quo occurred in 1992, when the
incumbent coalition government passed the 73rd Amendment to the Constitution, thereby
establishing the Panchayati Raj system of grassroots governance. This institutionalized a
third level of governance in India, below the existing national (Lok Sabha) and state legislatures
(Vidhan Sabhas) (Figure 1). The entire country participates in general elections to the national
Lok Sabha, each state has an assembly election to a Vidhan Sabha and every municipality
has its own Panchayats. The major responsibilities of the Panchayat are to administer local
infrastructure (public buildings, water, roads) and identify targeted welfare recipients.[4] In a
landmark move, 34% of all seats under Panchayati Raj Institutions (PRIs) were to be reserved
for women under the 73rd amendment. The policy promised to radically change Indian political
dynamics, in a time when less then 7.6% of Lok Sabha members and 3.8% of candidates in the
general elections identified as female. Another constitutional amendment passed in September
2009 increased PRI quotas for women to 50%. By the general elections in 2014, 19 of 28
provinces and union territories had implemented the 50% reservation (Figure 2).2
This paper will seek to examine if the 2009 increase in mandated female representa-
tion in PRIs from 34% to 50% had an impact on female candidates’ performance in Lok Sabha
and Vidhan Sabha elections, where there continue to be no quotas for women. In doing so,
I seek to understand if reservations indeed change voter behavior. One can expect that the
185 (15.6%) and 48 (8.9%) seats of 543 constituency Lok Sabha are reserved for candidates from Scheduled
Castes (SC) and Scheduled Tribes (ST) respectively. SC and ST groups comprise 16.6% and 8.6% of the
country’s population, as per the 2011 national census. [1] 2In the same year, the 108th Amendment to the Constitution, proposing 50% reservation of women in the
Lok Sabha, failed to pass.
1
Bharadwaj: Token Representation?: Upward Impact of Reservations for Female Candidates
Published by Dartmouth Digital Commons, 2018

Figure 1: Structure of governance in India
Figure 2: States that implemented 2009 amendment for 50% reservation in PRIs
2
Dartmouth Undergraduate Journal of Politics, Economics and World Affairs, Vol. 1 [2018], Iss. 2, Art. 10
https://digitalcommons.dartmouth.edu/dujpew/vol1/iss2/10

reservations for women have a positive impact on voter attitudes towards female policymakers,
improving female candidates’ performance in elections. Given that largely the same electorate
votes for candidates at differing levels of government, it is likely that change in attitudes to-
wards candidates at one level impacts elections to higher levels of government. I will seek to
test this hypothesis through my analysis. While existing literature on the topic has exam-
ined the change in voter attitudes towards female candidates at the same level of government
(i.e. Panchayati Raj), this paper contributes to literature by examining the upward impact of
quotas in PRIs on elections to levels of government that do not have reservations for female
candidates, thus giving a better indication of underlying change in general voter behaviour.
2 Background
Historically, attitudes towards female empowerment in India have been regressive. The me-
dieval ages bore witness to practices like sati – when widowed wives were burnt on the pyre
alongside their dead husbands – dowry, child marriage, and rampant discrimination, com-
pounded by oppressive societal structures like the caste system. Nineteenth and twentieth
century India saw significant strides towards greater female representation in public life. Sev-
eral of the independence movement’s greatest leaders were women. The likes of Sarojini Naidu,
Annie Beasant, and Vijaya Lakshmi Pandit broke the conventional mould society crafted for
women. They appeared in public life, campaigned before masses and advocated for Indian
freedom from British colonial rule. Upon independence in 1947, the country adopted a Con-
stitution far more progressive than the society it was drafted for. The Constitution enshrined
universal adult suffrage, preceding several powerful democracies in the West, and by 1966 In-
dira Gandhi was elected as the first female head of state, an achievement yet to be realised in
the US.
However, these singular achievements do not reflect broader trends in society. While
the status of women in Indian society has progressively improved since independence, twenty-
first century India faces challenges from sexual harassment, female foeticide, and dismal levels
of female participation in public and professional life. The country ranked 130th on UNDP’s
gender inequality index, which considers metrics such as female labor force participation, ed-
3
Bharadwaj: Token Representation?: Upward Impact of Reservations for Female Candidates
Published by Dartmouth Digital Commons, 2018

Figure 3: State-wise sex ratio, Census 2011
ucation, maternal mortality and representation in Parliament. [11] The literacy rate among
women is 65.46% compared to 82.14% for men. [1] While women form over 80% of the infor-
mal sector employed in agriculture and dairy, they account for less than 30% of the population
engaged in paid work. [9] Attitudes towards gender also vary dramatically across the country.
This is reflected in the range of sex ratios across states (Figure 3). Sex-selective abortion and
female infanticide are especially rampant in North Indian states. Haryana has only 834 female
children per 1000 males – one of the most skewed sex ratios in the world. Similar geographical
discrepancies can be noted in the number of cases of dowry deaths reported (Figure 15). India
has also gained international infamy for incidents of violence against women. A spate of brutal
rape cases in 2012 mobilised large parts of the country to advocate for female empowerment.
These social movements had political ramifications, with parties tweaking their platforms to
appeal to the popular mood, and coincided with the institution of 50% reservation in PRIs.
Political attitudes towards female candidates and voters thus changed dramatically between
the 2009 and 2014 elections.
Female political participation has increased since independence but representation
in legislative houses remains abysmally low. The rate of voter turnout among women for Lok
Sabha elections in 1962 was 46.63% (compared to 63.63% for men) and rose to 65.63% in 2014
4
Dartmouth Undergraduate Journal of Politics, Economics and World Affairs, Vol. 1 [2018], Iss. 2, Art. 10
https://digitalcommons.dartmouth.edu/dujpew/vol1/iss2/10

(versus 67.09% for men) (Figure 4). This was as female representation peaked in the 16th
Lok Sabha, elected in 2014, when 11.5% of seats were won by female candidates and 7.6%
of contestants were women (Figure 4). This places India at the 151st position in the UNDP
rankings based on proportion of female members of Parliament, behind countries like Iraq,
Jordan and Senegal, that perform worse on other metrics. [11] However, broader measures
of political participation, such as representation and engagement at state level elections, as
measured by the World Economic Forum, place India 9th world wide, indicating greater overall
female political participation as compared to several OECD countries. [6] This may point to
some sort of glass ceiling for female representation – while female candidates are well received at
lower levels of government, they face significant barriers in advancing to the highest echelons of
power. Considering trends from past elections, one can note that while the number of female
candidates has risen significantly, more than doubling between 1999 and 2014, the number
of elected female MPs has stayed relatively stable. The overall gender composition of the
House has thus not changed. In 2014, only 368 out of 548 constituencies saw atleast one female
candidate contesting, and only 63 female candidates won a seat. However, women had a success
rate3 of about 9.4%, as opposed to 6.3% for male candidates (Figure 6). Given the high barriers
to female candidacy, it may simply be the case that female candidates are stronger on average
than their male counterparts (and hence chose to run). They may also have greater funds and
backing from the parties whose platforms they contest on.
3Success rate is defined as number of winners / number of candidates for each gender
5
Bharadwaj: Token Representation?: Upward Impact of Reservations for Female Candidates
Published by Dartmouth Digital Commons, 2018

Figure 4: Female electoral participation and representation, 1968-2009
Figure 5: Female candidacy and wins, 1963-2014
6
Dartmouth Undergraduate Journal of Politics, Economics and World Affairs, Vol. 1 [2018], Iss. 2, Art. 10
https://digitalcommons.dartmouth.edu/dujpew/vol1/iss2/10
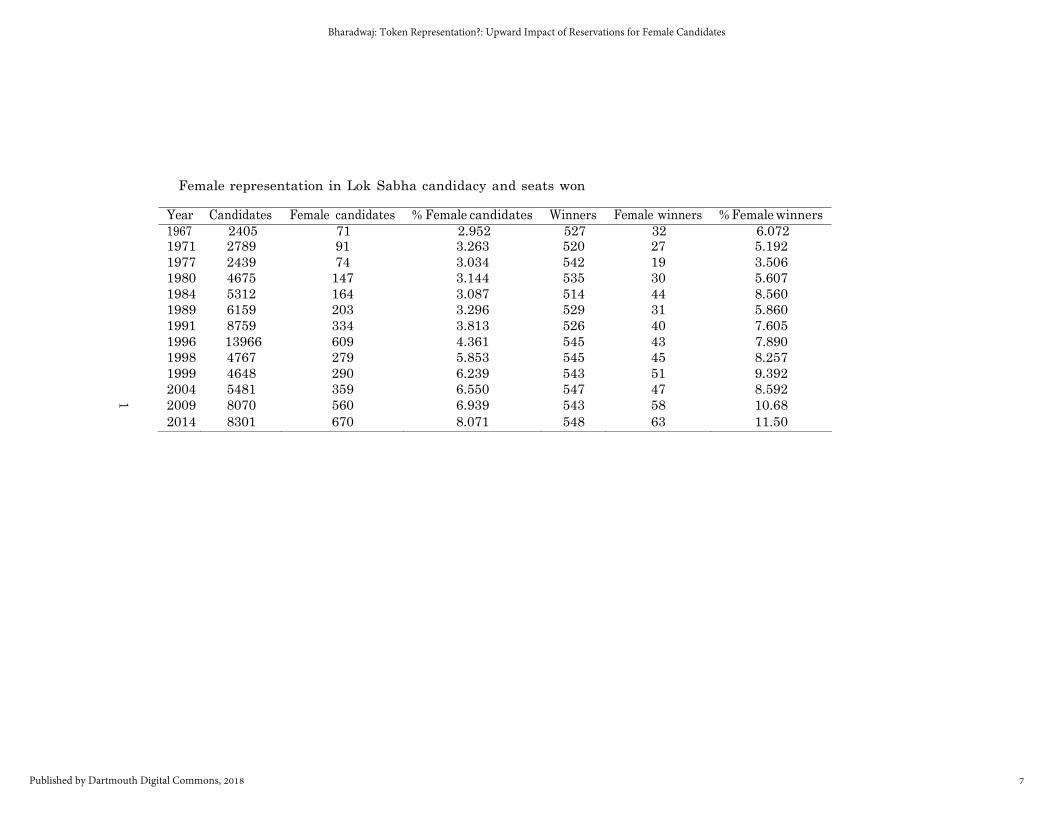
Female representation in Lok Sabha candidacy and seats won
Year
1967
Candidates
2405
Female candidates
71
% Female candidates
2.952
Winners
527
Female winners
32
% Female winners
6.072 1971 2789 91 3.263 520 27 5.192
1977 2439 74 3.034 542 19 3.506
1980 4675 147 3.144 535 30 5.607
1984 5312 164 3.087 514 44 8.560
1989 6159 203 3.296 529 31 5.860
1991 8759 334 3.813 526 40 7.605
1996 13966 609 4.361 545 43 7.890
1998 4767 279 5.853 545 45 8.257
1999 4648 290 6.239 543 51 9.392
2004 5481 359 6.550 547 47 8.592
2009 8070 560 6.939 543 58 10.68
2014 8301 670 8.071 548 63 11.50
1
7
Bharadwaj: Token Representation?: Upward Impact of Reservations for Female Candidates
Published by Dartmouth Digital Commons, 2018

Figure 6: Success rate of candidates, 1963-2009
3 Literature Review
Quotas are a popular system of mandated affirmative action across, especially with regards
to gender. These may manifest in terms of voluntary self-imposed party quotas, legislated
candidate quotas (which mandate a certain proportion of candidacies are reserved for women),
and reserved seats (which only women can contest). Of the countries that currently have
gender quotas, 61% have voluntary party quotas, 38% have legislated candidate quotas, and
20% have reserved seat. [10] Gender quotas were first introduced in Nordic countries in the
1970s, by setting a 40% target for “representation of both sexes on electoral lists.” This was
quickly followed by similar schemes in Latin America (legislated candidate quotas) and other
Western European countries (voluntary party quotas). In the Indian context, female political
participation has been the subject of much research, the large democracy affording a fertile
testing ground for regression based analyses. The 1992 introduction of reservation in PRIs
involved randomized allocation of Panchayat seats to women. This forms an important large-
scale natural experiment that can isolate the causal effects and impacts of female representation
in local leadership. Male and female political leaders often make different policy decisions,
which can have ramifications for the constituencies that elect them. Further literature has
examined the impact of quotas for women in female political participation, both as candidates
8
Dartmouth Undergraduate Journal of Politics, Economics and World Affairs, Vol. 1 [2018], Iss. 2, Art. 10
https://digitalcommons.dartmouth.edu/dujpew/vol1/iss2/10

and as voters in elections.
In a report for the World Bank, Rohini Pande (2012) lists popular arguments for and
against gender-based quotas: [10]
• Pro-quota:
1. Improves descriptive and substantive representation
2. Reduces taste-based discrimination, as a result of regressive social norms and
perceptions in the electorate
3. Increases information about the performance and competence of female candi-
dates, countering prevailing social norms and leading to the role model effect as
more women are inspired to participate in the political process
4. Improves investment in women and education, as female policy makers are
more familiar with the demands of their constituents
• Anti-quota:
1. May lead to crowding out of other minorities, as women from the most privi-
leged groups stand to benefit
2. Worsens allocation of leadership positions if female candidates are less compe-
tent or experienced than male counterparts
3. Worsens attitudes among voters if they believe their choices are restricted as a
result of the quota, or severely contradict prevailing social norms. This may lead to
a backlash effect against female candidates
The election of female policy makers has been associated with increased provision
of public goods [4], lower levels of corruption [3] and greater investment in education. [2]
Considering the 1992 reservation, Chattopadhyay and Duflo (2004) studied the impact of policy
making by female leaders the on the provision of public goods. [4] They noted that investment
in drinking water and provision of public goods significantly increased in seats reserved for
women. Female policy makers thus take decisions that more closely reflect issues that are
9
Bharadwaj: Token Representation?: Upward Impact of Reservations for Female Candidates
Published by Dartmouth Digital Commons, 2018

relevant to villagers. This indicates that female holders of political office are as, if not more,
capable as their male counterparts. Clots-Figueras (2012) and Beaman et al (2012) noted that
educational attainment rates improved in seats reserved for women councillors. [2] [8] They
found that the “gender gap in adolescent educational attainment was erased” and closed by 20
and 32% in parental and adolescent aspirations, respectively.4
These positive associations should be able to counter prevailing misogynistic prej-
udices among voters against female candidates. Observing the success of female Panchayat
members may thus improve information about female competence in policy making and moti-
vate voters to vote for female candidates in state and general elections. While exposure may
alter social perceptions, Rudman and Fairchild (2004) argue that it may also lead to a “back-
lash effect.” [12] A mandated quota may be seen as restricting voter choice or violating voters’
sense of identity with regards to a traditionally male-dominated profession. However, Beaman
et al (2009) note that through the exposure effect, quotas can improve the precision of voters’
information about the expected effectiveness of future female leaders thereby reducing statis-
tical discrimination. They write, “mandated exposure can improve the perception of women
leaders’ effectiveness by reducing the risk associated with electing a woman.” [15] They study
this phenomenon in PRIs, noting that despite an initial backlash in the first succeeding election
cycle, after ten years of quotas, women are more likely to “stand for, and win, elected positions
in councils required to have a female chief councilor in the previous two elections.” They argue
that exposure to female councilors thus improves perceptions of female leader effectiveness and
weakens stereotypes about gender roles in the public and domestic spheres. Representation
further encourages future female candidacy. Bhalotra et al (2011) note that women winning
office leads to a 9.2% increase in female candidates fielded by major political parties in sub-
sequent elections. [13] While they argue that this is a result of incumbent female candidates
being more likely to contest again (as opposed to an entry of new female candidates) there is
also an observed reduction in party bias against female candidates.
While the literature seems promising these studies have focused on the change in
voter behaviour in successive elections within one level of government – the Panchayati Raj.
4However, there were no changes in the female roles and participation in the labor market, arguing that the change in attitudes was primarily due to a ”role model effect”.
10
Dartmouth Undergraduate Journal of Politics, Economics and World Affairs, Vol. 1 [2018], Iss. 2, Art. 10
https://digitalcommons.dartmouth.edu/dujpew/vol1/iss2/10
In this paper I will examine the impact of quotas across different levels of government.
4 Methodology
4.1 Model
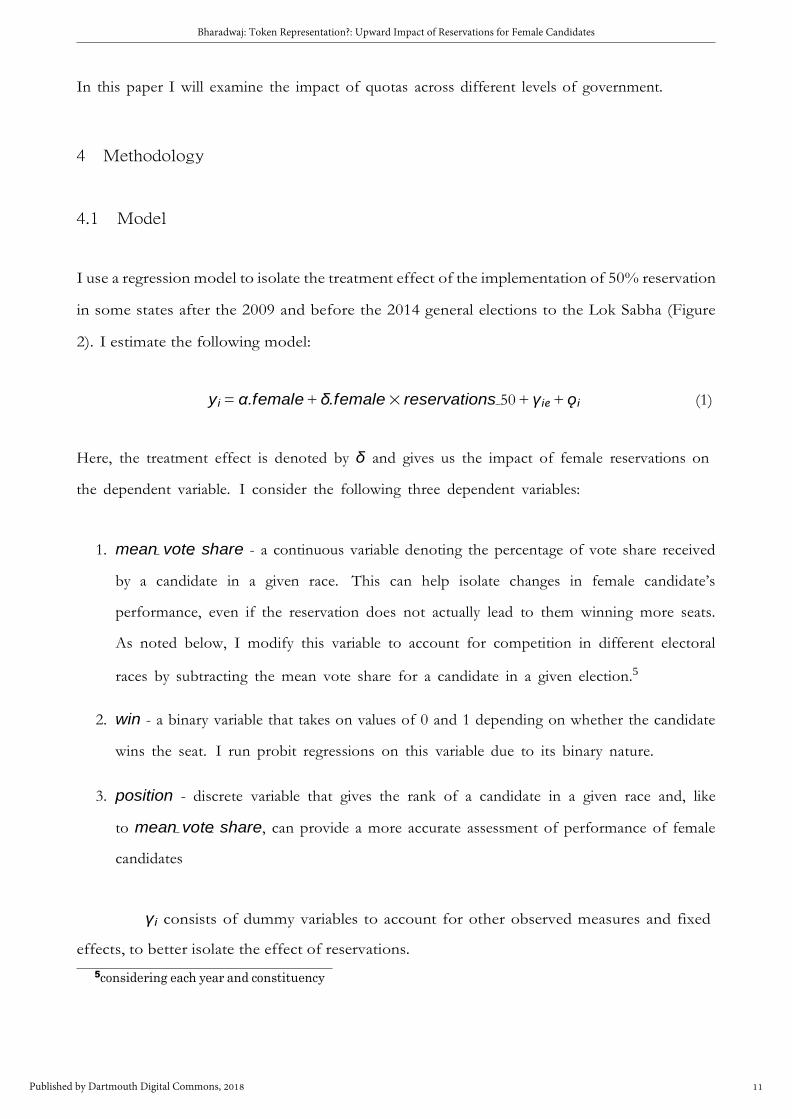
I use a regression model to isolate the treatment effect of the implementation of 50% reservation
in some states after the 2009 and before the 2014 general elections to the Lok Sabha (Figure
2). I estimate the following model:
yi = α.female + δ.female × reservations 50 + γie + ǫi (1)
Here, the treatment effect is denoted by δ and gives us the impact of female reservations on
the dependent variable. I consider the following three dependent variables:
1. mean vote share - a continuous variable denoting the percentage of vote share received
by a candidate in a given race. This can help isolate changes in female candidate’s
performance, even if the reservation does not actually lead to them winning more seats.
As noted below, I modify this variable to account for competition in different electoral
races by subtracting the mean vote share for a candidate in a given election.5
2. win - a binary variable that takes on values of 0 and 1 depending on whether the candidate
wins the seat. I run probit regressions on this variable due to its binary nature.
3. position - discrete variable that gives the rank of a candidate in a given race and, like
to mean vote share, can provide a more accurate assessment of performance of female
candidates
γi consists of dummy variables to account for other observed measures and fixed
effects, to better isolate the effect of reservations.
5considering each year and constituency
11
Bharadwaj: Token Representation?: Upward Impact of Reservations for Female Candidates
Published by Dartmouth Digital Commons, 2018

γie = β1.yeari + β2.incumbent + β3.female.incumbent + β4.turnout +
β5.female.turnout + β6.statee + β7.caste + β8.partye yeari
In particular, I include interactions between the female dummy and variables like
incumbency and turnout, to isolate any gender-specific effects in these cases. For example,
the anti-incumbency effect may be stronger against women or female candidates’ performance
may change with change in voter turnout, as less motivated or politically active members of
the electorate exercise their suffrage. I also include party interactions with year to account for
general voting trends for or against one party in a given election cycle.6 It may be possible
that more women win in an election cycle. However, if the party that is favored regardless has
more female candidates, this does not point us to a causal impact of the reservation – more
females are elected simply due to their association with the popular party.
This analysis could be made more robust by controlling for socio-economic variables
such as literacy rate, sex rate, female work force participation etc., which all point to the
community’s prevailing perceptions of gender norms. However, I was not able to find data
that is granular enough7 to improve the model’s fit. I thus rely on the assumption that these
underlying socio-economic variables would not have changed significantly over the five-year time
span between the 2009 and 2014 general elections. As a robustness check, I run a differences t-
test on the treatment and control constituencies before the increased reservation was enacted, to
ensure that female candidacy did not differ significantly before the imposition of the reservation.
While the proportion of female candidates is slightly lower in the treatment group, the difference
is not significant (Figure 7).
I further conduct this analysis through three approaches:
1. a naive regression including all seats contested and candidates winning more than 5% of
the vote share in the 2009 and 2014 elections
2. considering only those constituencies that are geographically contiguous and lie on bor-
ders of pairs of states that did and did not implement the 50% increase in reservation
6I only include dummies for the INC and BJP here since these are the two dominant parties that contest
every seat in the Lok Sabha. 7Publicly available data can only be obtained from the national census that occurs every ten years (2001,
2011, 2021) and is available at the state-level
12
Dartmouth Undergraduate Journal of Politics, Economics and World Affairs, Vol. 1 [2018], Iss. 2, Art. 10
https://digitalcommons.dartmouth.edu/dujpew/vol1/iss2/10

Figure 7: Pre-treatment (2009) difference in female candidacy in treatment and control groups
(Figure 16). I assume these groups of contiguous constituencies have similar baseline
attitudes towards women, reducing bias from unobserved differences, and allowing me to
more accurately determine the treatment effect
3. while the first two approaches consider the nation wide general elections to the Lok
Sabha, one may argue that upward impacts of reservations at the Panchayat level may
not reach the highest level of public office within five years of quota implementation.
I thus consider the performance of women in Vidhan Sabha elections before and after
the imposition of the additional reservation. This estimate may be more biased since
it is harder to isolate underlying trends from the treatment effect of the reservation as
all constituencies in a given state experience the increase in reservation and I simply
estimate the change in performance across the two Vidhan Sabha elections, with some
controls.8 It is thus difficult to conclude whether the model captures the causal effect of
reservations, or simply reflects an underlying trend due to other factors.
8States that have implemented reservation - Assam, Andhra Pradesh, Bihar, Chhattisgarh, Gujarat, Hi-
machal Pradesh, Jharkhand, Kerala, Karnataka, Madhya Pradesh, Maharashtra, Odisha, Rajasthan, Sikkim,
Tamil Nadu, Tripura, Uttarakhand, West Bengal”
13
Bharadwaj: Token Representation?: Upward Impact of Reservations for Female Candidates
Published by Dartmouth Digital Commons, 2018

4.2 Data
The primary datasets I used are sourced from the Trivedi Center for Political Data at Ashoka
University. The datasets note all candidates who contested seats in state and general elections,
and their performance in terms of votes and margins.[5] I carried out some fuzzy matching
across candidate names to generate incumbency variables. I manually coded in geographically
contiguous constituencies for the second part of my analysis. The dummy variable reserva-
tion 50 accounts for all states that implemented 50% reservation for women in PRIs following
the September 2009 legislation.
4.2.1 Reducing noise
Candidates contesting elections in India have to pay a security deposit.9 Candidates that fail
to secure more than one-sixth of the votes cast in the constituency lose their deposit. In the
2014 general elections, 84.8% of the 8,301 contesting candidates lost their deposits (Figure 8).
Digging deeper into the vote share distribution, one can note that over 74.32% of candidates
secured less than 1% of the vote in the 2014 elections (amounting to 6,169 of 8,301 candidates
contesting). One can assume that candidates who secure such small percentages of the vote
share were never serious contenders in the first place. Their performance is largely random
and not indicative of underlying voter attitudes. I seek to reduce the noise in the data and
better isolate the treatment effect of the reservations on serious contenders to these positions
by dropping all candidates who obtain less than 5% vote share.
4.2.2 By-elections
I only consider candidates running for elections during general elections in 2009 and 2014. A
small number of seats, comprising 1.3% of candidates in the dataset, are contested through by-
elections between the 2009 and 2014 general elections (Figure 9). By-elections are conducted to
fill seats that become empty usually due to the death or resignation of the sitting MP. However,
9amounting to about 25,000 INR or 350 USD for the Lok Sabha elections, and lesser sums for state assembly elections
14
Dartmouth Undergraduate Journal of Politics, Economics and World Affairs, Vol. 1 [2018], Iss. 2, Art. 10
https://digitalcommons.dartmouth.edu/dujpew/vol1/iss2/10

Figure 8: Distribution of vote shares won by candidates across the 2009, and 2014 general
elections
these are small in number and to keep comparisons consistent, I drop these candidates from
the dataset.
4.2.3 Normalizing candidate vote shares
To analyse regressions considering vote share as a dependent variable, I modify the variable by
each electoral race to make the coefficients more comparable, as the difficulty of an electoral
race may depend on the number of competent candidates contesting (Figure 17, 18). For
example, a 5% vote share gain in an a two-way electoral race implies a differing degree of
candidate strength compared to a 5% gain in a race with more than four candidates. If there
were greater number of competent candidates in a race, gaining the same amount of vote share
could require substantially larger amounts of effort. To account for this, I modify the vote share
won by each candidate in every unique electoral race (by year and constituency) by subtracting
15
Bharadwaj: Token Representation?: Upward Impact of Reservations for Female Candidates
Published by Dartmouth Digital Commons, 2018

N
N
i=1
Figure 9: Number of candidates contesting Lok Sabha seats between 2009-2014
the mean vote share in that electoral race from the candidate’s vote share.10
mean vote sharei = vote sharei − vote share, (2)
where, vote share =
Pi=1
vote sharei ,
N = number of candidates,
and P
N vote sharei = 100
10As a sanity check, I looked over the distribution of total sum of vote shares in constituencies (which in
theory should be 100% in all constituencies). An overwhelming majority of constituencies report 100% votes,
with some falling in the 97-99% range (Figure 19). The discrepancy can probably be attributed to rounding or
minor measurement errors – the modification of the vote share variable in practice thus matches the theory
16
Dartmouth Undergraduate Journal of Politics, Economics and World Affairs, Vol. 1 [2018], Iss. 2, Art. 10
https://digitalcommons.dartmouth.edu/dujpew/vol1/iss2/10

Table 1: Naive regressions across all candidates in 2009 and 2014 general elections
(1) mean vote
b/p
(2) mean vote
b/p
(3) mean vote
b/p
(4) win b/p
(5) win b/p
(6) win b/p
(7) Position
b/p
(8) Position
b/p
(9) Position
b/p main Female 2.267 0.598 -0.781 0.010 -0.088 -0.153 -0.011 0.096 0.169
(0.605) (0.886) (0.846) (0.980) (0.823) (0.700) (0.968) (0.731) (0.539) Female * Reservation 50 1.825 2.729 0.589 -0.092 0.045 -0.038 -0.052 -0.113 0.016
(0.335) (0.110) (0.732) (0.571) (0.785) (0.827) (0.664) (0.306) (0.890) Incumbent 7.647∗∗∗ 7.507∗∗∗ 7.879∗∗∗ 0.453∗∗∗ 0.569∗∗∗ 0.597∗∗∗ -0.484∗∗∗ -0.480∗∗∗ -0.493∗∗∗
(0.000) (0.000) (0.000) (0.000) (0.000) (0.000) (0.000) (0.000) (0.000) Female * Incumbent -0.644 -0.997 -1.915 -0.095 -0.118 -0.137 0.087 0.105 0.128
(0.766) (0.604) (0.312) (0.618) (0.544) (0.497) (0.496) (0.368) (0.282) Caste -2.424∗∗∗ -2.584∗∗∗ -2.503∗∗∗ 0.001 -0.006 -0.014 -0.002 0.007 0.024
(0.000) (0.000) (0.000) (0.982) (0.882) (0.735) (0.945) (0.776) (0.377) Turnout Percentage 0.034 0.044∗ 0.108∗∗ 0.003 0.004∗ 0.004 -0.006∗∗∗ -0.007∗∗∗ -0.010∗∗∗
(0.124) (0.046) (0.004) (0.188) (0.039) (0.263) (0.000) (0.000) (0.000) Female * Turnout -0.011 0.013 0.051 0.003 0.005 0.006 -0.002 -0.003 -0.005
(0.871) (0.849) (0.438) (0.628) (0.473) (0.325) (0.720) (0.476) (0.235) 2014 0.538 0.377 0.237 -0.026 -0.026 -0.024 0.018 -0.017 -0.012
(0.341) (0.584) (0.741) (0.609) (0.704) (0.739) (0.625) (0.722) (0.808) INC * 2009 8.719∗∗∗ 6.746∗∗∗ 0.628∗∗∗ 0.582∗∗∗ -0.577∗∗∗ -0.484∗∗∗
(0.000) (0.000) (0.000) (0.000) (0.000) (0.000) INC * 2014 -0.815 -3.572∗∗∗ -0.699∗∗∗ -0.764∗∗∗ 0.122∗ 0.253∗∗∗
(0.318) (0.000) (0.000) (0.000) (0.030) (0.000) BJP * 2009 3.382∗∗∗ 1.379 0.248∗∗ 0.204∗ -0.250∗∗∗ -0.159∗
(0.001) (0.143) (0.004) (0.021) (0.000) (0.017) BJP * 2014 11.720∗∗∗ 10.113∗∗∗ 1.078∗∗∗ 1.079∗∗∗ -0.678∗∗∗ -0.599∗∗∗
(0.000) (0.000) (0.000) (0.000) (0.000) (0.000) Constant 22.006∗∗∗ 18.733∗∗∗ 18.752∗∗ -0.696∗∗∗ -1.032∗∗∗ -1.095∗∗∗ 2.613∗∗∗ 2.839∗∗∗ 2.702∗∗∗
(0.000) (0.000) (0.004) (0.000) (0.000) (0.000) (0.000) (0.000) (0.000)
R-Square 0.054 0.142 0.228 0.042 0.118 0.152 Number of Cases 3263.000 3263.000 3263.000 3263.000 3263.000 3263.000 3263.000 3263.000 3263.000
1
17
Bharadwaj: Token Representation?: Upward Impact of Reservations for Female Candidates
Published by Dartmouth Digital Commons, 2018

Table 2: Regression on geographically contiguous constituencies
(1) mean vote
b/p
(2) mean vote
b/p
(3) mean vote
b/p
(4) win b/p
(5) win b/p
(6) win b/p
(7) Position
b/p
(8) Position
b/p
(9) Position
b/p main Female -16.949 -5.990 -7.470 -0.968 -0.090 -0.217 0.154 -0.555 -0.468
(0.186) (0.581) (0.498) (0.482) (0.948) (0.878) (0.865) (0.491) (0.562) Female * Reservation 50 -3.325 -2.010 -1.206 -1.126∗ -0.846 -0.939 0.383 0.308 0.326
(0.453) (0.580) (0.742) (0.038) (0.143) (0.100) (0.192) (0.234) (0.207) Incumbent 7.010∗∗∗ 7.160∗∗∗ 7.312∗∗∗ 0.349∗ 0.533∗∗ 0.557∗∗ -0.501∗∗∗ -0.516∗∗∗ -0.526∗∗∗
(0.000) (0.000) (0.000) (0.031) (0.004) (0.003) (0.000) (0.000) (0.000) Female * Incumbent 0.910 -1.280 -0.906 0.703 0.400 0.467 -0.014 0.110 0.126
(0.842) (0.723) (0.806) (0.218) (0.439) (0.376) (0.965) (0.677) (0.643) Caste -1.399 -1.686 -0.573 0.069 0.069 0.162 -0.086 -0.068 -0.142
(0.210) (0.102) (0.679) (0.471) (0.544) (0.265) (0.226) (0.325) (0.073) Turnout Percentage -0.070 -0.076 0.009 -0.000 0.001 0.003 -0.003 -0.002 0.001
(0.330) (0.263) (0.948) (0.975) (0.907) (0.810) (0.540) (0.574) (0.882) Female * Turnout 0.358 0.183 0.206 0.023 0.012 0.016 -0.010 0.001 -0.001
(0.124) (0.333) (0.278) (0.320) (0.608) (0.524) (0.537) (0.933) (0.947) 2014 1.808 -4.943∗∗ -5.772∗∗ 0.080 -1.001∗∗∗ -1.061∗∗∗ -0.102 0.343∗∗ 0.315∗
(0.252) (0.005) (0.004) (0.586) (0.000) (0.000) (0.353) (0.008) (0.033) INC * 2009 6.203∗∗ 5.713∗ 0.302 0.316 -0.360∗ -0.354∗
(0.006) (0.012) (0.160) (0.148) (0.034) (0.037) INC * 2014 8.647∗∗∗ 8.182∗∗∗ 0.596 0.644∗ -0.528∗∗∗ -0.523∗∗∗
(0.000) (0.000) (0.052) (0.035) (0.000) (0.000) BJP * 2009 3.508 3.078 -0.030 -0.014 -0.088 -0.102
(0.115) (0.158) (0.900) (0.952) (0.631) (0.581) BJP * 2014 23.644∗∗∗ 23.371∗∗∗ 2.627∗∗∗ 2.680∗∗∗ -1.452∗∗∗ -1.454∗∗∗
(0.000) (0.000) (0.000) (0.000) (0.000) (0.000) Constant 23.503∗∗∗ 21.833∗∗∗ 21.916∗∗ -0.724∗ -0.912∗ -0.965 2.675∗∗∗ 2.747∗∗∗ 2.484∗∗∗
(0.000) (0.000) (0.005) (0.026) (0.020) (0.361) (0.000) (0.000) (0.000)
R-Square 0.042 0.296 0.306 0.042 0.221 0.215 Number of Cases 425.000 425.000 425.000 425.000 425.000 425.000 425.000 425.000 425.000
2
18
Dartmouth Undergraduate Journal of Politics, Economics and World Affairs, Vol. 1 [2018], Iss. 2, Art. 10
https://digitalcommons.dartmouth.edu/dujpew/vol1/iss2/10

Table 3: State-wise regressions
(1) Assam
b/p
(2) Andhra Pradesh
b/p
(3) Chhattisgarh
b/p
(4) Gujarat
b/p
(5) Jharkhand
b/p
(6) Madhya Pradesh
b/p
(7) Maharashtra
b/p
(8) Odisha
b/p
(9) Uttarakhand
b/p Female -3.124 -7.480 -4.445 8.854 1.227 6.844 -6.380 16.819 16.436∗
(0.568) (0.319) (0.782) (0.158) (0.933) (0.352) (0.273) (0.374) (0.042) Female * Reservation 50 -1.306 1.783 -4.218 4.001 0.444 -1.174 3.368 5.837∗ 2.921
(0.603) (0.358) (0.187) (0.139) (0.900) (0.457) (0.123) (0.044) (0.362) Incumbent 5.594∗∗∗ 3.368∗∗∗ -2.435 4.937∗∗∗ 5.440∗∗∗ 0.266 9.687∗∗∗ 9.056∗∗∗ 6.002∗∗∗
(0.000) (0.000) (0.066) (0.000) (0.001) (0.687) (0.000) (0.000) (0.000) Female * Incumbent -1.190 -0.032 7.946∗∗ -3.175 2.589 0.529 -0.346 0.437 0.862
(0.645) (0.988) (0.009) (0.107) (0.577) (0.829) (0.889) (0.878) (0.769) Caste 0.230 -0.247 0.669 0.138 -0.395 -0.379 -0.115 0.019 -0.001
(0.576) (0.581) (0.106) (0.748) (0.381) (0.186) (0.772) (0.964) (0.999) Turnout Percentage -0.012 -0.051 -0.134∗∗ -0.038 0.001 -0.092∗∗ -0.027 -0.022 0.020
(0.672) (0.074) (0.002) (0.479) (0.993) (0.009) (0.313) (0.740) (0.682) Female * Turnout 0.036 0.086 0.062 -0.167 -0.015 -0.085 0.056 -0.304 -0.300∗
(0.647) (0.392) (0.782) (0.105) (0.951) (0.428) (0.603) (0.273) (0.019) year== 2007.0000 0.322 -3.439∗∗∗ 0.775 -10.576∗∗∗ 2.401 1.919∗ 0.777 -0.977 -1.667
(0.705) (0.000) (0.603) (0.000) (0.060) (0.028) (0.231) (0.472) (0.138) control INC yr1 5.610∗∗∗ 8.646∗∗∗ 16.459∗∗∗ 14.280∗∗∗ 1.116 11.449∗∗∗ 7.752∗∗∗ -5.619∗∗∗ 10.327∗∗∗
(0.000) (0.000) (0.000) (0.000) (0.444) (0.000) (0.000) (0.000) (0.000) control INC yr2 10.397∗∗∗ -7.053∗∗∗ 19.573∗∗∗ 3.138∗∗ -3.976∗ 10.227∗∗∗ -0.182 -9.700∗∗∗ 9.050∗∗∗
(0.000) (0.000) (0.000) (0.002) (0.018) (0.000) (0.824) (0.000) (0.000) control BJP yr1 -4.063∗∗ -7.793∗∗∗ 18.099∗∗∗ 18.752∗∗∗ 3.570∗∗ 16.842∗∗∗ 6.325∗∗∗ -13.589∗∗∗ 12.225∗∗∗
(0.003) (0.000) (0.000) (0.000) (0.008) (0.000) (0.000) (0.000) (0.000) control BJP yr2 -7.025∗∗∗ -4.823∗ 20.383∗∗∗ 10.156∗∗∗ 10.196∗∗∗ 18.292∗∗∗ 9.007∗∗∗ -13.915∗∗∗ 9.154∗∗∗
(0.000) (0.014) (0.000) (0.000) (0.000) (0.000) (0.000) (0.000) (0.000) Constant -1.557 4.919∗ -4.825 -1.415 -2.527 -3.428 -1.834 6.160 -5.306
(0.530) (0.036) (0.192) (0.707) (0.556) (0.188) (0.295) (0.220) (0.126)
R-Square 0.160 0.114 0.489 0.221 0.118 0.406 0.148 0.276 0.195 Number of Cases 1290.000 1753.000 485.000 1287.000 618.000 1376.000 2022.000 972.000 716.000
3
19
Bharadwaj: Token Representation?: Upward Impact of Reservations for Female Candidates
Published by Dartmouth Digital Commons, 2018

5 Results & Analysis
5.1 Impact of 2009 amendment for 50% reservation
The results from my model yield largely inconclusive or negative evidence regarding the causal
impact of quotas for women on their performance in Lok Sabha elections. Under the naive
regression (Table 1)11, I get insignificant results across my three dependent variables. The
treatment effect on vote share is weakly positive while dependent variables win and position
also pick up some negative impact of the reservation.12
The more telling analysis follows from the second, constrained dataset (Table 2).
Analysing only neighbouring constituencies in the treatment and control groups accounts for
underlying differences in prevailing social norms, that are not captured by the variables in
the model. I further include dummy variables to account for the various groupings of these
geographically contiguous constituencies (Figure 16). These models yield better fit and more
consistent coefficients. The treatment effect is seen to be negative across the models considering
vote share and win probability as the dependent variables and positive for the model considering
position – indicating worse performance by female candidates in states with 50% mandated
reservation in PRIs. Model (4) yields a significant result. Since this is a probit model, I
compute the marginal effects of the coefficients to enable interpretation (Figure 21). The
marginal effects indicate that female candidates contesting from reserved constituencies have a
38.6% lower likelihood of winning the election. However, this significance gets diminished once
party and geography controls are added, though the coefficient remains negative, indicating
some degree of backlash effect. It may seem that in geographically contiguous constituencies,
an increase mandated representation at the PRI level for the treatment constituencies, while
the status quo is maintained in the control constituencies, leads to a backlash against female
candidates contesting Lok Sabha seats in the treatment constituencies, even as underlying
social norms and perceptions remain largely the same across the two groups.
Running a naive differences t-test on the treatment group shows a significant 1.07
11Models 3, 6, 9 include state-wise fixed effects 12Position signifies rank so a positive coefficient indicates worse performance (i.e. lower rank) as the first
ranked candidate is the winner
20
Dartmouth Undergraduate Journal of Politics, Economics and World Affairs, Vol. 1 [2018], Iss. 2, Art. 10
https://digitalcommons.dartmouth.edu/dujpew/vol1/iss2/10

Figure 10: Change in female candidacy rates in treatment constituencies
Figure 11: Change in female candidacy rates across all constituencies
percentage point increase in female candidacy between the 2009 and 2014 elections (Figure 10).
However, this is in fact marginally less than the 1.13 percentage point increase seen nationwide
(Figure 11). This marginal difference concurs with the results of the regression – the effect
of the reservation seems to be insignificant and marginal at best. However, digging into this
change further, we see that there is significant fluctuation in changes across the control group,
while the change in the treatment states is consistently positive (though of smaller magnitude)
(Figure 12). Much of the control states’ outperformance is driven by an almost 10% increase in
female candidacy in Uttar Pradesh, which did not implement the reservation but is the biggest
state in India and holds 80 Lok Sabha seats.
21
Bharadwaj: Token Representation?: Upward Impact of Reservations for Female Candidates
Published by Dartmouth Digital Commons, 2018

Figure 12: State-wise change in rates of female candidacy between 2009 and 2014 elections
5.1.1 Impact on Vidhan Sabha elections
Each state in India also holds elections every five to six years. However, these elections cycles
are not synchronized and multiple states go to election each year. I sought to estimate a similar
regression model for several states that conducted elections before and after the adoption of
the 2009 change (Table 4). I carried out these regressions on vote share of candidates, to note
change in performance of female candidates. The initial results here are not very promising –
the treatment effect seems largely insignificant and there is variation in the sign and magnitude
of the coefficient across the states. However, the two models that yield best fit, Chhattisgarh
and Madhya Pradesh, also have negative coefficients on the reservation impact, in agreement
with my results from the earlier analysis.
5.2 Change in female vote share and candidacy since 1992
Current literature on the topic of mandated female representation suggests that quotas lead
to a backlash effect in the short run (one election cycle) but after ten years the observed
effects are positive as voters become acquainted with the competence of female administators
and underlying biases are altered. [15] The results from my regression based analysis are
in agreement with the backlash effect – while the effect is noisy to observe due to the several
other interacting factors when considering voter attitudes between PRIs and elections to higher
22
Dartmouth Undergraduate Journal of Politics, Economics and World Affairs, Vol. 1 [2018], Iss. 2, Art. 10
https://digitalcommons.dartmouth.edu/dujpew/vol1/iss2/10

levels of government. The effect has been consistently negative even as the magnitude is hard
to determine. However, in my earlier analyses I simply consider one succeeding election cycle,
that occurred within five years of the change in policy. It may be the case that the backlash
effect goes away after several years and female reservations ultimately lead to a new positive
equilibrium. The instatement of PRIs in 1992 could thus allow me to examine the impact of
reservations over time.
In 1992, mandated female representation was imposed in PRIs across the country,
increasing female quotas from 0% to 34%. The impact here would thus also be much more
profound than a simple increase in quota like the kind that occurred in 2009. To examine this
theory, I run Bonferonni tests on the aggregate female vote share, female candidacy and female
win percentage to note changes across election cycles.
The first general election after the instatement of the PRI occurred in 1996. The
simple difference in means indicates that women actually fared worse in these elections (Figure
13), garnering lesser aggregate vote share even as the proportion of female candidates contest-
ing increased significantly by 48.29% (Figure 14). While this is a naive estimate, and does
not control for many factors, it is telling that within one election cycle, the number of female
candidates fielded could increase so significantly. This result seems to agree with both the
role model effect – female candidates are inspired by seeing other women in strong leadership
and are motivated to contest elections – as well as the backlash effect – even as more female
candidates contest they are able to amass even less of the popular vote share. Over time, the
female vote share percentage increases significantly, and is up 1.7 percentage points by the 1998
general elections. Interestingly, a similar backlash effect is not seen between the 2009 and 2014
general elections, when female vote share increases by 2.7 percentage points. However, this
naive differences in mean estimate may simply be picking up general trends towards female
empowerment in society. The period between 2009 and 2014 general elections was particularly
important for the Indian feminist movement as noted above. Several incidents of sexual as-
sault sparked off nation-wide protests and conversations regarding female empowerment in the
country, leading to parties altering their platforms to appeal to sentiments in the electorate.
Further, while there has been a significant increase in female candidacy and vote share, this
23
Bharadwaj: Token Representation?: Upward Impact of Reservations for Female Candidates
Published by Dartmouth Digital Commons, 2018

has not been complemented by a similar significant rise in the proportion of female legislators
in the Lok Sabha (Figure 20).
6 Shortcomings
My main regression model considers the 2009 natural experiment which involved an increase in
quota from 34% to 50%, and not an instatement of quotas from scratch. The observed impacts
on voter behaviour may thus appear relatively muted since some mandated exposure to female
policymakers has already occurred due to the 34% reservation that prevailed from 1993 till the
policy change in 2009. After accounting for this fact, my paper seems to address the question of
whether an increase in mandated representation further alters voters’ perceptions and prevailing
social norms. As per the exposure and role model effect theories, and corroborated by the
results yielded by analyses, I hazard a guess that change in voter behaviour due to an increase
in quotas is incremental at best.
This paper’s biggest shortcoming is that I was not able to study the 1993 natural
experiment when quotas for women went from 0% to 34% across the entire country. This
would have allowed for a more direct comparison of no-quota versus quota scenarios, as well
as allowed me to consider more election cycles to note the long-term impact of mandated
representation. However, I faced several limitations in carrying out such an analysis. Firstly,
the 1993 policy change involved all states and constituencies in India. This makes it difficult to
isolate the causal treatment effect from underlying societal trends towards female empowerment
that would have existed regardless of the quotas. Secondly, on a more logistical note (and an
issue that can surely be solved with adequate resolve), I could not conduct more long term
analyses since I did not have constituency level data for variables such as literacy rate, sex
ratio, female infanticide rates, female workforce participation etc., that would have affected
attitudes female candidates as well. I was able to do away with this data in the 2009-2014
analysis under the assumption that underlying variables would not have changed significantly
in a five-year time span. However, any analysis exceeding ten-year or more than three election
cycles, must need to control for these socio-economic variables.
24
Dartmouth Undergraduate Journal of Politics, Economics and World Affairs, Vol. 1 [2018], Iss. 2, Art. 10
https://digitalcommons.dartmouth.edu/dujpew/vol1/iss2/10

Figure 13: Change in aggregate vote share of female candidates in constituencies
25
Bharadwaj: Token Representation?: Upward Impact of Reservations for Female Candidates
Published by Dartmouth Digital Commons, 2018

Figure 14: Change in female candidates contesting as a proportion of total candidates
26
Dartmouth Undergraduate Journal of Politics, Economics and World Affairs, Vol. 1 [2018], Iss. 2, Art. 10
https://digitalcommons.dartmouth.edu/dujpew/vol1/iss2/10

Further precision could have been achieved by mapping PRI districts to Lok Sabha
constituencies and accounting for the exact areas that had female reservation and during which
election cycles. Female reservation is randomly allocated across PRI seats and often changes
between election cycles. My analysis aggregated such effects at the state level and thus yields
a lower magnitude of the treatment effect. This would also allow the analysis be in line with
existing literature, which has noted that voters become more amenable to voting for female
candidates if their PRI seat has been reserved for women over two election cycles. [15]
7 Conclusion
In this paper I sought to analyse the impact of an increase in mandated female representation
in PRIs, on the performance of female candidates in elections to the Lok Sabha, which does
not have similar quotas for women. I found largely insignificant or slightly negative effects
of female reservation on performance of female candidates in Lok Sabha and Vidhan Sabha
elections immediately succeeding the imposition of these reservations in 2009. However, my
analysis does not account for longer run changes in voter attitudes as a result of reservation
and this forms a compelling topic for future research.
While the impact of quotas on voter behaviour remains unclear, the positive benefits
of women in policy making, especially in societies where they are historically underrepresented,
as been empirically proven. India intermittently sees calls for reservation at higher levels of
government as well, where female representation remains dismal. Even as female representa-
tion may signal the progressive nature of a society, there is some evidence of a backlash effect
that may go away (or is simply difficult to assess over time). In this context, a concept from
psychology appears particularly pertinent – moral licensing. The term describes a phenomenon
in which “past good deeds can liberate one to engage in behaviors that are immoral, unethical
or otherwise problematic, behaviors that one would otherwise avoid for fear of appearing im-
moral.” [14] Pop psychologist Malcolm Gladwell describes moral licensing in the context of the
feminist movement, noting the sexist backlash against Australia’s first female Prime Minister
Julia Gillard after her election. [7] He argues that by electing a female head of state, the
Australian populace had proved its progressiveness and then felt free to go back to its sexist
27
Bharadwaj: Token Representation?: Upward Impact of Reservations for Female Candidates
Published by Dartmouth Digital Commons, 2018
ways. While Gladwell’s argument is fraught and several other factors, especially political ones,
may have played into Gillard’s criticism, this critique did manifest itself in extremely sexist
terms. Phenomena like moral licensing may thus negate any short run positive gains to be
made from mandated female representation. There is hazard in arguing the quotas can solve
the problems of regressive social norms – mandating 34 to 50% quotas in communities where
women take up less than 10% of political seats can lead to unforeseen effects – and reduce the
quota to a form of token, statistical representation for women. However, the initial hesitancy
and backlash can lead the way to a positive equilibrium and more equitable society in the
long run, achieving change that would have otherwise taken decades to attain organically. The
question of whether quotas are indeed the best means to increase female representation thus
remains open to debate.
28
Dartmouth Undergraduate Journal of Politics, Economics and World Affairs, Vol. 1 [2018], Iss. 2, Art. 10
https://digitalcommons.dartmouth.edu/dujpew/vol1/iss2/10

References
[1] Censusindia.gov.in. 2011 Primary Census Abstract. 2011.
[2] Irma Clots-Figueras. Are Female Leaders Good for Education? Evidence from India.
American Economic Journal, 2012.
[3] Roberta Gatti David Dollar, Raymond Fisman. Are Women Really the “Fairer” Sex?
Corruption and Women in Government. Poverty Reduction and Economic Management
Network; The World Bank, Poverty Reduction and Economic Management Network.
[4] Abhijit Bhattacharya Esther Duflo. Women as Policy Makers: Evidence from a Ran-
domized Policy Experiement in India. Econometrica, September 2004.
[5] Trivedi Center for Political Data. Indian State and General Election - Candidates and
Performance. Ashoka University, 2018.
[6] World Economic Forum. The Global Gender Gap Report 2013. Schwab et al, 2013.
[7] Malcolm Gladwell. Revisionist History: The Lady Vanishes. Panoply, 2016.
[8] Rohini Pande Petia Topalova Lori Beaman, Esther Duflo. Female Leadership Raises As-
pirations and Educational Attainment for Girls: A Policy Experiment in India. Science,
2012.
[9] A.K. Shiva Menon-Sen, Kalyani; Kumar. Women in India: How Free? How Equal?
United Nations, 2001.
[10] Rohini Pande and Deana Ford. Gender Quotas and Female Leadership. World Develop-
ment Report 2012, World Bank, 2012.
[11] United Nations Development Program. Table 5: Gender Inequality Index. UNDP Human
Development Reports, 2017.
[12] Laurie A. Rudman and Kimberly Fairchild. Reactions to Counterstereotypic Behavior:
The Role of Backlash in Cultural Stereotype Maintenance. Journal of Personality and
Social Psychology, 2004.
29
Bharadwaj: Token Representation?: Upward Impact of Reservations for Female Candidates
Published by Dartmouth Digital Commons, 2018

[13] Lakshmi Iyer Sonia Bhalotra, Irma Clots-Figueras. Path-Breakers: How Does Women’s
Political Participation Respond to Electoral Success? IZA, November 2013.
[14] Rumen Iliev Sonya Sachdeva and Douglas L. Medin. Sinning Saints and Saintly Sinners:
The Paradox of Moral Self-Regulation. Psychological Science, 2009.
[15] Lori Beaman Raghabendra Chattopadhyay Esther Duflo Rohini Pande Petia Topalova.
Powerful Women: Does Exposure Reduce Bias? Quarterly Journal of Economics, 2009.
30
Dartmouth Undergraduate Journal of Politics, Economics and World Affairs, Vol. 1 [2018], Iss. 2, Art. 10
https://digitalcommons.dartmouth.edu/dujpew/vol1/iss2/10

Appendix
31
Bharadwaj: Token Representation?: Upward Impact of Reservations for Female Candidates
Published by Dartmouth Digital Commons, 2018

Figure 15: Cases of dowry deaths reported across the country
32
Dartmouth Undergraduate Journal of Politics, Economics and World Affairs, Vol. 1 [2018], Iss. 2, Art. 10
https://digitalcommons.dartmouth.edu/dujpew/vol1/iss2/10

Figure 16: Geographically contiguous constituencies across states that did and did not imple-
ment 2009 amendment
Figure 17: Normalization: Distribution of vote share percentage
33
Bharadwaj: Token Representation?: Upward Impact of Reservations for Female Candidates
Published by Dartmouth Digital Commons, 2018

Figure 18: Normalization: Distribution of vote share percentage − vote share percentage
Figure 19: Distribution of total vote shares in constituencies
34
Dartmouth Undergraduate Journal of Politics, Economics and World Affairs, Vol. 1 [2018], Iss. 2, Art. 10
https://digitalcommons.dartmouth.edu/dujpew/vol1/iss2/10

Figure 20: Change in female win percentage
35
Bharadwaj: Token Representation?: Upward Impact of Reservations for Female Candidates
Published by Dartmouth Digital Commons, 2018

Figure 21: Marginal effects for probit coefficients in Model (4), Table 2
36
Dartmouth Undergraduate Journal of Politics, Economics and World Affairs, Vol. 1 [2018], Iss. 2, Art. 10
https://digitalcommons.dartmouth.edu/dujpew/vol1/iss2/10