Embed Size (px)
Citation preview
TRANSPORTATION RESEARCH RECORD 1320 119
Toll Plaza Capacity and Level of Service
T. HucH Woo AND LESTER A. HoEL
A methodology for evaluating the capacity of a toll plaza was developed, and level-of-service (LOS) criteria for toll area traffic were established. LOS for toll facilities should be quantified for several reasons. First, quantification of the LOS would enable designers to evaluate design alternatives using accepted standards. Second, it would provide a scientifically sound basis for comparing traffic operations of various facilities. Third, it would furnish a means to evaluate before-and-after conditions and thus determine the effectiveness of any improvement. Finally, it would give the general public and legislative representatives a readily understandable and yet scientifically established measure of overall performance. Traffic data at the four plazas of the RichmondPetersburg Turnpike in Virginia were collected using synchronized video cameras. The capacity of the toll booths was found to range from 600 to 750 passenger cars per hour, depending on the type of toll collection. Average density, which is highly correlated with volume-to-capacity ratios, can be used as a criterion for defining LOS for toll plaza areas.
Toll financing has been used as a supplemental source of highway revenue since this nation was founded. The primary advantages of toll financing are (a) direct payment by each driver for services received, (b) an assured source of revenue that facilitates highway construction and maintenance, and (c) the ability to use tolls as a form of congestion pricing.
The construction of toll roads has experienced a resurgence in recent years. Numerous facilities are in varying stages of planning, design, and construction, not only across the United States but in many other countries as well. In the United States, 26 states have 4,700 mi of toll roads, bridges, and tunnels. Some 8500 km of toll highways has been built in France, Italy, and Spain (J).
Figures collected by the International Bridge, Tunnel, and Turnpike Association indicate that 16 states are considering $8.5 billion worth of proposals that would add 822 mi of toll structures (2, p. A3). One of the most innovative is an 80-km segment of the Denver metropolitan beltway in Colorado. Three Colorado counties and a small city formed the E-470 Highway Authority in 1986 to build the highway without federal or state funding (J). A feasibility study on a privately financed 400-mi toll road from Chicago to Kansas City is under way (3, p. 1). In a nationwide survey conducted in November 1988 by the Urban Transportation Monitor, 80 percent of the respondents indicated that their metropolitan area is either actively planning toll roads or will be doing so in the foreseeable future (4, p. 8). The respondents were transportation professionals involved in planning for their metropolitan area. The recent Transportation 2020 initiative by AASHTO recommended the use of toll collection as a financing option for highway construction (5, p. 72). Clearly,
T. H. Woo, Department of Transportation Engineering and Management, National Chiao Tung University, 1001 Ta Hsueh Road, Hsinchu, Taiwan 30049, Republic of China. L.A. Hoel, Department of Civil Engineering, University of Virginia, Charlottesville, Va. 22903.
there is an increased emphasis on toll roads as a method of financing urban freeways.
The basic mechanism of toll collection has remained essentially unchanged since its inception: vehicles must stop to render payment at a collection booth. Stops at toll plazas, however, impede the smooth flow of traffic and, consequently, can reduce the level of service (LOS) provided. A toll plaza can be a bottleneck on a highway if its capacity is exceeded. The public accepts the notion of a fee to pay for roads but is unwilling to wait in traffic queues to render payment. In view of the time involved in each toll collection transaction, any improvement that can save even a fraction of a second will represent a substantial increase in efficiency. Efforts are now under way to develop new intelligent vehiclehighway system technologies that eliminate or reduce the delay at toll plazas. These include exact-change lanes, flash pass lanes, and automatic vehicle identification (A VI). Nonetheless, toll facilities continue to affect overall travel time and traffic flows by requiring each vehicle to stop. Surprisingly, the effects that toll plaza collection facilities have on the LOS and capacity have received little attention by researchers and highway design specialists.
Most roadway design features (such as freeway lanes, ramps, and intersections) have nationally accepted LOS standards, but the Highway Capacity Manual (HCM) (6) is silent on the subject of LOS standards at toll plazas, and no national design guidelines exist. The LOS for toll facilities should be quantified for several reasons. First, quantification of the LOS would enable designers to evaluate design alternatives using accepted standards. Second, it would provide a scientifically sound basis for comparing traffic operations of various facilities. Third, it would furnish a means to evaluate before-andafter conditions and thus determine the effectiveness of any improvement. Finally, it would give the general public and legislative representatives a readily understandable and yet scientifically established measure of overall performance.
Capacity is one of the factors of interest in design of a toll facility. Volume-to-capacity (vie) ratios have been used in defining LOS for several highway facility types, such as basic freeway sections and rural highways. Nevertheless, the term "capacity" is not easily defined for toll facilities, and there appears to be no general agreement among traffic engineers as to its precise meaning.
There is essentially no literature describing nationally accepted design standards for toll facilities on the basis of LOS ratings. This void limits the application of a consistent nationwide design process. Neither the 1985 HCM nor its predecessor, the 1965 HCM, considers traffic characteristics at highway toll plazas. However, freeway toll plaza capacity and LOS were recognized as a research need by TRB in 1987 (7). Several reports have examined the issue of toll road financing, but few investigations of traffic characteristics at toll plazas
120
are available. Toll plaza capacities have been established by performance observation or by assumption. Considerable variation was found among these individual results (8-11). A sound theoretical basis for capacity and LOS does not exist. The LOS for toll plaza performance has been used infrequently (8,9 ,12). A review of the literature indicates that there has not been any criterion proposed as a measure of effectiveness for determining the LOS for toll facilities.
The purpose of this research was to improve the understanding of traffic characteristics at toll plazas and to develop a methodology that could be used in the analysis of lraffic operations at toll plazas.
MODEL DEVELOPMENT FOR CAPACITY AND LEVEL OF SERVICE
Capacity
A principal objective of capacity analysis is to estimate the maximum amount of traffic that can be accommodated by a given facility. Capacity analysis is also intended to estimate the service flow rate, which is the maximum amount of traffic that can be accommodated by a facility while maintaining prescribed operational qualities. The 1985 HCM (6) defines the capacity of a facility as the maximum hourly rate at which vehicles can reasonably be expected to traverse a point or uniform section of a roadway during a given period of time under prevailing roadway, traffic, and control conditions. Service flow rates are defined for each LOS rating.
A toll booth operates at full capacity when a queue is built up and the toll collector is busy at all times. When traffic is light, there is lag time between each toll culleclion, which means the toll collector is not fully occupied. The service time under a nonwaiting condition is sometimes intuitively mistaken to be shorter than it really is . Under light traffic, the toll collectors may actually consume more time than when pressured with a queue. When toll collectors are under greater pressure from a growing queue, they tend to process transactions faster.
The actual service time is affected by the number of coins that must be processed. It may also be influenced by such factors as the experience of the toll collectors, the physical dimensions of toll gates, the methods of toll collection, aml lhe presence of drivers with exact change. Manual booths with heavy-truck traffic normally have lower service volumes than those that are primarily for automobiles. Traffic congestion levels also affect service time. When queues develop, motorists have time to search for needed change before the transaction.
If nonwaiting service time is determined as t" seconds, the capacity in vehicles per hour of a toll booth occurs when the arrival rate equals 3,600/t". Service time under waiting conditions, tw, determines the processing rate in vehicles per hour as 3,600/t ... If it is assumed that tw ~ t,,, then 3,600/t,, ~ 3,600/ (,.,. However, when upstream traffic approaches 3 ,600/t,,, queues start to occur. Thus, service time t,, is no longer valid, and tw should be used. One of the many concerns of this study is the service time at traffic levels near capacity.
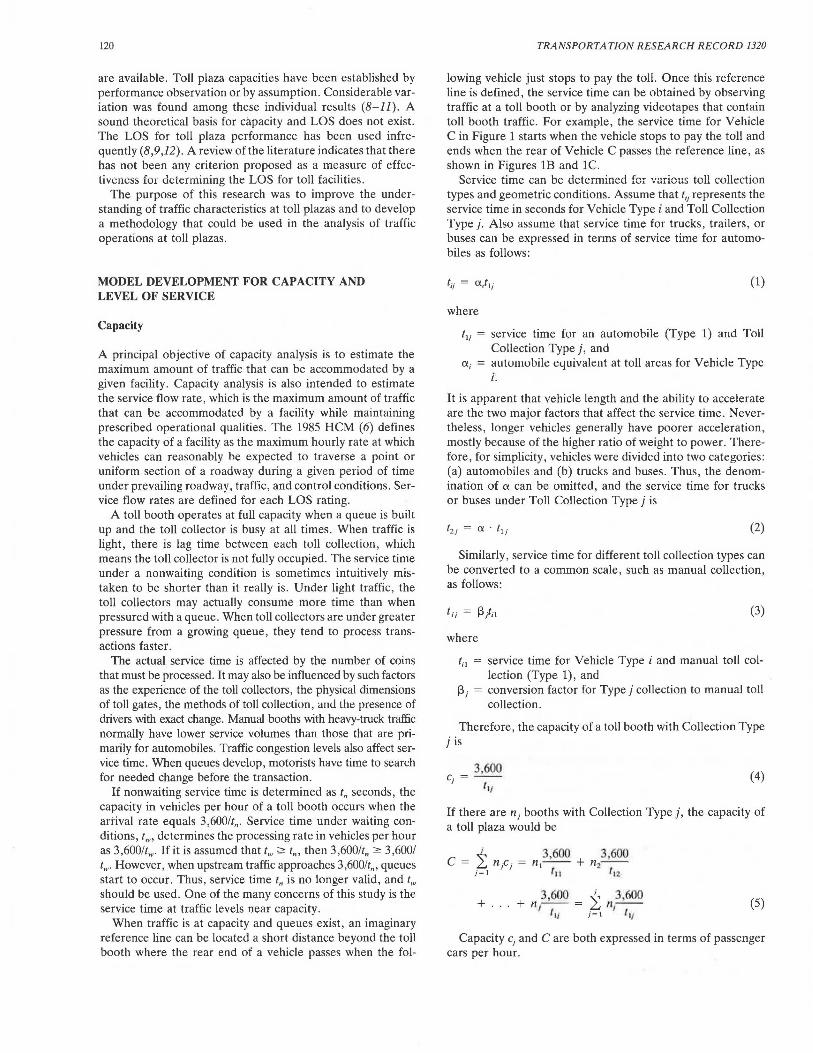
When traffic is at capacity and queues exist, an imaginary reference line can be located a short distance beyond the toll booth where the rear end of a vehicle passes when the fol-
TRANSPORTATION RESEARCH RECORD 1320
lowing vehicle just stops to pay the toll. Once this reference line is defined, the service time can be obtained by observing traffic at a toll booth or by analyzing videotapes that contain toll booth traffic. For example, the service time for Vehicle C in Figure 1 starts when the vehicle stops to pay the toll and ends when the rear of Vehicle C passes the reference line, as shown in Figures lB and lC.
Service time can be determined for various toll collection types and geometric conditions. Assume that l;i represents the service time in seconds for Vehicle Type i and Toll Collection Type j. Also assume Lhat service time for trucks, trailers, or buses can be expressed in terms of service time for automobiles as follows:
(1)
where
t1i service time for an automobile (Type 1) and Toll Collection Type j, and
IX1 = automobile equivalent at toll areas for Vehicle Type i.
It is apparent that vehicle length and the ability to accelerate are the two major factors that affect the service time. Nevertheless, longer vehicles generally have poorer acceleration, mostly because of the higher ratio of weight to power. Therefore, for simplicity, vehicles were divided into two categories: (a) automobiles and (b) trucks and buses. Thus, the denomination of IX can be omitted, and the service time for trucks or buses under Toll Collection Type j is
(2)
Similarly, service time for different toll collection types can be converted to a common scale, such as manual collection, as follows:
(3)
where
t, 1 = service time for Vehicle Type i and manual toll collection (Type 1), and
pi = conversion factor for Type j collection to manual toll collection.
Therefore, the capacity of a toll booth with Collection Type j is
3,600 c. =--' I If
(4)
If there are ni booths with Collection Type j, the capacity of a toll plaza would be
C = ~ nc. = 3,600 3600 L.i 1 1 n,- - + n2.--i-1 111 112
+. 3600 ~ 3600 + nr;-- = L.i 11,--
r1, i - 1 111
(5)
Capacity ci and C are both expressed in terms of passenger cars per hour.
Woo and Hoel
TOLL
BOOTH
l e '#JH l[IJ 111 :~I [ I ID (A)
TOLL
BOOTH
c:cna (B)
TOLL
BOOTH
(C)
A,D,E,F - AUTOMOBILE/LIGHT TRUCK
B - LARGE TRUCK
C - VAN
lDJE-1
:a I =c= I ::-:-.= I -
121
-
FIGURE 1 Vehicle movement at toll booth.
LOS
LOS is a qualitative measure describing operational conditions within a traffic stream and their perception by motorists. LOS for interrupted flow facilities, such as toll plazas, varies widely in terms of both the user's perception of service quality and the variables used to describe the operational conditions.
LOS analysis has been based on the use of one or two relatively simple measures that effectively evaluate the quality of traffic service. These measures are understood by the average motorist and are useful to the transportation analyst and to management in evaluating the relative need for specific improvements or for evaluating current operations.
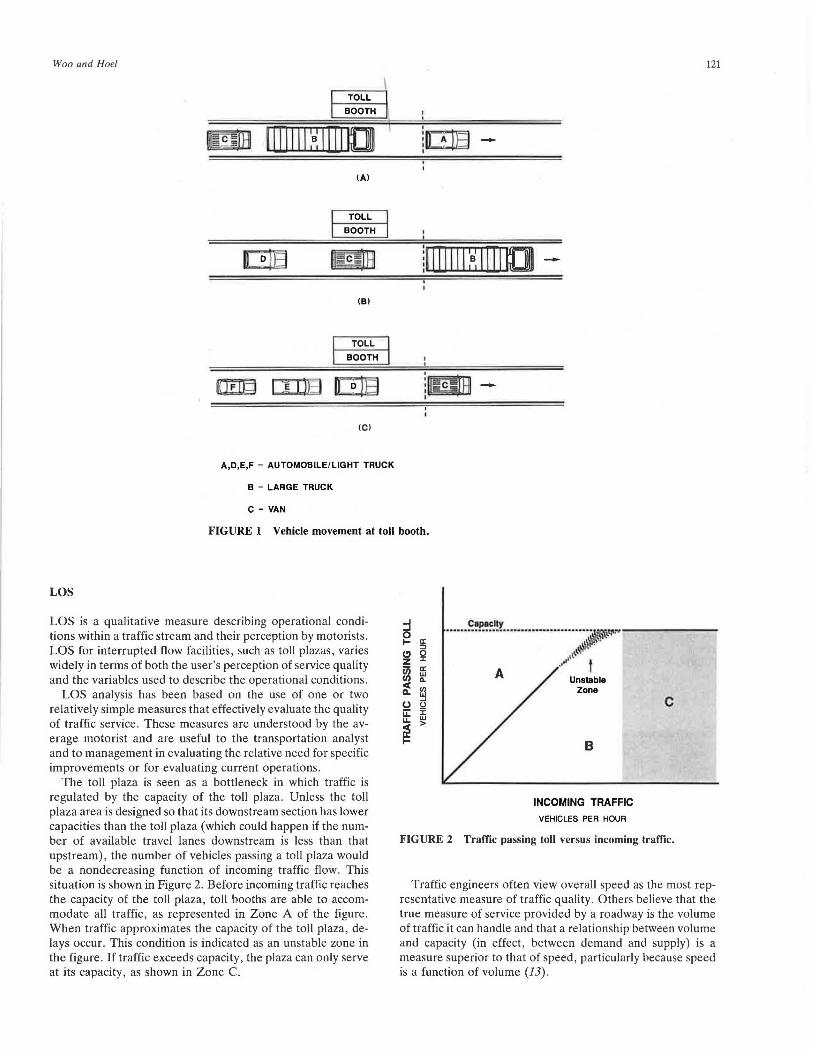
The toll plaza is seen as a bottleneck in which traffic is regulated by the capacity of the toll plaza. Unless the toll plaza area is designed so that its downstream section has lower capacities than the toll plaza (which could happen if the number of available travel lanes downstream is less than that upstream), the number of vehicles passing a toll plaza would be a nondecreasing function of incoming traffic flow. This situation is shown in Figure 2. Before incoming traffic reaches the capacity of the toll plaza, toll booths are able to accommodate all traffic, as represented in Zone A of the figure . When traffic approximates the capacity of the toll plaza, delays occur. This condition is indicated as an unstable zone in the figure. If traffic exceeds capacity, the plaza can only serve at its capacity , as shown in Zone C.
Capac Hy ·· ·-- · ·· · ····· ·· ·· · ··· · ··· ·· · · · · · ····· ··- ~fllltlll'''
#-$.'·
A
l~~" ~····· t
Unstable Zona
B
INCOMING TRAFFIC
VEHICLES PER HOUR
c
FIGURE 2 Traffic passing toll versus incoming traffic.
Traffic engineers often view overall speed as the most representative measure of traffic quality. Others believe that the true measure of service provided by a roadway is the volume of traffic it can handle and that a relationship between volume and capacity (in effect , between demand and supply) is a measure superior to that of speed, particularly because speed is a function of volume (13).
122
Traffic engineers have long been faced with the dilemma of relating capacity to LOS. Much of the difficulty exists because capacity is expressed in volume, whereas LOS is highly subjective in nature. Volume is a logical measure of efficiency from the point of view of the engineer, and density and the vie ratio may be proper in addressing freedom to maneuver and proximity to other vehicles with respect to service quality. However, speed and the magnitude and frequency of speed changes are important measures of LOS from the point of view of the individual driver. Unlike freeway operating characteristics, which include a wide range of rates of flow over which speed is relatively constant, toll plaza traffic bears a wide range of speeds even at a constant rate of flow.
Although speed is a major concern of drivers with respect to service quality, freedom to maneuver and proximity to other vehicles are equally important parameters. These other qualities are directly related to the density of the traffic stream. Further, it has been found that rate of flow increases with increasing density throughout the full range of stable flows.
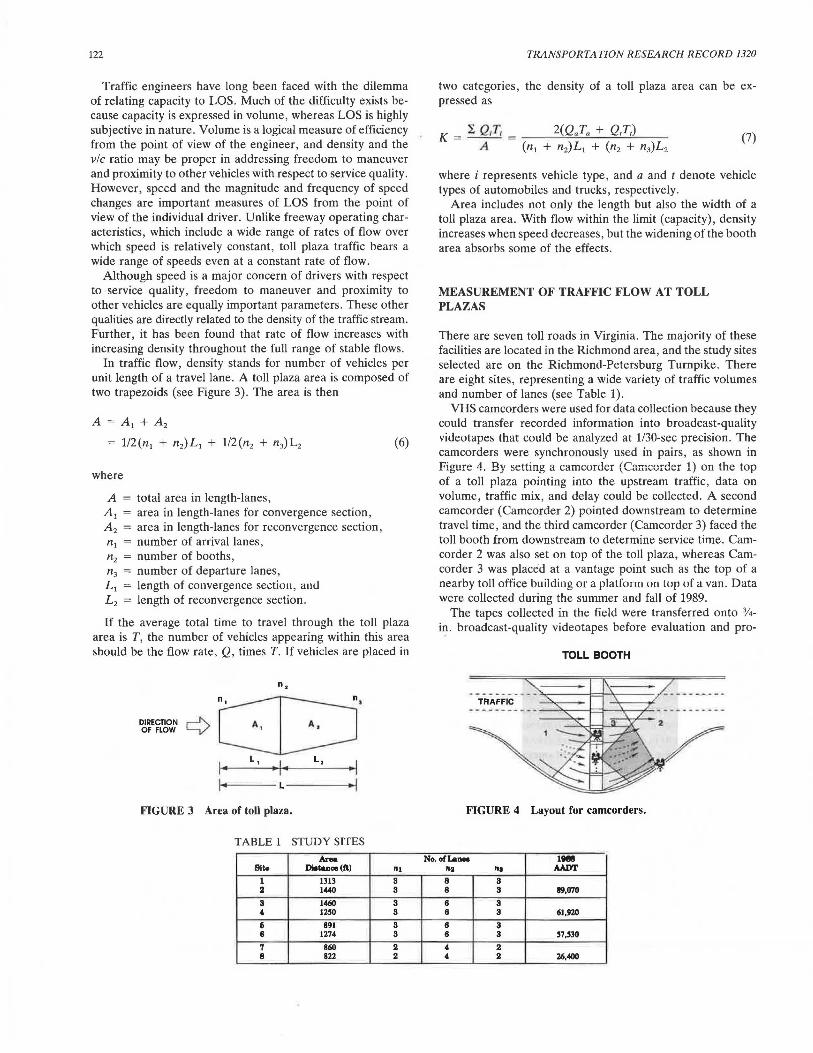
In traffic flow, density stands for number of vehicles per unit length of a travel lane. A toll plaza area is composed of two trapezoids (see Figure 3). The area is then
A= A 1 + A 2
= 1/2 (ni + n2) Li + 1/2 (n2 + n3) L2
where
A = total area in length-lanes, Ai = area in length-lanes for convergence section, A2 area in length-lanes for reconvergence section, ni = number of arrival lanes, n2 = number of booths, n3 = number of departure lanes, Li = length of convergence section, aud L 2 = length of reconvergence section.
(6)
If the average total time to travel through the toll plaza area is T, the number of vehicles appearing within this area should be the flow rate, Q, times T. If vehicles are placed in
DIRECTION OF FLOW
n,
FIGURE 3 Area of toll plaza.
TABLE 1 STUDY SITES
Area Site Dlatance (ft)
1 1313 2 1440
3 1460
' 1250
6 891 8 1274
7 860 8 822
111
8 3
3 3
3 3
2 2
TRANSPORTATION RESEARCH RECORD 1320
two categories, the density of a toll plaza area can be expressed as
K = ~ Q,T, = 2(Q.T0 + Q,T,) A (ni + n2)Li + (n2 + n3)L2
(7)
where i represents vehicle type, and a and t denote vehicle types of automobiles and trucks, respectively.
Area includes not only the length but also the width of a toll plaza area. With flow within the limit (capacity), density increases when speed decreases, but the widening of the booth area absorbs some of the effects.
MEASUREMENT OF TRAFFIC FLOW AT TOLL PLAZAS
There are seven toll roads in Virginia. The majority of these facilities are located in the Richmond area, and the study sites selected are on the Richmond-Petersburg Turnpike. There are eight sites, representing a wide variety of traffic volumes and number of lanes (see Table 1).
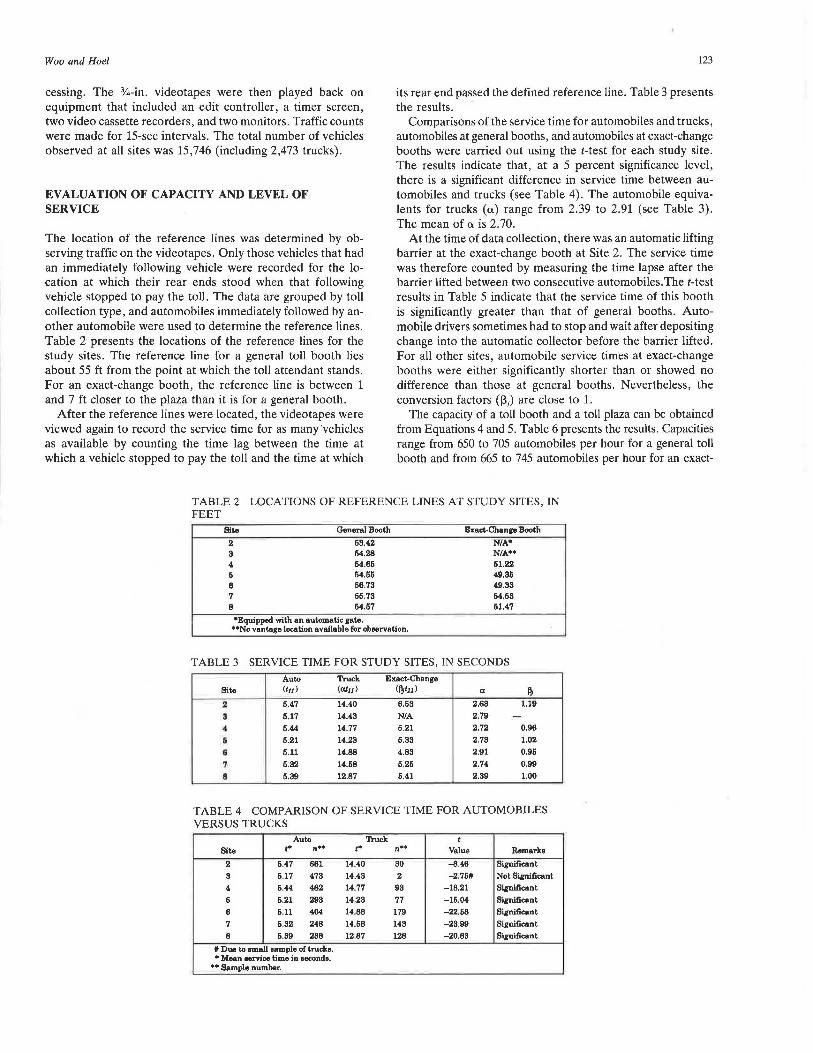
VHS camcorders were used for data collection because they could transfer recorded information into broadcast-quality videotapes that could be analyzed at 1/30-sec precision. The camcorders were synchronously used in pairs, as shown in Figure 4. By setting a camcorder (Camcorder 1) on the top of a toll plaza pointing into the upstream traffic, data on volume, traffic mix, and delay could be collected. A second camcorder (Camcorder 2) pointed downstream to determine travel time, and the third camcorder (Camcorder 3) faced the toll booth from downstream to determine service time. Camcorder 2 was also set on top of the toll plaza, whereas Camcorder 3 was placed at a vantage point such as the top of a nearby toll office building or a platform un lup uf a van. Data were collected during the summer and fall of 1989.
The tapes collected in the field were transferred onto %in . broadcast-quality videotapes before evaluation and pro-
TOLL BOOTH
FIGURE 4 Layout for camcorders.
No.or~.- 1'811 112 11a AADT
8 3 8 s 89,070
6 3 8 3 61,920
8 3 6 3 57,,30
' 2
' 2 26,400
Woo and Hoel
cessing. The %-in. videotapes were then played back on equipment that included an edit controller, a timer screen, two video cassette recorders, and two monitors. Traffic counts were made for 15-sec intervals. The total number of vehicles observed at all sites was 15,746 (including 2,473 trucks).
EVALUATION OF CAPACITY AND LEVEL OF SERVICE
The location of the reference lines was determined by observing traffic on the videotapes. Only those vehicles that had an immediately following vehicle were recorded for the location at which their rear ends stood when that following vehicle stopped to pay the toll. The data are grouped by toll collection type, and automobiles immediately followed by another automobile were used to determine the reference lines. Table 2 presents the locations of the reference lines for the study sites. The reference line for a general toll booth lies about 55 ft from the point at which the toll attendant stands. For an exact-change booth, the reference line is between 1 and 7 ft closer to the plaza than it is for a general booth.
After the reference lines were located, the videotapes were viewed again to record the service time for as many 'vehicles as available by counting the time lag between the time at which a vehicle stopped to pay the toll and the time at which
123
its rear end passed the defined reference line. Table 3 presents the results.
Comparisons of the service time for automobiles and trucks, automobiles at general booths, and automobiles at exact-change booths were carried out using the t-test for each study site. The results indicate that, at a 5 percent significance level, there is a significant difference in service time between automobiles and trucks (see Table 4). The automobile equivalents for trucks (ex) range from 2.39 to 2.91 (see Table 3). The mean of ex is 2.70.
At the time of data collection, there was an automatic lifting barrier at the exact-change booth at Site 2. The service time was therefore counted by measuring the time lapse after the barrier lifted between two consecutive automobiles.The t-test results in Table 5 indicate that the service time of this booth is significantly greater than that of general booths. Automobile drivers sometimes had to stop and wait after depositing change into the automatic collector before the barrier lifted. For all other sites, automobile service times at exact-change booths were either significantly shorter than or showed no difference than those at general booths. Nevertheless, the conversion factors (f3) are close to 1.
The capacity of a toll booth and a toll plaza can be obtained from Equations 4 and 5. Table 6 presents the results. Capacities range from 650 to 705 automobiles per hour for a general toll booth and from 665 to 745 automobiles per hour for an exact-
TABLE 2 LOCATIONS OF REFERENCE LINES AT STUDY SITES, IN FEET
Site General llooth Euct-Chanp Booth
2 63.42 NIA• 3 64.28 NIA .. 4 64.66 61.22 6 64.66 49.36 8 66.73 49.33 7 66.73 64.63 8 64.67 61.47
•Equipped with an automatic gate. ••No vantage location available for ob11ervation.
TABLE 3 SERVICE TIME FOR STUDY SITES, IN SECONDS
Auto Truck Exact-Change Site (tu) (atu) (~tu) a ~ 2 6.47 14.40 6.63 2.63 1.19
3 6.17 14.43 NIA 2.79 -4 6.44 14.77 6.21 2.72 0.96
6 6.21 14.23 6.33 2.73 1.02
6 6.11 14.88 4.83 2.91 0.96
7 6.32 14.68 6.26 2.74 0.99
8 6.39 12.87 6.41 2.39 1.00
TABLE 4 COMPARISON OF SERVICE TIME FOR AUTOMOBILES VERSUS TRUCKS
Auto Truck t Site t• n .. t• n .. Value Remarks
2 6.47 661 14.40 30 -8.46 Significant
3 6.17 473 14.43 2 -2.76# Not Significant
4 6.44 482 14.77 93 -18.21 Significant
6 6.21 293 14.23 77 -16.04 Significant
6 6.11 404 14.88 179 -22.68 Significant
7 6.32 248 14.68 143 -23.99 Significant
8 6.39 238 12.87 128 -20.83 Significant
# Due to small sample of trucks. • Mean service time in seconds.
•• Sample number.
124 TRANSPORTATION RESEARCH RECORD 1320
TABLE 5 COMPARISON OF AUTOMOBILE SERVICE TIME FOR GENERAL BOOTHS VERSUS EXACT-CHANGE BOOTHS
General Euct-Change t Site t• ,. .. t• ,. .. Value Remarka
2 6.47 661 6.63 230 -7.78 Significant 4 6.44 482 6.21 207 1.97 Significant 6 6.21 293 6.33 129 -0.98 Not Significant 6 6.11 404 4.83 246 2.78 Significant 7 6.32 248 6.26 160 0.69 Not Significant 8 6.39 238 6.41 90 -0.14 Not Significant
• Mean aemce time in seconds. •• Sample number.
TABLE 6 CAPACITY OF STUDY SITES
Plaza Site General Euct-Change Tbtal
2 660 691 6101
3 696 (691)• 4171
4 662 691 4001
6 691 676 4130
8 706 746 4270
7 677 686 2717
8 668 666 2669
•Baled on <he value of Site 4.
NOTE: Capacity measured in passenger cars per hour.
change hooth. Because of the reaction delay of the lifting barrier, the capacity of the exact-change booth is 591 automobiles per hour, which is the lowest of any booth observed.
The traffic and travel time data were segregated into 1-, 3-, and 5-min periods. Once the capacity of each site was determined, the vie ratio was obtained by
vie = Volume Capacity
where volume represents the flow rate in passenger cars per hour. Trucks were converted into equivalent numbers of passenger cars by a.
By playing back tapes taken by Camcorders 1 and 2, the time a vehicle entered and left the toll plaza area could be obtained from the readings on the timer. Total travel time, then, is the difference of the two observed values. Travel time was recorded for as many vehicles as could be identified, and the data were separated for automobiles and trucks (including buses). Travel times for 12,737 vehicles, which represented more than 80 percent of the observed traffic, were recorded from the eight study sites.
For a standard design and for all of the study sites, the number of arrival lanes equals the number of departure lanes , that is, n1 = n3 • If n1 > n3 or n1 < n3 , the one with fewer lanes must be overloaded or congested, or the other one must be a slack design under design flow . Therefore, the area of a toll plaza in length-lanes is as follows:
A = 1/2(n1 + n1)L1 + 1/2(n1 + n2)L2
L 1/2(n1 + n1HL1 + Lz) = 2(n1 + nz)
Equation 7 becomes
K = Q.T. + Q,T, = 2(Q.T. + Q,T,) A (11 1 + 112)L
(8)
(9)
The units in Q, and T; in Equation 9 should be the same. Density was calculated using Equation 9 for all data points observed.
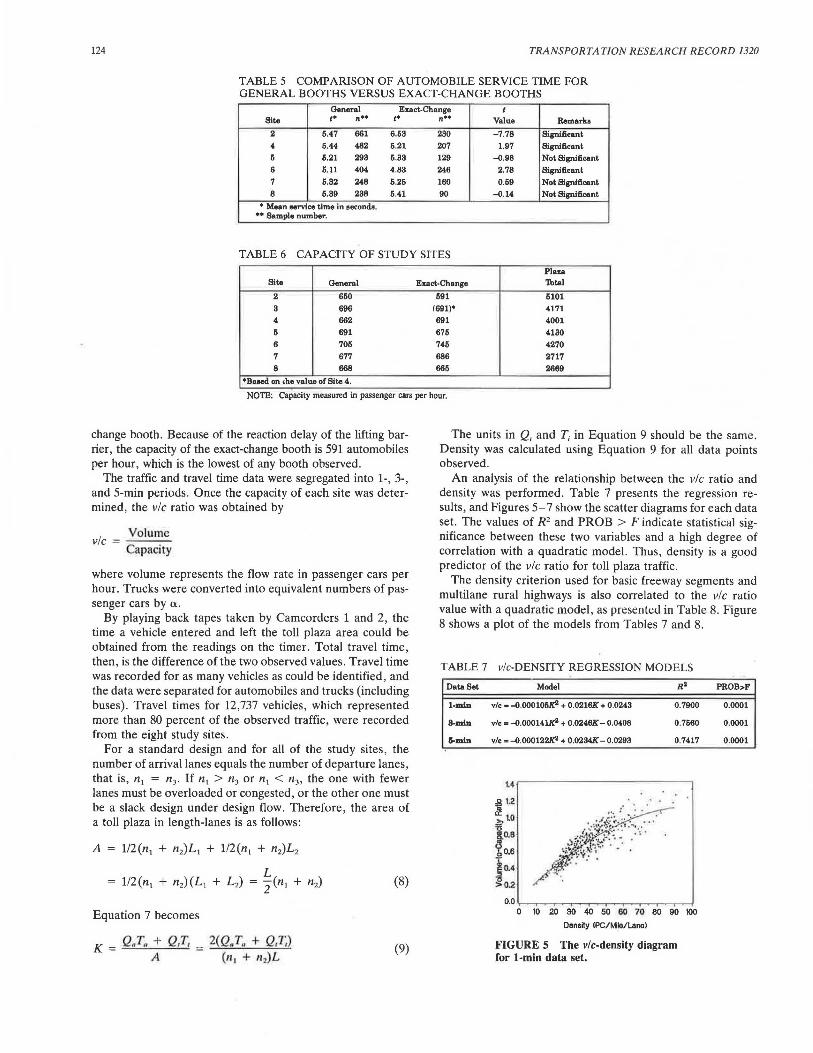
An analysis of the relationship between the vie ratio and density was performed. Table 7 presents the regression results, and Figures 5- 7 show the scatter diagrams for each data set. The values of R1 and PROB > F indicate statistical significance between these two variables and a high degree of correlation with a quadratic model. Thus, density is a good predictor of the vie ratio for toll plaza traffic.
The density criterion used for basic freeway segments and multilane rural highways is also correlated to the vie ratio value with a quadratic model , as presented in Table 8. Figure 8 shows a plot of the models from Tables 7 and 8.
TABLE 7 vie-DENSITY REGRESSION MODELS
Data Set Model R2 PROB>F
1-mln vie• -0 .00010~ + 0.0218K + 0.0243 0. 7900 0.0001
8-mln vie = -0.000141K2 + 0.0248K - 0.0408 0. 7660 0.0001
&-mln vie • -0.000122i(l + 0.0234K - 0.0293 0. 7417 0.0001
t4~~~~~~~~~~~----,
,g 1.2 .. fo~: ~0.6 l0.4 >0.2
0.0 ........ -.-...... -.---.---.--.-....... --r-r-.-......-~ 0 10 20 30 40 50 60 70 60 90 100
Density (PC/Mle/Lana)
FIGURE S The vie-density diagram for I-min data set.
Woo and Hoel
1.4
,g 1.2 ~ "' 1.0
la.a ~o.e ~0.4 >0.2
,.('.''~ r . . . .
/ ,... o ro ~ ao ~ ~ oo ro oo w a
Density (PC/Mlle/Lanel
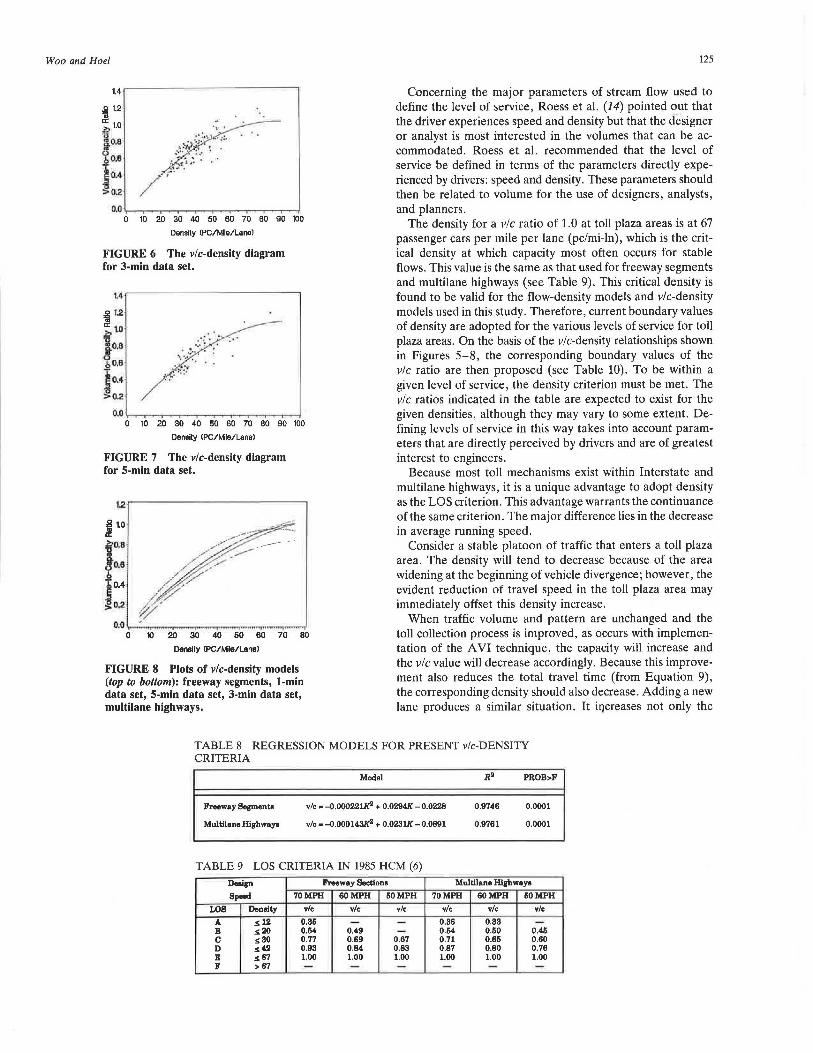
FIGURE 6 The vie-density diagram for 3-min data set.
o.o ....... ~~-~~~~-~~~_... 0 10 20 30 40 50 60 70 80 90 100
Density tPC/Mile/Lanel
FIGURE 7 The vie-density diagram for 5-min data set.
1.2
j 1.0
10 20 30 40 60 60 70 80
Density tPC/IJlle/Lanal
FIGURE 8 Plots of vie-density models (top to bottom): freeway segments, 1-min data set, 5-min data set, 3-min data set, multilane highways.
125
Concerning the major parameters of stream flow used to define the level of service, Roess et al. (14) pointed out that the driver experiences speed and density but that the designer or analyst is most interested in the volumes that can be accommodated. Roess et al. recommended that the level of service be defined in terms of the parameters directly experienced by drivers: speed and density. These parameters should then be related to volume for the use of designers, analysts, and planners.
The density for a vie ratio of 1.0 at toll plaza areas is at 67 passenger cars per mile per lane (pc/mi-In), which is the critical density at which capacity most often occurs for stable flows. This value is the same as that used for freeway segments and multilane highways (see Table 9). This critical density is found to be valid for the flow-density models and vie-density models used in this study. Therefore, current boundary values of density are adopted for the various levels of service for toll plaza areas. On the basis of the vie-density relationships shown in Figures 5-8, the corresponding boundary values of the vie ratio are then proposed (see Table 10). To be within a given level of service, the density criterion must be met. The vie ratios indicated in the table are expected to exist for the given densities, although they may vary to some extent. Defining levels of service in this way takes into account parameters that are directly perceived by drivers and are of greatest interest to engineers.
Because most toll mechanisms exist within Interstate and multilane highways, it is a unique advantage to adopt density as the LOS criterion. This advantage warrants the continuance of the same criterion. The major difference lies in the decrease in average running speed.
Consider a stable platoon of traffic that enters a toll plaza area. The density will tend to decrease because of the area widening at the beginning of vehicle divergence; however, the evident reduction of travel speed in the toll plaza area may immediately offset this density increase.
When traffic volume and pattern are unchanged and the toll collection process is improved, as occurs with implementation of the A VI technique, the capacity will increase and the vie value will decrease accordingly. Because this improvement also reduces the total travel time (from Equation 9), the corresponding density should also decrease. Adding a new lane produces a similar situation. It iqcreases not only the
TABLE 8 REGRESSION MODELS FOR PRESENT vie-DENSITY CRITERIA
Model R2 PROB>F
Freeway Segments vie • --0.000221J(2 + 0.0294K - 0.0228 0.9746 0.0001
Multilane Highways v/e = --0.000143K2 + 0.0231K -0.0891 0.9761 0.0001
TABLE 9 LOS CRITERIA IN 1985 HCM (6)
Design Freeway Sections Multilane Highways
Speed 70MPH 60MPH 50MPH 70MPH 60MPH 50MPH
LOS Density v/e v/c vie vie v/c v/c
A s 12 0.36 - - 0.36 0.33 -B s20 0.54 0.49 - 0.54 0.50 0.45 c sSO 0.77 0.69 0.67 0.71 0.65 0.60 D s42 0.93 0.84 0.83 0.87 0.80 0.76 E s67 1.00 1.00 1.00 1.00 1.00 1.00 F >67 - - - - - -
126
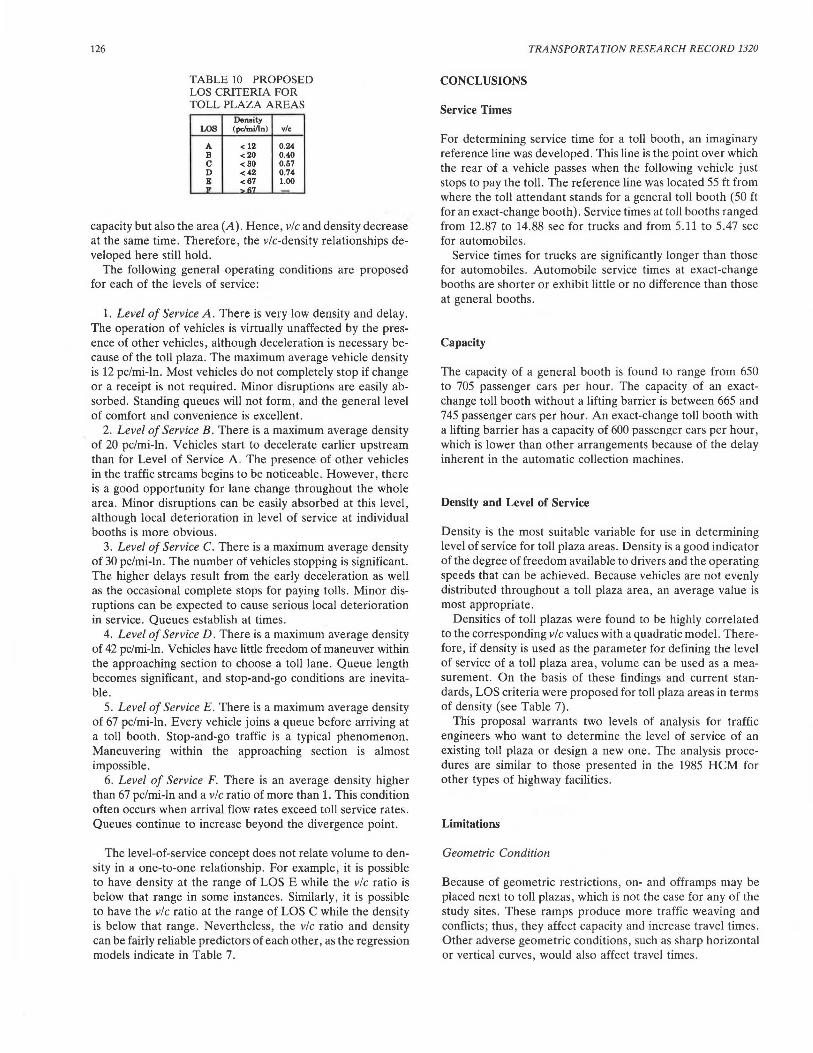
TABLElO PROPOSED LOS CRITERIA FOR TOLL PLAZA AREAS
Den•ity LOS (pc/mi/In) vie
A < 12 0.24 B <20 o.40 c <30 0.57 D <42 0.74 E <67 1.00 II' -"~
capacity but also the area (A). Hence, vie and density decrease at the same time. Therefore, the vie-density relationships developed here still hold.
The following general operating conditions are proposed for each of the levels of service:
1. Level of Service A. There is very low density and delay. The operation of vehicles is virtually unaffected by the presence of other vehicles, although deceleration is necessary because of the toll plaza. The maximum average vehicle density is 12 pc/mi-In. Most vehicles do not completely stop if change or a receipt is not required. Minor disruptions are easily absorbed. Standing queues will not form, and the general level of comfort and convenience is excellent.
2. Level of Service B. There is a maximum average density of 20 pc/mi-ln. Vehicles start to decelerate earlier upstream than for Level of Service A. The presence of other vehicles in the traffic streams begins to be noticeable. However, there is a good opportunity for lane change throughout the whole area. Minor disruptions can be easily absorbed at this level, although local deterioration in level of service at individual booths is more obvious.
3. Level of Service C. There is a maximum average density of 30 pc/mi-ln. The number of vehicles stopping is significant. The higher delays result from the early deceleration as well as the occasional complete stops for paying tolls. Minor disruptions can be expected to cause serious local deterioration in service. Queues establish at times .
4. Level of Service D. There is a maximum average density of 42 pc/mi-ln. Vehicles have little freedom of maneuver within the approaching section to choose a toll lane. Queue length becomes significant , and stop-and-go conditions are inevitable.
5. Level of Service E. There is a maximum average density of 67 pc/mi-In. Every vehicle joins a queue before arriving at a toll booth. Stop-and-go traffic is a typical phenomenon. Maneuvering within the approaching section is almost impossible.
6. Level of Service F. There is an average density higher than 67 pc/mi-In and a vie ratio of more than 1. This condition often occurs when arrival flow rates exceed toll service rates. Queues continue to increase beyond the divergence point.
The level-of-service concept does not relate volume to density in a one-to-one relationship. For example, it is possible to have density at the range of LOS E while the vie ratio is below that range in some instances. Similarly, it is possible to have the vie ratio at the range of LOS C while the density is below that range. Nevertheless, the vie ratio and density can be fairly reliable predictors of each other, as the regression models indicate in Table 7.
TRANSPORTATION RESEARCH RECORD 1320
CONCLUSIONS
Service Times
For determining service time for a toll booth, an imaginary reference line was developed. This line is the point over which the rear of a vehicle passes when the following vehicle just stops to pay the toll. The reference line was located 55 ft from where the toll attendant stands for a general toll booth (50 ft for an exact-change booth). Service times at toll booths ranged from 12.87 to 14.88 sec for trucks and from 5.11 to 5.47 sec for automobiles.
Service times for trucks are significantly longer than those for automobiles. Automobile service times at exact-change booths are shorter or exhibit little or no difference than those at general booths.
Capacity
The capacity of a general booth is found to range from 650 to 705 passenger cars per hour. The capacity of an exactchange toll booth without a lifting barrier is between 665 and 745 passenger cars per hour. An exact-change toll booth with a lifting barrier has a capacity of 600 passenger cars per hour, which is lower than other arrangements because of the delay inherent in the automatic collection machines .
Density and Level of Service
Density is the most suitable variable for use in determining level of service for toll plaza areas. Density is a good indicator of the degree of freedom available to drivers and the operating speeds that can be achieved. Because vehicles are not evenly distributed throughout a toll plaza area, an average value is most appropriate.
Densities of toll plazas were found to be highly correlated to the corresponding vie values with a quadratic model. Therefore, if density is used as the parameter for defining the level of service of a toll plaza area, volume can be used as a measurement. On the basis of these findings and current standards, LOS criteria were proposed for toll plaza areas in terms of density (see Table 7).
This proposal warrants two levels of analysis for traffic engineers who want to determine the level of service of an existing toll plaza or design a new one. The analysis procedures are similar to those presented in the 1985 HCM for other types of highway facilities.
Limitations
Geometric Condition
Because of geometric restrictions, on- and offramps may be placed next to toll plazas, which is not the case for any of the study sites. These ramps produce more traffic weaving and conflicts; thus, they affect capacity and increase travel times. Other adverse geometric conditions, such as sharp horizontal or vertical curves, would also affect travel times.
Woo and Hoel
Vehicle Category
For simplicity, vehicles were divided into only two categories: (a) automobiles and (b) trucks and buses. If traffic consists of vehicles that can be clearly separated into more than two categories, the analysis should take this factor into account. For example, three categories could be used: (a) automobiles, (b) single-unit trucks, and (c) truck trailers.
Toll Collection Method
The Richmond-Petersburg Turnpike does not have advanced toll collection equipment. The results of this study should not be applied without modifying toll facilities with advanced electronic or optical collection mechanisms.
GLOSSARY
Toll Booth: a booth at which vehicles stop to pay tolls. Toll Plaza: one or more toll booths. Toll Plaza Area: a specific section that begins with vehicle convergence into the toll plaza and ends with vehicles reconverging into the highway traffic stream. Service Time: the elapsed time for a vehicle to stop, pay a toll, and clear the area so that the next vehicle in the queue is positioned to pay the toll. Density: the number of vehicles per unit area. Because vehicles are directionally guided rather than randomly spread in moving, the unit of area used is the mile-lane.
ACKNOWLEDGMENTS
This study was conducted with funds provided by FHW A through the Virginia Transportation Research Council. The
127
authors gratefully acknowledge the assistance provided by both agencies.
REFERENCES
1. IRF Reviews Topics of World Interest. World Highway, Vol. XLI, No. 1, 1990.
2. S. C. Fehr. Toll Roads Gain in Popularity From Coast to Coast. Washington Post, Sept. 20, 1989.
3. New Toll Road Models. AASHTO International Transportation Observer, Oct. 1988.
4. Editorial. The Urban Transportation Monitor, Vol. 2, No. 24, 1988.
5. Beyond Gridlock. Highway Users Federation, Washington, D.C., 1988.
6. Special Report 209: Highway Capacity Manual. TRB, National Research Council, Washington, D.C., 1985.
7. Transportation Research Circular 319: Research Problem Statements: Highway Capacity. TRB, National Research Council, Washington, D.C., June 1987.
8. H. C. Wood and C. S. Hamilton. Design of Toll Plazas from the Operator's Viewpoint. HRB Proc., Vol. 34, 1955, pp. 127-139.
9. G. G. Henk, E. C. Pahlke, and M. C. Schaefer. Toll Road Facility Design Issues-Planning for Flexibility. Presented at Conference on National Perspectives on Toll Road Development, Irvine, Calif., Nov. 1988.
10. W. G. Bald and J. R. Underwood. An Investigation into the Effect of Toll-Booths on Morning Peak Traffic Flow. Chartered Municipal Engineer, Vol. 104, No. 11, 1977, pp. 205-208.
11. J. D. Griffiths and J.E. Williams. Traffic Studies on the Severn Bridge. Traffic Engineering and Control, May 1984, pp. 268-274.
12. L. D. Edie. Traffic Delays at Toll Booths. Journal of the Operations Research Society of America, Vol. 2, 1954, pp. 107-138.
13. J. F. Schwar. Quality of Traffic Service. Traffic Quarterly, Vol. XX; No. 1, 1966, pp. 136-146.
14. R. P. Roess, W. R. McShane, and L. J. Pignataro. Freeway Level of Service: A Revised Approach. In Transportation Research Record 699, TRB, National Research Council, Washington, D.C., 1979, pp. 7-16.
Publication of this paper sponsored by Committee on Highway Capacity and Quality of Service.