Embed Size (px)
Citation preview

• energy • emissions • efficiency • technology • travel • home • work • office • productivity • time • morale • engagement • balance •
Can smart technology and new ways of working create a green
and more productive business environment?
A new series of sustainability discussions
Tomorrow’s workspace

‘Some say tackling climate change
is too expensive. They are wrong.
We will pay an unacceptable price if
we do not act now.’Ban Ki-moon, UN Secretary General
‘The UK’s low-carbon transition
plan comprises five key points – but
it is the fifth that will make a real
difference: “supporting individuals,
communities and businesses to play
their part”.’Jonathon Porritt, Founder, Forum for the Future
2 3
Tomorrow’s workspace
Think Big is O2’s sustainability programme. It is designed to stimulate social and environmental change in partnership with employees, customers and other stakeholders. The Think Big logo is used to identify O2 activities that we believe deliver improvements ‘for people and planet’.
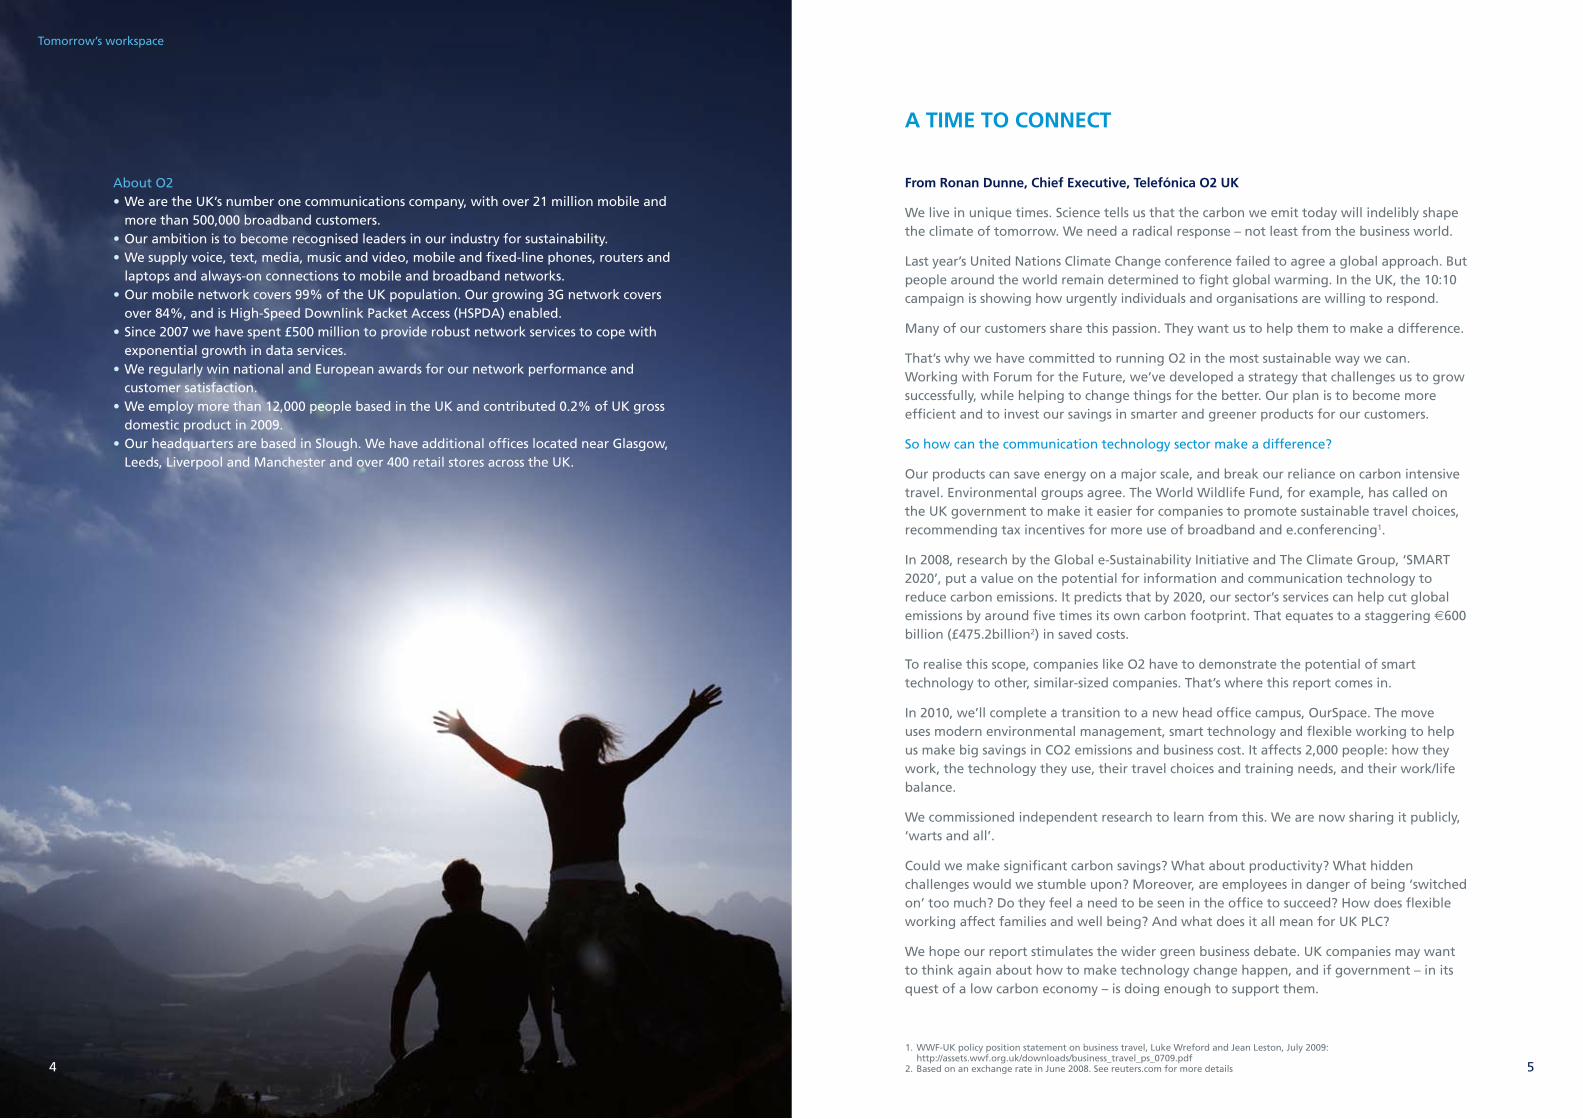
A TIME TO CONNECT
From Ronan Dunne, Chief Executive, Telefónica O2 UK
We live in unique times. Science tells us that the carbon we emit today will indelibly shape the climate of tomorrow. We need a radical response – not least from the business world.
Last year’s United Nations Climate Change conference failed to agree a global approach. But people around the world remain determined to fight global warming. In the UK, the 10:10 campaign is showing how urgently individuals and organisations are willing to respond.
Many of our customers share this passion. They want us to help them to make a difference.
That’s why we have committed to running O2 in the most sustainable way we can. Working with Forum for the Future, we’ve developed a strategy that challenges us to grow successfully, while helping to change things for the better. Our plan is to become more efficient and to invest our savings in smarter and greener products for our customers.
So how can the communication technology sector make a difference?
Our products can save energy on a major scale, and break our reliance on carbon intensive travel. Environmental groups agree. The World Wildlife Fund, for example, has called on the UK government to make it easier for companies to promote sustainable travel choices, recommending tax incentives for more use of broadband and e.conferencing1.
In 2008, research by the Global e-Sustainability Initiative and The Climate Group, ‘SMART 2020’, put a value on the potential for information and communication technology to reduce carbon emissions. It predicts that by 2020, our sector’s services can help cut global emissions by around five times its own carbon footprint. That equates to a staggering €600 billion (£475.2billion2) in saved costs.
To realise this scope, companies like O2 have to demonstrate the potential of smart technology to other, similar-sized companies. That’s where this report comes in.
In 2010, we’ll complete a transition to a new head office campus, OurSpace. The move uses modern environmental management, smart technology and flexible working to help us make big savings in CO2 emissions and business cost. It affects 2,000 people: how they work, the technology they use, their travel choices and training needs, and their work/life balance.
We commissioned independent research to learn from this. We are now sharing it publicly, ‘warts and all’.
Could we make significant carbon savings? What about productivity? What hidden challenges would we stumble upon? Moreover, are employees in danger of being ‘switched on’ too much? Do they feel a need to be seen in the office to succeed? How does flexible working affect families and well being? And what does it all mean for UK PLC?
We hope our report stimulates the wider green business debate. UK companies may want to think again about how to make technology change happen, and if government – in its quest of a low carbon economy – is doing enough to support them.
1. WWF-UK policy position statement on business travel, Luke Wreford and Jean Leston, July 2009: http://assets.wwf.org.uk/downloads/business_travel_ps_0709.pdf2. Based on an exchange rate in June 2008. See reuters.com for more details4 5
Tomorrow’s workspace
About O2• We are the UK’s number one communications company, with over 21 million mobile and
more than 500,000 broadband customers.• Our ambition is to become recognised leaders in our industry for sustainability.• We supply voice, text, media, music and video, mobile and fixed-line phones, routers and
laptops and always-on connections to mobile and broadband networks.• Our mobile network covers 99% of the UK population. Our growing 3G network covers
over 84%, and is High-Speed Downlink Packet Access (HSPDA) enabled.• Since 2007 we have spent £500 million to provide robust network services to cope with
exponential growth in data services.• We regularly win national and European awards for our network performance and
customer satisfaction.• We employ more than 12,000 people based in the UK and contributed 0.2% of UK gross
domestic product in 2009.• Our headquarters are based in Slough. We have additional offices located near Glasgow,
Leeds, Liverpool and Manchester and over 400 retail stores across the UK.
CONTENTS
TRIPLE BOTTOM LINE HEADLINES ...............................................................................................8
ABOUT THIS REPORT ....................................................................................................................9
A NEW ENVIRONMENT: OURSPACE ...........................................................................................12
1. COMMUNICATION TECHNOLOGY .......................................................................................14
• Modes and Applications ...................................................................................................14
• Impact on working practices ............................................................................................15
• Vision .................................................................................................................................15
• Virtual meetings – Case Studies .......................................................................................16
2. HEAD OFFICE CARBON FOOTPRINT .....................................................................................18
• Annual consumption and associated CO2 pre-transition ..............................................18
• Annual consumption and associated CO2 post-transition ............................................18
• Benchmarks .......................................................................................................................19
• Summary............................................................................................................................20
3. TRAVEL CARBON FOOTPRINT ..............................................................................................23
• Business travel ...................................................................................................................23
• Commuting to work .........................................................................................................27
• Summary............................................................................................................................30
4. HOME WORKING CARBON FOOTPRINT ..............................................................................32
• Additional emissions from home working .....................................................................32
• Emissions avoided from home working ..........................................................................33
• Summary............................................................................................................................33
5. THE EMPLOYEE EXPERIENCE ...............................................................................................34
• Sample selection: Huggers and Hoppers ........................................................................34
• Employee Travel and Home Working Footprints ...........................................................35
• Summary............................................................................................................................40
• Case Study .........................................................................................................................41
6. WORKING PRACTICES, OPINION AND MOOD ....................................................................42
7. TOTAL CARBON FOOTPRINT ................................................................................................46
8. CONCLUSIONS ......................................................................................................................48
• What our research tells UK PLC .......................................................................................49
APPENDICES ................................................................................................................................52
EXECUTIVE SUMMARY We have audited O2’s transition to a new office, which combines flexible working with greater use of new technology. Our study provides insight into how cultural change and smart technology can boost productivity and drive carbon savings.
As a typical UK business, our experiences and the challenges they raise can inform the wider business community.
CHAPTER 1: A wide range of readily available, off-the-shelf communication technology can now help businesses large and small to improve their green credentials.
CHAPTER 2: By adopting smarter building practices in new-builds and refurbishments, companies can expect to see dramatic operational cost savings.
CHAPTER 3: Travel-related emissions can be a significant yet largely invisible carbon cost for the modern office. But flexible working and related technologies can help to eliminate them.
CHAPTER 4: For companies whose employees are based at several locations, carbon savings achieved by travel avoidance significantly outweigh emissions associated with home working.
CHAPTER 5: Business improvements are mirrored by the benefits to people: flexible workers generally perform better, have a happier work/life balance and are more engaged than their office-bound colleagues.
6 7
Tomorrow’s workspace

TRIPLE BOTTOM LINE HEADLINESPLANET
-53%: ANNUAL CO2 EMISSIONS HEAD OFFICE*
-36%: ANNUAL CO2 EMISSIONS PER HEAD OFFICE DESK*
-26%: OVERALL TOTAL ANNUAL EMPLOYEE CO2 EMISSIONS**
PEOPLE
100%: FLEXIBLE WORKERS REPORTING A BETTER WORK/LIFE BALANCE***
32 DAYS – AVERAGE TIME PER YEAR SPENT TRAVELLING TO WORK BY EACH EMPLOYEE
HOME WORKER PERFORMANCE AND RETENTION****
HOME WORKER ABSENTEEISM****
PROFIT
£3.84m: ANNUAL SAVING FROM ‘HOT DESK’ WORKING
£30,400: TYPICAL ANNUAL SAVING FOR A TEAM OF EIGHT OPTING FOR ‘VIRTUAL’ MONTHLY MEETINGS
ABOUT THIS REPORTMuch is claimed for the ability of communication technology to join up big organisations, connect employees over distance, and create efficient voice, data and visual links between teams – wherever they are.
More and more evidence suggests that mobile communication can help the environment too, offering new opportunities for businesses to cut their carbon emissions, especially with regard to travel. In theory, companies that equip their people to share data and make decisions ‘on the move’ also become more productive, saving time and money.
TESTING THE THEORIES
Our report focuses on O2’s 2010 relocation to new headquarters in Slough. We refer to the move by its project name, OurSpace, throughout.
This is a test case for the service sector. It assesses whether modern energy management, smart technology and flexible working add up to a greener, more efficient workplace.
We also touch on the social consequences of the flexible workplace: the impact on employee time, job satisfaction and work/life balance, our employees’ appetite for change and their personal experiences of home and remote working.
We want to stimulate debate and inform organisations on how workplace evolution might benefit the ‘triple bottom line’: people, planet and profit. For more information on this report and other studies, please email the Sustainability Team at [email protected].
OBJECTIVES The research sets out to:
• Calculate and compare office carbon emissions from O2’s Slough headquarters before and after relocation to OurSpace;
• Assess carbon emissions associated with employee commuting and business travel;
• Understand the availability and uptake of technology and how it influences choice of work styles, travel and consequent carbon emissions;
• Calculate individual carbon footprints from a sample of employees in varied roles, assessing their work styles, travel choices and use of technology;
• Consider employee attitudes to home and flexible working, including time management, productivity, morale, engagement and work/life balance.
8 9
Tomorrow’s workspace
Environmental impacts
CO2 emissions
Home working
CO2 emissions
Commute to work
CO2 emissions
Working at HQ
CO2 emissions
Mobile email & data Greener travel BREEAM HQ e-conferencing
CO2 reductions CO2 reductions CO2 reductions CO2 reductions
Business travel
Benefits from green working
*Excludes travel and home working emissions**Includes head office operations, travel and home working emissions***O2 qualitative employee sample****From research conducted on behalf of O2 by eePulse and King’s College, London (2009)

1. O2’s UK-wide and Slough corporate operations in this report exclude retail stores and network2. Transition to OurSpace began in November 2009 but the buildings will not be running at full capacity until mid- to
late-2010. In the absence of detailed projections, energy consumption post-transition has been estimated against best available information and a set of assumptions approved by independent researchers ERM and O2
3. O2’s data centre in Buckingham Avenue, Slough (200 employees) remains a separate office and so is excluded from the study’s emissions baseline
4. Available diesel data associated with testing of back-up generators at each of the three pre-transition offices, spans the period January-December 2009
SCOPE AND BOUNDARIESThe main sources of carbon emissions from O2’s operations in Slough are split into four categories. They are typical of a large service sector organisation:
• Office: electricity, gas, diesel (for back up generators) and air conditioning (refrigerant refill)
• Home: heating, lighting and power for equipment• Business travel• Commuting to work
Our study aims to calculate the impact of O2’s transition by providing comparative carbon footprints for Slough employees, before and after relocation1, including emissions from head office operations, home and travel.
METHODOLOGY AND MATERIALSTo gain an understanding of the environmental and social impact of transition, the study uses:
• Existing environmental data (pre-relocation);• Extrapolated projected data, using O2-agreed assumptions2 (post-relocation);• A series of intensive one-to-one interviews with a small group of carefully selected O2
people who represent identified typical ‘personas’ within the O2 office population; supported by:
• The findings of a 2010 web-based survey of 1,067 O2 people across the business• O2 Slough employee travel survey (2009)
We also draw on a study by Dr TM Wellbourne, eePulse and Amanda Jones, King’s College, London (2009): ‘Driving High Performance at O2 with Home Working’, together with selected findings from relevant research in the public domain.
RELOCATION TIMETABLE AND BASELINE DATAThe phased transition to OurSpace began in November 2009 and is scheduled to complete by the end of 2010. To measure the environmental benefits, we compare energy consumption at:
1. The former Slough offices – 260 Bath Road, 1 Brunel Way and Wellington Street3.
2. OurSpace – East Side (260 Bath Road, post-refit), West Side and The Link (see explanatory images and demographics on page 12).
Our base data combines the emissions output from the three offices occupied prior to the programme of refurbishment and relocation. To gain the most accurate comparisons, energy consumption between October 2008 and September 2009 is used wherever possible4.
DEMOGRAPHICSSlough head office employs 2,000 people. Of those, about a third are office based. The rest work flexibly: from the office, at home, or on the move. Their roles span all areas of the business, including sales, human resources and information technology.
SAMPLEOur qualitative sample of employees is used to study individual working practices, technology use, travel patterns and consequent carbon footprints. These ‘personas’ fall into two main categories:
• HUGGERS: who mainly work from a fixed desk in an O2 office, generally in administrative roles;
•HOPPERS: who can work from a mix of office, home and mobile locations. They have a wide range of responsibilities, involving interaction with colleagues around the country, customers, suppliers and external organisations.
Our sample was specifically designed to reflect the wide reality at O2, covering the different types of O2 employment contract (both office-based and all varieties of flexible working), and a full range of jobs.
We used interviews with personas to dig deep into the lives and choices of individual employees and to get detailed insight into the relationship between: work styles, carbon emissions, use of technology, and employee mood. There is a full explanation of our rationale in Appendix 2.
10 11
Tomorrow’s workspace

1. Combined photocopiers, printers, scanners and fax machines equipped with low power/sleep modes, replacing 140 printers, 10 photocopiers and multiple faxes. These multifunctional devices (MDFs) are programmed with ‘secure print’ features to reduce paper consumption across Slough by an estimated 30% or 4 million sheets. Secure print is also accessible to home and remote workers. Network cables: Internet protocol telephony requires 50% fewer cables. This equates to 500 miles of cabling and 50% less copper. Server virtualisation: This process, recently implemented, has reduced the physical hardware of servers at O2 offices across the UK
2. Assessed from Beginner to Performer, Leader and Pioneer. For more information, see http://www.forumforthefuture.org/3. Guidelines to Defra/DECC’s GHG Conversion Factors for Company Reporting, version 2.0, dated 30/09/2009
A NEW ENVIRONMENT: OURSPACE -53%: TOTAL OFFICE CO2 EMISSIONS HEAD OFFICE
-36%: ANNUAL CO2 EMISSIONS PER DESK
OurSpace was designed to create a sustainable workplace that would help reduce O2’s impact on the environment.
Our original office at 260 Bath Road has been refurbished (‘East Side’). A new building was built next door (‘West Side’). They are joined together by a new entrance (‘the Link’).
Our selected images show the arrangement of O2’s head office buildings before and after relocation, detailing their floor space, occupancy, desk numbers and average carbon emissions over an average year.
PHYSICAL TRANSITION SLOUGH
BUILDING A GREENER WORKPLACE
As well as achieving a ‘very good’ rating from the world-recognised environmental standard for buildings (BREEAM), OurSpace is designed to be energy efficient in the way people work.
One of the biggest changes is ‘hot-desking’. There are now enough desks for the number of people at work in the building at any one time, whether they are full-time ‘huggers’, or flexible workers who work in the office less frequently.
This has reduced desk numbers in post-transition OurSpace by 548, with estimated cost savings of £7,000 per desk, or £3.84 million per year.
As well as traditional meetings rooms, OurSpace provides less formal areas for ad hoc meetings and discussions. The new technology helps people to connect with others in a range of mobile ways (Chapter 1, page 14).
The ambience at OurSpace is one of space, glass and natural light, with easy access to both operational and downtime facilities, like the canteen and coffee shop.
There are many integrated environmental management features1. Forum for the Future assessed them, and gave OurSpace an ‘environmental leadership’ score using its ‘Beginner-to-Leader’ model2. Here is a summary of the main features, and the Forum grade for each.
•Energy: smart metering, high efficiency air conditioning with seasonal intelligence, hot/cold water temperature controls; rooftop Photo Voltaic cells; digital lighting systems that allow programmable zone and time controls; office perimeter lighting controlled by daylight sensors. Forum rating: PERFORMER
• Water: rainwater harvesting for landscape irrigation; dual-flush and infra-red controlled toilets with low flow control devices and metering. Leak detection to mains water supplies. Forum rating: LEADER
• Materials: minimum toxic materials and maximum recycled content. In disposal of redundant office furniture, less than 2% went to landfill and the rest was reused or recycled. Forum rating: LEADER
•Waste: mixed recycling to achieve a 90%+ recycling rate; dedicated spaces for waste management designed into the built environment; reduced paper and toner consumption by over 25%. Forum rating: LEADER
RENEWABLE ENERGY
Electricity for both the pre-transition offices and OurSpace comes from an existing green tariff. OurSpace is also fitted with a 12.6kWe Solar Photo Voltaic system. Throughout this report we have calculated carbon emissions from energy use by applying the grid average emissions, consistent with current UK Government guildelines3.
12 13
Tomorrow’s workspace
•3locations•2,000people•2,048desks•230,500sqft•5364tCO2
•OurSpace•2,000people•1,500desks•216,500sqft•2506tCO2
BEFORE AFTER

1. COMMUNICATION TECHNOLOGY7.8 GtCO2: POTENTIAL GLOBAL CARBON SAVINGS ENABLED BY INFORMATION AND COMMUNICATION TECHNOLOGIES (‘SMART 2020’ RESEARCH)
O2’s aim is to make mobile technology available to everyone who finds it useful, whether they are office-based or home/flexible workers.
The technologies evaluated in this study were already in use at West Side, the largest and only occupied area of OurSpace at the time of going to press. Later we look at the actual uptake of technology by our sample of personas, together with their views on flexible working, resources and training (see case studies on pages 16 and 17, and Chapter 5).
TECHNOLOGY MODES
O2 employees can call each other via a choice of compatible technology modes, software platforms and devices – ranging from verbal-only, to ‘virtual’ meetings that allow people to see one another remotely and share data instantly (see Appendix 1 for full descriptors).
The technology includes:
•Office-basedhighdefinitionvisualcommunicationthroughTelePresence™,VideoconferenceorRoundTable™,linkedtointeractiveSMARTBoards™whereappropriate;
•Lowdefinitionvisualcommunication,viawebcamandMicrosoftCommunicator™software, used from home or another remote location;
•3Gsmartphones–anytime,anywherevoice,messaging,emailandvisualcalls.
1.1 SUMMARY OF TECHNOLOGY OPTIONS, JANUARY 2010
Technology ..................................Capacity OurSpace (Jan 2010)TelePresence™ ............................1 suite installed, second plannedVideoConferencing .....................1 suiteRoundTable™ ..............................15 unitsWebCam ......................................500SmartBoard™ ..............................40 unitsDongles ........................................400 – 600Broadband ...................................All home workersSmart Phones ...............................2,000
PERCEIVED IMPACT ON WORKING PRACTICES
Our research suggests that O2 employees generally regard technology as a positive tool at work. A striking benefit is the flexibility of virtual meetings, which often replace regular face-to-face team meetings (UK and international).
These help people to avoid:
•TravelandrelatedCO2emissions•Travellingtime–businessandpersonalhours•Financialcostoftravelandsubsistence
Virtual meetings are also felt to help improve teamwork and increase regular contact between workers based at different locations. They may additionally boost productivity by freeing up otherwise lost travel time in the working day (see Chapter 6: technology pros and cons).
TECHNOLOGY VISION
In addition to the new technology at the Slough site, O2 is rolling out capacity to other UK locations, providing interconnections with satellite offices such as Leeds and Glasgow. Investment is also planned for other O2 offices across Europe. And suppliers will be encouraged to adopt technologies to capture wider carbon savings.
The business case for increasing O2 technology capacity is based on: environmental benefits, cost, productivity and social effects, and each investment carries a specific payback period. Most immediately, there is likely to be an increase in the availability and use of Microsoft CommunicatorTM, and an increase in virtual meetings.
Note that, as employees become more software proficient and ready to embrace a range of options, electricity usage will rise. Conversely, we expect a reduction in travel and related CO2 emissions, a drop in travel and subsistence costs, higher productivity and, potentially, the social benefit to colleagues of having more time for activities outside work.
The qualitative feedback from people surveyed in this study reveals that, to gain maximum advantage, employees must be confident and competent when using advanced technology. Technology has the power to change the way we work, but training and awareness programmes are critical to success.
SUMMARY AND CHALLENGES
The technologies at O2 demonstrate the variety of tools now available to the modern office. By no means a definitive list of options, they show how a unified and co-ordinated communications infrastructure can be assembled off-the-shelf to suit a range of budgets.
The challenge for organisations choosing smart office technologies will be to convey to employees a wide awareness and understanding of the everyday uses and benefits. Sufficient capacity, with thorough and timely training, is fundamental.
14 15
Tomorrow’s workspace

VIRTUAL MEETINGS – ENABLING CARBON SAVINGS
Here we publish two case studies that help shed light on the actual impact of communication technology in the workplace. They focus on virtual meetings: one in the UK and one international.
Our aim is to demonstrate the savings that a typical business might expect to see in travel-related carbon emissions, employee time and cost.
The first case study describes the replacement of a monthly face-to-face team meeting. Here, eight team members dial into a virtual meeting via webcams. All team members are O2 home workers and avoid travel to Slough and back.
The second study examines the impact of international travel. Here a six-weekly meeting of four senior managers, normally held in Madrid or Slough, has been replaced with the use of TelePresence™.Theuseofvirtualmeetingsalsoenablesthesemanagerstomeetonamorefrequent monthly basis.
We return to persona data in Chapter 5.
16 17
Tomorrow’s workspace
1. Based on unleaded petrol cost of £1.20 pence per litre, and an estimated 5.9 litres per 100 km, and on the UK median weekly pay for full-time employees of £489 (from 2009 Annual Survey of Hours and Earnings (ASHE) from the Office of National Statistics 2009)
2. Based on eight face-to-face meetings per year with typical flight costs of £250 (inclusive of taxes) plus overnight accommodation of £100 per person per night, and on the UK median weekly pay for corporate managers of £745 (2009 Annual Survey of Hours and Earnings (ASHE) from the Office of National Statistics 2009)
1.3 ENVIRONMENTAL STRATEGY GROUP – INTERNATIONALAnnual savings per attendee:1,198kg CO210,679km travel7 days (approx 3.5 days of business benefit)£2,800 in addition to lost time costs of £4,1722
Monthly meetings are held between four Telefónica & O2 employees (all flexible/home workers) from Telefónica Europe, Telefónica O2 UK and global Telefónica head office. These replaced six-weekly physical meetings (alternating between the Slough and Madrid offices), thus allowing the team to meet more frequently.
Total savings per month:• Total mileage avoided per month = 3,560 km, of which 13km would have been
travelled by underground, 226km by road and 3321km by air.• Total emissions avoided per month = 399kg CO2• Total travel time saving per month = 17.5 hours (2.3 working days).• Based on assumption that O2 will see the benefit of 50% of any time saving (the
other 50% being improved employee work life balance), the business benefit equates to over a day month.
• Financial saving due to avoidance of mileage and subsistence (food and hotels).
Total Annual Savings:• Total mileage avoided per year = 42,716km, of which 152km would have been
travelled by underground, 2,703km by road and 39,856km by air.• Total emissions avoided per year = 4,793kg CO2• Total travel time saving per year = 210 hours (28 working days).• The business benefit of which is around 14 days per year to O2.• Financial saving due to avoidance of mileage and subsistence (food and hotels).
1.2 HEAD OFFICE TECHNOLOGY TEAM – UKAnnual saving per attendee:575kg CO2 2,837km travel 6 days (approx 3 days of business benefit)£200 per person on petrol, in addition to lost-time costs of approx £3,6001
Eight home-based employees join a virtual meeting every month, avoiding travel to Slough and back.1x York (250 mile round trip)1x Leeds (250 mile round trip)1x Staines (10 mile round trip)1x Newark (275 mile round trip)1x Luton (55 mile round trip)1x Sutton, Surrey (50 mile round trip)1x Nottingham (275 mile round trip)1x Slough (10 mile round trip)
Total savings per month:• Total mileage avoided per month = 1,891km, all of which was travelled by road• Total emissions avoided per month = 384kg CO2• Total travel time saving per month = 30 hours (4 working days).• Based on assumption that O2 will see the benefit of 50% of any time saving (the other
50% being improved employee work life balance), the business benefit equates to 4 days per month.
• Financial saving due to avoidance of mileage and subsistence (food and hotels).
Total Annual Savings:• Total mileage avoided per year = 22,692km, all of which was travelled by road.• Total emissions avoided per year = 4,602kg CO2• Total travel time saving per year = 360 hours (48 working days).• The business benefit of which is around 24 days per year to O2.• Financial saving due to avoidance of mileage and subsistence (food and hotels).

BENCHMARK ANALYSIS
To present the data in the context of best practice in energy use for buildings and organisations of a similar size, we’ve compared the annual consumption of electricity and gas to a standard industry benchmark: Energy Consumption Guide 19 (ECON19) for Energy Use in Offices (April 2003).
ECON19’s benchmark for different office types places O2’s pre-transition buildings in the Type 3 (typical) category. The comparison (summarised in Figure 2.3) shows that actual gas consumption across the pre-transition offices is very similar to the benchmark. In contrast, the actual consumption of electricity is significantly higher than the benchmark.
2.3 SUMMARY OF PRE-TRANSITION ENERGY CONSUMPTION V. BENCHMARK
Post-transition, OurSpace is promoted to the Type 4 (good practice) category of the ECON19 benchmark. Both gas and electricity usage is now consistently lower than, or equal to, the benchmark for this office type1.
2.4 SUMMARY OF POST-TRANSITION ENERGY CONSUMPTION V. BENCHMARK
2. HEAD OFFICE CARBON FOOTPRINT
-50%: ANNUAL CO2 EMISSIONS PER 1,000 SQ FT OURSPACE
2,506tCO2: TOTAL ANNUAL OURSPACE OFFICE EMISSIONS
O2’s experience shows that new communication technologies can have a dramatic effect on the carbon impact of the modern office, especially when combined with environmental improvements in a new office construction and refurbishment. From a previous total annual output of 5,364 tonnes CO2 across O2 in Slough, OurSpace now emits 2,506 tonnes.
18 19
Tomorrow’s workspace
2.1: SUMMARY OF ANNUAL CONSUMPTION AND ASSOCIATED CO2 PRE-TRANSITION
* Number of employees based at the three former Slough offices
* Number of employees based at Slough OurSpace
Electricity
Natural gas
Diesel(backup generator)
7.32
Refrigerant Refill(Air conditioning)
0
Tonnes CO20 500 1,000 1,500 2,000 2,500 3,000 3,500 4,000 4,500 5,000
Electricity
Natural gas
Diesel(backup generator)
6.50
Refrigerant Refill(Air conditioning)
0
Tonnes CO20 500 1,000 1,500 2,000 2,500 3,000 3,500 4,000 4,500 5,000
Total annual CO2 5,364
Total annual CO2 2,506
4,692
664
2,338
168
Electricity
Natural gas
Diesel(backup generator)
7.32
Refrigerant Refill(Air conditioning)
0
Tonnes CO20 500 1,000 1,500 2,000 2,500 3,000 3,500 4,000 4,500 5,000
Electricity
Natural gas
Diesel(backup generator)
6.50
Refrigerant Refill(Air conditioning)
0
Tonnes CO20 500 1,000 1,500 2,000 2,500 3,000 3,500 4,000 4,500 5,000
Total annual CO2 5,364
Total annual CO2 2,506
4,692
664
2,338
168
2.2: SUMMARY OF ANNUAL CONSUMPTION AND ASSOCIATED CO2 POST-TRANSITION
Annual CO2 per 1,000 Ft2 floor area .....23.3
Annual CO2 per employee* ..................2.68
Annual CO2 per desk ............................2.62
Total annual CO2 ................................5,364
Annual CO2 per 1,000 Ft2 floor area .....11.6
Annual CO2 per employee* ..................1.25
Annual CO2 per desk ............................1.67
Total annual CO2 ................................2,506
Electricity .............8,679,993 kWh
Natural gas ..........3,619,081 kWh
Diesel ...................2,774 litres(backup generator)
Refrigerant Refill .0 litres(Air conditioning)
Electricity .............8,679,993 kWh
Natural gas ..........3,619,081 kWh
Diesel ...................2,774 litres(backup generator)
Refrigerant Refill .0 litres(Air conditioning)
Split of CO2 emissions associated withSlough based employee business travel
[3.2.2]: Mode of travel to work by O2 Slough employees
Rail 2%
Car (driver)78.2%
Car (passenger) 1.1%Car share 0.4%
Motorbike 1.1%
Train 12.9%
Taxi 0.3%
Bus 1.3%
Bicycle 1.3%
Walk 1.3%Car (driver)78.2%
Car (passenger)1.1%
Car share 0.4%
Motorbike 1.1%Train 12.9%
Taxi 0.3%
Bus 1.3%
Bicycle 1.3%
Walk 1.3%
Mode of transport % of employees
[3.2.2]: Mode of travel to work by O2 Slough employeesMode of transport % of employees
% of employees
miles % employees
Air 15%
Road 83%
[3.2.3] Employees using the shuttle bus
[3.2.1] Distance travelled by O2 Slough employeesto get to work (one way)
[3.2.4] Summary of estimated annual employee travel to work data for all Slough employees
Distance travelled to work in km (return)
Emissions as proportion of totalSlough footprint –pre and post transition
km (millions)
BetweenSloughoffices 81%
Between trainstation & Bath Roadoffices 19%
0-5 miles 15%
0 5 10 15 20 25 30 35 40
5-10 miles 14%
10-20 miles 24%20-30 miles 21%
30-50 miles 12%
50-70 miles 6%
70-100 miles 3%100+ miles 6%
% of employees
[3.2.3] Employees using the shuttle bus
BetweenSloughoffices 81%
Between trainstation & Bath Roadoffices 19%
Split of CO2 emissions associated withSlough based employee business travel
Rail 2%
Air 15%
Road 83%
miles % employees
[3.2.1] Distance travelled by O2 Slough employeesto get to work (one way)
0-5 miles 15%
5-10 miles 14%
10-20 miles 24%20-30 miles 21%
30-50 miles 12%
50-70 miles 6%
70-100 miles 3% 100+ miles 6%
0 2,000
0%
20%
40%
60%
80%
100%
4,000 6,000 8,000 10,000 12,000 14,000
Office basedemployees
Annual returntravel to office
Hugger sample average
Annual return travelto external meetings
Annual return travelto internal meetings
Return travel toone-off meetings
Miles
29,185,681
36,295,420
Home/flexibleworking employees
Total
kg CO2 associates with travel to work (return)
kg CO2 millions
0 0.5 1 1.5 2 2.5 3 3.5 4 4.5
Office basedemployees 1,395,424
2,790,755
4,187,180
Home/flexibleworking employees
Total
Office
Home
Business Travel
Employee Travelto work
Hopper sample average
0 1 2 3 4 5 6 7
Annual returntravel to office
Journey type
Pre % Post %
Journey typeHugger sample average
Annual return travelto external meetings
Annual return travelto internal meetings
Return travel toone-off meetings
tCO2
Hopper sample average
[2.4] Summary of pre-transition energy consumption v. benchmark
0
100
200
300
400
500
Comparison of pre & post transition emissions
0 1000 0 50 100 150
Good practice
Good practice
Typical
Typical
200 2502000 3000 4000 5000
Electricity
Gas
Diesel
Pre Transition Office Emissions (tonnes CO2)
Annual kgCO2/m2 of treated floor area (FTA)
Heating and hot waterCoolingFans, pumps, controlsHumidificationLighting
Office EquipmentCatering, gasCatering, electricityOther electricityComputer room (where appropriate)
Post Transition Office Emissions (tonnes CO2)
Return distance (miles)
TOTAL 33,437
Travel to theoffice11,566
Travel to externalmeetings 12,268
Travel to internalmeetings 8,519
One-off meetings1,084
[3.1.1]: Business travel by air*
Total – UK wide Km Total – UK wide Kg CO2
Annual Air Travel965,325
Average MonthlyAir Travel
80,444
Average MonthlyAir Travel561,823
Annual Air Travel6,741,878
CO2 emissions (tonnes)
TOTAL 13
Travel to theoffice3.70
Travel to externalmeetings 2.88
Travel to internalmeetings 6.44
One-off meetings0.234
Time taken (working days)
TOTAL 124.1
Travel to theoffice20.2
Travel to externalmeetings 28.1
Travel to internalmeetings 75.8
Gas (Annual consumption kWh/m2)Electricity (Annual consumption kWh/m2)
Annualconsumptionbenchmark
178
226
432 434
340
405
162
212
137
169
Bath Road BrunelWay
WellingtonStreet
Pre-TransitionTotal
[2.5] Summary of post-transition energy consumption v. benchmark
0
100
200
300
400
500
Gas (Annual consumption kWh/m2)Electricity (Annual consumption kWh/m2)*
Annualconsumptionbenchmark
114
234 234 221 215
45 4523
44
West Side East Side Link Post-TransitionTotal
[3.1.3]: Business travel by road*
Total – UK wide KmAnnual Fleet Milage
21,451,083
Annual Private &Hire Car Milage
3,905,567
Average MonthlyRoad Travel2,113,054
Total AnnualRoad Travel25,356,650
Total – Slough Km Total – Slough Kg CO2
Annual Air Travel171,571
Average MonthlyAir Travel
14,298
Average MonthlyAir Travel
99,855
Annual Air Travel1,198,256
[3.1.2]: Business travel by rail*
Total – UK wide Km Total – UK wide Kg CO2
Annual Rail Travel113,428
Average MonthlyRail Travel
9,452
Average MonthlyRail Travel
163,706
Annual Rail Travel1,964,468
Total – Slough Km Total – Slough Kg CO2
Annual Rail Travel20,160
Average MonthlyRail Travel
1,680
Average MonthlyRail Travel
29,096
Annual Rail Travel349,151
[7.1]: Total annual emissions of O2 slough
Pre-Transition (tonnes)
Total 10,949
Office5,364
Home259
Business Travel1,139
Employeetravel to work
4,187
[3.1.4]: Summary of distances and emissions from 2009 employee business travel*
Annual Total – UK Wide KmAir*
6,741,878
Rail**1,964,468
Road***25,356,650
Total 34,062,996
Annual Total – UK Wide Tonnes CO2Air*965
Rail**113
Road***5,331
Total 6,410
Annual Total Slough – KmAir*
1,198,256
Rail**349,151
Road***4,506,722
Total 6,054,130
Annual Total Slough – Tonnes CO2Air*172
Rail**20
Road***948
Total 1,139
Total – UK wide CO2
Annual Fleet Milage4,561,668
Annual Private &Hire Car Milage
769,774
Average MonthlyRoad Travel
444,287
Total AnnualRoad Travel5,331,442
Total – Slough Km
Annual Fleet Milage3,812,572
Annual Private &Hire Car Milage
694,150
Average MonthlyRoad Travel
375,560
Total AnnualRoad Travel4,506,722
Total – Slough Kg CO2
Annual Fleet Milage810,761
Annual Private &Hire Car Milage
136,815
Average MonthlyRoad Travel
78,965
Total AnnualRoad Travel
947,575
Post-Transition (tonnes)
Total 8,091
Office2,506
Sale
s M
anag
er S
loug
h
Home259
Business Travel1,139
Employeetravel to work
4,187
[7.2]: Split between emissions sources, pre- and post-transition
Pre-Transition (Tonnes CO2)
Total 10,949
Office5,364
Home259
Business Travel1,139
Employeetravel to work
4,187
Pre-Transition (%)
Total 100%
Office49%
Home2%
Business Travel10%
Employeetravel to work
38%
Post-Transition (Tonnes CO2)
Total 8,091
Office2,506
Home259
Business Travel1,139
Employeetravel to work
4,187
Post-Transition (%)
Total 100%
Office31%
Home3%
Business Travel14%
Employeetravel to work
52%
[5.2]: Hugger sample annual footprint for travel to the office
[2.6]: Comparison of pre and post transition emissions
Return distance (miles)
Total annual CO2
Variance -53%
Average 5,092
6,156
Post TransitionTonnes CO2
5,3642,506
Pre TransitionTonnes CO2
8,208
912
CO2 emissions (tonnes)
Average 1.42
2.53
1.41
0.31
Time taken (working days)
Average 32.1
40.5
40.5
15.2
Annual CO2 per 1,000 Ft2 floor area
Variance -50%
Post TransitionTonnes CO2
23.311.6
Pre TransitionTonnes CO2
Annual CO2 per employee*
Variance -53%
Post TransitionTonnes CO2
2.681.25
Pre TransitionTonnes CO2
Annual CO2 per desk
Variance -36%
Post TransitionTonnes CO2
2.621.67
Pre TransitionTonnes CO2
0
20
40
60
80
100
Day
s w
ork
ing
at
ho
me/
year
An
nu
al e
mis
sio
ns
(kg
) as
soci
ated
wit
h h
om
e w
ork
ing
90
Sale
s M
anag
er S
loug
h
68
Sale
s M
anag
er L
eeds
90
Flex
ible
wor
ker L
eeds
*
0
Flex
ible
wor
ker S
loug
h*
0
Sale
s M
anag
er S
loug
h
0
40
80
120
160
200
39
Sale
s M
anag
er S
loug
h
153
Sale
s M
anag
er L
eeds
165
Flex
ible
wor
ker L
eeds
*
0
Flex
ible
wor
ker S
loug
h*
0
An
nu
al e
mis
sio
ns
(kg
) as
soci
ated
wit
hd
isp
laci
ng
th
e an
nu
al h
om
e w
ork
ing
day
s w
ith
day
s w
ork
ing
fro
m t
he
reg
ion
al o
ffic
e
Sale
s M
anag
er S
loug
h
0
2,000
4,000
6,000
8,000
10,000
Energy Travel
8,561
Sale
s M
anag
er S
loug
h
2,240
Sale
s M
anag
er L
eeds
2,898
Flex
ible
wor
ker L
eeds
*
0
Flex
ible
wor
ker S
loug
h*
0
Emis
sio
ns
avo
ided
(kg
) th
rou
gh
ho
me
wo
rkin
g p
er y
ear
Sale
s M
anag
er S
loug
h
0
2,000
4,000
6,000
8,000
10,0008,552
Sale
s M
anag
er S
loug
h
2,087
Sale
s M
anag
er L
eeds
2,824
Flex
ible
wor
ker L
eeds
*
0
Flex
ible
wor
ker S
loug
h*
0 Trav
el t
ime
avo
ided
(w
ork
ing
day
s)th
rou
gh
ho
me
wo
rkin
g p
er y
ear
Sale
s M
anag
er S
loug
h
0
6
12
18
24
3030
Sale
s M
anag
er S
loug
h
7
Sale
s M
anag
er L
eeds
12
Flex
ible
wor
ker L
eeds
*
0
Flex
ible
wor
ker S
loug
h*
0
7,109,739
1. Please see Appendix 3 to compare indices for types 3 & 4 office, ECON19* Electricity consumption for the Link is included within the data for the West Side
Split of CO2 emissions associated withSlough based employee business travel
[3.2.2]: Mode of travel to work by O2 Slough employees
Rail 2%
Car (driver)78.2%
Car (passenger) 1.1%Car share 0.4%
Motorbike 1.1%
Train 12.9%
Taxi 0.3%
Bus 1.3%
Bicycle 1.3%
Walk 1.3%Car (driver)78.2%
Car (passenger)1.1%
Car share 0.4%
Motorbike 1.1%Train 12.9%
Taxi 0.3%
Bus 1.3%
Bicycle 1.3%
Walk 1.3%
Mode of transport % of employees
[3.2.2]: Mode of travel to work by O2 Slough employeesMode of transport % of employees
% of employees
miles % employees
Air 15%
Road 83%
[3.2.3] Employees using the shuttle bus
[3.2.1] Distance travelled by O2 Slough employeesto get to work (one way)
[3.2.4] Summary of estimated annual employee travel to work data for all Slough employees
Distance travelled to work in km (return)
Emissions as proportion of totalSlough footprint –pre and post transition
km (millions)
BetweenSloughoffices 81%
Between trainstation & Bath Roadoffices 19%
0-5 miles 15%
0 5 10 15 20 25 30 35 40
5-10 miles 14%
10-20 miles 24%20-30 miles 21%
30-50 miles 12%
50-70 miles 6%
70-100 miles 3%100+ miles 6%
% of employees
[3.2.3] Employees using the shuttle bus
BetweenSloughoffices 81%
Between trainstation & Bath Roadoffices 19%
Split of CO2 emissions associated withSlough based employee business travel
Rail 2%
Air 15%
Road 83%
miles % employees
[3.2.1] Distance travelled by O2 Slough employeesto get to work (one way)
0-5 miles 15%
5-10 miles 14%
10-20 miles 24%20-30 miles 21%
30-50 miles 12%
50-70 miles 6%
70-100 miles 3% 100+ miles 6%
0 2,000
0%
20%
40%
60%
80%
100%
4,000 6,000 8,000 10,000 12,000 14,000
Office basedemployees
Annual returntravel to office
Hugger sample average
Annual return travelto external meetings
Annual return travelto internal meetings
Return travel toone-off meetings
Miles
29,185,681
36,295,420
Home/flexibleworking employees
Total
kg CO2 associates with travel to work (return)
kg CO2 millions
0 0.5 1 1.5 2 2.5 3 3.5 4 4.5
Office basedemployees 1,395,424
2,790,755
4,187,180
Home/flexibleworking employees
Total
Office
Home
Business Travel
Employee Travelto work
Hopper sample average
0 1 2 3 4 5 6 7
Annual returntravel to office
Journey type
Pre % Post %
Journey typeHugger sample average
Annual return travelto external meetings
Annual return travelto internal meetings
Return travel toone-off meetings
tCO2
Hopper sample average
[2.4] Summary of pre-transition energy consumption v. benchmark
0
100
200
300
400
500
Comparison of pre & post transition emissions
0 1000 0 50 100 150
Good practice
Good practice
Typical
Typical
200 2502000 3000 4000 5000
Electricity
Gas
Diesel
Pre Transition Office Emissions (tonnes CO2)
Annual kgCO2/m2 of treated floor area (FTA)
Heating and hot waterCoolingFans, pumps, controlsHumidificationLighting
Office EquipmentCatering, gasCatering, electricityOther electricityComputer room (where appropriate)
Post Transition Office Emissions (tonnes CO2)
Return distance (miles)
TOTAL 33,437
Travel to theoffice11,566
Travel to externalmeetings 12,268
Travel to internalmeetings 8,519
One-off meetings1,084
[3.1.1]: Business travel by air*
Total – UK wide Km Total – UK wide Kg CO2
Annual Air Travel965,325
Average MonthlyAir Travel
80,444
Average MonthlyAir Travel561,823
Annual Air Travel6,741,878
CO2 emissions (tonnes)
TOTAL 13
Travel to theoffice3.70
Travel to externalmeetings 2.88
Travel to internalmeetings 6.44
One-off meetings0.234
Time taken (working days)
TOTAL 124.1
Travel to theoffice20.2
Travel to externalmeetings 28.1
Travel to internalmeetings 75.8
Gas (Annual consumption kWh/m2)Electricity (Annual consumption kWh/m2)
Annualconsumptionbenchmark
178
226
432 434
340
405
162
212
137
169
Bath Road BrunelWay
WellingtonStreet
Pre-TransitionTotal
[2.5] Summary of post-transition energy consumption v. benchmark
0
100
200
300
400
500
Gas (Annual consumption kWh/m2)Electricity (Annual consumption kWh/m2)*
Annualconsumptionbenchmark
114
234 234 221 215
45 4523
44
West Side East Side Link Post-TransitionTotal
[3.1.3]: Business travel by road*
Total – UK wide KmAnnual Fleet Milage
21,451,083
Annual Private &Hire Car Milage
3,905,567
Average MonthlyRoad Travel2,113,054
Total AnnualRoad Travel25,356,650
Total – Slough Km Total – Slough Kg CO2
Annual Air Travel171,571
Average MonthlyAir Travel
14,298
Average MonthlyAir Travel
99,855
Annual Air Travel1,198,256
[3.1.2]: Business travel by rail*
Total – UK wide Km Total – UK wide Kg CO2
Annual Rail Travel113,428
Average MonthlyRail Travel
9,452
Average MonthlyRail Travel
163,706
Annual Rail Travel1,964,468
Total – Slough Km Total – Slough Kg CO2
Annual Rail Travel20,160
Average MonthlyRail Travel
1,680
Average MonthlyRail Travel
29,096
Annual Rail Travel349,151
[7.1]: Total annual emissions of O2 slough
Pre-Transition (tonnes)
Total 10,949
Office5,364
Home259
Business Travel1,139
Employeetravel to work
4,187
[3.1.4]: Summary of distances and emissions from 2009 employee business travel*
Annual Total – UK Wide KmAir*
6,741,878
Rail**1,964,468
Road***25,356,650
Total 34,062,996
Annual Total – UK Wide Tonnes CO2Air*965
Rail**113
Road***5,331
Total 6,410
Annual Total Slough – KmAir*
1,198,256
Rail**349,151
Road***4,506,722
Total 6,054,130
Annual Total Slough – Tonnes CO2Air*172
Rail**20
Road***948
Total 1,139
Total – UK wide CO2
Annual Fleet Milage4,561,668
Annual Private &Hire Car Milage
769,774
Average MonthlyRoad Travel
444,287
Total AnnualRoad Travel5,331,442
Total – Slough Km
Annual Fleet Milage3,812,572
Annual Private &Hire Car Milage
694,150
Average MonthlyRoad Travel
375,560
Total AnnualRoad Travel4,506,722
Total – Slough Kg CO2
Annual Fleet Milage810,761
Annual Private &Hire Car Milage
136,815
Average MonthlyRoad Travel
78,965
Total AnnualRoad Travel
947,575
Post-Transition (tonnes)
Total 8,091
Office2,506
Sale
s M
anag
er S
loug
h
Home259
Business Travel1,139
Employeetravel to work
4,187
[7.2]: Split between emissions sources, pre- and post-transition
Pre-Transition (Tonnes CO2)
Total 10,949
Office5,364
Home259
Business Travel1,139
Employeetravel to work
4,187
Pre-Transition (%)
Total 100%
Office49%
Home2%
Business Travel10%
Employeetravel to work
38%
Post-Transition (Tonnes CO2)
Total 8,091
Office2,506
Home259
Business Travel1,139
Employeetravel to work
4,187
Post-Transition (%)
Total 100%
Office31%
Home3%
Business Travel14%
Employeetravel to work
52%
[5.2]: Hugger sample annual footprint for travel to the office
[2.6]: Comparison of pre and post transition emissions
Return distance (miles)
Total annual CO2
Variance -53%
Average 5,092
6,156
Post TransitionTonnes CO2
5,3642,506
Pre TransitionTonnes CO2
8,208
912
CO2 emissions (tonnes)
Average 1.42
2.53
1.41
0.31
Time taken (working days)
Average 32.1
40.5
40.5
15.2
Annual CO2 per 1,000 Ft2 floor area
Variance -50%
Post TransitionTonnes CO2
23.311.6
Pre TransitionTonnes CO2
Annual CO2 per employee*
Variance -53%
Post TransitionTonnes CO2
2.681.25
Pre TransitionTonnes CO2
Annual CO2 per desk
Variance -36%
Post TransitionTonnes CO2
2.621.67
Pre TransitionTonnes CO2
0
20
40
60
80
100
Day
s w
ork
ing
at
ho
me/
year
An
nu
al e
mis
sio
ns
(kg
) as
soci
ated
wit
h h
om
e w
ork
ing
90
Sale
s M
anag
er S
loug
h
68
Sale
s M
anag
er L
eeds
90
Flex
ible
wor
ker L
eeds
*
0
Flex
ible
wor
ker S
loug
h*
0
Sale
s M
anag
er S
loug
h
0
40
80
120
160
200
39
Sale
s M
anag
er S
loug
h
153
Sale
s M
anag
er L
eeds
165
Flex
ible
wor
ker L
eeds
*
0
Flex
ible
wor
ker S
loug
h*
0
An
nu
al e
mis
sio
ns
(kg
) as
soci
ated
wit
hd
isp
laci
ng
th
e an
nu
al h
om
e w
ork
ing
day
s w
ith
day
s w
ork
ing
fro
m t
he
reg
ion
al o
ffic
e
Sale
s M
anag
er S
loug
h
0
2,000
4,000
6,000
8,000
10,000
Energy Travel
8,561
Sale
s M
anag
er S
loug
h
2,240
Sale
s M
anag
er L
eeds
2,898
Flex
ible
wor
ker L
eeds
*
0
Flex
ible
wor
ker S
loug
h*
0
Emis
sio
ns
avo
ided
(kg
) th
rou
gh
ho
me
wo
rkin
g p
er y
ear
Sale
s M
anag
er S
loug
h
0
2,000
4,000
6,000
8,000
10,0008,552
Sale
s M
anag
er S
loug
h
2,087
Sale
s M
anag
er L
eeds
2,824
Flex
ible
wor
ker L
eeds
*
0
Flex
ible
wor
ker S
loug
h*
0 Trav
el t
ime
avo
ided
(w
ork
ing
day
s)th
rou
gh
ho
me
wo
rkin
g p
er y
ear
Sale
s M
anag
er S
loug
h
0
6
12
18
24
3030
Sale
s M
anag
er S
loug
h
7
Sale
s M
anag
er L
eeds
12
Flex
ible
wor
ker L
eeds
*
0
Flex
ible
wor
ker S
loug
h*
0
7,109,739

20 21
Tomorrow’s workspace
[2.6]: Comparison of pre and post transition emissions
Total annual CO2 (tonnes)
Variance -53%
Post TransitionTonnes CO2
5,3642,506
Pre TransitionTonnes CO2
Annual CO2 per 1,000 Ft2 floor area
Variance +50%
Post TransitionTonnes CO2
23.311.6
Pre TransitionTonnes CO2
Annual CO2 per employee*
Variance +53%
Post TransitionTonnes CO2
2.681.25
Pre TransitionTonnes CO2
Annual CO2 per desk (tonnes)
Variance -36%
Post TransitionTonnes CO2
2.621.67
Pre TransitionTonnes CO2
2.5 COMPARISON OF PRE AND POST TRANSITION EMISSIONS
SUMMARY AND CHALLENGES
Benchmarking reveals that OurSpace exceeds industry good practice for both electricity and gas performance.
Our building employs a suite of systems to ensure its environmental performance is strong (see pages 12 and 13). This has created an office whose carbon footprint outperforms our former sites in Slough.
The results are impressive. Figure 2.5 shows a 53% reduction in total annual CO2 emissions. Taking a 6% reduction in floor space into account, the data suggests that, once fully operational, OurSpace will capture an overall 47% reduction in total emissions.
Moreover – thanks to more efficient use of space, work stations, meeting rooms and work areas – an estimated 36% reduction in carbon emissions by total number of desks is envisaged.
However, it’s only through smarter working that the environmental office evolution is truly achieved. Businesses must also capture the benefits of flexible working and take steps to tackle the issue of business travel, as well as the effects of the employee commute (Chapter 3).

1. Data provided by contract bookings services, together with actual employee road mileage claims.2. Defra/DECC’s GHG Conversion Factors for Company Reporting (version 2.0; 30/09/2009)3. Given that limited business travel is undertaken by office-based employees (as illustrated in employee interviews, chapter 5),
O2’s UK-wide travel data is extrapolated to take into account the impact of home- and flexible-working, which – across O2 UK – is more widespread in Slough.
4. To fairly represent employee rail travel, monthly travel is based on data for the three-month period November 2009 to January 2010, which follows an awareness programme and a subsequent increase in direct corporate bookings.
3. TRAVEL CARBON FOOTPRINT
1,139tCO2: TOTAL ANNUAL SLOUGH EMPLOYEE BUSINESS TRAVEL EMISSIONS
of which,
83%: CONTRIBUTION BY ROAD
Our travel data was collected and analysed in early 2010. It does not seek to draw comparisons between the effects of the move to OurSpace1. In our conclusions, we’ll discuss the uptake and impact of technology and its potential to harness carbon savings related to travel.
3.1 TRAVELLING ON BUSINESS
Employee business travel is split by three primary modes: air, rail and road. The calculation of related emissions uses latest UK government emissions factors2. Our data is based on total business travel undertaken by all O2 UK employees, pro-rated to provide figures for O2 Slough-based contract employees3.
Flight travel for O2 is typically broken down as 41.5% internal UK, with the remaining 58.5% associated with international trips.
BUSINESS TRAVEL SUMMARY
3.1.1: SUMMARY OF DISTANCES AND EMISSIONS FROM 2009 EMPLOYEE BUSINESS TRAVEL
23
Split of CO2 emissions associated withSlough based employee business travel
[3.2.2]: Mode of travel to work by O2 Slough employees
Rail 2%
Car (driver)78.2%
Car (passenger) 1.1%Car share 0.4%
Motorbike 1.1%
Train 12.9%
Taxi 0.3%
Bus 1.3%
Bicycle 1.3%
Walk 1.3%Car (driver)78.2%
Car (passenger)1.1%
Car share 0.4%
Motorbike 1.1%Train 12.9%
Taxi 0.3%
Bus 1.3%
Bicycle 1.3%
Walk 1.3%
Mode of transport % of employees
[3.2.2]: Mode of travel to work by O2 Slough employeesMode of transport % of employees
% of employees
miles % employees
Air 15%
Road 83%
[3.2.3] Employees using the shuttle bus
[3.2.1] Distance travelled by O2 Slough employeesto get to work (one way)
[3.2.4] Summary of estimated annual employee travel to work data for all Slough employees
Distance travelled to work in km (return)
Emissions as proportion of totalSlough footprint –pre and post transition
km (millions)
BetweenSloughoffices 81%
Between trainstation & Bath Roadoffices 19%
0-5 miles 15%
0 5 10 15 20 25 30 35 40
5-10 miles 14%
10-20 miles 24%20-30 miles 21%
30-50 miles 12%
50-70 miles 6%
70-100 miles 3%100+ miles 6%
% of employees
[3.2.3] Employees using the shuttle bus
BetweenSloughoffices 81%
Between trainstation & Bath Roadoffices 19%
Split of CO2 emissions associated withSlough based employee business travel
Rail 2%
Air 15%
Road 83%
miles % employees
[3.2.1] Distance travelled by O2 Slough employeesto get to work (one way)
0-5 miles 15%
5-10 miles 14%
10-20 miles 24%20-30 miles 21%
30-50 miles 12%
50-70 miles 6%
70-100 miles 3% 100+ miles 6%
0 2,000
0%
20%
40%
60%
80%
100%
4,000 6,000 8,000 10,000 12,000 14,000
Office basedemployees
Annual returntravel to office
Hugger sample average
Annual return travelto external meetings
Annual return travelto internal meetings
Return travel toone-off meetings
Miles
29,185,681
36,295,420
Home/flexibleworking employees
Total
kg CO2 associates with travel to work (return)
kg CO2 millions
0 0.5 1 1.5 2 2.5 3 3.5 4 4.5
Office basedemployees 1,395,424
2,790,755
4,187,180
Home/flexibleworking employees
Total
Office
Home
Business Travel
Employee Travelto work
Hopper sample average
0 1 2 3 4 5 6 7
Annual returntravel to office
Journey type
Pre % Post %
Journey typeHugger sample average
Annual return travelto external meetings
Annual return travelto internal meetings
Return travel toone-off meetings
tCO2
Hopper sample average
[2.4] Summary of pre-transition energy consumption v. benchmark
0
100
200
300
400
500
Comparison of pre & post transition emissions
0 1000 0 50 100 150
Good practice
Good practice
Typical
Typical
200 2502000 3000 4000 5000
Electricity
Gas
Diesel
Pre Transition Office Emissions (tonnes CO2)
Annual kgCO2/m2 of treated floor area (FTA)
Heating and hot waterCoolingFans, pumps, controlsHumidificationLighting
Office EquipmentCatering, gasCatering, electricityOther electricityComputer room (where appropriate)
Post Transition Office Emissions (tonnes CO2)
Return distance (miles)
TOTAL 33,437
Travel to theoffice11,566
Travel to externalmeetings 12,268
Travel to internalmeetings 8,519
One-off meetings1,084
[3.1.1]: Business travel by air*
Total – UK wide Km Total – UK wide Kg CO2
Annual Air Travel965,325
Average MonthlyAir Travel
80,444
Average MonthlyAir Travel561,823
Annual Air Travel6,741,878
CO2 emissions (tonnes)
TOTAL 13
Travel to theoffice3.70
Travel to externalmeetings 2.88
Travel to internalmeetings 6.44
One-off meetings0.234
Time taken (working days)
TOTAL 124.1
Travel to theoffice20.2
Travel to externalmeetings 28.1
Travel to internalmeetings 75.8
Gas (Annual consumption kWh/m2)Electricity (Annual consumption kWh/m2)
Annualconsumptionbenchmark
178
226
432 434
340
405
162
212
137
169
Bath Road BrunelWay
WellingtonStreet
Pre-TransitionTotal
[2.5] Summary of post-transition energy consumption v. benchmark
0
100
200
300
400
500
Gas (Annual consumption kWh/m2)Electricity (Annual consumption kWh/m2)*
Annualconsumptionbenchmark
114
234 234 221 215
45 4523
44
West Side East Side Link Post-TransitionTotal
[3.1.3]: Business travel by road*
Total – UK wide KmAnnual Fleet Milage
21,451,083
Annual Private &Hire Car Milage
3,905,567
Average MonthlyRoad Travel2,113,054
Total AnnualRoad Travel25,356,650
Total – Slough Km Total – Slough Kg CO2
Annual Air Travel171,571
Average MonthlyAir Travel
14,298
Average MonthlyAir Travel
99,855
Annual Air Travel1,198,256
[3.1.2]: Business travel by rail*
Total – UK wide Km Total – UK wide Kg CO2
Annual Rail Travel113,428
Average MonthlyRail Travel
9,452
Average MonthlyRail Travel
163,706
Annual Rail Travel1,964,468
Total – Slough Km Total – Slough Kg CO2
Annual Rail Travel20,160
Average MonthlyRail Travel
1,680
Average MonthlyRail Travel
29,096
Annual Rail Travel349,151
[7.1]: Total annual emissions of O2 slough
Pre-Transition (tonnes)
Total 10,949
Office5,364
Home259
Business Travel1,139
Employeetravel to work
4,187
[3.1.4]: Summary of distances and emissions from 2009 employee business travel*
Annual Total – UK Wide KmAir*
6,741,878
Rail**1,964,468
Road***25,356,650
Total 34,062,996
Annual Total – UK Wide Tonnes CO2Air*965
Rail**113
Road***5,331
Total 6,410
Annual Total Slough – KmAir*
1,198,256
Rail**349,151
Road***4,506,722
Total 6,054,130
Annual Total Slough – Tonnes CO2Air*172
Rail**20
Road***948
Total 1,139
Total – UK wide CO2
Annual Fleet Milage4,561,668
Annual Private &Hire Car Milage
769,774
Average MonthlyRoad Travel
444,287
Total AnnualRoad Travel5,331,442
Total – Slough Km
Annual Fleet Milage3,812,572
Annual Private &Hire Car Milage
694,150
Average MonthlyRoad Travel
375,560
Total AnnualRoad Travel4,506,722
Total – Slough Kg CO2
Annual Fleet Milage810,761
Annual Private &Hire Car Milage
136,815
Average MonthlyRoad Travel
78,965
Total AnnualRoad Travel
947,575
Post-Transition (tonnes)
Total 8,091
Office2,506
Sale
s M
anag
er S
loug
h
Home259
Business Travel1,139
Employeetravel to work
4,187
[7.2]: Split between emissions sources, pre- and post-transition
Pre-Transition (Tonnes CO2)
Total 10,949
Office5,364
Home259
Business Travel1,139
Employeetravel to work
4,187
Pre-Transition (%)
Total 100%
Office49%
Home2%
Business Travel10%
Employeetravel to work
38%
Post-Transition (Tonnes CO2)
Total 8,091
Office2,506
Home259
Business Travel1,139
Employeetravel to work
4,187
Post-Transition (%)
Total 100%
Office31%
Home3%
Business Travel14%
Employeetravel to work
52%
[5.2]: Hugger sample annual footprint for travel to the office
[2.6]: Comparison of pre and post transition emissions
Return distance (miles)
Total annual CO2
Variance -53%
Average 5,092
6,156
Post TransitionTonnes CO2
5,3642,506
Pre TransitionTonnes CO2
8,208
912
CO2 emissions (tonnes)
Average 1.42
2.53
1.41
0.31
Time taken (working days)
Average 32.1
40.5
40.5
15.2
Annual CO2 per 1,000 Ft2 floor area
Variance -50%
Post TransitionTonnes CO2
23.311.6
Pre TransitionTonnes CO2
Annual CO2 per employee*
Variance -53%
Post TransitionTonnes CO2
2.681.25
Pre TransitionTonnes CO2
Annual CO2 per desk
Variance -36%
Post TransitionTonnes CO2
2.621.67
Pre TransitionTonnes CO2
0
20
40
60
80
100
Day
s w
ork
ing
at
ho
me/
year
An
nu
al e
mis
sio
ns
(kg
) as
soci
ated
wit
h h
om
e w
ork
ing
90
Sale
s M
anag
er S
loug
h
68
Sale
s M
anag
er L
eeds
90
Flex
ible
wor
ker L
eeds
*
0
Flex
ible
wor
ker S
loug
h*
0
Sale
s M
anag
er S
loug
h
0
40
80
120
160
200
39
Sale
s M
anag
er S
loug
h
153
Sale
s M
anag
er L
eeds
165
Flex
ible
wor
ker L
eeds
*
0
Flex
ible
wor
ker S
loug
h*
0
An
nu
al e
mis
sio
ns
(kg
) as
soci
ated
wit
hd
isp
laci
ng
th
e an
nu
al h
om
e w
ork
ing
day
s w
ith
day
s w
ork
ing
fro
m t
he
reg
ion
al o
ffic
e
Sale
s M
anag
er S
loug
h
0
2,000
4,000
6,000
8,000
10,000
Energy Travel
8,561
Sale
s M
anag
er S
loug
h
2,240
Sale
s M
anag
er L
eeds
2,898
Flex
ible
wor
ker L
eeds
*
0
Flex
ible
wor
ker S
loug
h*
0
Emis
sio
ns
avo
ided
(kg
) th
rou
gh
ho
me
wo
rkin
g p
er y
ear
Sale
s M
anag
er S
loug
h
0
2,000
4,000
6,000
8,000
10,0008,552
Sale
s M
anag
er S
loug
h
2,087
Sale
s M
anag
er L
eeds
2,824
Flex
ible
wor
ker L
eeds
*
0
Flex
ible
wor
ker S
loug
h*
0 Trav
el t
ime
avo
ided
(w
ork
ing
day
s)th
rou
gh
ho
me
wo
rkin
g p
er y
ear
Sale
s M
anag
er S
loug
h
0
6
12
18
24
3030
Sale
s M
anag
er S
loug
h
7
Sale
s M
anag
er L
eeds
12
Flex
ible
wor
ker L
eeds
*
0
Flex
ible
wor
ker S
loug
h*
0
7,109,739
22
Tomorrow’s workspace
* AIR: A factor of 50% has been added to the total monthly and annual data to account for travel by air not booked via our corporate travel agent, as agreed with O2 and supported by data analysis of a new internal online bookings system.
** RAIL: A factor of 20% has been added to the total monthly and annual data to take account of rail travel not booked via our corporate agent.4
*** ROAD: Data related to business travel by road – either in fleet, company or private cars – is collected from O2’s formal accounting of actual employee business mileage claims.

Figure 3.1.2 (below), sets out the split of annual emissions associated with Slough-based employee business travel, by mode of transport.
3.1.2: SPLIT OF SLOUGH EMPLOYEE BUSINESS TRAVEL EMISSIONS BY MODE OF TRANSPORT 2009
IMPACT ON TIME
Apart from the emissions clocked-up by business travel, the associated loss of work-time has social, financial and productivity implications for employees and O2.
The time cost of business travel is difficult to calculate but important to acknowledge.
For example, flight duration on its own would not accurately reflect the hours spent travelling to and from airports, check-in times and delays, or the fact that some work could be undertaken in flight.
More so than for air travel, the chief advantage of rail is the ability to stay connected and continue to work while on the move. The smart phone and other Wi-Fi technologies used by O2 are now common tools for the modern day office worker. They are well suited to rail travel.
Most significantly, our persona interviews show that the vast majority of work-time lost is when employees travel by road. This, by its very nature, prevents work being undertaken while in transit (Chapter 5).
SUMMARY AND CHALLENGES
Our travel data confirms that business travel by road is the most significant contributor to travel CO2 emissions: Figure 3.1.2 shows that 83% of Slough employees’ business travel emissions are entirely attributable to road travel.
Emissions from air and rail business travel are 15% and 2% respectively.
O2’s business is spread across a wide area, with key offices located near Slough, Manchester, Liverpool, Glasgow and Leeds. For hoppers, this means frequent trips along the length and breadth of the UK.
O2 is not untypical of many UK businesses in this respect. The challenge for similar businesses is to enable their people to switch from travel to technology.
For air, almost 60% of O2’s travel is for overseas trips in and outside the Telefónica Group. This includes a significant proportion of long-haul trips where time zones and lack of equivalent technology can hinder the ability to connect to virtual meetings.
Note as well that, on average, rail emissions of CO2 per passenger/km are approximately half those of travel by car, and approximately one third those of air1. Thus, although almost 6% of O2’s travel is by rail, it accounts for only 2% of total carbon emissions. The low carbon footprint associated with rail, and the ability to stay connected, must make this the preferred choice for our business.
The significant effect of road travel at O2 is perhaps unsurprising. We have a wide geographical spread of offices and retail outlets, as well as the need for sales people to visit existing and potential business customers around the country. For this type of travel, inevitably, employees need a fleet/company car and/or a mileage allowance for use of their own car.
Consequently, we have looked at how to encourage greener options and made recent revisions to our travel policy.
The initiatives include:
• Establishing the use of communication technology as ‘first choice’.• Incentives for choosing rail over air and/or car with the offer of advanced purchase 1st
class tickets;• Financial incentives for car sharing to business meetings; • Stipulation that business hire cars are within category C or lower, except for journeys of
over 150 miles, when a category D car may be selected.• Sourcing future cars for the fleet with better environmental performance.
Our findings suggest that companies with high travel requirements should look at ways to ‘green’ their business travel. These could include financial incentives to influence employees’ choice of work or travel mode.
Environmentalists share this view. In its policy statement on UK business travel 2009, the World Wildlife Fund makes recommendations to government to create a regulatory and fiscal framework that encourages companies to make sustainable travel choices.
The recommendations include: tax incentives to promote more investment in and use of videoconferencing, and incentives for low-emission and electric cars2.
1. See Fact sheet: Why travelling by rail is better for the environment by Friends of the Earth, available at http://www.foe.co.uk/resource/factsheets/travelling_rail_better.pdf
2. WWF-UK policy statement on business travel, Luke Wreford and Jean Leston, July 2009: http://assets.wwf.org.uk/downloads/business_travel_ps_0709.pdf24 25
Tomorrow’s workspace
Split of CO2 emissions associated withSlough based employee business travel
[3.2.2]: Mode of travel to work by O2 Slough employees
Rail 2%
Car (driver)78.2%
Car (passenger) 1.1%Car share 0.4%
Motorbike 1.1%
Train 12.9%
Taxi 0.3%
Bus 1.3%
Bicycle 1.3%
Walk 1.3%Car (driver)78.2%
Car (passenger)1.1%
Car share 0.4%
Motorbike 1.1%Train 12.9%
Taxi 0.3%
Bus 1.3%
Bicycle 1.3%
Walk 1.3%
Mode of transport % of employees
[3.2.2]: Mode of travel to work by O2 Slough employeesMode of transport % of employees
% of employees
miles % employees
Air 15%
Road 83%
[3.2.3] Employees using the shuttle bus
[3.2.1] Distance travelled by O2 Slough employeesto get to work (one way)
[3.2.4] Summary of estimated annual employee travel to work data for all Slough employees
Distance travelled to work in km (return)
Emissions as proportion of totalSlough footprint –pre and post transition
km (millions)
BetweenSloughoffices 81%
Between trainstation & Bath Roadoffices 19%
0-5 miles 15%
0 5 10 15 20 25 30 35 40
5-10 miles 14%
10-20 miles 24%20-30 miles 21%
30-50 miles 12%
50-70 miles 6%
70-100 miles 3%100+ miles 6%
% of employees
[3.2.3] Employees using the shuttle bus
BetweenSloughoffices 81%
Between trainstation & Bath Roadoffices 19%
Split of CO2 emissions associated withSlough based employee business travel
Rail 2%
Air 15%
Road 83%
miles % employees
[3.2.1] Distance travelled by O2 Slough employeesto get to work (one way)
0-5 miles 15%
5-10 miles 14%
10-20 miles 24%20-30 miles 21%
30-50 miles 12%
50-70 miles 6%
70-100 miles 3% 100+ miles 6%
0 2,000
0%
20%
40%
60%
80%
100%
4,000 6,000 8,000 10,000 12,000 14,000
Office basedemployees
Annual returntravel to office
Hugger sample average
Annual return travelto external meetings
Annual return travelto internal meetings
Return travel toone-off meetings
Miles
29,185,681
36,295,420
Home/flexibleworking employees
Total
kg CO2 associates with travel to work (return)
kg CO2 millions
0 0.5 1 1.5 2 2.5 3 3.5 4 4.5
Office basedemployees 1,395,424
2,790,755
4,187,180
Home/flexibleworking employees
Total
Office
Home
Business Travel
Employee Travelto work
Hopper sample average
0 1 2 3 4 5 6 7
Annual returntravel to office
Journey type
Pre % Post %
Journey typeHugger sample average
Annual return travelto external meetings
Annual return travelto internal meetings
Return travel toone-off meetings
tCO2
Hopper sample average
[2.4] Summary of pre-transition energy consumption v. benchmark
0
100
200
300
400
500
Comparison of pre & post transition emissions
0 1000 0 50 100 150
Good practice
Good practice
Typical
Typical
200 2502000 3000 4000 5000
Electricity
Gas
Diesel
Pre Transition Office Emissions (tonnes CO2)
Annual kgCO2/m2 of treated floor area (FTA)
Heating and hot waterCoolingFans, pumps, controlsHumidificationLighting
Office EquipmentCatering, gasCatering, electricityOther electricityComputer room (where appropriate)
Post Transition Office Emissions (tonnes CO2)
Return distance (miles)
TOTAL 33,437
Travel to theoffice11,566
Travel to externalmeetings 12,268
Travel to internalmeetings 8,519
One-off meetings1,084
[3.1.1]: Business travel by air*
Total – UK wide Km Total – UK wide Kg CO2
Annual Air Travel965,325
Average MonthlyAir Travel
80,444
Average MonthlyAir Travel561,823
Annual Air Travel6,741,878
CO2 emissions (tonnes)
TOTAL 13
Travel to theoffice3.70
Travel to externalmeetings 2.88
Travel to internalmeetings 6.44
One-off meetings0.234
Time taken (working days)
TOTAL 124.1
Travel to theoffice20.2
Travel to externalmeetings 28.1
Travel to internalmeetings 75.8
Gas (Annual consumption kWh/m2)Electricity (Annual consumption kWh/m2)
Annualconsumptionbenchmark
178
226
432 434
340
405
162
212
137
169
Bath Road BrunelWay
WellingtonStreet
Pre-TransitionTotal
[2.5] Summary of post-transition energy consumption v. benchmark
0
100
200
300
400
500
Gas (Annual consumption kWh/m2)Electricity (Annual consumption kWh/m2)*
Annualconsumptionbenchmark
114
234 234 221 215
45 4523
44
West Side East Side Link Post-TransitionTotal
[3.1.3]: Business travel by road*
Total – UK wide KmAnnual Fleet Milage
21,451,083
Annual Private &Hire Car Milage
3,905,567
Average MonthlyRoad Travel2,113,054
Total AnnualRoad Travel25,356,650
Total – Slough Km Total – Slough Kg CO2
Annual Air Travel171,571
Average MonthlyAir Travel
14,298
Average MonthlyAir Travel
99,855
Annual Air Travel1,198,256
[3.1.2]: Business travel by rail*
Total – UK wide Km Total – UK wide Kg CO2
Annual Rail Travel113,428
Average MonthlyRail Travel
9,452
Average MonthlyRail Travel
163,706
Annual Rail Travel1,964,468
Total – Slough Km Total – Slough Kg CO2
Annual Rail Travel20,160
Average MonthlyRail Travel
1,680
Average MonthlyRail Travel
29,096
Annual Rail Travel349,151
[7.1]: Total annual emissions of O2 slough
Pre-Transition (tonnes)
Total 10,949
Office5,364
Home259
Business Travel1,139
Employeetravel to work
4,187
[3.1.4]: Summary of distances and emissions from 2009 employee business travel*
Annual Total – UK Wide KmAir*
6,741,878
Rail**1,964,468
Road***25,356,650
Total 34,062,996
Annual Total – UK Wide Tonnes CO2Air*965
Rail**113
Road***5,331
Total 6,410
Annual Total Slough – KmAir*
1,198,256
Rail**349,151
Road***4,506,722
Total 6,054,130
Annual Total Slough – Tonnes CO2Air*172
Rail**20
Road***948
Total 1,139
Total – UK wide CO2
Annual Fleet Milage4,561,668
Annual Private &Hire Car Milage
769,774
Average MonthlyRoad Travel
444,287
Total AnnualRoad Travel5,331,442
Total – Slough Km
Annual Fleet Milage3,812,572
Annual Private &Hire Car Milage
694,150
Average MonthlyRoad Travel
375,560
Total AnnualRoad Travel4,506,722
Total – Slough Kg CO2
Annual Fleet Milage810,761
Annual Private &Hire Car Milage
136,815
Average MonthlyRoad Travel
78,965
Total AnnualRoad Travel
947,575
Post-Transition (tonnes)
Total 8,091
Office2,506
Sale
s M
anag
er S
loug
h
Home259
Business Travel1,139
Employeetravel to work
4,187
[7.2]: Split between emissions sources, pre- and post-transition
Pre-Transition (Tonnes CO2)
Total 10,949
Office5,364
Home259
Business Travel1,139
Employeetravel to work
4,187
Pre-Transition (%)
Total 100%
Office49%
Home2%
Business Travel10%
Employeetravel to work
38%
Post-Transition (Tonnes CO2)
Total 8,091
Office2,506
Home259
Business Travel1,139
Employeetravel to work
4,187
Post-Transition (%)
Total 100%
Office31%
Home3%
Business Travel14%
Employeetravel to work
52%
[5.2]: Hugger sample annual footprint for travel to the office
[2.6]: Comparison of pre and post transition emissions
Return distance (miles)
Total annual CO2
Variance -53%
Average 5,092
6,156
Post TransitionTonnes CO2
5,3642,506
Pre TransitionTonnes CO2
8,208
912
CO2 emissions (tonnes)
Average 1.42
2.53
1.41
0.31
Time taken (working days)
Average 32.1
40.5
40.5
15.2
Annual CO2 per 1,000 Ft2 floor area
Variance -50%
Post TransitionTonnes CO2
23.311.6
Pre TransitionTonnes CO2
Annual CO2 per employee*
Variance -53%
Post TransitionTonnes CO2
2.681.25
Pre TransitionTonnes CO2
Annual CO2 per desk
Variance -36%
Post TransitionTonnes CO2
2.621.67
Pre TransitionTonnes CO2
0
20
40
60
80
100
Day
s w
ork
ing
at
ho
me/
year
An
nu
al e
mis
sio
ns
(kg
) as
soci
ated
wit
h h
om
e w
ork
ing
90
Sale
s M
anag
er S
loug
h
68
Sale
s M
anag
er L
eeds
90
Flex
ible
wor
ker L
eeds
*
0
Flex
ible
wor
ker S
loug
h*
0
Sale
s M
anag
er S
loug
h
0
40
80
120
160
200
39
Sale
s M
anag
er S
loug
h
153
Sale
s M
anag
er L
eeds
165
Flex
ible
wor
ker L
eeds
*
0
Flex
ible
wor
ker S
loug
h*
0
An
nu
al e
mis
sio
ns
(kg
) as
soci
ated
wit
hd
isp
laci
ng
th
e an
nu
al h
om
e w
ork
ing
day
s w
ith
day
s w
ork
ing
fro
m t
he
reg
ion
al o
ffic
e
Sale
s M
anag
er S
loug
h
0
2,000
4,000
6,000
8,000
10,000
Energy Travel
8,561
Sale
s M
anag
er S
loug
h
2,240
Sale
s M
anag
er L
eeds
2,898
Flex
ible
wor
ker L
eeds
*
0
Flex
ible
wor
ker S
loug
h*
0
Emis
sio
ns
avo
ided
(kg
) th
rou
gh
ho
me
wo
rkin
g p
er y
ear
Sale
s M
anag
er S
loug
h
0
2,000
4,000
6,000
8,000
10,0008,552
Sale
s M
anag
er S
loug
h
2,087
Sale
s M
anag
er L
eeds
2,824
Flex
ible
wor
ker L
eeds
*
0
Flex
ible
wor
ker S
loug
h*
0 Trav
el t
ime
avo
ided
(w
ork
ing
day
s)th
rou
gh
ho
me
wo
rkin
g p
er y
ear
Sale
s M
anag
er S
loug
h
0
6
12
18
24
3030
Sale
s M
anag
er S
loug
h
7
Sale
s M
anag
er L
eeds
12
Flex
ible
wor
ker L
eeds
*
0
Flex
ible
wor
ker S
loug
h*
0
7,109,739

1. Source: O2 Slough 2009 Travel Survey2. See The Elephant in the Room: Carving Up Scope 3 Emissions Across a Value Chain, Emma Stewart, Environmentalleader.com,
Feb 26, 20093. A separate e.survey of 1067 O2 respondents business-wide, including questions on commuting patterns, contributed further
supporting evidence
3.2. COMMUTING TO WORK
78%: SLOUGH-BASED EMPLOYEES DRIVE TO WORK
14%: SLOUGH-BASED EMPLOYEES USE PUBLIC TRANSPORT
4,187tCO2: EMPLOYEE TRAVEL TO WORK (RETURN)1
Emissions from employee commuting are not typically calculated by most businesses; indeed the GHG Protocol considers assessment of such Scope 3 emissions as optional for reporting purposes2.
We think that the employee commute should be an important focus for companies. Businesses can help their employees to make greener travel choices, encouraging a culture that supports carbon-efficient ways to meet and work.
We therefore conducted a preparatory survey of the travel habits of 2,000 employees based at, or contracted to, head office in Slough. Of the 803 responses, 86% were office-based and 14% were home/ flexible-workers3.
Our data reveals that O2 employees travel a wide range of distances to the Slough office which – when coupled with the evidence provided by our persona interviews in Chapter 5 – confirms O2’s flexible working strategy.
It’s a strategy that helps to provide a larger pool of high-calibre employees and future candidates, although the greatest number of employees surveyed (45%) travel between 10 and 30 miles to get to the office.
3.2.1: DISTANCE TRAVELLED BY O2 SLOUGH EMPLOYEES TO GET TO WORK (ONE WAY)
Figure 3.2.2 (page 30) shows us more. Most significantly, 78% of employees choose to commute to the office by car, a figure that excludes the 1.5% who can get a lift or car-share. Commonly, the reason for not participating in car share schemes is the ‘inconvenience’ of synchronizing with others’ hours of working.
26 27
Tomorrow’s workspace
Split of CO2 emissions associated withSlough based employee business travel
[3.2.2]: Mode of travel to work by O2 Slough employees
Rail 2%
Car (driver)78.2%
Car (passenger) 1.1%Car share 0.4%
Motorbike 1.1%
Train 12.9%
Taxi 0.3%
Bus 1.3%
Bicycle 1.3%
Walk 1.3%Car (driver)78.2%
Car (passenger)1.1%
Car share 0.4%
Motorbike 1.1%Train 12.9%
Taxi 0.3%
Bus 1.3%
Bicycle 1.3%
Walk 1.3%
Mode of transport % of employees
[3.2.2]: Mode of travel to work by O2 Slough employeesMode of transport % of employees
% of employees
miles % employees
Air 15%
Road 83%
[3.2.3] Employees using the shuttle bus
[3.2.1] Distance travelled by O2 Slough employeesto get to work (one way)
[3.2.4] Summary of estimated annual employee travel to work data for all Slough employees
Distance travelled to work in km (return)
Emissions as proportion of totalSlough footprint –pre and post transition
km (millions)
BetweenSloughoffices 81%
Between trainstation & Bath Roadoffices 19%
0-5 miles 15%
0 5 10 15 20 25 30 35 40
5-10 miles 14%
10-20 miles 24%20-30 miles 21%
30-50 miles 12%
50-70 miles 6%
70-100 miles 3%100+ miles 6%
% of employees
[3.2.3] Employees using the shuttle bus
BetweenSloughoffices 81%
Between trainstation & Bath Roadoffices 19%
Split of CO2 emissions associated withSlough based employee business travel
Rail 2%
Air 15%
Road 83%
miles % employees
[3.2.1] Distance travelled by O2 Slough employeesto get to work (one way)
0-5 miles 15%
5-10 miles 14%
10-20 miles 24%20-30 miles 21%
30-50 miles 12%
50-70 miles 6%
70-100 miles 3% 100+ miles 6%
0 2,000
0%
20%
40%
60%
80%
100%
4,000 6,000 8,000 10,000 12,000 14,000
Office basedemployees
Annual returntravel to office
Hugger sample average
Annual return travelto external meetings
Annual return travelto internal meetings
Return travel toone-off meetings
Miles
29,185,681
36,295,420
Home/flexibleworking employees
Total
kg CO2 associates with travel to work (return)
kg CO2 millions
0 0.5 1 1.5 2 2.5 3 3.5 4 4.5
Office basedemployees 1,395,424
2,790,755
4,187,180
Home/flexibleworking employees
Total
Office
Home
Business Travel
Employee Travelto work
Hopper sample average
0 1 2 3 4 5 6 7
Annual returntravel to office
Journey type
Pre % Post %
Journey typeHugger sample average
Annual return travelto external meetings
Annual return travelto internal meetings
Return travel toone-off meetings
tCO2
Hopper sample average
[2.4] Summary of pre-transition energy consumption v. benchmark
0
100
200
300
400
500
Comparison of pre & post transition emissions
0 1000 0 50 100 150
Good practice
Good practice
Typical
Typical
200 2502000 3000 4000 5000
Electricity
Gas
Diesel
Pre Transition Office Emissions (tonnes CO2)
Annual kgCO2/m2 of treated floor area (FTA)
Heating and hot waterCoolingFans, pumps, controlsHumidificationLighting
Office EquipmentCatering, gasCatering, electricityOther electricityComputer room (where appropriate)
Post Transition Office Emissions (tonnes CO2)
Return distance (miles)
TOTAL 33,437
Travel to theoffice11,566
Travel to externalmeetings 12,268
Travel to internalmeetings 8,519
One-off meetings1,084
[3.1.1]: Business travel by air*
Total – UK wide Km Total – UK wide Kg CO2
Annual Air Travel965,325
Average MonthlyAir Travel
80,444
Average MonthlyAir Travel561,823
Annual Air Travel6,741,878
CO2 emissions (tonnes)
TOTAL 13
Travel to theoffice3.70
Travel to externalmeetings 2.88
Travel to internalmeetings 6.44
One-off meetings0.234
Time taken (working days)
TOTAL 124.1
Travel to theoffice20.2
Travel to externalmeetings 28.1
Travel to internalmeetings 75.8
Gas (Annual consumption kWh/m2)Electricity (Annual consumption kWh/m2)
Annualconsumptionbenchmark
178
226
432 434
340
405
162
212
137
169
Bath Road BrunelWay
WellingtonStreet
Pre-TransitionTotal
[2.5] Summary of post-transition energy consumption v. benchmark
0
100
200
300
400
500
Gas (Annual consumption kWh/m2)Electricity (Annual consumption kWh/m2)*
Annualconsumptionbenchmark
114
234 234 221 215
45 4523
44
West Side East Side Link Post-TransitionTotal
[3.1.3]: Business travel by road*
Total – UK wide KmAnnual Fleet Milage
21,451,083
Annual Private &Hire Car Milage
3,905,567
Average MonthlyRoad Travel2,113,054
Total AnnualRoad Travel25,356,650
Total – Slough Km Total – Slough Kg CO2
Annual Air Travel171,571
Average MonthlyAir Travel
14,298
Average MonthlyAir Travel
99,855
Annual Air Travel1,198,256
[3.1.2]: Business travel by rail*
Total – UK wide Km Total – UK wide Kg CO2
Annual Rail Travel113,428
Average MonthlyRail Travel
9,452
Average MonthlyRail Travel
163,706
Annual Rail Travel1,964,468
Total – Slough Km Total – Slough Kg CO2
Annual Rail Travel20,160
Average MonthlyRail Travel
1,680
Average MonthlyRail Travel
29,096
Annual Rail Travel349,151
[7.1]: Total annual emissions of O2 slough
Pre-Transition (tonnes)
Total 10,949
Office5,364
Home259
Business Travel1,139
Employeetravel to work
4,187
[3.1.4]: Summary of distances and emissions from 2009 employee business travel*
Annual Total – UK Wide KmAir*
6,741,878
Rail**1,964,468
Road***25,356,650
Total 34,062,996
Annual Total – UK Wide Tonnes CO2Air*965
Rail**113
Road***5,331
Total 6,410
Annual Total Slough – KmAir*
1,198,256
Rail**349,151
Road***4,506,722
Total 6,054,130
Annual Total Slough – Tonnes CO2Air*172
Rail**20
Road***948
Total 1,139
Total – UK wide CO2
Annual Fleet Milage4,561,668
Annual Private &Hire Car Milage
769,774
Average MonthlyRoad Travel
444,287
Total AnnualRoad Travel5,331,442
Total – Slough Km
Annual Fleet Milage3,812,572
Annual Private &Hire Car Milage
694,150
Average MonthlyRoad Travel
375,560
Total AnnualRoad Travel4,506,722
Total – Slough Kg CO2
Annual Fleet Milage810,761
Annual Private &Hire Car Milage
136,815
Average MonthlyRoad Travel
78,965
Total AnnualRoad Travel
947,575
Post-Transition (tonnes)
Total 8,091
Office2,506
Sale
s M
anag
er S
loug
h
Home259
Business Travel1,139
Employeetravel to work
4,187
[7.2]: Split between emissions sources, pre- and post-transition
Pre-Transition (Tonnes CO2)
Total 10,949
Office5,364
Home259
Business Travel1,139
Employeetravel to work
4,187
Pre-Transition (%)
Total 100%
Office49%
Home2%
Business Travel10%
Employeetravel to work
38%
Post-Transition (Tonnes CO2)
Total 8,091
Office2,506
Home259
Business Travel1,139
Employeetravel to work
4,187
Post-Transition (%)
Total 100%
Office31%
Home3%
Business Travel14%
Employeetravel to work
52%
[5.2]: Hugger sample annual footprint for travel to the office
[2.6]: Comparison of pre and post transition emissions
Return distance (miles)
Total annual CO2
Variance -53%
Average 5,092
6,156
Post TransitionTonnes CO2
5,3642,506
Pre TransitionTonnes CO2
8,208
912
CO2 emissions (tonnes)
Average 1.42
2.53
1.41
0.31
Time taken (working days)
Average 32.1
40.5
40.5
15.2
Annual CO2 per 1,000 Ft2 floor area
Variance -50%
Post TransitionTonnes CO2
23.311.6
Pre TransitionTonnes CO2
Annual CO2 per employee*
Variance -53%
Post TransitionTonnes CO2
2.681.25
Pre TransitionTonnes CO2
Annual CO2 per desk
Variance -36%
Post TransitionTonnes CO2
2.621.67
Pre TransitionTonnes CO2
0
20
40
60
80
100
Day
s w
ork
ing
at
ho
me/
year
An
nu
al e
mis
sio
ns
(kg
) as
soci
ated
wit
h h
om
e w
ork
ing
90
Sale
s M
anag
er S
loug
h
68
Sale
s M
anag
er L
eeds
90
Flex
ible
wor
ker L
eeds
*
0
Flex
ible
wor
ker S
loug
h*
0
Sale
s M
anag
er S
loug
h
0
40
80
120
160
200
39
Sale
s M
anag
er S
loug
h
153
Sale
s M
anag
er L
eeds
165
Flex
ible
wor
ker L
eeds
*
0
Flex
ible
wor
ker S
loug
h*
0
An
nu
al e
mis
sio
ns
(kg
) as
soci
ated
wit
hd
isp
laci
ng
th
e an
nu
al h
om
e w
ork
ing
day
s w
ith
day
s w
ork
ing
fro
m t
he
reg
ion
al o
ffic
e
Sale
s M
anag
er S
loug
h
0
2,000
4,000
6,000
8,000
10,000
Energy Travel
8,561
Sale
s M
anag
er S
loug
h
2,240
Sale
s M
anag
er L
eeds
2,898
Flex
ible
wor
ker L
eeds
*
0
Flex
ible
wor
ker S
loug
h*
0
Emis
sio
ns
avo
ided
(kg
) th
rou
gh
ho
me
wo
rkin
g p
er y
ear
Sale
s M
anag
er S
loug
h
0
2,000
4,000
6,000
8,000
10,0008,552
Sale
s M
anag
er S
loug
h
2,087
Sale
s M
anag
er L
eeds
2,824
Flex
ible
wor
ker L
eeds
*
0
Flex
ible
wor
ker S
loug
h*
0 Trav
el t
ime
avo
ided
(w
ork
ing
day
s)th
rou
gh
ho
me
wo
rkin
g p
er y
ear
Sale
s M
anag
er S
loug
h
0
6
12
18
24
3030
Sale
s M
anag
er S
loug
h
7
Sale
s M
anag
er L
eeds
12
Flex
ible
wor
ker L
eeds
*
0
Flex
ible
wor
ker S
loug
h*
0
7,109,739

28 29
• energy • emissions • efficiency •technology •travel •home •work •office •productivity •time •morale •engagement •balance • • energy • emissions • efficiency •technology •travel •home •work •office •productivity •time •morale •engagement •balance •

30 31
Tomorrow’s workspace
3.2.2: MODE OF TRAVEL TO WORK BY O2 SLOUGH EMPLOYEES
Employees put their choice of commuting by car down to ‘no suitable alternatives’ (41%) and time efficiency (30%), although only 5% reported that a car is essential to their jobs.
Our 2010 e.survey shows similar trends. Of the 1,067 people who gave details of their travel to work, the largest proportion (65%) travel by car/van, 4% participated in a car share scheme and 21% use public transport.
SHUTTLE BUS
O2 runs a free shuttle bus service to allow employees to move easily between Slough’s train station and the office, and between the pre-transition offices.
While 76% of sample respondents use this service, many do so mainly for transportation between offices. This need will become largely obsolete when the move to OurSpace is complete.
However, a significant proportion (19%) use it to ‘hop’ from the train station to the Bath Road office, which is a practical incentive for O2 people to travel by public transport. This proportion is likely to grow with the creation of one site at Bath Road, when there will be be a single, direct route between the station and the office.
3.2.3 EMPLOYEES USING THE SHUTTLE BUS
SUMMARY AND CHALLENGES
Our travel-to-work data was calculated per office-based employee and per home/flexible-worker, using the available sources. This was then extrapolated to provide total commute data for all Slough employees. The results are detailed in the following Figure 3.2.4.
3.2.4: SUMMARY OF ESTIMATED ANNUAL EMPLOYEE TRAVEL TO WORK DATA FOR ALL SLOUGH EMPLOYEES
Our findings also establish that the average return journey to work is 100 minutes. This is equivalent to 78,482 working days spent travelling to and from work per year by all Slough based employees1. Results from our business-wide e.survey support this evidence2.
Quite apart from the issues of productivity and use of time raised by these numbers, the data shows that the vast majority of employees choose to travel to work by car, emitting 4,187 tonnes of carbon emissions as they do so.
Promotion of public transport, the shuttle bus and car sharing could contribute to greener travel patterns.
Moreover, it is important to act on employee commuting. In its latest draft standard on scope 3 emissions, the GHG Protocol proposes three examples of action for businesses3:
• Locating offices near town centres and good public transport facilities; • Creating incentives for use of public transport and disincentives for commuting by car; • Reducing the number of days that employees work in the company office per week.
O2 is doing all of these things, as well as implementing carbon capping of fleet vehicles.
Split of CO2 emissions associated withSlough based employee business travel
[3.2.2]: Mode of travel to work by O2 Slough employees
Rail 2%
Car (driver)78.2%
Car (passenger) 1.1%Car share 0.4%
Motorbike 1.1%
Train 12.9%
Taxi 0.3%
Bus 1.3%
Bicycle 1.3%
Walk 1.3%Car (driver)78.2%
Car (passenger)1.1%
Car share 0.4%
Motorbike 1.1%Train 12.9%
Taxi 0.3%
Bus 1.3%
Bicycle 1.3%
Walk 1.3%
Mode of transport % of employees
[3.2.2]: Mode of travel to work by O2 Slough employeesMode of transport % of employees
% of employees
miles % employees
Air 15%
Road 83%
[3.2.3] Employees using the shuttle bus
[3.2.1] Distance travelled by O2 Slough employeesto get to work (one way)
[3.2.4] Summary of estimated annual employee travel to work data for all Slough employees
Distance travelled to work in km (return)
Emissions as proportion of totalSlough footprint –pre and post transition
km (millions)
BetweenSloughoffices 81%
Between trainstation & Bath Roadoffices 19%
0-5 miles 15%
0 5 10 15 20 25 30 35 40
5-10 miles 14%
10-20 miles 24%20-30 miles 21%
30-50 miles 12%
50-70 miles 6%
70-100 miles 3%100+ miles 6%
% of employees
[3.2.3] Employees using the shuttle bus
BetweenSloughoffices 81%
Between trainstation & Bath Roadoffices 19%
Split of CO2 emissions associated withSlough based employee business travel
Rail 2%
Air 15%
Road 83%
miles % employees
[3.2.1] Distance travelled by O2 Slough employeesto get to work (one way)
0-5 miles 15%
5-10 miles 14%
10-20 miles 24%20-30 miles 21%
30-50 miles 12%
50-70 miles 6%
70-100 miles 3% 100+ miles 6%
0 2,000
0%
20%
40%
60%
80%
100%
4,000 6,000 8,000 10,000 12,000 14,000
Office basedemployees
Annual returntravel to office
Hugger sample average
Annual return travelto external meetings
Annual return travelto internal meetings
Return travel toone-off meetings
Miles
29,185,681
36,295,420
Home/flexibleworking employees
Total
kg CO2 associates with travel to work (return)
kg CO2 millions
0 0.5 1 1.5 2 2.5 3 3.5 4 4.5
Office basedemployees 1,395,424
2,790,755
4,187,180
Home/flexibleworking employees
Total
Office
Home
Business Travel
Employee Travelto work
Hopper sample average
0 1 2 3 4 5 6 7
Annual returntravel to office
Journey type
Pre % Post %
Journey typeHugger sample average
Annual return travelto external meetings
Annual return travelto internal meetings
Return travel toone-off meetings
tCO2
Hopper sample average
[2.4] Summary of pre-transition energy consumption v. benchmark
0
100
200
300
400
500
Comparison of pre & post transition emissions
0 1000 0 50 100 150
Good practice
Good practice
Typical
Typical
200 2502000 3000 4000 5000
Electricity
Gas
Diesel
Pre Transition Office Emissions (tonnes CO2)
Annual kgCO2/m2 of treated floor area (FTA)
Heating and hot waterCoolingFans, pumps, controlsHumidificationLighting
Office EquipmentCatering, gasCatering, electricityOther electricityComputer room (where appropriate)
Post Transition Office Emissions (tonnes CO2)
Return distance (miles)
TOTAL 33,437
Travel to theoffice11,566
Travel to externalmeetings 12,268
Travel to internalmeetings 8,519
One-off meetings1,084
[3.1.1]: Business travel by air*
Total – UK wide Km Total – UK wide Kg CO2
Annual Air Travel965,325
Average MonthlyAir Travel
80,444
Average MonthlyAir Travel561,823
Annual Air Travel6,741,878
CO2 emissions (tonnes)
TOTAL 13
Travel to theoffice3.70
Travel to externalmeetings 2.88
Travel to internalmeetings 6.44
One-off meetings0.234
Time taken (working days)
TOTAL 124.1
Travel to theoffice20.2
Travel to externalmeetings 28.1
Travel to internalmeetings 75.8
Gas (Annual consumption kWh/m2)Electricity (Annual consumption kWh/m2)
Annualconsumptionbenchmark
178
226
432 434
340
405
162
212
137
169
Bath Road BrunelWay
WellingtonStreet
Pre-TransitionTotal
[2.5] Summary of post-transition energy consumption v. benchmark
0
100
200
300
400
500
Gas (Annual consumption kWh/m2)Electricity (Annual consumption kWh/m2)*
Annualconsumptionbenchmark
114
234 234 221 215
45 4523
44
West Side East Side Link Post-TransitionTotal
[3.1.3]: Business travel by road*
Total – UK wide KmAnnual Fleet Milage
21,451,083
Annual Private &Hire Car Milage
3,905,567
Average MonthlyRoad Travel2,113,054
Total AnnualRoad Travel25,356,650
Total – Slough Km Total – Slough Kg CO2
Annual Air Travel171,571
Average MonthlyAir Travel
14,298
Average MonthlyAir Travel
99,855
Annual Air Travel1,198,256
[3.1.2]: Business travel by rail*
Total – UK wide Km Total – UK wide Kg CO2
Annual Rail Travel113,428
Average MonthlyRail Travel
9,452
Average MonthlyRail Travel
163,706
Annual Rail Travel1,964,468
Total – Slough Km Total – Slough Kg CO2
Annual Rail Travel20,160
Average MonthlyRail Travel
1,680
Average MonthlyRail Travel
29,096
Annual Rail Travel349,151
[7.1]: Total annual emissions of O2 slough
Pre-Transition (tonnes)
Total 10,949
Office5,364
Home259
Business Travel1,139
Employeetravel to work
4,187
[3.1.4]: Summary of distances and emissions from 2009 employee business travel*
Annual Total – UK Wide KmAir*
6,741,878
Rail**1,964,468
Road***25,356,650
Total 34,062,996
Annual Total – UK Wide Tonnes CO2Air*965
Rail**113
Road***5,331
Total 6,410
Annual Total Slough – KmAir*
1,198,256
Rail**349,151
Road***4,506,722
Total 6,054,130
Annual Total Slough – Tonnes CO2Air*172
Rail**20
Road***948
Total 1,139
Total – UK wide CO2
Annual Fleet Milage4,561,668
Annual Private &Hire Car Milage
769,774
Average MonthlyRoad Travel
444,287
Total AnnualRoad Travel5,331,442
Total – Slough Km
Annual Fleet Milage3,812,572
Annual Private &Hire Car Milage
694,150
Average MonthlyRoad Travel
375,560
Total AnnualRoad Travel4,506,722
Total – Slough Kg CO2
Annual Fleet Milage810,761
Annual Private &Hire Car Milage
136,815
Average MonthlyRoad Travel
78,965
Total AnnualRoad Travel
947,575
Post-Transition (tonnes)
Total 8,091
Office2,506
Sale
s M
anag
er S
loug
h
Home259
Business Travel1,139
Employeetravel to work
4,187
[7.2]: Split between emissions sources, pre- and post-transition
Pre-Transition (Tonnes CO2)
Total 10,949
Office5,364
Home259
Business Travel1,139
Employeetravel to work
4,187
Pre-Transition (%)
Total 100%
Office49%
Home2%
Business Travel10%
Employeetravel to work
38%
Post-Transition (Tonnes CO2)
Total 8,091
Office2,506
Home259
Business Travel1,139
Employeetravel to work
4,187
Post-Transition (%)
Total 100%
Office31%
Home3%
Business Travel14%
Employeetravel to work
52%
[5.2]: Hugger sample annual footprint for travel to the office
[2.6]: Comparison of pre and post transition emissions
Return distance (miles)
Total annual CO2
Variance -53%
Average 5,092
6,156
Post TransitionTonnes CO2
5,3642,506
Pre TransitionTonnes CO2
8,208
912
CO2 emissions (tonnes)
Average 1.42
2.53
1.41
0.31
Time taken (working days)
Average 32.1
40.5
40.5
15.2
Annual CO2 per 1,000 Ft2 floor area
Variance -50%
Post TransitionTonnes CO2
23.311.6
Pre TransitionTonnes CO2
Annual CO2 per employee*
Variance -53%
Post TransitionTonnes CO2
2.681.25
Pre TransitionTonnes CO2
Annual CO2 per desk
Variance -36%
Post TransitionTonnes CO2
2.621.67
Pre TransitionTonnes CO2
0
20
40
60
80
100
Day
s w
ork
ing
at
ho
me/
year
An
nu
al e
mis
sio
ns
(kg
) as
soci
ated
wit
h h
om
e w
ork
ing
90
Sale
s M
anag
er S
loug
h
68
Sale
s M
anag
er L
eeds
90
Flex
ible
wor
ker L
eeds
*
0
Flex
ible
wor
ker S
loug
h*
0
Sale
s M
anag
er S
loug
h
0
40
80
120
160
200
39
Sale
s M
anag
er S
loug
h
153
Sale
s M
anag
er L
eeds
165
Flex
ible
wor
ker L
eeds
*
0
Flex
ible
wor
ker S
loug
h*
0
An
nu
al e
mis
sio
ns
(kg
) as
soci
ated
wit
hd
isp
laci
ng
th
e an
nu
al h
om
e w
ork
ing
day
s w
ith
day
s w
ork
ing
fro
m t
he
reg
ion
al o
ffic
e
Sale
s M
anag
er S
loug
h
0
2,000
4,000
6,000
8,000
10,000
Energy Travel
8,561
Sale
s M
anag
er S
loug
h
2,240
Sale
s M
anag
er L
eeds
2,898
Flex
ible
wor
ker L
eeds
*
0
Flex
ible
wor
ker S
loug
h*
0
Emis
sio
ns
avo
ided
(kg
) th
rou
gh
ho
me
wo
rkin
g p
er y
ear
Sale
s M
anag
er S
loug
h
0
2,000
4,000
6,000
8,000
10,0008,552
Sale
s M
anag
er S
loug
h
2,087
Sale
s M
anag
er L
eeds
2,824
Flex
ible
wor
ker L
eeds
*
0
Flex
ible
wor
ker S
loug
h*
0 Trav
el t
ime
avo
ided
(w
ork
ing
day
s)th
rou
gh
ho
me
wo
rkin
g p
er y
ear
Sale
s M
anag
er S
loug
h
0
6
12
18
24
3030
Sale
s M
anag
er S
loug
h
7
Sale
s M
anag
er L
eeds
12
Flex
ible
wor
ker L
eeds
*
0
Flex
ible
wor
ker S
loug
h*
0
7,109,739
Split of CO2 emissions associated withSlough based employee business travel
[3.2.2]: Mode of travel to work by O2 Slough employees
Rail 2%
Car (driver)78.2%
Car (passenger) 1.1%Car share 0.4%
Motorbike 1.1%
Train 12.9%
Taxi 0.3%
Bus 1.3%
Bicycle 1.3%
Walk 1.3%Car (driver)78.2%
Car (passenger)1.1%
Car share 0.4%
Motorbike 1.1%Train 12.9%
Taxi 0.3%
Bus 1.3%
Bicycle 1.3%
Walk 1.3%
Mode of transport % of employees
[3.2.2]: Mode of travel to work by O2 Slough employeesMode of transport % of employees
% of employees
miles % employees
Air 15%
Road 83%
[3.2.3] Employees using the shuttle bus
[3.2.1] Distance travelled by O2 Slough employeesto get to work (one way)
[3.2.4] Summary of estimated annual employee travel to work data for all Slough employees
Distance travelled to work in km (return)
Emissions as proportion of totalSlough footprint –pre and post transition
km (millions)
BetweenSloughoffices 81%
Between trainstation & Bath Roadoffices 19%
0-5 miles 15%
0 5 10 15 20 25 30 35 40
5-10 miles 14%
10-20 miles 24%20-30 miles 21%
30-50 miles 12%
50-70 miles 6%
70-100 miles 3%100+ miles 6%
% of employees
[3.2.3] Employees using the shuttle bus
BetweenSloughoffices 81%
Between trainstation & Bath Roadoffices 19%
Split of CO2 emissions associated withSlough based employee business travel
Rail 2%
Air 15%
Road 83%
miles % employees
[3.2.1] Distance travelled by O2 Slough employeesto get to work (one way)
0-5 miles 15%
5-10 miles 14%
10-20 miles 24%20-30 miles 21%
30-50 miles 12%
50-70 miles 6%
70-100 miles 3% 100+ miles 6%
0 2,000
0%
20%
40%
60%
80%
100%
4,000 6,000 8,000 10,000 12,000 14,000
Office basedemployees
Annual returntravel to office
Hugger sample average
Annual return travelto external meetings
Annual return travelto internal meetings
Return travel toone-off meetings
Miles
29,185,681
36,295,420
Home/flexibleworking employees
Total
kg CO2 associates with travel to work (return)
kg CO2 millions
0 0.5 1 1.5 2 2.5 3 3.5 4 4.5
Office basedemployees 1,395,424
2,790,755
4,187,180
Home/flexibleworking employees
Total
Office
Home
Business Travel
Employee Travelto work
Hopper sample average
0 1 2 3 4 5 6 7
Annual returntravel to office
Journey type
Pre % Post %
Journey typeHugger sample average
Annual return travelto external meetings
Annual return travelto internal meetings
Return travel toone-off meetings
tCO2
Hopper sample average
[2.4] Summary of pre-transition energy consumption v. benchmark
0
100
200
300
400
500
Comparison of pre & post transition emissions
0 1000 0 50 100 150
Good practice
Good practice
Typical
Typical
200 2502000 3000 4000 5000
Electricity
Gas
Diesel
Pre Transition Office Emissions (tonnes CO2)
Annual kgCO2/m2 of treated floor area (FTA)
Heating and hot waterCoolingFans, pumps, controlsHumidificationLighting
Office EquipmentCatering, gasCatering, electricityOther electricityComputer room (where appropriate)
Post Transition Office Emissions (tonnes CO2)
Return distance (miles)
TOTAL 33,437
Travel to theoffice11,566
Travel to externalmeetings 12,268
Travel to internalmeetings 8,519
One-off meetings1,084
[3.1.1]: Business travel by air*
Total – UK wide Km Total – UK wide Kg CO2
Annual Air Travel965,325
Average MonthlyAir Travel
80,444
Average MonthlyAir Travel561,823
Annual Air Travel6,741,878
CO2 emissions (tonnes)
TOTAL 13
Travel to theoffice3.70
Travel to externalmeetings 2.88
Travel to internalmeetings 6.44
One-off meetings0.234
Time taken (working days)
TOTAL 124.1
Travel to theoffice20.2
Travel to externalmeetings 28.1
Travel to internalmeetings 75.8
Gas (Annual consumption kWh/m2)Electricity (Annual consumption kWh/m2)
Annualconsumptionbenchmark
178
226
432 434
340
405
162
212
137
169
Bath Road BrunelWay
WellingtonStreet
Pre-TransitionTotal
[2.5] Summary of post-transition energy consumption v. benchmark
0
100
200
300
400
500
Gas (Annual consumption kWh/m2)Electricity (Annual consumption kWh/m2)*
Annualconsumptionbenchmark
114
234 234 221 215
45 4523
44
West Side East Side Link Post-TransitionTotal
[3.1.3]: Business travel by road*
Total – UK wide KmAnnual Fleet Milage
21,451,083
Annual Private &Hire Car Milage
3,905,567
Average MonthlyRoad Travel2,113,054
Total AnnualRoad Travel25,356,650
Total – Slough Km Total – Slough Kg CO2
Annual Air Travel171,571
Average MonthlyAir Travel
14,298
Average MonthlyAir Travel
99,855
Annual Air Travel1,198,256
[3.1.2]: Business travel by rail*
Total – UK wide Km Total – UK wide Kg CO2
Annual Rail Travel113,428
Average MonthlyRail Travel
9,452
Average MonthlyRail Travel
163,706
Annual Rail Travel1,964,468
Total – Slough Km Total – Slough Kg CO2
Annual Rail Travel20,160
Average MonthlyRail Travel
1,680
Average MonthlyRail Travel
29,096
Annual Rail Travel349,151
[7.1]: Total annual emissions of O2 slough
Pre-Transition (tonnes)
Total 10,949
Office5,364
Home259
Business Travel1,139
Employeetravel to work
4,187
[3.1.4]: Summary of distances and emissions from 2009 employee business travel*
Annual Total – UK Wide KmAir*
6,741,878
Rail**1,964,468
Road***25,356,650
Total 34,062,996
Annual Total – UK Wide Tonnes CO2Air*965
Rail**113
Road***5,331
Total 6,410
Annual Total Slough – KmAir*
1,198,256
Rail**349,151
Road***4,506,722
Total 6,054,130
Annual Total Slough – Tonnes CO2Air*172
Rail**20
Road***948
Total 1,139
Total – UK wide CO2
Annual Fleet Milage4,561,668
Annual Private &Hire Car Milage
769,774
Average MonthlyRoad Travel
444,287
Total AnnualRoad Travel5,331,442
Total – Slough Km
Annual Fleet Milage3,812,572
Annual Private &Hire Car Milage
694,150
Average MonthlyRoad Travel
375,560
Total AnnualRoad Travel4,506,722
Total – Slough Kg CO2
Annual Fleet Milage810,761
Annual Private &Hire Car Milage
136,815
Average MonthlyRoad Travel
78,965
Total AnnualRoad Travel
947,575
Post-Transition (tonnes)
Total 8,091
Office2,506
Sale
s M
anag
er S
loug
h
Home259
Business Travel1,139
Employeetravel to work
4,187
[7.2]: Split between emissions sources, pre- and post-transition
Pre-Transition (Tonnes CO2)
Total 10,949
Office5,364
Home259
Business Travel1,139
Employeetravel to work
4,187
Pre-Transition (%)
Total 100%
Office49%
Home2%
Business Travel10%
Employeetravel to work
38%
Post-Transition (Tonnes CO2)
Total 8,091
Office2,506
Home259
Business Travel1,139
Employeetravel to work
4,187
Post-Transition (%)
Total 100%
Office31%
Home3%
Business Travel14%
Employeetravel to work
52%
[5.2]: Hugger sample annual footprint for travel to the office
[2.6]: Comparison of pre and post transition emissions
Return distance (miles)
Total annual CO2
Variance -53%
Average 5,092
6,156
Post TransitionTonnes CO2
5,3642,506
Pre TransitionTonnes CO2
8,208
912
CO2 emissions (tonnes)
Average 1.42
2.53
1.41
0.31
Time taken (working days)
Average 32.1
40.5
40.5
15.2
Annual CO2 per 1,000 Ft2 floor area
Variance -50%
Post TransitionTonnes CO2
23.311.6
Pre TransitionTonnes CO2
Annual CO2 per employee*
Variance -53%
Post TransitionTonnes CO2
2.681.25
Pre TransitionTonnes CO2
Annual CO2 per desk
Variance -36%
Post TransitionTonnes CO2
2.621.67
Pre TransitionTonnes CO2
0
20
40
60
80
100
Day
s w
ork
ing
at
ho
me/
year
An
nu
al e
mis
sio
ns
(kg
) as
soci
ated
wit
h h
om
e w
ork
ing
90
Sale
s M
anag
er S
loug
h
68
Sale
s M
anag
er L
eeds
90
Flex
ible
wor
ker L
eeds
*
0
Flex
ible
wor
ker S
loug
h*
0
Sale
s M
anag
er S
loug
h
0
40
80
120
160
200
39
Sale
s M
anag
er S
loug
h
153
Sale
s M
anag
er L
eeds
165
Flex
ible
wor
ker L
eeds
*
0
Flex
ible
wor
ker S
loug
h*
0
An
nu
al e
mis
sio
ns
(kg
) as
soci
ated
wit
hd
isp
laci
ng
th
e an
nu
al h
om
e w
ork
ing
day
s w
ith
day
s w
ork
ing
fro
m t
he
reg
ion
al o
ffic
e
Sale
s M
anag
er S
loug
h
0
2,000
4,000
6,000
8,000
10,000
Energy Travel
8,561
Sale
s M
anag
er S
loug
h
2,240
Sale
s M
anag
er L
eeds
2,898
Flex
ible
wor
ker L
eeds
*
0
Flex
ible
wor
ker S
loug
h*
0
Emis
sio
ns
avo
ided
(kg
) th
rou
gh
ho
me
wo
rkin
g p
er y
ear
Sale
s M
anag
er S
loug
h
0
2,000
4,000
6,000
8,000
10,0008,552
Sale
s M
anag
er S
loug
h
2,087
Sale
s M
anag
er L
eeds
2,824
Flex
ible
wor
ker L
eeds
*
0
Flex
ible
wor
ker S
loug
h*
0 Trav
el t
ime
avo
ided
(w
ork
ing
day
s)th
rou
gh
ho
me
wo
rkin
g p
er y
ear
Sale
s M
anag
er S
loug
h
0
6
12
18
24
3030
Sale
s M
anag
er S
loug
h
7
Sale
s M
anag
er L
eeds
12
Flex
ible
wor
ker L
eeds
*
0
Flex
ible
wor
ker S
loug
h*
0
7,109,739
1. Data from a 40.1% response to O2’s Slough travel survey, 20092. Average return journey time of 74 minutes per employee to their place of work, though this incorporates employees from across
the total UK business. This e-survey does not split responses between ‘huggers’ and ‘hoppers’3. See Scope 3 Accounting and Reporting Standard: Supplement to the GHG Protocol Corporate Accounting and Reporting
Standard, (Review Draft For Stakeholder Advisory Group, November 2009), available from www.ghgprotocol.org/

1. Defined as the substitution of information technologies for work-related travel2. Act on CO2 Calculator, Version 2.0: Data, Methodology and Assumptions Paper (DECC, November 2009
4. HOME WORKING CARBON FOOTPRINT 259 tonnes CO2: EMISSIONS FROM WORK-RELATED HOME ENERGY USE
It’s essential to present our travel data (Chapter 3) in the context of overall emissions. We’ve therefore taken the additional emissions from teleworking1 into account. Currently, 67% of Slough-based employees regularly work from home for at least one day per week.
While these ‘hopper’ practices can reduce the carbon emissions from commuting to work, any extra use of energy at home may colour the bigger picture.
To calculate our total business carbon emissions and further engage policy makers in the home/ flexible-working debate, we have calculated the carbon emissions from home working through our interviews with hoppers (full data, Chapter 5).
ADDITIONAL EMISSIONS FROM HOME-WORKING
Hoppers spend an average of 2.2 days a week working from home. That equals 99 days per year, based on a 45-week working year. They spend the rest of their time in the office, at external meetings or on the road.
Our Figure 4.1 is based on information from persona interviews and takes account of the emissions associated with extra heating, lighting and use of home office equipment, as calculated by Government-endorsed data contained in DEFRA’s ‘Act on CO2’ campaign2.
4.1: ADDITIONAL ANNUAL EMISSIONS ASSOCIATED WITH EMPLOYEES WORKING AT HOME Additional home CO2 per year (tonnes)Additional home CO2 emissions per 0.194 employee working partly or wholly at homeTotal additional home CO2 associated 259 with Slough based employees
Please note that in Figure 4.1, the estimated average additional emissions avoided through home working are based on information from a relatively small sample of 13 hoppers. Our data is then extrapolated to show the estimated combined impact of our total 1,333 Slough-based hoppers.
EMISSIONS AVOIDED THROUGH HOME WORKING
In contrast, Figure 4.2 highlights both the emissions and time benefits of home working by three sales employees, based on data collected in our in-depth hopper interviews.
4.2 EMISSIONS AND TRAVEL TIME AVOIDED THROUGH HOME WORKING
SUMMARY & CHALLENGES
Our Figure 4.2 indicates that the emissions avoidance from home working across O2 Slough is very significant.
Certainly, the drop in travel-related emissions due to reduced commuting significantly outweighs the increase in emissions generated by those same employees when they work at home.
At O2, we continue to cooperate with external partners to offer subsidised home efficiency measures. Businesses who encourage home/flexible working may wish to add their voice to calls for government action to support uptake of such measures. In 2009, O2 joined with other leading UK companies to lobby for tax breaks for employers who offer reduced-price insulation to employees.
32 33
Tomorrow’s workspace
Sale
s M
anag
er S
loug
h
0
20
40
60
80
100
Day
s w
ork
ing
at
ho
me/
year
An
nu
al e
mis
sio
ns
(kg
) as
soci
ated
wit
h h
om
e w
ork
ing
90
Sale
s M
anag
er S
loug
h
68
Sale
s M
anag
er L
eeds
90
Sale
s M
anag
er S
loug
h
0
40
80
120
160
200
39
Sale
s M
anag
er S
loug
h
153
Sale
s M
anag
er L
eeds
165
An
nu
al e
mis
sio
ns
(kg
) as
soci
ated
wit
hd
isp
laci
ng
th
e an
nu
al h
om
e w
ork
ing
day
s w
ith
day
s w
ork
ing
fro
m t
he
reg
ion
al o
ffic
e
Sale
s M
anag
er S
loug
h
0
2,000
4,000
6,000
8,000
10,000
Energy Travel
8,561
Sale
s M
anag
er S
loug
h
2,240
Sale
s M
anag
er L
eeds
2,898
Emis
sio
ns
avo
ided
(kg
) th
rou
gh
ho
me
wo
rkin
g p
er y
ear
Sale
s M
anag
er S
loug
h
0
2,000
4,000
6,000
8,000
10,0008,552
Sale
s M
anag
er S
loug
h
2,087
Sale
s M
anag
er L
eeds
2,824
Trav
el t
ime
avo
ided
(w
ork
ing
day
s)th
rou
gh
ho
me
wo
rkin
g p
er y
ear
Sale
s M
anag
er S
loug
h
0
6
12
18
24
3030
Sale
s M
anag
er S
loug
h
7
Sale
s M
anag
er L
eeds
12
Sale
s M
anag
er S
loug
h
0
20
40
60
80
100
Day
s w
ork
ing
at
ho
me/
year
An
nu
al e
mis
sio
ns
(kg
) as
soci
ated
wit
h h
om
e w
ork
ing
en
erg
y u
se
90
Sale
s M
anag
er S
loug
h
68
Sale
s M
anag
er L
eeds
90
Sale
s M
anag
er S
loug
h
0
40
80
120
160
200
39
Sale
s M
anag
er S
loug
h
153
Sale
s M
anag
er L
eeds
165
An
nu
al e
mis
sio
ns
(kg
) as
soci
ated
wit
hd
isp
laci
ng
th
e an
nu
al h
om
e w
ork
ing
day
s w
ith
day
s w
ork
ing
fro
m t
he
reg
ion
al o
ffic
e
Sale
s M
anag
er S
loug
h
0
2,000
4,000
6,000
8,000
10,000
Energy Travel
8,561
Sale
s M
anag
er S
loug
h
2,240
Sale
s M
anag
er L
eeds
2,898
Emis
sio
ns
avo
ided
(kg
) th
rou
gh
ho
me
wo
rkin
g p
er y
ear
Sale
s M
anag
er S
loug
h
0
2,000
4,000
6,000
8,000
10,0008,552
Sale
s M
anag
er S
loug
h
2,087
Sale
s M
anag
er L
eeds
2,824
Trav
el t
ime
avo
ided
(w
ork
ing
day
s)th
rou
gh
ho
me
wo
rkin
g p
er y
ear
Sale
s M
anag
er S
loug
h
0
6
12
18
24
3030
Sale
s M
anag
er S
loug
h
7
Sale
s M
anag
er L
eeds
12
Sale
s M
anag
er S
loug
h
0
20
40
60
80
100
Day
s w
ork
ing
at
ho
me/
year
An
nu
al e
mis
sio
ns
(kg
) as
soci
ated
wit
h h
om
e w
ork
ing
90
Sale
s M
anag
er S
loug
h
68
Sale
s M
anag
er L
eeds
90
Sale
s M
anag
er S
loug
h
0
40
80
120
160
200
39
Sale
s M
anag
er S
loug
h
153
Sale
s M
anag
er L
eeds
165
An
nu
al e
mis
sio
ns
(kg
) as
soci
ated
wit
hd
isp
laci
ng
th
e an
nu
al h
om
e w
ork
ing
day
s w
ith
day
s w
ork
ing
fro
m t
he
reg
ion
al o
ffic
e
Sale
s M
anag
er S
loug
h
0
2,000
4,000
6,000
8,000
10,000
Energy Travel
8,561
Sale
s M
anag
er S
loug
h
2,240
Sale
s M
anag
er L
eeds
2,898
Emis
sio
ns
avo
ided
(kg
) th
rou
gh
ho
me
wo
rkin
g p
er y
ear
Sale
s M
anag
er S
loug
h
0
2,000
4,000
6,000
8,000
10,0008,552
Sale
s M
anag
er S
loug
h
2,087
Sale
s M
anag
er L
eeds
2,824
Trav
el t
ime
avo
ided
(w
ork
ing
day
s)th
rou
gh
ho
me
wo
rkin
g p
er y
ear
Sale
s M
anag
er S
loug
h
0
6
12
18
24
3030
Sale
s M
anag
er S
loug
h
7
Sale
s M
anag
er L
eeds
12
Sale
s M
anag
er S
loug
h
0
20
40
60
80
100
Day
s w
ork
ing
at
ho
me/
year
An
nu
al e
mis
sio
ns
(kg
) as
soci
ated
wit
h h
om
e w
ork
ing
en
erg
y u
se
90
Sale
s M
anag
er S
loug
h
68
Sale
s M
anag
er L
eeds
90
Sale
s M
anag
er S
loug
h
0
40
80
120
160
200
39
Sale
s M
anag
er S
loug
h
153
Sale
s M
anag
er L
eeds
165
An
nu
al e
mis
sio
ns
(kg
) as
soci
ated
wit
hd
isp
laci
ng
th
e an
nu
al h
om
e w
ork
ing
day
s w
ith
day
s w
ork
ing
fro
m t
he
reg
ion
al o
ffic
e
Sale
s M
anag
er S
loug
h
0
2,000
4,000
6,000
8,000
10,000
Energy Travel
8,561
Sale
s M
anag
er S
loug
h
2,240
Sale
s M
anag
er L
eeds
2,898
Emis
sio
ns
avo
ided
(kg
) th
rou
gh
ho
me
wo
rkin
g p
er y
ear
Sale
s M
anag
er S
loug
h
0
2,000
4,000
6,000
8,000
10,0008,552
Sale
s M
anag
er S
loug
h
2,087
Sale
s M
anag
er L
eeds
2,824
Trav
el t
ime
avo
ided
(w
ork
ing
day
s)th
rou
gh
ho
me
wo
rkin
g p
er y
ear
Sale
s M
anag
er S
loug
h
0
6
12
18
24
3030
Sale
s M
anag
er S
loug
h
7
Sale
s M
anag
er L
eeds
12

1. Includes excerpts from research on the impact of home working by King’s College, University of London, on behalf of O2
5. THE EMPLOYEE EXPERIENCE We surveyed our sample of personas to capture quantitative and qualitative data on individual carbon emissions, the way people work and how they rate the technology that supports them.
Questionnaires prompted a return rate of 94%, 16 respondents. This was coupled with an e.survey of 1,067 UK-wide staff, to give a wider understanding of the impact of home/ flexible working. We return to some of the broader issues raised by flexi-working and telecommuting in our conclusion1.
As well as assisting in the calculation of total head office-related emissions (see Chapter 7, where Slough-wide data is presented), the research provides:• Individualfootprints:travelandhome-working;• Anunderstandingoftechnologyuptake;• Theimplicationsfortimeandproductivity.
Follow-up interviews also unearthed a range of views on the current capacity of IT, the move to OurSpace, and our people’s attitudes to new working patterns.
SAMPLE SELECTIONO2 employees fall into two main categories:• HUGGERS – who mainly work from a fixed desk in an O2 office building;• HOPPERS – who can work from a mix of the office, home and mobile location.
Our sample is explained more fully in Appendix 2.
5.1: HUGGER SAMPLE GROUPHuggers O2 Employee1. Hugger A Communications Co-ordinator2. Hugger B Assistant to CEO3. Hugger C Area Facilities ManagerTotal Hugger sample 3
TABLE 5.2: HOPPER SAMPLE GROUPHoppers O2 Employee1. Home worker A Property Manager2. Home worker B HR Employee Involvement & Experience Manager3. Home worker C HR Employee Involvement & Experience Manager4. Before/after sales A Acquisitions Manager5. Before/after sales B Sales Account Manager6. Before/after sales C Sales Account Manager7. Flexible senior manager A Sustainability Senior Manager8. Flexible senior manager B Community Manager9. Flexible worker (non managerial) A Operations Deputy10. Flexible worker (non managerial) B Devices Representative11. Technology worker A Technology Manager12. Technology worker B Messaging Access & Portal Services Manager13. Technology worker C Technology ManagerTotal Hopper sample 13
TRAVEL AND HOME WORKING FOOTPRINTS
HUGGERS – average profile
32 days: AVERAGE TIME SPENT TRAVELLING TO WORK PER YEAR
As none of our huggers work from home, the figures below summarise the group’s annual travel footprint solely in terms of duration, distance and the carbon emissions related to the journey to and from work. Their office-related emissions are covered in Chapter 2, where Slough-wide data is analysed.
5.3: HUGGER SAMPLE ANNUAL FOOTPRINT FOR TRAVEL TO THE OFFICE
*All interviewees used personal cars to make their journeys. Hugger 3 car-shares with a colleague, thus halving the associated emissions.
HOPPERS – average profile
68%: DRIVE CARS TO TRAVEL ON BUSINESS
Hoppers make a variety of journeys to carry out their work. They may be commuting to and from the office or travelling between O2 offices, external suppliers, customers and business meetings1.
A summary of journey types, distances, time and carbon emissions is given below and on page 37.
5.4: SUMMARY HOPPER TRAVEL (MILES) PER YEAR
34 35
Tomorrow’s workspace
Split of CO2 emissions associated withSlough based employee business travel
[3.2.2]: Mode of travel to work by O2 Slough employees
Rail 2%
Car (driver)78.2%
Car (passenger) 1.1%Car share 0.4%
Motorbike 1.1%
Train 12.9%
Taxi 0.3%
Bus 1.3%
Bicycle 1.3%
Walk 1.3%Car (driver)78.2%
Car (passenger)1.1%
Car share 0.4%
Motorbike 1.1%Train 12.9%
Taxi 0.3%
Bus 1.3%
Bicycle 1.3%
Walk 1.3%
Mode of transport % of employees
[3.2.2]: Mode of travel to work by O2 Slough employeesMode of transport % of employees
% of employees
miles % employees
Air 15%
Road 83%
[3.2.3] Employees using the shuttle bus
[3.2.1] Distance travelled by O2 Slough employeesto get to work (one way)
[3.2.4] Summary of estimated annual employee travel to work data for all Slough employees
Distance travelled to work in km (return)
Emissions as proportion of totalSlough footprint –pre and post transition
km (millions)
BetweenSloughoffices 81%
Between trainstation & Bath Roadoffices 19%
0-5 miles 15%
0 5 10 15 20 25 30 35 40
5-10 miles 14%
10-20 miles 24%20-30 miles 21%
30-50 miles 12%
50-70 miles 6%
70-100 miles 3%100+ miles 6%
% of employees
[3.2.3] Employees using the shuttle bus
BetweenSloughoffices 81%
Between trainstation & Bath Roadoffices 19%
Split of CO2 emissions associated withSlough based employee business travel
Rail 2%
Air 15%
Road 83%
miles % employees
[3.2.1] Distance travelled by O2 Slough employeesto get to work (one way)
0-5 miles 15%
5-10 miles 14%
10-20 miles 24%20-30 miles 21%
30-50 miles 12%
50-70 miles 6%
70-100 miles 3% 100+ miles 6%
0 2,000
0%
20%
40%
60%
80%
100%
4,000 6,000 8,000 10,000 12,000 14,000
Office basedemployees
Annual returntravel to office
Hugger sample average
Annual return travelto external meetings
Annual return travelto internal meetings
Return travel toone-off meetings
Miles
29,185,681
36,295,420
Home/flexibleworking employees
Total
kg CO2 associates with travel to work (return)
kg CO2 millions
0 0.5 1 1.5 2 2.5 3 3.5 4 4.5
Office basedemployees 1,395,424
2,790,755
4,187,180
Home/flexibleworking employees
Total
Office
Home
Business Travel
Employee Travelto work
Hopper sample average
0 1 2 3 4 5 6 7
Annual returntravel to office
Journey type
Pre % Post %
Journey typeHugger sample average
Annual return travelto external meetings
Annual return travelto internal meetings
Return travel toone-off meetings
tCO2
Hopper sample average
[2.4] Summary of pre-transition energy consumption v. benchmark
0
100
200
300
400
500
Comparison of pre & post transition emissions
0 1000 0 50 100 150
Good practice
Good practice
Typical
Typical
200 2502000 3000 4000 5000
Electricity
Gas
Diesel
Pre Transition Office Emissions (tonnes CO2)
Annual kgCO2/m2 of treated floor area (FTA)
Heating and hot waterCoolingFans, pumps, controlsHumidificationLighting
Office EquipmentCatering, gasCatering, electricityOther electricityComputer room (where appropriate)
Post Transition Office Emissions (tonnes CO2)
Return distance (miles)
TOTAL 33,437
Travel to theoffice11,566
Travel to externalmeetings 12,268
Travel to internalmeetings 8,519
One-off meetings1,084
[3.1.1]: Business travel by air*
Total – UK wide Km Total – UK wide Kg CO2
Annual Air Travel965,325
Average MonthlyAir Travel
80,444
Average MonthlyAir Travel561,823
Annual Air Travel6,741,878
CO2 emissions (tonnes)
TOTAL 13
Travel to theoffice3.70
Travel to externalmeetings 2.88
Travel to internalmeetings 6.44
One-off meetings0.234
Time taken (working days)
TOTAL 124.1
Travel to theoffice20.2
Travel to externalmeetings 28.1
Travel to internalmeetings 75.8
Gas (Annual consumption kWh/m2)Electricity (Annual consumption kWh/m2)
Annualconsumptionbenchmark
178
226
432 434
340
405
162
212
137
169
Bath Road BrunelWay
WellingtonStreet
Pre-TransitionTotal
[2.5] Summary of post-transition energy consumption v. benchmark
0
100
200
300
400
500
Gas (Annual consumption kWh/m2)Electricity (Annual consumption kWh/m2)*
Annualconsumptionbenchmark
114
234 234 221 215
45 4523
44
West Side East Side Link Post-TransitionTotal
[3.1.3]: Business travel by road*
Total – UK wide KmAnnual Fleet Milage
21,451,083
Annual Private &Hire Car Milage
3,905,567
Average MonthlyRoad Travel2,113,054
Total AnnualRoad Travel25,356,650
Total – Slough Km Total – Slough Kg CO2
Annual Air Travel171,571
Average MonthlyAir Travel
14,298
Average MonthlyAir Travel
99,855
Annual Air Travel1,198,256
[3.1.2]: Business travel by rail*
Total – UK wide Km Total – UK wide Kg CO2
Annual Rail Travel113,428
Average MonthlyRail Travel
9,452
Average MonthlyRail Travel
163,706
Annual Rail Travel1,964,468
Total – Slough Km Total – Slough Kg CO2
Annual Rail Travel20,160
Average MonthlyRail Travel
1,680
Average MonthlyRail Travel
29,096
Annual Rail Travel349,151
[7.1]: Total annual emissions of O2 slough
Pre-Transition (tonnes)
Total 10,949
Office5,364
Home259
Business Travel1,139
Employeetravel to work
4,187
[3.1.4]: Summary of distances and emissions from 2009 employee business travel*
Annual Total – UK Wide KmAir*
6,741,878
Rail**1,964,468
Road***25,356,650
Total 34,062,996
Annual Total – UK Wide Tonnes CO2Air*965
Rail**113
Road***5,331
Total 6,410
Annual Total Slough – KmAir*
1,198,256
Rail**349,151
Road***4,506,722
Total 6,054,130
Annual Total Slough – Tonnes CO2Air*172
Rail**20
Road***948
Total 1,139
Total – UK wide CO2
Annual Fleet Milage4,561,668
Annual Private &Hire Car Milage
769,774
Average MonthlyRoad Travel
444,287
Total AnnualRoad Travel5,331,442
Total – Slough Km
Annual Fleet Milage3,812,572
Annual Private &Hire Car Milage
694,150
Average MonthlyRoad Travel
375,560
Total AnnualRoad Travel4,506,722
Total – Slough Kg CO2
Annual Fleet Milage810,761
Annual Private &Hire Car Milage
136,815
Average MonthlyRoad Travel
78,965
Total AnnualRoad Travel
947,575
Post-Transition (tonnes)
Total 8,091
Office2,506
Sale
s M
anag
er S
loug
h
Home259
Business Travel1,139
Employeetravel to work
4,187
[7.2]: Split between emissions sources, pre- and post-transition
Pre-Transition (Tonnes CO2)
Total 10,949
Office5,364
Home259
Business Travel1,139
Employeetravel to work
4,187
Pre-Transition (%)
Total 100%
Office49%
Home2%
Business Travel10%
Employeetravel to work
38%
Post-Transition (Tonnes CO2)
Total 8,091
Office2,506
Home259
Business Travel1,139
Employeetravel to work
4,187
Post-Transition (%)
Total 100%
Office31%
Home3%
Business Travel14%
Employeetravel to work
52%
[5.2]: Hugger sample annual footprint for travel to the office
[2.6]: Comparison of pre and post transition emissions
Return distance (miles)
Total annual CO2
Variance -53%
Average 5,092
6,156
Post TransitionTonnes CO2
5,3642,506
Pre TransitionTonnes CO2
8,208
912
CO2 emissions (tonnes)
Average 1.42
2.53
1.41
0.31
Time taken (working days)
Average 32.1
40.5
40.5
15.2
Annual CO2 per 1,000 Ft2 floor area
Variance -50%
Post TransitionTonnes CO2
23.311.6
Pre TransitionTonnes CO2
Annual CO2 per employee*
Variance -53%
Post TransitionTonnes CO2
2.681.25
Pre TransitionTonnes CO2
Annual CO2 per desk
Variance -36%
Post TransitionTonnes CO2
2.621.67
Pre TransitionTonnes CO2
0
20
40
60
80
100
Day
s w
ork
ing
at
ho
me/
year
An
nu
al e
mis
sio
ns
(kg
) as
soci
ated
wit
h h
om
e w
ork
ing
90
Sale
s M
anag
er S
loug
h
68
Sale
s M
anag
er L
eeds
90
Flex
ible
wor
ker L
eeds
*
0
Flex
ible
wor
ker S
loug
h*
0
Sale
s M
anag
er S
loug
h
0
40
80
120
160
200
39
Sale
s M
anag
er S
loug
h
153
Sale
s M
anag
er L
eeds
165
Flex
ible
wor
ker L
eeds
*
0
Flex
ible
wor
ker S
loug
h*
0
An
nu
al e
mis
sio
ns
(kg
) as
soci
ated
wit
hd
isp
laci
ng
th
e an
nu
al h
om
e w
ork
ing
day
s w
ith
day
s w
ork
ing
fro
m t
he
reg
ion
al o
ffic
e
Sale
s M
anag
er S
loug
h
0
2,000
4,000
6,000
8,000
10,000
Energy Travel
8,561
Sale
s M
anag
er S
loug
h
2,240
Sale
s M
anag
er L
eeds
2,898
Flex
ible
wor
ker L
eeds
*
0
Flex
ible
wor
ker S
loug
h*
0
Emis
sio
ns
avo
ided
(kg
) th
rou
gh
ho
me
wo
rkin
g p
er y
ear
Sale
s M
anag
er S
loug
h
0
2,000
4,000
6,000
8,000
10,0008,552
Sale
s M
anag
er S
loug
h
2,087
Sale
s M
anag
er L
eeds
2,824
Flex
ible
wor
ker L
eeds
*
0
Flex
ible
wor
ker S
loug
h*
0 Trav
el t
ime
avo
ided
(w
ork
ing
day
s)th
rou
gh
ho
me
wo
rkin
g p
er y
ear
Sale
s M
anag
er S
loug
h
0
6
12
18
24
3030
Sale
s M
anag
er S
loug
h
7
Sale
s M
anag
er L
eeds
12
Flex
ible
wor
ker L
eeds
*
0
Flex
ible
wor
ker S
loug
h*
0
7,109,739
Split of CO2 emissions associated withSlough based employee business travel
[3.2.2]: Mode of travel to work by O2 Slough employees
Rail 2%
Car (driver)78.2%
Car (passenger) 1.1%Car share 0.4%
Motorbike 1.1%
Train 12.9%
Taxi 0.3%
Bus 1.3%
Bicycle 1.3%
Walk 1.3%Car (driver)78.2%
Car (passenger)1.1%
Car share 0.4%
Motorbike 1.1%Train 12.9%
Taxi 0.3%
Bus 1.3%
Bicycle 1.3%
Walk 1.3%
Mode of transport % of employees
[3.2.2]: Mode of travel to work by O2 Slough employeesMode of transport % of employees
% of employees
miles % employees
Air 15%
Road 83%
[3.2.3] Employees using the shuttle bus
[3.2.1] Distance travelled by O2 Slough employeesto get to work (one way)
[3.2.4] Summary of estimated annual employee travel to work data for all Slough employees
Distance travelled to work in km (return)
Emissions as proportion of totalSlough footprint –pre and post transition
km (millions)
BetweenSloughoffices 81%
Between trainstation & Bath Roadoffices 19%
0-5 miles 15%
0 5 10 15 20 25 30 35 40
5-10 miles 14%
10-20 miles 24%20-30 miles 21%
30-50 miles 12%
50-70 miles 6%
70-100 miles 3%100+ miles 6%
% of employees
[3.2.3] Employees using the shuttle bus
BetweenSloughoffices 81%
Between trainstation & Bath Roadoffices 19%
Split of CO2 emissions associated withSlough based employee business travel
Rail 2%
Air 15%
Road 83%
miles % employees
[3.2.1] Distance travelled by O2 Slough employeesto get to work (one way)
0-5 miles 15%
5-10 miles 14%
10-20 miles 24%20-30 miles 21%
30-50 miles 12%
50-70 miles 6%
70-100 miles 3% 100+ miles 6%
0 2,000
0%
20%
40%
60%
80%
100%
4,000 6,000 8,000 10,000 12,000 14,000
Office basedemployees
Annual returntravel to office
Hugger sample average
Annual return travelto external meetings
Annual return travelto internal meetings
Return travel toone-off meetings
Miles
29,185,681
36,295,420
Home/flexibleworking employees
Total
kg CO2 associates with travel to work (return)
kg CO2 millions
0 0.5 1 1.5 2 2.5 3 3.5 4 4.5
Office basedemployees 1,395,424
2,790,755
4,187,180
Home/flexibleworking employees
Total
Office
Home
Business Travel
Employee Travelto work
Hopper sample average
0 1 2 3 4 5 6 7
Annual returntravel to office
Journey type
Pre % Post %
Journey typeHugger sample average
Annual return travelto external meetings
Annual return travelto internal meetings
Return travel toone-off meetings
tCO2
Hopper sample average
[2.4] Summary of pre-transition energy consumption v. benchmark
0
100
200
300
400
500
Comparison of pre & post transition emissions
0 1000 0 50 100 150
Good practice
Good practice
Typical
Typical
200 2502000 3000 4000 5000
Electricity
Gas
Diesel
Pre Transition Office Emissions (tonnes CO2)
Annual kgCO2/m2 of treated floor area (FTA)
Heating and hot waterCoolingFans, pumps, controlsHumidificationLighting
Office EquipmentCatering, gasCatering, electricityOther electricityComputer room (where appropriate)
Post Transition Office Emissions (tonnes CO2)
Return distance (miles)
TOTAL 33,437
Travel to theoffice11,566
Travel to externalmeetings 12,268
Travel to internalmeetings 8,519
One-off meetings1,084
[3.1.1]: Business travel by air*
Total – UK wide Km Total – UK wide Kg CO2
Annual Air Travel965,325
Average MonthlyAir Travel
80,444
Average MonthlyAir Travel561,823
Annual Air Travel6,741,878
CO2 emissions (tonnes)
TOTAL 13
Travel to theoffice3.70
Travel to externalmeetings 2.88
Travel to internalmeetings 6.44
One-off meetings0.234
Time taken (working days)
TOTAL 124.1
Travel to theoffice20.2
Travel to externalmeetings 28.1
Travel to internalmeetings 75.8
Gas (Annual consumption kWh/m2)Electricity (Annual consumption kWh/m2)
Annualconsumptionbenchmark
178
226
432 434
340
405
162
212
137
169
Bath Road BrunelWay
WellingtonStreet
Pre-TransitionTotal
[2.5] Summary of post-transition energy consumption v. benchmark
0
100
200
300
400
500
Gas (Annual consumption kWh/m2)Electricity (Annual consumption kWh/m2)*
Annualconsumptionbenchmark
114
234 234 221 215
45 4523
44
West Side East Side Link Post-TransitionTotal
[3.1.3]: Business travel by road*
Total – UK wide KmAnnual Fleet Milage
21,451,083
Annual Private &Hire Car Milage
3,905,567
Average MonthlyRoad Travel2,113,054
Total AnnualRoad Travel25,356,650
Total – Slough Km Total – Slough Kg CO2
Annual Air Travel171,571
Average MonthlyAir Travel
14,298
Average MonthlyAir Travel
99,855
Annual Air Travel1,198,256
[3.1.2]: Business travel by rail*
Total – UK wide Km Total – UK wide Kg CO2
Annual Rail Travel113,428
Average MonthlyRail Travel
9,452
Average MonthlyRail Travel
163,706
Annual Rail Travel1,964,468
Total – Slough Km Total – Slough Kg CO2
Annual Rail Travel20,160
Average MonthlyRail Travel
1,680
Average MonthlyRail Travel
29,096
Annual Rail Travel349,151
[7.1]: Total annual emissions of O2 slough
Pre-Transition (tonnes)
Total 10,949
Office5,364
Home259
Business Travel1,139
Employeetravel to work
4,187
[3.1.4]: Summary of distances and emissions from 2009 employee business travel*
Annual Total – UK Wide KmAir*
6,741,878
Rail**1,964,468
Road***25,356,650
Total 34,062,996
Annual Total – UK Wide Tonnes CO2Air*965
Rail**113
Road***5,331
Total 6,410
Annual Total Slough – KmAir*
1,198,256
Rail**349,151
Road***4,506,722
Total 6,054,130
Annual Total Slough – Tonnes CO2Air*172
Rail**20
Road***948
Total 1,139
Total – UK wide CO2
Annual Fleet Milage4,561,668
Annual Private &Hire Car Milage
769,774
Average MonthlyRoad Travel
444,287
Total AnnualRoad Travel5,331,442
Total – Slough Km
Annual Fleet Milage3,812,572
Annual Private &Hire Car Milage
694,150
Average MonthlyRoad Travel
375,560
Total AnnualRoad Travel4,506,722
Total – Slough Kg CO2
Annual Fleet Milage810,761
Annual Private &Hire Car Milage
136,815
Average MonthlyRoad Travel
78,965
Total AnnualRoad Travel
947,575
Post-Transition (tonnes)
Total 8,091
Office2,506
Sale
s M
anag
er S
loug
h
Home259
Business Travel1,139
Employeetravel to work
4,187
[7.2]: Split between emissions sources, pre- and post-transition
Pre-Transition (Tonnes CO2)
Total 10,949
Office5,364
Home259
Business Travel1,139
Employeetravel to work
4,187
Pre-Transition (%)
Total 100%
Office49%
Home2%
Business Travel10%
Employeetravel to work
38%
Post-Transition (Tonnes CO2)
Total 8,091
Office2,506
Home259
Business Travel1,139
Employeetravel to work
4,187
Post-Transition (%)
Total 100%
Office31%
Home3%
Business Travel14%
Employeetravel to work
52%
[5.2]: Hugger sample annual footprint for travel to the office
[2.6]: Comparison of pre and post transition emissions
Return distance (miles)
Total annual CO2
Variance -53%
Average 5,092
6,156
Post TransitionTonnes CO2
5,3642,506
Pre TransitionTonnes CO2
8,208
912
CO2 emissions (tonnes)
Average 1.42
2.53
1.41
0.31
Time taken (working days)
Average 32.1
40.5
40.5
15.2
Annual CO2 per 1,000 Ft2 floor area
Variance -50%
Post TransitionTonnes CO2
23.311.6
Pre TransitionTonnes CO2
Annual CO2 per employee*
Variance -53%
Post TransitionTonnes CO2
2.681.25
Pre TransitionTonnes CO2
Annual CO2 per desk
Variance -36%
Post TransitionTonnes CO2
2.621.67
Pre TransitionTonnes CO2
0
20
40
60
80
100
Day
s w
ork
ing
at
ho
me/
year
An
nu
al e
mis
sio
ns
(kg
) as
soci
ated
wit
h h
om
e w
ork
ing
90
Sale
s M
anag
er S
loug
h
68
Sale
s M
anag
er L
eeds
90
Flex
ible
wor
ker L
eeds
*
0
Flex
ible
wor
ker S
loug
h*
0
Sale
s M
anag
er S
loug
h
0
40
80
120
160
200
39
Sale
s M
anag
er S
loug
h
153
Sale
s M
anag
er L
eeds
165
Flex
ible
wor
ker L
eeds
*
0
Flex
ible
wor
ker S
loug
h*
0
An
nu
al e
mis
sio
ns
(kg
) as
soci
ated
wit
hd
isp
laci
ng
th
e an
nu
al h
om
e w
ork
ing
day
s w
ith
day
s w
ork
ing
fro
m t
he
reg
ion
al o
ffic
e
Sale
s M
anag
er S
loug
h
0
2,000
4,000
6,000
8,000
10,000
Energy Travel
8,561
Sale
s M
anag
er S
loug
h
2,240
Sale
s M
anag
er L
eeds
2,898
Flex
ible
wor
ker L
eeds
*
0
Flex
ible
wor
ker S
loug
h*
0
Emis
sio
ns
avo
ided
(kg
) th
rou
gh
ho
me
wo
rkin
g p
er y
ear
Sale
s M
anag
er S
loug
h
0
2,000
4,000
6,000
8,000
10,0008,552
Sale
s M
anag
er S
loug
h
2,087
Sale
s M
anag
er L
eeds
2,824
Flex
ible
wor
ker L
eeds
*
0
Flex
ible
wor
ker S
loug
h*
0 Trav
el t
ime
avo
ided
(w
ork
ing
day
s)th
rou
gh
ho
me
wo
rkin
g p
er y
ear
Sale
s M
anag
er S
loug
h
0
6
12
18
24
3030
Sale
s M
anag
er S
loug
h
7
Sale
s M
anag
er L
eeds
12
Flex
ible
wor
ker L
eeds
*
0
Flex
ible
wor
ker S
loug
h*
0
7,109,739
1. The sample group was asked for the distance, time and mode of transport for a typical journey in each category. Responses were multiplied by the number of occasions a respondent would be at home, in the office, or at internal or external meetings in a typical week

5.4.1: SUMMARY HOPPER TRAVEL (CO2) PER YEAR
5.4.2: SUMMARY HOPPER TRAVEL (TIME) PER YEAR
We look at four main classes of journeys to meetings: office, external, internal and one-off. Of these, 68% were carried out by car, but only a quarter of the car journeys were made by fleet vehicle. The majority were in private vehicles.
It should be noted that only 23% of the hoppers eligible for a fleet car have taken them up. Of the remainder, 40% say their reason is ‘personal’ preference while 60% cite ‘tax’ or ‘financial’ considerations.
COMPARING HUGGER AND HOPPER TRAVEL PATTERNS
We might expect huggers to cover more mileage overall because they commute to work every day. In reality, Figure 5.5 shows that hoppers travel more than double the distance of huggers to get to the office. They tend to live much further away and have roles that require them to travel widely.
Overall, total average annual hopper travel (33,000 miles) is nearly seven times higher than the huggers’ average annual commute-to-work (5,000 miles).
Even greater is the difference between the two groups’ travel emissions. Figure 5.6 highlights that hoppers contribute an average annual 13tCO2, almost ten times the average 1.5tCO2 attributable to huggers.
36 37
Tomorrow’s workspace
Split of CO2 emissions associated withSlough based employee business travel
[3.2.2]: Mode of travel to work by O2 Slough employees
Rail 2%
Car (driver)78.2%
Car (passenger) 1.1%Car share 0.4%
Motorbike 1.1%
Train 12.9%
Taxi 0.3%
Bus 1.3%
Bicycle 1.3%
Walk 1.3%Car (driver)78.2%
Car (passenger)1.1%
Car share 0.4%
Motorbike 1.1%Train 12.9%
Taxi 0.3%
Bus 1.3%
Bicycle 1.3%
Walk 1.3%
Mode of transport % of employees
[3.2.2]: Mode of travel to work by O2 Slough employeesMode of transport % of employees
% of employees
miles % employees
Air 15%
Road 83%
[3.2.3] Employees using the shuttle bus
[3.2.1] Distance travelled by O2 Slough employeesto get to work (one way)
[3.2.4] Summary of estimated annual employee travel to work data for all Slough employees
Distance travelled to work in km (return)
Emissions as proportion of totalSlough footprint –pre and post transition
km (millions)
BetweenSloughoffices 81%
Between trainstation & Bath Roadoffices 19%
0-5 miles 15%
0 5 10 15 20 25 30 35 40
5-10 miles 14%
10-20 miles 24%20-30 miles 21%
30-50 miles 12%
50-70 miles 6%
70-100 miles 3%100+ miles 6%
% of employees
[3.2.3] Employees using the shuttle bus
BetweenSloughoffices 81%
Between trainstation & Bath Roadoffices 19%
Split of CO2 emissions associated withSlough based employee business travel
Rail 2%
Air 15%
Road 83%
miles % employees
[3.2.1] Distance travelled by O2 Slough employeesto get to work (one way)
0-5 miles 15%
5-10 miles 14%
10-20 miles 24%20-30 miles 21%
30-50 miles 12%
50-70 miles 6%
70-100 miles 3% 100+ miles 6%
0 2,000
0%
20%
40%
60%
80%
100%
4,000 6,000 8,000 10,000 12,000 14,000
Office basedemployees
Annual returntravel to office
Hugger sample average
Annual return travelto external meetings
Annual return travelto internal meetings
Return travel toone-off meetings
Miles
29,185,681
36,295,420
Home/flexibleworking employees
Total
kg CO2 associates with travel to work (return)
kg CO2 millions
0 0.5 1 1.5 2 2.5 3 3.5 4 4.5
Office basedemployees 1,395,424
2,790,755
4,187,180
Home/flexibleworking employees
Total
Office
Home
Business Travel
Employee Travelto work
Hopper sample average
0 1 2 3 4 5 6 7
Annual returntravel to office
Journey type
Pre % Post %
Journey typeHugger sample average
Annual return travelto external meetings
Annual return travelto internal meetings
Return travel toone-off meetings
tCO2
Hopper sample average
[2.4] Summary of pre-transition energy consumption v. benchmark
0
100
200
300
400
500
Comparison of pre & post transition emissions
0 1000 0 50 100 150
Good practice
Good practice
Typical
Typical
200 2502000 3000 4000 5000
Electricity
Gas
Diesel
Pre Transition Office Emissions (tonnes CO2)
Annual kgCO2/m2 of treated floor area (FTA)
Heating and hot waterCoolingFans, pumps, controlsHumidificationLighting
Office EquipmentCatering, gasCatering, electricityOther electricityComputer room (where appropriate)
Post Transition Office Emissions (tonnes CO2)
Return distance (miles)
TOTAL 33,437
Travel to theoffice11,566
Travel to externalmeetings 12,268
Travel to internalmeetings 8,519
One-off meetings1,084
[3.1.1]: Business travel by air*
Total – UK wide Km Total – UK wide Kg CO2
Annual Air Travel965,325
Average MonthlyAir Travel
80,444
Average MonthlyAir Travel561,823
Annual Air Travel6,741,878
CO2 emissions (tonnes)
TOTAL 13
Travel to theoffice3.70
Travel to externalmeetings 2.88
Travel to internalmeetings 6.44
One-off meetings0.234
Time taken (working days)
TOTAL 124.1
Travel to theoffice20.2
Travel to externalmeetings 28.1
Travel to internalmeetings 75.8
Gas (Annual consumption kWh/m2)Electricity (Annual consumption kWh/m2)
Annualconsumptionbenchmark
178
226
432 434
340
405
162
212
137
169
Bath Road BrunelWay
WellingtonStreet
Pre-TransitionTotal
[2.5] Summary of post-transition energy consumption v. benchmark
0
100
200
300
400
500
Gas (Annual consumption kWh/m2)Electricity (Annual consumption kWh/m2)*
Annualconsumptionbenchmark
114
234 234 221 215
45 4523
44
West Side East Side Link Post-TransitionTotal
[3.1.3]: Business travel by road*
Total – UK wide KmAnnual Fleet Milage
21,451,083
Annual Private &Hire Car Milage
3,905,567
Average MonthlyRoad Travel2,113,054
Total AnnualRoad Travel25,356,650
Total – Slough Km Total – Slough Kg CO2
Annual Air Travel171,571
Average MonthlyAir Travel
14,298
Average MonthlyAir Travel
99,855
Annual Air Travel1,198,256
[3.1.2]: Business travel by rail*
Total – UK wide Km Total – UK wide Kg CO2
Annual Rail Travel113,428
Average MonthlyRail Travel
9,452
Average MonthlyRail Travel
163,706
Annual Rail Travel1,964,468
Total – Slough Km Total – Slough Kg CO2
Annual Rail Travel20,160
Average MonthlyRail Travel
1,680
Average MonthlyRail Travel
29,096
Annual Rail Travel349,151
[7.1]: Total annual emissions of O2 slough
Pre-Transition (tonnes)
Total 10,949
Office5,364
Home259
Business Travel1,139
Employeetravel to work
4,187
[3.1.4]: Summary of distances and emissions from 2009 employee business travel*
Annual Total – UK Wide KmAir*
6,741,878
Rail**1,964,468
Road***25,356,650
Total 34,062,996
Annual Total – UK Wide Tonnes CO2Air*965
Rail**113
Road***5,331
Total 6,410
Annual Total Slough – KmAir*
1,198,256
Rail**349,151
Road***4,506,722
Total 6,054,130
Annual Total Slough – Tonnes CO2Air*172
Rail**20
Road***948
Total 1,139
Total – UK wide CO2
Annual Fleet Milage4,561,668
Annual Private &Hire Car Milage
769,774
Average MonthlyRoad Travel
444,287
Total AnnualRoad Travel5,331,442
Total – Slough Km
Annual Fleet Milage3,812,572
Annual Private &Hire Car Milage
694,150
Average MonthlyRoad Travel
375,560
Total AnnualRoad Travel4,506,722
Total – Slough Kg CO2
Annual Fleet Milage810,761
Annual Private &Hire Car Milage
136,815
Average MonthlyRoad Travel
78,965
Total AnnualRoad Travel
947,575
Post-Transition (tonnes)
Total 8,091
Office2,506
Sale
s M
anag
er S
loug
h
Home259
Business Travel1,139
Employeetravel to work
4,187
[7.2]: Split between emissions sources, pre- and post-transition
Pre-Transition (Tonnes CO2)
Total 10,949
Office5,364
Home259
Business Travel1,139
Employeetravel to work
4,187
Pre-Transition (%)
Total 100%
Office49%
Home2%
Business Travel10%
Employeetravel to work
38%
Post-Transition (Tonnes CO2)
Total 8,091
Office2,506
Home259
Business Travel1,139
Employeetravel to work
4,187
Post-Transition (%)
Total 100%
Office31%
Home3%
Business Travel14%
Employeetravel to work
52%
[5.2]: Hugger sample annual footprint for travel to the office
[2.6]: Comparison of pre and post transition emissions
Return distance (miles)
Total annual CO2
Variance -53%
Average 5,092
6,156
Post TransitionTonnes CO2
5,3642,506
Pre TransitionTonnes CO2
8,208
912
CO2 emissions (tonnes)
Average 1.42
2.53
1.41
0.31
Time taken (working days)
Average 32.1
40.5
40.5
15.2
Annual CO2 per 1,000 Ft2 floor area
Variance -50%
Post TransitionTonnes CO2
23.311.6
Pre TransitionTonnes CO2
Annual CO2 per employee*
Variance -53%
Post TransitionTonnes CO2
2.681.25
Pre TransitionTonnes CO2
Annual CO2 per desk
Variance -36%
Post TransitionTonnes CO2
2.621.67
Pre TransitionTonnes CO2
0
20
40
60
80
100
Day
s w
ork
ing
at
ho
me/
year
An
nu
al e
mis
sio
ns
(kg
) as
soci
ated
wit
h h
om
e w
ork
ing
90
Sale
s M
anag
er S
loug
h
68
Sale
s M
anag
er L
eeds
90
Flex
ible
wor
ker L
eeds
*
0
Flex
ible
wor
ker S
loug
h*
0
Sale
s M
anag
er S
loug
h
0
40
80
120
160
200
39
Sale
s M
anag
er S
loug
h
153
Sale
s M
anag
er L
eeds
165
Flex
ible
wor
ker L
eeds
*
0
Flex
ible
wor
ker S
loug
h*
0
An
nu
al e
mis
sio
ns
(kg
) as
soci
ated
wit
hd
isp
laci
ng
th
e an
nu
al h
om
e w
ork
ing
day
s w
ith
day
s w
ork
ing
fro
m t
he
reg
ion
al o
ffic
e
Sale
s M
anag
er S
loug
h
0
2,000
4,000
6,000
8,000
10,000
Energy Travel
8,561
Sale
s M
anag
er S
loug
h
2,240
Sale
s M
anag
er L
eeds
2,898
Flex
ible
wor
ker L
eeds
*
0
Flex
ible
wor
ker S
loug
h*
0
Emis
sio
ns
avo
ided
(kg
) th
rou
gh
ho
me
wo
rkin
g p
er y
ear
Sale
s M
anag
er S
loug
h
0
2,000
4,000
6,000
8,000
10,0008,552
Sale
s M
anag
er S
loug
h
2,087
Sale
s M
anag
er L
eeds
2,824
Flex
ible
wor
ker L
eeds
*
0
Flex
ible
wor
ker S
loug
h*
0 Trav
el t
ime
avo
ided
(w
ork
ing
day
s)th
rou
gh
ho
me
wo
rkin
g p
er y
ear
Sale
s M
anag
er S
loug
h
0
6
12
18
24
3030
Sale
s M
anag
er S
loug
h
7
Sale
s M
anag
er L
eeds
12
Flex
ible
wor
ker L
eeds
*
0
Flex
ible
wor
ker S
loug
h*
0
7,109,739
Split of CO2 emissions associated withSlough based employee business travel
[3.2.2]: Mode of travel to work by O2 Slough employees
Rail 2%
Car (driver)78.2%
Car (passenger) 1.1%Car share 0.4%
Motorbike 1.1%
Train 12.9%
Taxi 0.3%
Bus 1.3%
Bicycle 1.3%
Walk 1.3%Car (driver)78.2%
Car (passenger)1.1%
Car share 0.4%
Motorbike 1.1%Train 12.9%
Taxi 0.3%
Bus 1.3%
Bicycle 1.3%
Walk 1.3%
Mode of transport % of employees
[3.2.2]: Mode of travel to work by O2 Slough employeesMode of transport % of employees
% of employees
miles % employees
Air 15%
Road 83%
[3.2.3] Employees using the shuttle bus
[3.2.1] Distance travelled by O2 Slough employeesto get to work (one way)
[3.2.4] Summary of estimated annual employee travel to work data for all Slough employees
Distance travelled to work in km (return)
Emissions as proportion of totalSlough footprint –pre and post transition
km (millions)
BetweenSloughoffices 81%
Between trainstation & Bath Roadoffices 19%
0-5 miles 15%
0 5 10 15 20 25 30 35 40
5-10 miles 14%
10-20 miles 24%20-30 miles 21%
30-50 miles 12%
50-70 miles 6%
70-100 miles 3%100+ miles 6%
% of employees
[3.2.3] Employees using the shuttle bus
BetweenSloughoffices 81%
Between trainstation & Bath Roadoffices 19%
Split of CO2 emissions associated withSlough based employee business travel
Rail 2%
Air 15%
Road 83%
miles % employees
[3.2.1] Distance travelled by O2 Slough employeesto get to work (one way)
0-5 miles 15%
5-10 miles 14%
10-20 miles 24%20-30 miles 21%
30-50 miles 12%
50-70 miles 6%
70-100 miles 3% 100+ miles 6%
0 2,000
0%
20%
40%
60%
80%
100%
4,000 6,000 8,000 10,000 12,000 14,000
Office basedemployees
Annual returntravel to office
Hugger sample average
Annual return travelto external meetings
Annual return travelto internal meetings
Return travel toone-off meetings
Miles
29,185,681
36,295,420
Home/flexibleworking employees
Total
kg CO2 associates with travel to work (return)
kg CO2 millions
0 0.5 1 1.5 2 2.5 3 3.5 4 4.5
Office basedemployees 1,395,424
2,790,755
4,187,180
Home/flexibleworking employees
Total
Office
Home
Business Travel
Employee Travelto work
Hopper sample average
0 1 2 3 4 5 6 7
Annual returntravel to office
Journey type
Pre % Post %
Journey typeHugger sample average
Annual return travelto external meetings
Annual return travelto internal meetings
Return travel toone-off meetings
tCO2
Hopper sample average
[2.4] Summary of pre-transition energy consumption v. benchmark
0
100
200
300
400
500
Comparison of pre & post transition emissions
0 1000 0 50 100 150
Good practice
Good practice
Typical
Typical
200 2502000 3000 4000 5000
Electricity
Gas
Diesel
Pre Transition Office Emissions (tonnes CO2)
Annual kgCO2/m2 of treated floor area (FTA)
Heating and hot waterCoolingFans, pumps, controlsHumidificationLighting
Office EquipmentCatering, gasCatering, electricityOther electricityComputer room (where appropriate)
Post Transition Office Emissions (tonnes CO2)
Return distance (miles)
TOTAL 33,437
Travel to theoffice11,566
Travel to externalmeetings 12,268
Travel to internalmeetings 8,519
One-off meetings1,084
[3.1.1]: Business travel by air*
Total – UK wide Km Total – UK wide Kg CO2
Annual Air Travel965,325
Average MonthlyAir Travel
80,444
Average MonthlyAir Travel561,823
Annual Air Travel6,741,878
CO2 emissions (tonnes)
TOTAL 13
Travel to theoffice3.70
Travel to externalmeetings 2.88
Travel to internalmeetings 6.44
One-off meetings0.234
Time taken (working days)
TOTAL 124.1
Travel to theoffice20.2
Travel to externalmeetings 28.1
Travel to internalmeetings 75.8
Gas (Annual consumption kWh/m2)Electricity (Annual consumption kWh/m2)
Annualconsumptionbenchmark
178
226
432 434
340
405
162
212
137
169
Bath Road BrunelWay
WellingtonStreet
Pre-TransitionTotal
[2.5] Summary of post-transition energy consumption v. benchmark
0
100
200
300
400
500
Gas (Annual consumption kWh/m2)Electricity (Annual consumption kWh/m2)*
Annualconsumptionbenchmark
114
234 234 221 215
45 4523
44
West Side East Side Link Post-TransitionTotal
[3.1.3]: Business travel by road*
Total – UK wide KmAnnual Fleet Milage
21,451,083
Annual Private &Hire Car Milage
3,905,567
Average MonthlyRoad Travel2,113,054
Total AnnualRoad Travel25,356,650
Total – Slough Km Total – Slough Kg CO2
Annual Air Travel171,571
Average MonthlyAir Travel
14,298
Average MonthlyAir Travel
99,855
Annual Air Travel1,198,256
[3.1.2]: Business travel by rail*
Total – UK wide Km Total – UK wide Kg CO2
Annual Rail Travel113,428
Average MonthlyRail Travel
9,452
Average MonthlyRail Travel
163,706
Annual Rail Travel1,964,468
Total – Slough Km Total – Slough Kg CO2
Annual Rail Travel20,160
Average MonthlyRail Travel
1,680
Average MonthlyRail Travel
29,096
Annual Rail Travel349,151
[7.1]: Total annual emissions of O2 slough
Pre-Transition (tonnes)
Total 10,949
Office5,364
Home259
Business Travel1,139
Employeetravel to work
4,187
[3.1.4]: Summary of distances and emissions from 2009 employee business travel*
Annual Total – UK Wide KmAir*
6,741,878
Rail**1,964,468
Road***25,356,650
Total 34,062,996
Annual Total – UK Wide Tonnes CO2Air*965
Rail**113
Road***5,331
Total 6,410
Annual Total Slough – KmAir*
1,198,256
Rail**349,151
Road***4,506,722
Total 6,054,130
Annual Total Slough – Tonnes CO2Air*172
Rail**20
Road***948
Total 1,139
Total – UK wide CO2
Annual Fleet Milage4,561,668
Annual Private &Hire Car Milage
769,774
Average MonthlyRoad Travel
444,287
Total AnnualRoad Travel5,331,442
Total – Slough Km
Annual Fleet Milage3,812,572
Annual Private &Hire Car Milage
694,150
Average MonthlyRoad Travel
375,560
Total AnnualRoad Travel4,506,722
Total – Slough Kg CO2
Annual Fleet Milage810,761
Annual Private &Hire Car Milage
136,815
Average MonthlyRoad Travel
78,965
Total AnnualRoad Travel
947,575
Post-Transition (tonnes)
Total 8,091
Office2,506
Sale
s M
anag
er S
loug
h
Home259
Business Travel1,139
Employeetravel to work
4,187
[7.2]: Split between emissions sources, pre- and post-transition
Pre-Transition (Tonnes CO2)
Total 10,949
Office5,364
Home259
Business Travel1,139
Employeetravel to work
4,187
Pre-Transition (%)
Total 100%
Office49%
Home2%
Business Travel10%
Employeetravel to work
38%
Post-Transition (Tonnes CO2)
Total 8,091
Office2,506
Home259
Business Travel1,139
Employeetravel to work
4,187
Post-Transition (%)
Total 100%
Office31%
Home3%
Business Travel14%
Employeetravel to work
52%
[5.2]: Hugger sample annual footprint for travel to the office
[2.6]: Comparison of pre and post transition emissions
Return distance (miles)
Total annual CO2
Variance -53%
Average 5,092
6,156
Post TransitionTonnes CO2
5,3642,506
Pre TransitionTonnes CO2
8,208
912
CO2 emissions (tonnes)
Average 1.42
2.53
1.41
0.31
Time taken (working days)
Average 32.1
40.5
40.5
15.2
Annual CO2 per 1,000 Ft2 floor area
Variance -50%
Post TransitionTonnes CO2
23.311.6
Pre TransitionTonnes CO2
Annual CO2 per employee*
Variance -53%
Post TransitionTonnes CO2
2.681.25
Pre TransitionTonnes CO2
Annual CO2 per desk
Variance -36%
Post TransitionTonnes CO2
2.621.67
Pre TransitionTonnes CO2
0
20
40
60
80
100
Day
s w
ork
ing
at
ho
me/
year
An
nu
al e
mis
sio
ns
(kg
) as
soci
ated
wit
h h
om
e w
ork
ing
90
Sale
s M
anag
er S
loug
h
68
Sale
s M
anag
er L
eeds
90
Flex
ible
wor
ker L
eeds
*
0
Flex
ible
wor
ker S
loug
h*
0
Sale
s M
anag
er S
loug
h
0
40
80
120
160
200
39
Sale
s M
anag
er S
loug
h
153
Sale
s M
anag
er L
eeds
165
Flex
ible
wor
ker L
eeds
*
0
Flex
ible
wor
ker S
loug
h*
0
An
nu
al e
mis
sio
ns
(kg
) as
soci
ated
wit
hd
isp
laci
ng
th
e an
nu
al h
om
e w
ork
ing
day
s w
ith
day
s w
ork
ing
fro
m t
he
reg
ion
al o
ffic
e
Sale
s M
anag
er S
loug
h
0
2,000
4,000
6,000
8,000
10,000
Energy Travel
8,561
Sale
s M
anag
er S
loug
h
2,240
Sale
s M
anag
er L
eeds
2,898
Flex
ible
wor
ker L
eeds
*
0
Flex
ible
wor
ker S
loug
h*
0
Emis
sio
ns
avo
ided
(kg
) th
rou
gh
ho
me
wo
rkin
g p
er y
ear
Sale
s M
anag
er S
loug
h
0
2,000
4,000
6,000
8,000
10,0008,552
Sale
s M
anag
er S
loug
h
2,087
Sale
s M
anag
er L
eeds
2,824
Flex
ible
wor
ker L
eeds
*
0
Flex
ible
wor
ker S
loug
h*
0 Trav
el t
ime
avo
ided
(w
ork
ing
day
s)th
rou
gh
ho
me
wo
rkin
g p
er y
ear
Sale
s M
anag
er S
loug
h
0
6
12
18
24
3030
Sale
s M
anag
er S
loug
h
7
Sale
s M
anag
er L
eeds
12
Flex
ible
wor
ker L
eeds
*
0
Flex
ible
wor
ker S
loug
h*
0
7,109,739

5.5: HUGGER VERSUS HOPPER SAMPLE GROUP ANNUAL TRAVEL MILEAGE
5.6: HUGGER VS HOPPER SAMPLE GROUP AVERAGE ANNUAL TRAVEL EMISSIONS
HOPPER HOME WORKING FOOTPRINT
Our survey shows that 11 of our 13 hoppers spend at least one day a week working at home.
The impact of home working varies by individual. It depends on the type of home or building and the needs of other family members. For example, some homes use heating and power every day while others are left unheated and unlit during working hours.
Even in homes that are not normally occupied during the working day, the use of thermostats, storage heaters and open fires, mean that not all hoppers use extra heating when working at home.
Our Figure 5.7, right, takes account of the emissions associated with extra heating, lighting and use of home office equipment, as calculated by Government-endorsed data contained in DEFRA’s ‘Act on CO2’ campaign1.
5.7: SAMPLE GROUP AVERAGE HOME WORKING FOOTPRINT Average of home worker sample groupAverage days at home per week ............................................... 2.2Average days at home per year ................................................. 98.2Additional heating use, hours per week ................................... 8.5Additional lighting use, hours per week .................................. 16.4Additional heating use, weeks per year ................................... 19Additional heating use, hours per year .................................... 258.2Additional lighting use, hours per year .................................... 736.4Additional heating emissions per year (tCO2) ......................... 0.14Additional lighting emissions per year (tCO2) ......................... 0.0034Additional equipment use emissions per year (tCO2) ............. 0.047Total additional home working emissions per year (tCO2) .... 0.194*
*This finding forms the basis of Slough employees’ total home working emissions, Figure 4.1, page 32, and our total emissions reporting in Chapter 7.
ACTUAL TECHNOLOGY UPTAKE AND USE
HUGGERS
On the rare occasions that the sample huggers work from home or on the move, they use only broadband and 3G mobile phones to dial into calls. None currently uses the more interactiveremotemeetingsfeaturesofferedbywebcamandCommunicator™(Chapter1).This is to be expected, given the administrative nature of their roles.
Intheoffice,twoofthethreehuggerssurveyeduseSMARTboards™andonlyoneusesRoundTable™technologyasyet.
Huggers reported ‘no real benefit’ from using interactive meetings technologies so far. Most communicate mainly face-to-face or via phone with colleagues in the same office site. Generally, the administrative role of the hugger meant that some technologies were not required to do their jobs effectively.
HOPPERS
In contrast, hoppers use a wide variety of technologies. Their location and type of work differentiates them from huggers, since they rely on a range of technology to do their jobs effectively. They also interact with a broader group of colleagues, customers, organisations and stakeholders across many locations.
Not surprisingly, those employed in technology roles make most use of the available technology and talk about it most positively. Technology hoppers carry out more meetings remotely and make full use of software that allows them to share information and collaboratevirtually.OnlythemobileversionofSMARTboard™isyettocatchonwiththissub-group.
38 39
Tomorrow’s workspace
Split of CO2 emissions associated withSlough based employee business travel
[3.2.2]: Mode of travel to work by O2 Slough employees
Rail 2%
Car (driver)78.2%
Car (passenger) 1.1%Car share 0.4%
Motorbike 1.1%
Train 12.9%
Taxi 0.3%
Bus 1.3%
Bicycle 1.3%
Walk 1.3%Car (driver)78.2%
Car (passenger)1.1%
Car share 0.4%
Motorbike 1.1%Train 12.9%
Taxi 0.3%
Bus 1.3%
Bicycle 1.3%
Walk 1.3%
Mode of transport % of employees
[3.2.2]: Mode of travel to work by O2 Slough employeesMode of transport % of employees
% of employees
miles % employees
Air 15%
Road 83%
[3.2.3] Employees using the shuttle bus
[3.2.1] Distance travelled by O2 Slough employeesto get to work (one way)
[3.2.4] Summary of estimated annual employee travel to work data for all Slough employees
Distance travelled to work in km (return)
Emissions as proportion of totalSlough footprint –pre and post transition
km (millions)
BetweenSloughoffices 81%
Between trainstation & Bath Roadoffices 19%
0-5 miles 15%
0 5 10 15 20 25 30 35 40
5-10 miles 14%
10-20 miles 24%20-30 miles 21%
30-50 miles 12%
50-70 miles 6%
70-100 miles 3%100+ miles 6%
% of employees
[3.2.3] Employees using the shuttle bus
BetweenSloughoffices 81%
Between trainstation & Bath Roadoffices 19%
Split of CO2 emissions associated withSlough based employee business travel
Rail 2%
Air 15%
Road 83%
miles % employees
[3.2.1] Distance travelled by O2 Slough employeesto get to work (one way)
0-5 miles 15%
5-10 miles 14%
10-20 miles 24%20-30 miles 21%
30-50 miles 12%
50-70 miles 6%
70-100 miles 3% 100+ miles 6%
0 2,000
0%
20%
40%
60%
80%
100%
4,000 6,000 8,000 10,000 12,000 14,000
Office basedemployees
Annual returntravel to office
Hugger sample average
Annual return travelto external meetings
Annual return travelto internal meetings
Return travel toone-off meetings
Miles
29,185,681
36,295,420
Home/flexibleworking employees
Total
kg CO2 associates with travel to work (return)
kg CO2 millions
0 0.5 1 1.5 2 2.5 3 3.5 4 4.5
Office basedemployees 1,395,424
2,790,755
4,187,180
Home/flexibleworking employees
Total
Office
Home
Business Travel
Employee Travelto work
Hopper sample average
0 1 2 3 4 5 6 7
Annual returntravel to office
Journey type
Pre % Post %
Journey typeHugger sample average
Annual return travelto external meetings
Annual return travelto internal meetings
Return travel toone-off meetings
tCO2
Hopper sample average
[2.4] Summary of pre-transition energy consumption v. benchmark
0
100
200
300
400
500
Comparison of pre & post transition emissions
0 1000 0 50 100 150
Good practice
Good practice
Typical
Typical
200 2502000 3000 4000 5000
Electricity
Gas
Diesel
Pre Transition Office Emissions (tonnes CO2)
Annual kgCO2/m2 of treated floor area (FTA)
Heating and hot waterCoolingFans, pumps, controlsHumidificationLighting
Office EquipmentCatering, gasCatering, electricityOther electricityComputer room (where appropriate)
Post Transition Office Emissions (tonnes CO2)
Return distance (miles)
TOTAL 33,437
Travel to theoffice11,566
Travel to externalmeetings 12,268
Travel to internalmeetings 8,519
One-off meetings1,084
[3.1.1]: Business travel by air*
Total – UK wide Km Total – UK wide Kg CO2
Annual Air Travel965,325
Average MonthlyAir Travel
80,444
Average MonthlyAir Travel561,823
Annual Air Travel6,741,878
CO2 emissions (tonnes)
TOTAL 13
Travel to theoffice3.70
Travel to externalmeetings 2.88
Travel to internalmeetings 6.44
One-off meetings0.234
Time taken (working days)
TOTAL 124.1
Travel to theoffice20.2
Travel to externalmeetings 28.1
Travel to internalmeetings 75.8
Gas (Annual consumption kWh/m2)Electricity (Annual consumption kWh/m2)
Annualconsumptionbenchmark
178
226
432 434
340
405
162
212
137
169
Bath Road BrunelWay
WellingtonStreet
Pre-TransitionTotal
[2.5] Summary of post-transition energy consumption v. benchmark
0
100
200
300
400
500
Gas (Annual consumption kWh/m2)Electricity (Annual consumption kWh/m2)*
Annualconsumptionbenchmark
114
234 234 221 215
45 4523
44
West Side East Side Link Post-TransitionTotal
[3.1.3]: Business travel by road*
Total – UK wide KmAnnual Fleet Milage
21,451,083
Annual Private &Hire Car Milage
3,905,567
Average MonthlyRoad Travel2,113,054
Total AnnualRoad Travel25,356,650
Total – Slough Km Total – Slough Kg CO2
Annual Air Travel171,571
Average MonthlyAir Travel
14,298
Average MonthlyAir Travel
99,855
Annual Air Travel1,198,256
[3.1.2]: Business travel by rail*
Total – UK wide Km Total – UK wide Kg CO2
Annual Rail Travel113,428
Average MonthlyRail Travel
9,452
Average MonthlyRail Travel
163,706
Annual Rail Travel1,964,468
Total – Slough Km Total – Slough Kg CO2
Annual Rail Travel20,160
Average MonthlyRail Travel
1,680
Average MonthlyRail Travel
29,096
Annual Rail Travel349,151
[7.1]: Total annual emissions of O2 slough
Pre-Transition (tonnes)
Total 10,949
Office5,364
Home259
Business Travel1,139
Employeetravel to work
4,187
[3.1.4]: Summary of distances and emissions from 2009 employee business travel*
Annual Total – UK Wide KmAir*
6,741,878
Rail**1,964,468
Road***25,356,650
Total 34,062,996
Annual Total – UK Wide Tonnes CO2Air*965
Rail**113
Road***5,331
Total 6,410
Annual Total Slough – KmAir*
1,198,256
Rail**349,151
Road***4,506,722
Total 6,054,130
Annual Total Slough – Tonnes CO2Air*172
Rail**20
Road***948
Total 1,139
Total – UK wide CO2
Annual Fleet Milage4,561,668
Annual Private &Hire Car Milage
769,774
Average MonthlyRoad Travel
444,287
Total AnnualRoad Travel5,331,442
Total – Slough Km
Annual Fleet Milage3,812,572
Annual Private &Hire Car Milage
694,150
Average MonthlyRoad Travel
375,560
Total AnnualRoad Travel4,506,722
Total – Slough Kg CO2
Annual Fleet Milage810,761
Annual Private &Hire Car Milage
136,815
Average MonthlyRoad Travel
78,965
Total AnnualRoad Travel
947,575
Post-Transition (tonnes)
Total 8,091
Office2,506
Sale
s M
anag
er S
loug
h
Home259
Business Travel1,139
Employeetravel to work
4,187
[7.2]: Split between emissions sources, pre- and post-transition
Pre-Transition (Tonnes CO2)
Total 10,949
Office5,364
Home259
Business Travel1,139
Employeetravel to work
4,187
Pre-Transition (%)
Total 100%
Office49%
Home2%
Business Travel10%
Employeetravel to work
38%
Post-Transition (Tonnes CO2)
Total 8,091
Office2,506
Home259
Business Travel1,139
Employeetravel to work
4,187
Post-Transition (%)
Total 100%
Office31%
Home3%
Business Travel14%
Employeetravel to work
52%
[5.2]: Hugger sample annual footprint for travel to the office
[2.6]: Comparison of pre and post transition emissions
Return distance (miles)
Total annual CO2
Variance -53%
Average 5,092
6,156
Post TransitionTonnes CO2
5,3642,506
Pre TransitionTonnes CO2
8,208
912
CO2 emissions (tonnes)
Average 1.42
2.53
1.41
0.31
Time taken (working days)
Average 32.1
40.5
40.5
15.2
Annual CO2 per 1,000 Ft2 floor area
Variance -50%
Post TransitionTonnes CO2
23.311.6
Pre TransitionTonnes CO2
Annual CO2 per employee*
Variance -53%
Post TransitionTonnes CO2
2.681.25
Pre TransitionTonnes CO2
Annual CO2 per desk
Variance -36%
Post TransitionTonnes CO2
2.621.67
Pre TransitionTonnes CO2
0
20
40
60
80
100
Day
s w
ork
ing
at
ho
me/
year
An
nu
al e
mis
sio
ns
(kg
) as
soci
ated
wit
h h
om
e w
ork
ing
90
Sale
s M
anag
er S
loug
h
68
Sale
s M
anag
er L
eeds
90
Flex
ible
wor
ker L
eeds
*
0
Flex
ible
wor
ker S
loug
h*
0
Sale
s M
anag
er S
loug
h
0
40
80
120
160
200
39
Sale
s M
anag
er S
loug
h
153
Sale
s M
anag
er L
eeds
165
Flex
ible
wor
ker L
eeds
*
0
Flex
ible
wor
ker S
loug
h*
0
An
nu
al e
mis
sio
ns
(kg
) as
soci
ated
wit
hd
isp
laci
ng
th
e an
nu
al h
om
e w
ork
ing
day
s w
ith
day
s w
ork
ing
fro
m t
he
reg
ion
al o
ffic
e
Sale
s M
anag
er S
loug
h
0
2,000
4,000
6,000
8,000
10,000
Energy Travel
8,561
Sale
s M
anag
er S
loug
h
2,240
Sale
s M
anag
er L
eeds
2,898
Flex
ible
wor
ker L
eeds
*
0
Flex
ible
wor
ker S
loug
h*
0
Emis
sio
ns
avo
ided
(kg
) th
rou
gh
ho
me
wo
rkin
g p
er y
ear
Sale
s M
anag
er S
loug
h
0
2,000
4,000
6,000
8,000
10,0008,552
Sale
s M
anag
er S
loug
h
2,087
Sale
s M
anag
er L
eeds
2,824
Flex
ible
wor
ker L
eeds
*
0
Flex
ible
wor
ker S
loug
h*
0 Trav
el t
ime
avo
ided
(w
ork
ing
day
s)th
rou
gh
ho
me
wo
rkin
g p
er y
ear
Sale
s M
anag
er S
loug
h
0
6
12
18
24
3030
Sale
s M
anag
er S
loug
h
7
Sale
s M
anag
er L
eeds
12
Flex
ible
wor
ker L
eeds
*
0
Flex
ible
wor
ker S
loug
h*
0
7,109,739
Split of CO2 emissions associated withSlough based employee business travel
[3.2.2]: Mode of travel to work by O2 Slough employees
Rail 2%
Car (driver)78.2%
Car (passenger) 1.1%Car share 0.4%
Motorbike 1.1%
Train 12.9%
Taxi 0.3%
Bus 1.3%
Bicycle 1.3%
Walk 1.3%Car (driver)78.2%
Car (passenger)1.1%
Car share 0.4%
Motorbike 1.1%Train 12.9%
Taxi 0.3%
Bus 1.3%
Bicycle 1.3%
Walk 1.3%
Mode of transport % of employees
[3.2.2]: Mode of travel to work by O2 Slough employeesMode of transport % of employees
% of employees
miles % employees
Air 15%
Road 83%
[3.2.3] Employees using the shuttle bus
[3.2.1] Distance travelled by O2 Slough employeesto get to work (one way)
[3.2.4] Summary of estimated annual employee travel to work data for all Slough employees
Distance travelled to work in km (return)
Emissions as proportion of totalSlough footprint –pre and post transition
km (millions)
BetweenSloughoffices 81%
Between trainstation & Bath Roadoffices 19%
0-5 miles 15%
0 5 10 15 20 25 30 35 40
5-10 miles 14%
10-20 miles 24%20-30 miles 21%
30-50 miles 12%
50-70 miles 6%
70-100 miles 3%100+ miles 6%
% of employees
[3.2.3] Employees using the shuttle bus
BetweenSloughoffices 81%
Between trainstation & Bath Roadoffices 19%
Split of CO2 emissions associated withSlough based employee business travel
Rail 2%
Air 15%
Road 83%
miles % employees
[3.2.1] Distance travelled by O2 Slough employeesto get to work (one way)
0-5 miles 15%
5-10 miles 14%
10-20 miles 24%20-30 miles 21%
30-50 miles 12%
50-70 miles 6%
70-100 miles 3% 100+ miles 6%
0 2,000
0%
20%
40%
60%
80%
100%
4,000 6,000 8,000 10,000 12,000 14,000
Office basedemployees
Annual returntravel to office
Hugger sample average
Annual return travelto external meetings
Annual return travelto internal meetings
Return travel toone-off meetings
Miles
29,185,681
36,295,420
Home/flexibleworking employees
Total
kg CO2 associates with travel to work (return)
kg CO2 millions
0 0.5 1 1.5 2 2.5 3 3.5 4 4.5
Office basedemployees 1,395,424
2,790,755
4,187,180
Home/flexibleworking employees
Total
Office
Home
Business Travel
Employee Travelto work
Hopper sample average
0 1 2 3 4 5 6 7
Annual returntravel to office
Journey type
Pre % Post %
Journey typeHugger sample average
Annual return travelto external meetings
Annual return travelto internal meetings
Return travel toone-off meetings
tCO2
Hopper sample average
[2.4] Summary of pre-transition energy consumption v. benchmark
0
100
200
300
400
500
Comparison of pre & post transition emissions
0 1000 0 50 100 150
Good practice
Good practice
Typical
Typical
200 2502000 3000 4000 5000
Electricity
Gas
Diesel
Pre Transition Office Emissions (tonnes CO2)
Annual kgCO2/m2 of treated floor area (FTA)
Heating and hot waterCoolingFans, pumps, controlsHumidificationLighting
Office EquipmentCatering, gasCatering, electricityOther electricityComputer room (where appropriate)
Post Transition Office Emissions (tonnes CO2)
Return distance (miles)
TOTAL 33,437
Travel to theoffice11,566
Travel to externalmeetings 12,268
Travel to internalmeetings 8,519
One-off meetings1,084
[3.1.1]: Business travel by air*
Total – UK wide Km Total – UK wide Kg CO2
Annual Air Travel965,325
Average MonthlyAir Travel
80,444
Average MonthlyAir Travel561,823
Annual Air Travel6,741,878
CO2 emissions (tonnes)
TOTAL 13
Travel to theoffice3.70
Travel to externalmeetings 2.88
Travel to internalmeetings 6.44
One-off meetings0.234
Time taken (working days)
TOTAL 124.1
Travel to theoffice20.2
Travel to externalmeetings 28.1
Travel to internalmeetings 75.8
Gas (Annual consumption kWh/m2)Electricity (Annual consumption kWh/m2)
Annualconsumptionbenchmark
178
226
432 434
340
405
162
212
137
169
Bath Road BrunelWay
WellingtonStreet
Pre-TransitionTotal
[2.5] Summary of post-transition energy consumption v. benchmark
0
100
200
300
400
500
Gas (Annual consumption kWh/m2)Electricity (Annual consumption kWh/m2)*
Annualconsumptionbenchmark
114
234 234 221 215
45 4523
44
West Side East Side Link Post-TransitionTotal
[3.1.3]: Business travel by road*
Total – UK wide KmAnnual Fleet Milage
21,451,083
Annual Private &Hire Car Milage
3,905,567
Average MonthlyRoad Travel2,113,054
Total AnnualRoad Travel25,356,650
Total – Slough Km Total – Slough Kg CO2
Annual Air Travel171,571
Average MonthlyAir Travel
14,298
Average MonthlyAir Travel
99,855
Annual Air Travel1,198,256
[3.1.2]: Business travel by rail*
Total – UK wide Km Total – UK wide Kg CO2
Annual Rail Travel113,428
Average MonthlyRail Travel
9,452
Average MonthlyRail Travel
163,706
Annual Rail Travel1,964,468
Total – Slough Km Total – Slough Kg CO2
Annual Rail Travel20,160
Average MonthlyRail Travel
1,680
Average MonthlyRail Travel
29,096
Annual Rail Travel349,151
[7.1]: Total annual emissions of O2 slough
Pre-Transition (tonnes)
Total 10,949
Office5,364
Home259
Business Travel1,139
Employeetravel to work
4,187
[3.1.4]: Summary of distances and emissions from 2009 employee business travel*
Annual Total – UK Wide KmAir*
6,741,878
Rail**1,964,468
Road***25,356,650
Total 34,062,996
Annual Total – UK Wide Tonnes CO2Air*965
Rail**113
Road***5,331
Total 6,410
Annual Total Slough – KmAir*
1,198,256
Rail**349,151
Road***4,506,722
Total 6,054,130
Annual Total Slough – Tonnes CO2Air*172
Rail**20
Road***948
Total 1,139
Total – UK wide CO2
Annual Fleet Milage4,561,668
Annual Private &Hire Car Milage
769,774
Average MonthlyRoad Travel
444,287
Total AnnualRoad Travel5,331,442
Total – Slough Km
Annual Fleet Milage3,812,572
Annual Private &Hire Car Milage
694,150
Average MonthlyRoad Travel
375,560
Total AnnualRoad Travel4,506,722
Total – Slough Kg CO2
Annual Fleet Milage810,761
Annual Private &Hire Car Milage
136,815
Average MonthlyRoad Travel
78,965
Total AnnualRoad Travel
947,575
Post-Transition (tonnes)
Total 8,091
Office2,506
Sale
s M
anag
er S
loug
h
Home259
Business Travel1,139
Employeetravel to work
4,187
[7.2]: Split between emissions sources, pre- and post-transition
Pre-Transition (Tonnes CO2)
Total 10,949
Office5,364
Home259
Business Travel1,139
Employeetravel to work
4,187
Pre-Transition (%)
Total 100%
Office49%
Home2%
Business Travel10%
Employeetravel to work
38%
Post-Transition (Tonnes CO2)
Total 8,091
Office2,506
Home259
Business Travel1,139
Employeetravel to work
4,187
Post-Transition (%)
Total 100%
Office31%
Home3%
Business Travel14%
Employeetravel to work
52%
[5.2]: Hugger sample annual footprint for travel to the office
[2.6]: Comparison of pre and post transition emissions
Return distance (miles)
Total annual CO2
Variance -53%
Average 5,092
6,156
Post TransitionTonnes CO2
5,3642,506
Pre TransitionTonnes CO2
8,208
912
CO2 emissions (tonnes)
Average 1.42
2.53
1.41
0.31
Time taken (working days)
Average 32.1
40.5
40.5
15.2
Annual CO2 per 1,000 Ft2 floor area
Variance -50%
Post TransitionTonnes CO2
23.311.6
Pre TransitionTonnes CO2
Annual CO2 per employee*
Variance -53%
Post TransitionTonnes CO2
2.681.25
Pre TransitionTonnes CO2
Annual CO2 per desk
Variance -36%
Post TransitionTonnes CO2
2.621.67
Pre TransitionTonnes CO2
0
20
40
60
80
100
Day
s w
ork
ing
at
ho
me/
year
An
nu
al e
mis
sio
ns
(kg
) as
soci
ated
wit
h h
om
e w
ork
ing
90
Sale
s M
anag
er S
loug
h
68
Sale
s M
anag
er L
eeds
90
Flex
ible
wor
ker L
eeds
*
0
Flex
ible
wor
ker S
loug
h*
0
Sale
s M
anag
er S
loug
h
0
40
80
120
160
200
39
Sale
s M
anag
er S
loug
h
153
Sale
s M
anag
er L
eeds
165
Flex
ible
wor
ker L
eeds
*
0
Flex
ible
wor
ker S
loug
h*
0
An
nu
al e
mis
sio
ns
(kg
) as
soci
ated
wit
hd
isp
laci
ng
th
e an
nu
al h
om
e w
ork
ing
day
s w
ith
day
s w
ork
ing
fro
m t
he
reg
ion
al o
ffic
e
Sale
s M
anag
er S
loug
h
0
2,000
4,000
6,000
8,000
10,000
Energy Travel
8,561
Sale
s M
anag
er S
loug
h
2,240
Sale
s M
anag
er L
eeds
2,898
Flex
ible
wor
ker L
eeds
*
0
Flex
ible
wor
ker S
loug
h*
0
Emis
sio
ns
avo
ided
(kg
) th
rou
gh
ho
me
wo
rkin
g p
er y
ear
Sale
s M
anag
er S
loug
h
0
2,000
4,000
6,000
8,000
10,0008,552
Sale
s M
anag
er S
loug
h
2,087
Sale
s M
anag
er L
eeds
2,824
Flex
ible
wor
ker L
eeds
*
0
Flex
ible
wor
ker S
loug
h*
0 Trav
el t
ime
avo
ided
(w
ork
ing
day
s)th
rou
gh
ho
me
wo
rkin
g p
er y
ear
Sale
s M
anag
er S
loug
h
0
6
12
18
24
3030
Sale
s M
anag
er S
loug
h
7
Sale
s M
anag
er L
eeds
12
Flex
ible
wor
ker L
eeds
*
0
Flex
ible
wor
ker S
loug
h*
0
7,109,739
1. Act on CO2 Calculator, Version 2.0: Data, Methodology and Assumptions Paper (DECC, November 2009)
Total average annual hopper travel 33,000 miles.
Total average annual hugger travel 5,000 miles.
Total average annual hopper travel emissions 13tCO2.
Total average annual hugger travel emissions 1.5tCO2.

EMPLOYEE CASE STUDY
5.8 O2 – IT MANAGER: Widest Uptake of Technology in the Sample Group
The sample group employee with the highest technology uptake was Trevor Howells (pictured), who works as a Senior Project Manager looking after all technology infrastructure in O2 properties. Trevor’s annual emissions footprint from business travel, travel to the office, home working and office working is 10.56tCO2. This is broken down as follows:
Annual office travel footprint: 6.79tCO2
Like all of the hoppers, Trevor’s journey to the office is far longer than the hugger sample group, at either 125 miles (Slough) or 82 miles (Leeds) each way, from his home in Nottingham. Trevor travels to and from the office twice a week by car, resulting in the second highest office travel emissions in the combined hugger/hopper sample group. Trevor is on the car-sharing list but, due to his location, cannot take advantage of the scheme. While eligible for a fleet car, he prefers to use his own. Given the long journey distance and the mode of transport used, his CO2 from travel to the office is also nearly double the total working footprint of the highest emitting hugger. However, Trevor’s office travel emissions are kept lower than his fellow hoppers due to the fact he works from home for the majority of the week. Trevor spends 28 working days equivalent travelling to and from the office in a typical year.
Annual business travel footprint: 2.45tCO2
Trevor’s business travel footprint is actually typically lower than the above figure. He uses the train to travel to external meetings, the majority of which take place in the London area, resulting in low emissions of some 0.68tCO2 per year. Attendance at long distance internal meetings is co-ordinated with Trevor’s time in the Slough office, ruling out the majority of extra journeys, that may have been required. The bulk of his business travel emissions are attributable to a long haul flight every couple of years, which comprises his ‘one-off’ business travel commitments. If this flight is not considered, his use of the train for the majority of his business meetings demonstrates the emissions savings that can be made by using different forms of transport. Trevor spends 30 working days equivalent travelling to and from business meetings in a typical year.
Annual home working footprint: 0.073tCO2
11. Trevor works at home an average of 3 days a week. He keeps his home working emissions comparatively lower than the others in the sample group by using an open fire to provide the additional home heating (biogenic fuel generates lower emissions than fossil fuels). He is able to work from home effectively by using 14 of the 16 technology types covered by the sample group study. He finds the functionality of various devices, such as webcams, very useful in boosting remote collaboration with colleagues, while all of the technologies allow him to work just as effectively at home as in the office. Using them also reduces travel costs for O2 and the depreciation and maintenance costs for his own vehicle.
Average annual office working footprint: 1.25tCO2
Sales people spend much of their time on the road or with external clients, and they tend to use technologies mainly to help them to stay in touch easily and quickly. They make lessuseofinformationsharingplatformssuchaswebcamorMicrosoftCommunicator™.However, all agreed that these technologies do indeed help them reduce overall travel time and, when working from the office or home, contribute to their productivity.
Importantly, many hoppers understand the time and travel savings enabled by technology and expressed the wish to learn more about how best to use them in their work.
SUMMARY AND CHALLENGES
Use of technology by huggers and hoppers differs significantly. Hoppers are by far the biggest users, largely because they network more widely.
The use of technology within O2’s IT community demonstrates the feasibility of getting whole departments engaged in digital ways that allow companies to reduce the need to travel.
But it is clear that this can only be achieved when employees are familiar with the technologies on offer. Again, training and awareness is vital.
40 41
Tomorrow’s workspace

6. WORKING PRACTICES, OPINION AND MOOD Our personas’ views on working styles differ according to job, ease of remote communication and financial incentives.
PLANET
People generally agreed that working from home reduces travel and related emissions – at least in terms of commuting.
This view is confirmed by our research. The carbon footprint from commuting significantly outweighs the emissions associated with any additional energy consumption in a teleworker’s home.
PEOPLE
Unanimously, our sample felt that working from home creates a happier work/life balance. They welcome the flexibility to manage their time to fit better with family and leisure pursuits.
Time freed by reduced travel made people feel more productive personally and able to find and commit extra hours to O2.
However, face-to-face interaction with colleagues and the wider company was often missed. And many people still believe it’s important to be ‘seen’ in the office for career progression.
These findings are supported by research by Dr TM Welbourne, eePulse, and Amanda Jones, King’s College, London (2009), ‘Driving High Performance at O2 with Home Working’ (Section 6.2).
PROFIT
Views differed on the financial effects of home working. Those who qualify for a company travel allowance welcomed the reduction in their expenditure. Those who did not (contracted home workers) felt the financial benefits were entirely O2’s.
Similarly, contractual differences split the group on the cost of utilities. While people contracted formally as home workers benefit from a utilities allowance, others are concerned about the increased cost of utilities when working from home. However, several hoppers mentioned that their childcare costs were significantly lower.
6.1: DEBATING THE IMPACT OF TECHNOLOGY AND FLEXIBLE WORKING
PROS
One of the main advantages of telecommuting is that it allows many of our sample to avoid travel. Interviewees also cite the knock-on benefits to time and productivity:
• Less time commuting equals more for work and personal life;
• Less travel means maximum working hours with fewer evenings spent catching up;
• Virtual communication equals fewer long journeys and reduced subsistence costs.
People welcome easy contact with hoppers while they are at home, in transit or at meetings. Moreover, continuous access to emails and instant messaging prevents hoppers from slowing down discussions and decisions.
The ability to download and share data remotely means that hoppers can avoid extra trips home or to the office. This is especially useful to those who spend a lot of time with clients.
Some employees say that flexible working makes them far more productive. They feel there are fewer distractions at home. Far from feeling isolated, the broad view is that easy communication keeps teams in touch – regardless of their contractual arrangements.
Many employees feel less tired, able to exercise more and have increased time with their families. This is especially valued by those with young children who would otherwise be sleeping when parents leave for, and return from work.
CONS
One concern is that increased ‘contactability’ results in being ‘always available’ with ‘nowhere to hide’.
From a practical perspective, our interviewees worried about the sheer amount of kit required to gain full use of available technology. They also mention the difficulties experienced while travelling if mobile reception quality alternates during virtual meetings.
Despite the advantages of a flexible working culture and the ease of keeping in touch, people still worry that not being seen in the office may adversely affect career development.
Crucially, the majority of employees wanted extra training, and this was equally the case for employees using mobile and office-based technologies.
42 43
Tomorrow’s workspace

6.2: CAN HOME WORKING DRIVE HIGH PERFORMANCE?
The social benefits of flexible/home working identified in this study are supported by further research: ‘Driving High Performance at O2 with Home Working’.
Conducted by eePulse and King’s College, London (2009), it demonstrates that home working has a measurable and positive effect on employee performance.
This includes:
• ‘Better’ employee attitude and levels of engagement to O2.
• Reduced absenteeism (average of 37.7% fewer instances of absenteeism among home workers, compared to their fellow office workers).
• Improved employee performance ratings (over two years consistently higher employee performance was seen across the sample of 619 home workers and 9,350 office workers).
• Reduced staff turnover1.
However, the study acknowledges that improvements are ‘dependent on levels of employee engagement’.
The findings are supported by other independent studies, which show that ‘teleworking’2 generally increases job performance and productivity (DiMartino & Wirth, 1990; Kossek, 2001; Neal, Chapman, Ingersoll-Dayton, & Emlen, 1993)3.
There are drawbacks with this style of working, however.
The increased social isolation and reduced learning opportunities of home working may negatively affect some people’s well being. And there is potential for people to ‘work too much’. Indeed, Hill et al, 2003, observed that workers with location flexibility often work more hours, although this did not necessarily have a negative impact on work/family balance.
In some cases, home workers interviewed as part of the King’s College research expressed concern that ‘overwork’ might affect their performance. But while some highlighted the risk of ‘professional isolation’, others sensed that teleworking was actually useful for their communication and networking skills.
1. Also confirmed by EJ Hill et al (2003) who observed that, particularly for expensive skilled workers, being based in either the virtual or home office had a positive influence on job retention
2. Defined as the substitution of information technologies for work-related travel3. DiMartino, V., & Wirth, (1990). Telework: A new way of working and living, International Labour Review. Kossek, E.E., 2001:
Telecommuting, available at: www.bc.edu/bc_org/avp/csom/cwf/wfnetwork/index.html. Neal, M. B., Chapman, N. J., Ingersoll-Dayton, B., & Emlen, A. C. (1993): Employer responses to employees’ dependent-care responsibilities: Policies and benefits - Balancing work and caregiving for children, adults, and elders44 45
Tomorrow’s workspace

7. TOTAL CARBON FOOTPRINT
-26%: OVERALL TOTAL ANNUAL CO2 CARBON FOOTPRINT*
-53% : ANNUAL SLOUGH OFFICE CO2 EMISSIONS
-2,858TCO2: TOTAL ANNUAL O2 SLOUGH EMPLOYEE FOOTPRINT
*Includes office, travel and home working
Our report has considered the four main elements of O2 employee total emissions: office (Chapter 2), business travel and employee travel to work (Chapter 3) and home emissions (Chapter 4).
We find that the overall annual emission footprint for our Slough-based activities has decreased by a total of 26%, from 10,949 tonnes CO2 before transition, to 8,091 tonnes CO2 on completion (see Figure below).
The transition to OurSpace has not yet affected emissions related to home working and travel. We anticipated this. Our relocation does not involve changes to employee contracts, which already include a large proportion of home/flexible workers (67% are ‘hoppers’ in all). Travel and home-working emissions consequently remain fairly constant. But we expect this picture to change, as more people grow familiar with the new technology on offer.
7.1: TOTAL ANNUAL EMISSIONS OF O2 SLOUGH (TONNES)
SUMMARY AND CHALLENGES
Employee travel represents the company’s largest single source of emissions in post-transition O2.
According to our internal case studies, take-up and training in new technology can create sustainable improvements and costs savings.
A significant knock on effect is the better well being of flexible workers and increased overall employee performance.
7.2: EMISSIONS AS A PROPORTION OF TOTAL SLOUGH FOOTPRINT: PRE AND POST TRANSITION
46 47
Tomorrow’s workspace
Split of CO2 emissions associated withSlough based employee business travel
[3.2.2]: Mode of travel to work by O2 Slough employees
Rail 2%
Car (driver)78.2%
Car (passenger) 1.1%Car share 0.4%
Motorbike 1.1%
Train 12.9%
Taxi 0.3%
Bus 1.3%
Bicycle 1.3%
Walk 1.3%Car (driver)78.2%
Car (passenger)1.1%
Car share 0.4%
Motorbike 1.1%Train 12.9%
Taxi 0.3%
Bus 1.3%
Bicycle 1.3%
Walk 1.3%
Mode of transport % of employees
[3.2.2]: Mode of travel to work by O2 Slough employeesMode of transport % of employees
% of employees
miles % employees
Air 15%
Road 83%
[3.2.3] Employees using the shuttle bus
[3.2.1] Distance travelled by O2 Slough employeesto get to work (one way)
[3.2.4] Summary of estimated annual employee travel to work data for all Slough employees
Distance travelled to work in km (return)
Emissions as proportion of totalSlough footprint –pre and post transition
km (millions)
BetweenSloughoffices 81%
Between trainstation & Bath Roadoffices 19%
0-5 miles 15%
0 5 10 15 20 25 30 35 40
5-10 miles 14%
10-20 miles 24%20-30 miles 21%
30-50 miles 12%
50-70 miles 6%
70-100 miles 3%100+ miles 6%
% of employees
[3.2.3] Employees using the shuttle bus
BetweenSloughoffices 81%
Between trainstation & Bath Roadoffices 19%
Split of CO2 emissions associated withSlough based employee business travel
Rail 2%
Air 15%
Road 83%
miles % employees
[3.2.1] Distance travelled by O2 Slough employeesto get to work (one way)
0-5 miles 15%
5-10 miles 14%
10-20 miles 24%20-30 miles 21%
30-50 miles 12%
50-70 miles 6%
70-100 miles 3% 100+ miles 6%
0 2,000
0%
20%
40%
60%
80%
100%
4,000 6,000 8,000 10,000 12,000 14,000
Office basedemployees
Annual returntravel to office
Hugger sample average
Annual return travelto external meetings
Annual return travelto internal meetings
Return travel toone-off meetings
Miles
29,185,681
36,295,420
Home/flexibleworking employees
Total
kg CO2 associates with travel to work (return)
kg CO2 millions
0 0.5 1 1.5 2 2.5 3 3.5 4 4.5
Office basedemployees 1,395,424
2,790,755
4,187,180
Home/flexibleworking employees
Total
Office
Home
Business Travel
Employee Travelto work
Hopper sample average
0 1 2 3 4 5 6 7
Annual returntravel to office
Journey type
Pre % Post %
Journey typeHugger sample average
Annual return travelto external meetings
Annual return travelto internal meetings
Return travel toone-off meetings
tCO2
Hopper sample average
[2.4] Summary of pre-transition energy consumption v. benchmark
0
100
200
300
400
500
Comparison of pre & post transition emissions
0 1000 0 50 100 150
Good practice
Good practice
Typical
Typical
200 2502000 3000 4000 5000
Electricity
Gas
Diesel
Pre Transition Office Emissions (tonnes CO2)
Annual kgCO2/m2 of treated floor area (FTA)
Heating and hot waterCoolingFans, pumps, controlsHumidificationLighting
Office EquipmentCatering, gasCatering, electricityOther electricityComputer room (where appropriate)
Post Transition Office Emissions (tonnes CO2)
Return distance (miles)
TOTAL 33,437
Travel to theoffice11,566
Travel to externalmeetings 12,268
Travel to internalmeetings 8,519
One-off meetings1,084
[3.1.1]: Business travel by air*
Total – UK wide Km Total – UK wide Kg CO2
Annual Air Travel965,325
Average MonthlyAir Travel
80,444
Average MonthlyAir Travel561,823
Annual Air Travel6,741,878
CO2 emissions (tonnes)
TOTAL 13
Travel to theoffice3.70
Travel to externalmeetings 2.88
Travel to internalmeetings 6.44
One-off meetings0.234
Time taken (working days)
TOTAL 124.1
Travel to theoffice20.2
Travel to externalmeetings 28.1
Travel to internalmeetings 75.8
Gas (Annual consumption kWh/m2)Electricity (Annual consumption kWh/m2)
Annualconsumptionbenchmark
178
226
432 434
340
405
162
212
137
169
Bath Road BrunelWay
WellingtonStreet
Pre-TransitionTotal
[2.5] Summary of post-transition energy consumption v. benchmark
0
100
200
300
400
500
Gas (Annual consumption kWh/m2)Electricity (Annual consumption kWh/m2)*
Annualconsumptionbenchmark
114
234 234 221 215
45 4523
44
West Side East Side Link Post-TransitionTotal
[3.1.3]: Business travel by road*
Total – UK wide KmAnnual Fleet Milage
21,451,083
Annual Private &Hire Car Milage
3,905,567
Average MonthlyRoad Travel2,113,054
Total AnnualRoad Travel25,356,650
Total – Slough Km Total – Slough Kg CO2
Annual Air Travel171,571
Average MonthlyAir Travel
14,298
Average MonthlyAir Travel
99,855
Annual Air Travel1,198,256
[3.1.2]: Business travel by rail*
Total – UK wide Km Total – UK wide Kg CO2
Annual Rail Travel113,428
Average MonthlyRail Travel
9,452
Average MonthlyRail Travel
163,706
Annual Rail Travel1,964,468
Total – Slough Km Total – Slough Kg CO2
Annual Rail Travel20,160
Average MonthlyRail Travel
1,680
Average MonthlyRail Travel
29,096
Annual Rail Travel349,151
[7.1]: Total annual emissions of O2 slough
Pre-Transition (tonnes)
Total 10,949
Office5,364
Home259
Business Travel1,139
Employeetravel to work
4,187
[3.1.4]: Summary of distances and emissions from 2009 employee business travel*
Annual Total – UK Wide KmAir*
6,741,878
Rail**1,964,468
Road***25,356,650
Total 34,062,996
Annual Total – UK Wide Tonnes CO2Air*965
Rail**113
Road***5,331
Total 6,410
Annual Total Slough – KmAir*
1,198,256
Rail**349,151
Road***4,506,722
Total 6,054,130
Annual Total Slough – Tonnes CO2Air*172
Rail**20
Road***948
Total 1,139
Total – UK wide CO2
Annual Fleet Milage4,561,668
Annual Private &Hire Car Milage
769,774
Average MonthlyRoad Travel
444,287
Total AnnualRoad Travel5,331,442
Total – Slough Km
Annual Fleet Milage3,812,572
Annual Private &Hire Car Milage
694,150
Average MonthlyRoad Travel
375,560
Total AnnualRoad Travel4,506,722
Total – Slough Kg CO2
Annual Fleet Milage810,761
Annual Private &Hire Car Milage
136,815
Average MonthlyRoad Travel
78,965
Total AnnualRoad Travel
947,575
Post-Transition (tonnes)
Total 8,091
Office2,506
Sale
s M
anag
er S
loug
h
Home259
Business Travel1,139
Employeetravel to work
4,187
[7.2]: Split between emissions sources, pre- and post-transition
Pre-Transition (Tonnes CO2)
Total 10,949
Office5,364
Home259
Business Travel1,139
Employeetravel to work
4,187
Pre-Transition (%)
Total 100%
Office49%
Home2%
Business Travel10%
Employeetravel to work
38%
Post-Transition (Tonnes CO2)
Total 8,091
Office2,506
Home259
Business Travel1,139
Employeetravel to work
4,187
Post-Transition (%)
Total 100%
Office31%
Home3%
Business Travel14%
Employeetravel to work
52%
[5.2]: Hugger sample annual footprint for travel to the office
[2.6]: Comparison of pre and post transition emissions
Return distance (miles)
Total annual CO2
Variance -53%
Average 5,092
6,156
Post TransitionTonnes CO2
5,3642,506
Pre TransitionTonnes CO2
8,208
912
CO2 emissions (tonnes)
Average 1.42
2.53
1.41
0.31
Time taken (working days)
Average 32.1
40.5
40.5
15.2
Annual CO2 per 1,000 Ft2 floor area
Variance -50%
Post TransitionTonnes CO2
23.311.6
Pre TransitionTonnes CO2
Annual CO2 per employee*
Variance -53%
Post TransitionTonnes CO2
2.681.25
Pre TransitionTonnes CO2
Annual CO2 per desk
Variance -36%
Post TransitionTonnes CO2
2.621.67
Pre TransitionTonnes CO2
0
20
40
60
80
100
Day
s w
ork
ing
at
ho
me/
year
An
nu
al e
mis
sio
ns
(kg
) as
soci
ated
wit
h h
om
e w
ork
ing
90
Sale
s M
anag
er S
loug
h
68
Sale
s M
anag
er L
eeds
90
Flex
ible
wor
ker L
eeds
*
0
Flex
ible
wor
ker S
loug
h*
0
Sale
s M
anag
er S
loug
h
0
40
80
120
160
200
39
Sale
s M
anag
er S
loug
h
153
Sale
s M
anag
er L
eeds
165
Flex
ible
wor
ker L
eeds
*
0
Flex
ible
wor
ker S
loug
h*
0
An
nu
al e
mis
sio
ns
(kg
) as
soci
ated
wit
hd
isp
laci
ng
th
e an
nu
al h
om
e w
ork
ing
day
s w
ith
day
s w
ork
ing
fro
m t
he
reg
ion
al o
ffic
e
Sale
s M
anag
er S
loug
h
0
2,000
4,000
6,000
8,000
10,000
Energy Travel
8,561
Sale
s M
anag
er S
loug
h
2,240
Sale
s M
anag
er L
eeds
2,898
Flex
ible
wor
ker L
eeds
*
0
Flex
ible
wor
ker S
loug
h*
0
Emis
sio
ns
avo
ided
(kg
) th
rou
gh
ho
me
wo
rkin
g p
er y
ear
Sale
s M
anag
er S
loug
h
0
2,000
4,000
6,000
8,000
10,0008,552
Sale
s M
anag
er S
loug
h
2,087
Sale
s M
anag
er L
eeds
2,824
Flex
ible
wor
ker L
eeds
*
0
Flex
ible
wor
ker S
loug
h*
0 Trav
el t
ime
avo
ided
(w
ork
ing
day
s)th
rou
gh
ho
me
wo
rkin
g p
er y
ear
Sale
s M
anag
er S
loug
h
0
6
12
18
24
3030
Sale
s M
anag
er S
loug
h
7
Sale
s M
anag
er L
eeds
12
Flex
ible
wor
ker L
eeds
*
0
Flex
ible
wor
ker S
loug
h*
0
7,109,739
Split of CO2 emissions associated withSlough based employee business travel
[3.2.2]: Mode of travel to work by O2 Slough employees
Rail 2%
Car (driver)78.2%
Car (passenger) 1.1%Car share 0.4%
Motorbike 1.1%
Train 12.9%
Taxi 0.3%
Bus 1.3%
Bicycle 1.3%
Walk 1.3%Car (driver)78.2%
Car (passenger)1.1%
Car share 0.4%
Motorbike 1.1%Train 12.9%
Taxi 0.3%
Bus 1.3%
Bicycle 1.3%
Walk 1.3%
Mode of transport % of employees
[3.2.2]: Mode of travel to work by O2 Slough employeesMode of transport % of employees
% of employees
miles % employees
Air 15%
Road 83%
[3.2.3] Employees using the shuttle bus
[3.2.1] Distance travelled by O2 Slough employeesto get to work (one way)
[3.2.4] Summary of estimated annual employee travel to work data for all Slough employees
Distance travelled to work in km (return)
Emissions as proportion of totalSlough footprint –pre and post transition
km (millions)
BetweenSloughoffices 81%
Between trainstation & Bath Roadoffices 19%
0-5 miles 15%
0 5 10 15 20 25 30 35 40
5-10 miles 14%
10-20 miles 24%20-30 miles 21%
30-50 miles 12%
50-70 miles 6%
70-100 miles 3%100+ miles 6%
% of employees
[3.2.3] Employees using the shuttle bus
BetweenSloughoffices 81%
Between trainstation & Bath Roadoffices 19%
Split of CO2 emissions associated withSlough based employee business travel
Rail 2%
Air 15%
Road 83%
miles % employees
[3.2.1] Distance travelled by O2 Slough employeesto get to work (one way)
0-5 miles 15%
5-10 miles 14%
10-20 miles 24%20-30 miles 21%
30-50 miles 12%
50-70 miles 6%
70-100 miles 3% 100+ miles 6%
0 2,000
0%
20%
40%
60%
80%
100%
4,000 6,000 8,000 10,000 12,000 14,000
Office basedemployees
Annual returntravel to office
Hugger sample average
Annual return travelto external meetings
Annual return travelto internal meetings
Return travel toone-off meetings
Miles
29,185,681
36,295,420
Home/flexibleworking employees
Total
kg CO2 associates with travel to work (return)
kg CO2 millions
0 0.5 1 1.5 2 2.5 3 3.5 4 4.5
Office basedemployees 1,395,424
2,790,755
4,187,180
Home/flexibleworking employees
Total
Office
Home
Business Travel
Employee Travelto work
Hopper sample average
0 1 2 3 4 5 6 7
Annual returntravel to office
Journey type
Pre % Post %
Journey typeHugger sample average
Annual return travelto external meetings
Annual return travelto internal meetings
Return travel toone-off meetings
tCO2
Hopper sample average
[2.4] Summary of pre-transition energy consumption v. benchmark
0
100
200
300
400
500
Comparison of pre & post transition emissions
0 1000 0 50 100 150
Good practice
Good practice
Typical
Typical
200 2502000 3000 4000 5000
Electricity
Gas
Diesel
Pre Transition Office Emissions (tonnes CO2)
Annual kgCO2/m2 of treated floor area (FTA)
Heating and hot waterCoolingFans, pumps, controlsHumidificationLighting
Office EquipmentCatering, gasCatering, electricityOther electricityComputer room (where appropriate)
Post Transition Office Emissions (tonnes CO2)
Return distance (miles)
TOTAL 33,437
Travel to theoffice11,566
Travel to externalmeetings 12,268
Travel to internalmeetings 8,519
One-off meetings1,084
[3.1.1]: Business travel by air*
Total – UK wide Km Total – UK wide Kg CO2
Annual Air Travel965,325
Average MonthlyAir Travel
80,444
Average MonthlyAir Travel561,823
Annual Air Travel6,741,878
CO2 emissions (tonnes)
TOTAL 13
Travel to theoffice3.70
Travel to externalmeetings 2.88
Travel to internalmeetings 6.44
One-off meetings0.234
Time taken (working days)
TOTAL 124.1
Travel to theoffice20.2
Travel to externalmeetings 28.1
Travel to internalmeetings 75.8
Gas (Annual consumption kWh/m2)Electricity (Annual consumption kWh/m2)
Annualconsumptionbenchmark
178
226
432 434
340
405
162
212
137
169
Bath Road BrunelWay
WellingtonStreet
Pre-TransitionTotal
[2.5] Summary of post-transition energy consumption v. benchmark
0
100
200
300
400
500
Gas (Annual consumption kWh/m2)Electricity (Annual consumption kWh/m2)*
Annualconsumptionbenchmark
114
234 234 221 215
45 4523
44
West Side East Side Link Post-TransitionTotal
[3.1.3]: Business travel by road*
Total – UK wide KmAnnual Fleet Milage
21,451,083
Annual Private &Hire Car Milage
3,905,567
Average MonthlyRoad Travel2,113,054
Total AnnualRoad Travel25,356,650
Total – Slough Km Total – Slough Kg CO2
Annual Air Travel171,571
Average MonthlyAir Travel
14,298
Average MonthlyAir Travel
99,855
Annual Air Travel1,198,256
[3.1.2]: Business travel by rail*
Total – UK wide Km Total – UK wide Kg CO2
Annual Rail Travel113,428
Average MonthlyRail Travel
9,452
Average MonthlyRail Travel
163,706
Annual Rail Travel1,964,468
Total – Slough Km Total – Slough Kg CO2
Annual Rail Travel20,160
Average MonthlyRail Travel
1,680
Average MonthlyRail Travel
29,096
Annual Rail Travel349,151
[7.1]: Total annual emissions of O2 slough
Pre-Transition (tonnes)
Total 10,949
Office5,364
Home259
Business Travel1,139
Employeetravel to work
4,187
[3.1.4]: Summary of distances and emissions from 2009 employee business travel*
Annual Total – UK Wide KmAir*
6,741,878
Rail**1,964,468
Road***25,356,650
Total 34,062,996
Annual Total – UK Wide Tonnes CO2Air*965
Rail**113
Road***5,331
Total 6,410
Annual Total Slough – KmAir*
1,198,256
Rail**349,151
Road***4,506,722
Total 6,054,130
Annual Total Slough – Tonnes CO2Air*172
Rail**20
Road***948
Total 1,139
Total – UK wide CO2
Annual Fleet Milage4,561,668
Annual Private &Hire Car Milage
769,774
Average MonthlyRoad Travel
444,287
Total AnnualRoad Travel5,331,442
Total – Slough Km
Annual Fleet Milage3,812,572
Annual Private &Hire Car Milage
694,150
Average MonthlyRoad Travel
375,560
Total AnnualRoad Travel4,506,722
Total – Slough Kg CO2
Annual Fleet Milage810,761
Annual Private &Hire Car Milage
136,815
Average MonthlyRoad Travel
78,965
Total AnnualRoad Travel
947,575
Post-Transition (tonnes)
Total 8,091
Office2,506
Sale
s M
anag
er S
loug
h
Home259
Business Travel1,139
Employeetravel to work
4,187
[7.2]: Split between emissions sources, pre- and post-transition
Pre-Transition (Tonnes CO2)
Total 10,949
Office5,364
Home259
Business Travel1,139
Employeetravel to work
4,187
Pre-Transition (%)
Total 100%
Office49%
Home2%
Business Travel10%
Employeetravel to work
38%
Post-Transition (Tonnes CO2)
Total 8,091
Office2,506
Home259
Business Travel1,139
Employeetravel to work
4,187
Post-Transition (%)
Total 100%
Office31%
Home3%
Business Travel14%
Employeetravel to work
52%
[5.2]: Hugger sample annual footprint for travel to the office
[2.6]: Comparison of pre and post transition emissions
Return distance (miles)
Total annual CO2
Variance -53%
Average 5,092
6,156
Post TransitionTonnes CO2
5,3642,506
Pre TransitionTonnes CO2
8,208
912
CO2 emissions (tonnes)
Average 1.42
2.53
1.41
0.31
Time taken (working days)
Average 32.1
40.5
40.5
15.2
Annual CO2 per 1,000 Ft2 floor area
Variance -50%
Post TransitionTonnes CO2
23.311.6
Pre TransitionTonnes CO2
Annual CO2 per employee*
Variance -53%
Post TransitionTonnes CO2
2.681.25
Pre TransitionTonnes CO2
Annual CO2 per desk
Variance -36%
Post TransitionTonnes CO2
2.621.67
Pre TransitionTonnes CO2
0
20
40
60
80
100
Day
s w
ork
ing
at
ho
me/
year
An
nu
al e
mis
sio
ns
(kg
) as
soci
ated
wit
h h
om
e w
ork
ing
90
Sale
s M
anag
er S
loug
h
68
Sale
s M
anag
er L
eeds
90
Flex
ible
wor
ker L
eeds
*
0
Flex
ible
wor
ker S
loug
h*
0
Sale
s M
anag
er S
loug
h
0
40
80
120
160
200
39
Sale
s M
anag
er S
loug
h
153
Sale
s M
anag
er L
eeds
165
Flex
ible
wor
ker L
eeds
*
0
Flex
ible
wor
ker S
loug
h*
0
An
nu
al e
mis
sio
ns
(kg
) as
soci
ated
wit
hd
isp
laci
ng
th
e an
nu
al h
om
e w
ork
ing
day
s w
ith
day
s w
ork
ing
fro
m t
he
reg
ion
al o
ffic
e
Sale
s M
anag
er S
loug
h
0
2,000
4,000
6,000
8,000
10,000
Energy Travel
8,561
Sale
s M
anag
er S
loug
h
2,240
Sale
s M
anag
er L
eeds
2,898
Flex
ible
wor
ker L
eeds
*
0
Flex
ible
wor
ker S
loug
h*
0
Emis
sio
ns
avo
ided
(kg
) th
rou
gh
ho
me
wo
rkin
g p
er y
ear
Sale
s M
anag
er S
loug
h
0
2,000
4,000
6,000
8,000
10,0008,552
Sale
s M
anag
er S
loug
h
2,087
Sale
s M
anag
er L
eeds
2,824
Flex
ible
wor
ker L
eeds
*
0
Flex
ible
wor
ker S
loug
h*
0 Trav
el t
ime
avo
ided
(w
ork
ing
day
s)th
rou
gh
ho
me
wo
rkin
g p
er y
ear
Sale
s M
anag
er S
loug
h
0
6
12
18
24
3030
Sale
s M
anag
er S
loug
h
7
Sale
s M
anag
er L
eeds
12
Flex
ible
wor
ker L
eeds
*
0
Flex
ible
wor
ker S
loug
h*
0
7,109,739

8. CONCLUSIONS THE MOVE TO OURSPACE WILL CUT OFFICE EMISSIONS BY HALF•Officerelatedemissionsareexpectedtodeclineby53%asaresultoftransition,despite
only a 6% reduction in floor area. •Thisdeclineequatestoa50%decreaseinemissionintensitypersquarefootoffloorarea.•OurSpaceenergyconsumptionandassociatedemissionsareconsistentlylowerthanthe
energy benchmark for an equivalent type of office.
EMPLOYEE TRAVEL IS NOW O2’S BIGGEST SOURCE OF EMISSIONS•EmployeetraveltoworkisnowthelargestsinglecontributortoO2Sloughtotal
emissions, accounting for more than half (52%) post-transition to OurSpace.•Totaltravelemissions(includingbusiness-relatedtravel)accountfornearlytwo-thirds
(66%) of the total emissions footprint post-transition to OurSpace.•Thiscontrastswiththesplitofemissionspre-transitiontoOurSpace,inwhichtheCO2
emissions from the office and total employee travel (business and travel to work) were roughly equal in proportion.
•EmployeecommutingisanareaofCO2emissionsnotnormallymeasuredbybusinesses.Ifyou don’t measure, you can’t influence it.
SLOUGH-BASED ‘HOPPERS’ COMMUTE SIGNIFICANTLY GREATER DISTANCES TO WORK THAN ‘HUGGERS’ •Hoppers,whoaccountfor67%oftheO2Slough-basedworkforce,haverelativelylengthy
commutes to the office. Of our sample 13 hoppers, the average return journey is 123 miles.
•O2’s2009travelsurveysupportsthisevidence.TheaverageO2employeejourneytoandfrom work is significantly raised by the commuting distances covered by hoppers.
•ThelongcommutebyhoppersisperhapsinfluencedbyO2’sfocusonemployinghighcalibre people from a wide geographic catchment area, the company’s willingness to support flexible working, and the attractive travel allowances on offer.
•Incontrast,Slough-basedhuggers(33%oftheworkforce)haveamuchshortercommute.Our interviewees had an average daily return journey of 22 miles.
TECHNOLOGIES USED AT O2 ENABLE FLEXIBLE WORKING PRACTICES•CommunicationtechnologiesatO2allowemployeestoworkflexiblyandremotely–
avoiding time spent travelling and commuting.•Thisimprovesemployees’worklifebalance,maximisingthetimeavailabletoworkand
avoiding travel and subsistence costs for O2.•Someemployeesfeelthatbeing‘seen’intheofficeiscrucialtocareerdevelopment.•Criticaltothesuccessofanybusiness’stechnologystrategyisthesimultaneousavailability
of employee training. Without this, up-take will be low.
FLEXIBLE/HOME WORKING AVOIDS TRAVEL-TO-WORK EMISSIONS•Thedropintravel-relatedemissionsduetoreducedcommutingsignificantlyoutweighs
the increase in emissions generated by employees when they work at home (for example, heating, lighting and power of equipment).
FLEXIBLE/HOME WORKING CARRIES SOCIAL AND ECONOMIC BENEFITS FOR O2 AND EMPLOYEES•Availableevidencesuggeststhatflexible/homeworkingcreatessocialbenefits:to
employees – through improved work life balance; and to O2 – through a wider talent pool.
•This,inturn,cancreatehighermotivationandperformance.•Homeworkingmakessomeemployees‘farmore’productive.•Technologyhelpsmanyemployeesusetimemoreeffectively,keepingthemintouchwith
colleagues when travelling.•Remoteworkingmayactuallyincreasesomeemployees’travelemissionsbyenabling
them to attend more sales meetings, for example. But this is likely to increase productivity and lower the concentration of CO2 emissions per £ sales.
THERE IS MUCH SCOPE FOR ‘GREENING’ EMPLOYEES’ BUSINESS TRAVEL•O2employmentpackagescurrentlyincludearangeoffinancialincentives,including
eligibility for a fleet car or travel allowance.•Thisintensifiescaremissions,with83%ofalltravel-relatedemissionsemanatingfrom
business travel by road.•Topartiallyaddressrelianceoncars,O2isimplementingarangeofmeasuresaimedat
‘greening’ the car fleet and encouraging uptake of travel alternatives.
WHAT OUR RESEARCH TELLS POLICY MAKERS AND UK PLC
GREENING OF BUILDINGS CAN MAKE A BIG DIFFERENCEThe potential for new build commercial property is clear. Modern building technology can deliver dramatic improvements in energy efficiency compared to the typical office environments of the 1980s and 1990s.
It would also be useful to investigate what scale of emission reductions could be gained from upgrading existing properties to higher standards. However, a more energy efficient office space can radically increase the relative contribution of carbon emissions from employee travel.
IMPROVING HOUSEHOLD ENERGY PERFORMANCE FURTHER REDUCES CARBON IMPACTOur report shows that reduced travel from home working can far outweigh the impact of any additional household heating.
Some progressive companies are looking to further reduce the impact of their employees’ household emissions. They are working with utilities providers and others to offer insulation and efficiency services to their people. If government is committed to improving household energy performance, policy makers should look to reduce the bureaucracy and corporate tax burden on businesses that make such moves.
In light of the UK’s goal to cut carbon emissions by 80% by 2050, government should carry out a review of how offering employees energy efficiency incentives can benefit both the public and private sectors. Any review should also consider the impact of all obstacles that hinder business take-up of such schemes.
48 49
Tomorrow’s workspace

1. Dwelly, A Lake, Can Homeworking Save The Planet? The Smith Institute, November 2008 (see www.flexibility.co.uk )
2. See Homeworking – Do you really know what it’s about? An extract from Carbon Intent Survey, April 2009. Available at www.amillan.co.uk/media/files/Homeworking%20V1.pdf
TRAVEL EMISSIONS CAN BE A MAJOR CARBON SOURCE FOR BUSINESSES
Some evidence suggests that the UK working population travels billions of miles each year only to spend time using computers and telephones: (Can Homeworking Save The Planet?1
Dwelly et al).
This is intrinsically unsustainable. Dwelly et al suggest that government policy remains rooted in the separation of home and work. Progressive government must recognise that shifting people between home and work is often unnecessary. It must look at this paradigm differently to achieve the UK’s ambitious carbon targets.
EMISSIONS FROM COMMUTING MAY BE THE ‘ELEPHANT IN THE ROOM’
Assuming that O2’s operations are representative of many office-based UK service sector organisations, the implications for emissions from commuting are large.
Organisations that measure and report their CO2 emissions typically focus on direct, ‘Scope 1 & 2’ emissions, as defined by the widely adopted ‘GHG Protocol’ and endorsed by UK Government reporting guidelines. Travel-to-work emissions fall under ‘Scope 3’ (indirect) emissions and so – being outside a company’s control – are not included in mainstream CO2 reporting.
Yet O2’s experience shows these emissions to be highly significant, arguably warranting their consideration in companies’ total carbon inventory. This may well be the case for many others in the private and public sectors. Government and business leaders may therefore see fit to encourage organisations to consider employee travel to work within their carbon footprint, and shine a light on the need to consider greener travel options.
FLEXIBLE WORKING, ENABLED BY MODERN TECHNOLOGY, OFFERS REAL POTENTIAL TO LOWER EMISSIONS
Wider uptake of communication technology would help to reduce travel significantly and begin the process of reducing the travel impact of many service sector companies.
There is evidence of benefits in terms of recruitment, retention, morale and productivity.
Further studies – including case studies across different organisations – may help shore up the evidence presented in this report. This would help to further inform public policy and best practice for UK organisations.
Over recent years, businesses have seen year-on-year increases in the levels of teleworking in the UK2. A large proportion of home-based workers are, in fact, self-employed. As Dwelly et al suggest, if government is seeking to nurture small businesses and new ventures, communication technology offers easier and more cost efficient business start-up. Policy makers could do well to recognise and encourage this.
Additionally, policy-makers themselves could consider the benefits of more flexible working in the public sector – and lead by example.
At O2, we will continue to promote smarter working in the business. A next step will be to establish a policy forum for likeminded companies and stakeholders to come together to discuss how UK businesses can benefit from new working practices and communication technology. This will help to further examine the policy implications for the UK.
50 51
Tomorrow’s workspace

APPENDICES
APPENDIX 1
TECHNOLOGY IN USE AT OURSPACE
TELEPRESENCE™ Telepresence™provides‘virtual’meetingsinhigh-definition(HD)videoandqualityaudio,allowing participants to communicate in life-size and with clarity akin to face-to-face communication. O2’s single suite at the former Slough office in Wellington Street is moving to OurSpace, with a second suite now planned. A further suite is located at the Leeds office. Telepresence™iscurrentlyreservedprimarilyforboardanddirectorlevelmeetings.
VIDEOCONFERENCE Videoconference similarly enables telecommuters to meet virtually across O2 offices, though with a lesser degree of audio/visual clarity. It can also be used to communicate with suppliers and other stakeholders who deploy the same technology. Currently, O2’s facilities do not allow remote/home workers to dial into a virtual meeting, although the roll outofwebcamandMicrosoftCommunicator™mayenablethisnextstep.Threeexistingvideoconference suites in Slough are relocating to OurSpace and two further suites will be added.
ROUNDTABLE™ RoundTable™isacompacttabletopdeviceconnectedtoastandardPCtooffersynchronized voice and video conferencing. The device creates a 360-degree video of everyone taking part. It tracks the flow of the conversation, so the image and voice ofthepersonwhoisspeakingarespotlighted.RoundTable™workswithMicrosoftCommunicator™toenableattendeestointegratepresentationsandsharedwhiteboardsintotheiraudio/videoconferences.Ifsomeonemissesacall,theRoundTable™sessionscanbe recorded and viewed later.
O2begantrialsofRoundTable™priortothemovetoOurSpace.Therearenow13suitesatOurSpace West Side and two in the Leeds office. An additional 15 suites are planned for O2 offices around the UK, some of which will be deployed at East Side.
WEBCAM WebcamallowsremoteuserstoaccessvideocallsviaMicrosoftCommunicator™.Thesoftware will be available to all O2 employees so that users can share desktop screens with a group and participate interactively in SMARTBoard™discussions.Webcamsarecurrentlyinstalled on the laptops of approximately 500 O2 users. A roll out of next generation laptops from 2010 will provide built-in webcams to all users, wherever they are1.
SMARTBOARD™ These interactive whiteboards enable users to edit, save and share notes and content. Tools include desktop sharing, video player and recorder and a camera function to capture images – say from a website or other document – and apply them to the SMARTboard™page,thusreplacingtheneedforprojectors.Ahandwritingrecognitionfeature allows the user to write on the board with a digital pen and convert and save ittoacomputer-recognizedfont.AttendeestoSMARTBoard™meetingscanjoinacallremotely via Microsoft Communicator and contribute to notes and diagrams made on theSMARTboard™.O2’suseisexpanding.Fromjusttwopriortorelocation,40newSmartBoards have been installed in the West Side. A further 10 are anticipated with completion of the move.
BROADBAND Broadband is standard business-wide. All home workers are provided with O2 broadband at home, or given the option to switch their provider to O2. Remote workers can access broadband via Dongles or smart phones to achieve the fastest available broadband speeds in areas supported by 3G services.
DONGLES Dongles provide a PC or laptop broadband connection to people who are working away from head office, home office, or other fixed broadband facilities. Where a 3G signal is available, users can dial into visual calls, using webcam and Microsoft Communicator. O2 employees can order dongles from standard equipment, with their manager’s authorisation.
SMART PHONES New generation Smart Phones allow users to access instant messaging, email, voice and video calls on a single handset. O2 supports the full range of smart phones it sells, including Apple iPhone, Palm Pre and Blackberry. In areas where 3G signal is available, camera-enabled Smart Phones allow a user to dial into visual calls.
1. O2 expects to launch a communications programme in 2010 to help employees understand the use of webcam technology. Uptake is anticipated to grow as a result of awareness, training and simpler-to-use inbuilt webcams52 53
Tomorrow’s workspace

APPENDIX 2
HOPPER AND HUGGER SAMPLE METHODOLOGY
Our core research was conducted and analysed independently by Environmental Resources Management (ERM).
A sample group of 16 carefully selected employees representing the different categories of desk-bound and flexible worker contributed to ERM’s survey. This was designed to cover the three key working practices across the company: office-based, home-based and mobile workers.
O2 provided ERM with contact details for named individuals who fitted the required profiles. ERM issued a searching questionnaire to those individuals, followed up by exhaustive telephone interviews.
O2 also conducted a wider survey of employees using a shortened version of the sample questionnaire. The findings backed up the results of ERM’s qualitative research.
Our hugger and hopper categories were broken down into a range of six types of ‘persona’, as follows.
Huggers (office-/desk-based)
Hoppers – categorised into 5 groups:1. Home worker2. Before/after sales (mobile workers)3. Flexible white collar Manager (to address mind-set change)4. Flexible worker (non-managerial)5. Technology
In selecting employees for each hopper category, ERM and O2 have tried to build a profile reflective of the true picture, both by job type and style of working. A maximum of three employees were selected from each of the six categories, creating a total sample group of 16, of which 3 are huggers and 13 are hoppers.
APPENDIX 2.1
E.SURVEY OF 1,067 O2 RESPONDENTS
A web-based e.survey of O2 employees UK-wide received 1,067 respondents in 2010. This survey includes a range of questions, including some related to employee travel to work and uptake of technology.
Our report uses this data wherever possible, to back up or qualify the findings of a: the Slough-based hugger and hopper sample gathered specifically for this report, which provides our core qualitative data, and b: O2’s 2009 travel survey.
For example, the e.survey reveals an average travel-to-work return journey of 74 minutes per employee. Although slightly lower than the 100 minutes identified for ‘hoppers’ through the travel survey, the data includes all types of employee.
APPENDIX 3
OFFICE ENERGY USE INDICES FOR TYPE 3 & 4 OFFICES (FROM ECON19)
54
Tomorrow’s workspace
55
Split of CO2 emissions associated withSlough based employee business travel
[3.2.2]: Mode of travel to work by O2 Slough employees
Rail 2%
Car (driver)78.2%
Car (passenger) 1.1%Car share 0.4%
Motorbike 1.1%
Train 12.9%
Taxi 0.3%
Bus 1.3%
Bicycle 1.3%
Walk 1.3%Car (driver)78.2%
Car (passenger)1.1%
Car share 0.4%
Motorbike 1.1%Train 12.9%
Taxi 0.3%
Bus 1.3%
Bicycle 1.3%
Walk 1.3%
Mode of transport % of employees
[3.2.2]: Mode of travel to work by O2 Slough employeesMode of transport % of employees
% of employees
miles % employees
Air 15%
Road 83%
[3.2.3] Employees using the shuttle bus
[3.2.1] Distance travelled by O2 Slough employeesto get to work (one way)
[3.2.4] Summary of estimated annual employee travel to work data for all Slough employees
Distance travelled to work in km (return)
Emissions as proportion of totalSlough footprint –pre and post transition
km (millions)
BetweenSloughoffices 81%
Between trainstation & Bath Roadoffices 19%
0-5 miles 15%
0 5 10 15 20 25 30 35 40
5-10 miles 14%
10-20 miles 24%20-30 miles 21%
30-50 miles 12%
50-70 miles 6%
70-100 miles 3%100+ miles 6%
% of employees
[3.2.3] Employees using the shuttle bus
BetweenSloughoffices 81%
Between trainstation & Bath Roadoffices 19%
Split of CO2 emissions associated withSlough based employee business travel
Rail 2%
Air 15%
Road 83%
miles % employees
[3.2.1] Distance travelled by O2 Slough employeesto get to work (one way)
0-5 miles 15%
5-10 miles 14%
10-20 miles 24%20-30 miles 21%
30-50 miles 12%
50-70 miles 6%
70-100 miles 3% 100+ miles 6%
0 2,000
0%
20%
40%
60%
80%
100%
4,000 6,000 8,000 10,000 12,000 14,000
Office basedemployees
Annual returntravel to office
Hugger sample average
Annual return travelto external meetings
Annual return travelto internal meetings
Return travel toone-off meetings
Miles
29,185,681
36,295,420
Home/flexibleworking employees
Total
kg CO2 associates with travel to work (return)
kg CO2 millions
0 0.5 1 1.5 2 2.5 3 3.5 4 4.5
Office basedemployees 1,395,424
2,790,755
4,187,180
Home/flexibleworking employees
Total
Office
Home
Business Travel
Employee Travelto work
Hopper sample average
0 1 2 3 4 5 6 7
Annual returntravel to office
Journey type
Pre % Post %
Journey typeHugger sample average
Annual return travelto external meetings
Annual return travelto internal meetings
Return travel toone-off meetings
tCO2
Hopper sample average
[2.4] Summary of pre-transition energy consumption v. benchmark
0
100
200
300
400
500
Comparison of pre & post transition emissions
0 1000 0 50 100 150
Good practice
Good practice
Typical
Typical
200 2502000 3000 4000 5000
Electricity
Gas
Diesel
Pre Transition Office Emissions (tonnes CO2)
Annual kgCO2/m2 of treated floor area (FTA)
Heating and hot waterCoolingFans, pumps, controlsHumidificationLighting
Office EquipmentCatering, gasCatering, electricityOther electricityComputer room (where appropriate)
Post Transition Office Emissions (tonnes CO2)
Return distance (miles)
TOTAL 33,437
Travel to theoffice11,566
Travel to externalmeetings 12,268
Travel to internalmeetings 8,519
One-off meetings1,084
[3.1.1]: Business travel by air*
Total – UK wide Km Total – UK wide Kg CO2
Annual Air Travel965,325
Average MonthlyAir Travel
80,444
Average MonthlyAir Travel561,823
Annual Air Travel6,741,878
CO2 emissions (tonnes)
TOTAL 13
Travel to theoffice3.70
Travel to externalmeetings 2.88
Travel to internalmeetings 6.44
One-off meetings0.234
Time taken (working days)
TOTAL 124.1
Travel to theoffice20.2
Travel to externalmeetings 28.1
Travel to internalmeetings 75.8
Gas (Annual consumption kWh/m2)Electricity (Annual consumption kWh/m2)
Annualconsumptionbenchmark
178
226
432 434
340
405
162
212
137
169
Bath Road BrunelWay
WellingtonStreet
Pre-TransitionTotal
[2.5] Summary of post-transition energy consumption v. benchmark
0
100
200
300
400
500
Gas (Annual consumption kWh/m2)Electricity (Annual consumption kWh/m2)*
Annualconsumptionbenchmark
114
234 234 221 215
45 4523
44
West Side East Side Link Post-TransitionTotal
[3.1.3]: Business travel by road*
Total – UK wide KmAnnual Fleet Milage
21,451,083
Annual Private &Hire Car Milage
3,905,567
Average MonthlyRoad Travel2,113,054
Total AnnualRoad Travel25,356,650
Total – Slough Km Total – Slough Kg CO2
Annual Air Travel171,571
Average MonthlyAir Travel
14,298
Average MonthlyAir Travel
99,855
Annual Air Travel1,198,256
[3.1.2]: Business travel by rail*
Total – UK wide Km Total – UK wide Kg CO2
Annual Rail Travel113,428
Average MonthlyRail Travel
9,452
Average MonthlyRail Travel
163,706
Annual Rail Travel1,964,468
Total – Slough Km Total – Slough Kg CO2
Annual Rail Travel20,160
Average MonthlyRail Travel
1,680
Average MonthlyRail Travel
29,096
Annual Rail Travel349,151
[7.1]: Total annual emissions of O2 slough
Pre-Transition (tonnes)
Total 10,949
Office5,364
Home259
Business Travel1,139
Employeetravel to work
4,187
[3.1.4]: Summary of distances and emissions from 2009 employee business travel*
Annual Total – UK Wide KmAir*
6,741,878
Rail**1,964,468
Road***25,356,650
Total 34,062,996
Annual Total – UK Wide Tonnes CO2Air*965
Rail**113
Road***5,331
Total 6,410
Annual Total Slough – KmAir*
1,198,256
Rail**349,151
Road***4,506,722
Total 6,054,130
Annual Total Slough – Tonnes CO2Air*172
Rail**20
Road***948
Total 1,139
Total – UK wide CO2
Annual Fleet Milage4,561,668
Annual Private &Hire Car Milage
769,774
Average MonthlyRoad Travel
444,287
Total AnnualRoad Travel5,331,442
Total – Slough Km
Annual Fleet Milage3,812,572
Annual Private &Hire Car Milage
694,150
Average MonthlyRoad Travel
375,560
Total AnnualRoad Travel4,506,722
Total – Slough Kg CO2
Annual Fleet Milage810,761
Annual Private &Hire Car Milage
136,815
Average MonthlyRoad Travel
78,965
Total AnnualRoad Travel
947,575
Post-Transition (tonnes)
Total 8,091
Office2,506
Sale
s M
anag
er S
loug
h
Home259
Business Travel1,139
Employeetravel to work
4,187
[7.2]: Split between emissions sources, pre- and post-transition
Pre-Transition (Tonnes CO2)
Total 10,949
Office5,364
Home259
Business Travel1,139
Employeetravel to work
4,187
Pre-Transition (%)
Total 100%
Office49%
Home2%
Business Travel10%
Employeetravel to work
38%
Post-Transition (Tonnes CO2)
Total 8,091
Office2,506
Home259
Business Travel1,139
Employeetravel to work
4,187
Post-Transition (%)
Total 100%
Office31%
Home3%
Business Travel14%
Employeetravel to work
52%
[5.2]: Hugger sample annual footprint for travel to the office
[2.6]: Comparison of pre and post transition emissions
Return distance (miles)
Total annual CO2
Variance -53%
Average 5,092
6,156
Post TransitionTonnes CO2
5,3642,506
Pre TransitionTonnes CO2
8,208
912
CO2 emissions (tonnes)
Average 1.42
2.53
1.41
0.31
Time taken (working days)
Average 32.1
40.5
40.5
15.2
Annual CO2 per 1,000 Ft2 floor area
Variance -50%
Post TransitionTonnes CO2
23.311.6
Pre TransitionTonnes CO2
Annual CO2 per employee*
Variance -53%
Post TransitionTonnes CO2
2.681.25
Pre TransitionTonnes CO2
Annual CO2 per desk
Variance -36%
Post TransitionTonnes CO2
2.621.67
Pre TransitionTonnes CO2
0
20
40
60
80
100
Day
s w
ork
ing
at
ho
me/
year
An
nu
al e
mis
sio
ns
(kg
) as
soci
ated
wit
h h
om
e w
ork
ing
90
Sale
s M
anag
er S
loug
h
68
Sale
s M
anag
er L
eeds
90
Flex
ible
wor
ker L
eeds
*
0
Flex
ible
wor
ker S
loug
h*
0
Sale
s M
anag
er S
loug
h
0
40
80
120
160
200
39
Sale
s M
anag
er S
loug
h
153
Sale
s M
anag
er L
eeds
165
Flex
ible
wor
ker L
eeds
*
0
Flex
ible
wor
ker S
loug
h*
0
An
nu
al e
mis
sio
ns
(kg
) as
soci
ated
wit
hd
isp
laci
ng
th
e an
nu
al h
om
e w
ork
ing
day
s w
ith
day
s w
ork
ing
fro
m t
he
reg
ion
al o
ffic
e
Sale
s M
anag
er S
loug
h
0
2,000
4,000
6,000
8,000
10,000
Energy Travel
8,561
Sale
s M
anag
er S
loug
h
2,240
Sale
s M
anag
er L
eeds
2,898
Flex
ible
wor
ker L
eeds
*
0
Flex
ible
wor
ker S
loug
h*
0
Emis
sio
ns
avo
ided
(kg
) th
rou
gh
ho
me
wo
rkin
g p
er y
ear
Sale
s M
anag
er S
loug
h
0
2,000
4,000
6,000
8,000
10,0008,552
Sale
s M
anag
er S
loug
h
2,087
Sale
s M
anag
er L
eeds
2,824
Flex
ible
wor
ker L
eeds
*
0
Flex
ible
wor
ker S
loug
h*
0 Trav
el t
ime
avo
ided
(w
ork
ing
day
s)th
rou
gh
ho
me
wo
rkin
g p
er y
ear
Sale
s M
anag
er S
loug
h
0
6
12
18
24
3030
Sale
s M
anag
er S
loug
h
7
Sale
s M
anag
er L
eeds
12
Flex
ible
wor
ker L
eeds
*
0
Flex
ible
wor
ker S
loug
h*
0
7,109,739

• energy • emissions • efficiency •technology •travel •home •work •office •productivity •time •morale •engagement •balance •
With thanks to: Environmental Resources Management (www.erm.com)Forum for the Future (www.forumforthefuture.org.uk)Amanda Jones, King’s College, University of London (www.kcl.ac.uk)eePulse (www.eepulse.com)
Writing: www.wordworksbysea.comDesign: www.vividassociates.com Print: Vertec Printing Services, using Forest Stewardship Council accredited paper and vegetable inks made from 100% renewable raw material