Embed Size (px)
Citation preview

Tonga Domestic Market
Study: Using the Domestic Market Survey Report to investigate
selected policy issues
'Elisaia S. Ika
September 2011
Talamahu Municipal Market

2
Domestic Market Study Tonga:
Using the Domestic Market Survey Report to investigate selected policy issues
Prepared by
‘Elisaia S. Ika
September 2011
The depiction employed and the presentation of material in this paper do not imply the
expression of any opinion whatsoever on the part of the Food and Agricultural
Organization of the United Nations covering the legal or development status of any
country, territory, city or area or its authorities or concerning the deliberations of its
frontiers or boundaries.
The findings, interpretations and conclusions expressed in this report are those of the
author and do not necessarily represent the views of FAO.
This study was prepared as a contribution to the All ACP Agricultural Commodities Programme, with funding from the European Union.

3
Acknowledgements I would like to acknowledge the EU All ACP Agricultural Commodities Program for funding this
market study as well as the contribution of the FAO in commissioning this case study to
demonstrate the importance of collection and analysis of data on domestic market activities.
Acknowledgment is also accorded to Tuifaasisina Steve Rogers and Jamie Morrison for their
help and guidance during the course of the study and in finalizing this report.
Thanks are also extended to the following people for generously providing data and
information which enabled me to finalize this report.
- Mrs. Silia Uhi (Talamahu Market Limited)
- Mrs. Pelenatita Kama (MAFFF)
- Mr. Vaha’I Lui (MAFFF)
- Mr. Futa Lolo (MAFFF- OIC Utukalongalu Market)
- Vendors at Talamahu Market and Roadside Market.

4
Table of Contents Acknowledgements ....................................................................................................................................... 3
List of Abbreviations ..................................................................................................................................... 5
Executive Summary ....................................................................................................................................... 6
Introduction .................................................................................................................................................. 7
Purpose of the study ................................................................................................................................. 7
Policy Issues .............................................................................................................................................. 8
Recognized Seasonal Employer (RSE) schemes .................................................................................... 8
High Food Prices .................................................................................................................................... 8
Methodology ................................................................................................................................................. 9
Definitions ................................................................................................................................................. 9
Results and Discussion ................................................................................................................................ 10
Mapping the domestic fresh produce market channels ......................................................................... 10
The implication of Recognized Seasonal Employer Scheme on market supply ...................................... 14
High food prices and the promotion of off-season production. ............................................................. 15
Conclusion and Recommendations ............................................................................................................ 19
References .................................................................................................................................................. 21
Annex 1 ....................................................................................................................................................... 22

5
List of Abbreviations
CTU Common Trade Unit
FAO Food and Agriculture Organization
MAFFF Ministry of Agriculture and Food, Forests & Fisheries
RSES Recognized Seasonal Employer Scheme
TSTF Tonga’s Strategic Development Framework

6
Executive Summary Tonga has maintained over recent years a relatively strong and extensive market data collection
system relative to other countries in the region. However, even though this data has been
made available in the quarterly Domestic Market Reports, limited opportunity has been taken
to analyze the data in order to better inform policy decisions. Therefore, despite the high costs
involved in collecting this data its true value has not yet been fully realized through improved
policy decisions. An express aim of this study has been to demonstrate the policy value of
domestic market data and thus raise the profile and importance of maintaining appropriate
collection systems.
The study helps provide a clearer understanding of the structure and functionality of domestic markets including trade flows and prices, and evolution of the domestic market for the past few years to help determine the net benefit of any current or planned policy interventions aimed at improving market functionality.
The study also attempts to shed light on the possible impact of some specific government policies such as the Recognized Seasonal Employer (RSE) scheme and the MAFFF promotion of off-season crop production to help stabilize market prices and raise total farm output and incomes.
The study analysis demonstrates that the existing domestic market data set already provides a
strong basis for making improvements in the process of policy formation by providing evidence
that can be used to better inform policy decisions. But it also highlights that additional data will
often be needed to supplement the data in the domestic market survey to fully address specific
policy issues.
It concludes with some recommendations high amongst which is to direct efforts toward
ensuring better analysis and use of existing data as well as maintaining the integrity of the
current collection systems and extending them as deemed necessary

7
Introduction There are three main municipal markets in Tonga; Talamahu Market, Fanga’ihesi Market and
‘Utukalongalu Market (in Vavau). Historically, these were the main outlets for domestic
agricultural production in Tonga until the civil unrest in 2006 when traders also started
operating at roadside markets in Tongatapu. The emergence of these new channels has created
a number of challenges to data collection exercises and to the analysis and interpretation of the
data collected.
Tonga has done a commendable job of collecting basic data (volumes and prices) of traded
agricultural commodities on the domestic market. The Statistics and Economic Unit, which is
part of the Policy and Planning Section of the Corporate Services Division of the Ministry of
Agriculture and Food, Forests and Fisheries (MAFFF), has the main role to collect data, compile
data sets, analyze and publish this information. The Unit produces a quarterly market report –
the “Domestic Market Survey Report”. Initially, this report only sampled the central Talamahu
Market, but in 2009 the survey report was extended to include data on roadside markets in
Tongatapu and the Utukalongalu Market in Neiafu, Vava’u. There have also been aspirations to
extend this survey further and also include the Ha’apai market. Unfortunately, however, budget
constraints in 2011 have instead seen a cut back in the scope of data collection with the
removal of the Utukalongalu Market from the regular market survey.
The market report has information on: monthly and quarterly average weights in kg of common
trade units (CTU) of produce sold at the markets; monthly and total quarterly supplies of
agriculture produce in CTU and in tonnes; monthly and quarterly average prices of agricultural
produce sold in the market in price per CTU and in price per kg.
The first extended quarterly ‘Domestic Market Survey Report’ for October-December 2009
highlighted how significant trade is in agricultural products at ‘Utukalonga Market in Vavau and
on roadside markets in Tongatapu with around 15% of total food supply being traded at
‘Utukalongalu Market and 64% on the roadside markets during that period. But a clearer
understanding of the structure and functionality of domestic markets including trade flows and
prices, and evolution of the domestic market for the past few years is needed to help
determine the net benefit of any current or planned policy interventions aimed at improving
market functionality. Such data might also shed light on the possible impact of related policies
such as freight subsidies and the Recognized Seasonal Employer (RSE) scheme.
Purpose of the study
The main purpose of this study is to map the structure of the domestic fresh produce market
(including Talamahu Market, roadside markets and ‘Utukalongalu Market in Vava’u) in order to
identify key supply and functionality characteristics, including trade flows and prices, volumes
traded and prices received on different markets at different points in time, and the main actors
8
(buyers, traders, sellers) in these markets. Subsequently to then undertake an analysis of this
data to assess the potential impact of some key policy interventions on agricultural production
and marketing.
A primary objective of the study is to demonstrate to decision makers the potential value of
data/evidence (in this case market data) for improving policy decisions
Policy Issues
Recognized Seasonal Employer (RSE) schemes
Under the RSE scheme, workers from Tonga, Samoa, Tuvalu, Vanuatu and Solomon Islands go
to New Zealand for up to seven months out of eleven months in a year to work in the
horticulture and viticulture industries in planting, maintaining, harvesting, and packing crops.
The enormous interest in the RSE scheme is evidenced by about 20 percent of working-age men
becoming part of the work-ready pool, with over 1,971 workers in the first two years (2007-
2009) having had the opportunity to work in New Zealand. The process of village-level
nomination of workers and Government-orchestrated recruitment has resulted in the RSE
workers being largely agricultural workers with lower than average incomes and schooling.
Hence the scheme appears to have created new opportunities for migration for a large sector
of the population that previously had no available mechanism for working abroad. However, if
the absences of this labour pool impose either monetary or non-monetary costs on the family
and community members who are left behind, the net development benefit of seasonal
migration will be less than what it appears from remittances and repatriated foreign earnings
(Gibson and McKenzie, 2008). One potential cost is that there may be a reduction in labour
available for local food production and thus reduced local surpluses may raise food prices.
High Food Prices
During recent years, the steep increase in food and fuel prices has been one of the most
distinctive characteristics of the world economy. Prices peaked in 2008, but have remained high
and volatile since then. Tonga, which is heavily dependent on food and fuel imports, remains
particularly vulnerable to escalating global commodity prices. Higher food prices and a larger
import bill pose a major challenge, putting stress on limited foreign exchange availability and
spurring inflation. Poorer households with a larger share of food in their total expenditures
suffer the most from high food prices, due to the erosion of purchasing power, which has a
negative impact on food security, nutrition and access to school and health services.
Tonga’s local food production capacity, both for subsistence and for sale, offers potential
resilience in the face of high global food prices. However, local production for several key food
crops exhibits seasonal trends in production impacting availability and price stability. Indeed
price volatility, with high prices in off-seasons, constitutes an additional inflationary threat and

9
negative impact on household budgets. A key policy response of the MAFFF is to promote off
season production of crops for the domestic market. An analysis of seasonal trends in
production and prices for key local crops could help inform this policy.
Methodology The study approach involved an extensive review of existing secondary data sources
supplemented with surveys to collect primary market data and information on farmer
characteristics and market participation.
Secondary data were sourced from various reports prepared by the MAFFF, the Government
Statistic Department, Ministry of Labor and Commerce and the Talamahu Market Limited. A
principal source of data was the Domestic Market Survey Report prepared by MAFFF on a
quarterly basis.
Primary data were collected through interviews and sample surveys to determine; (i) farmer
characteristics and production trends, (ii) numbers of farmers supplying the various domestic
market outlets and (iii) the types, quantities and prices of crops that they supplied to the
market. Included in the survey interviews were:
• Sellers and re-sellers at Road Side Markets
• Sellers and re-sellers at Talamahu Market
• Workers at Talamahu and Utukalongalu Market.
Definitions
Semi-subsistence Farmers:
These farmers do not supply the market on a regular basis, but only supply when they have
surplus crops to their family needs. The main crops grown are roots and tubers, bananas and
other fruits. These farmers sell at all market outlets.
Semi-commercial Farmers:
Semi-commercial farmers supply the market with various types of root crops, vegetable crops
and fruits on a small scale, but cannot supply the domestic market consistently. These farmers
sell at all market outlets.
Commercial Farmers:
Generally larger farmers who plan production to supply the market consistently and on a
regular basis. Commercial farmers sell at all outlets in Tongatapu, but not at Utukalongalu
Market in Vavau.

10
Resellers:
These are traders who purchase produce directly from farmers or from the Talamahu Market
and resell this on the roadside market stalls. They mainly trade in vegetables, but also sell to a
lesser extent root/tuber crops and fruits.
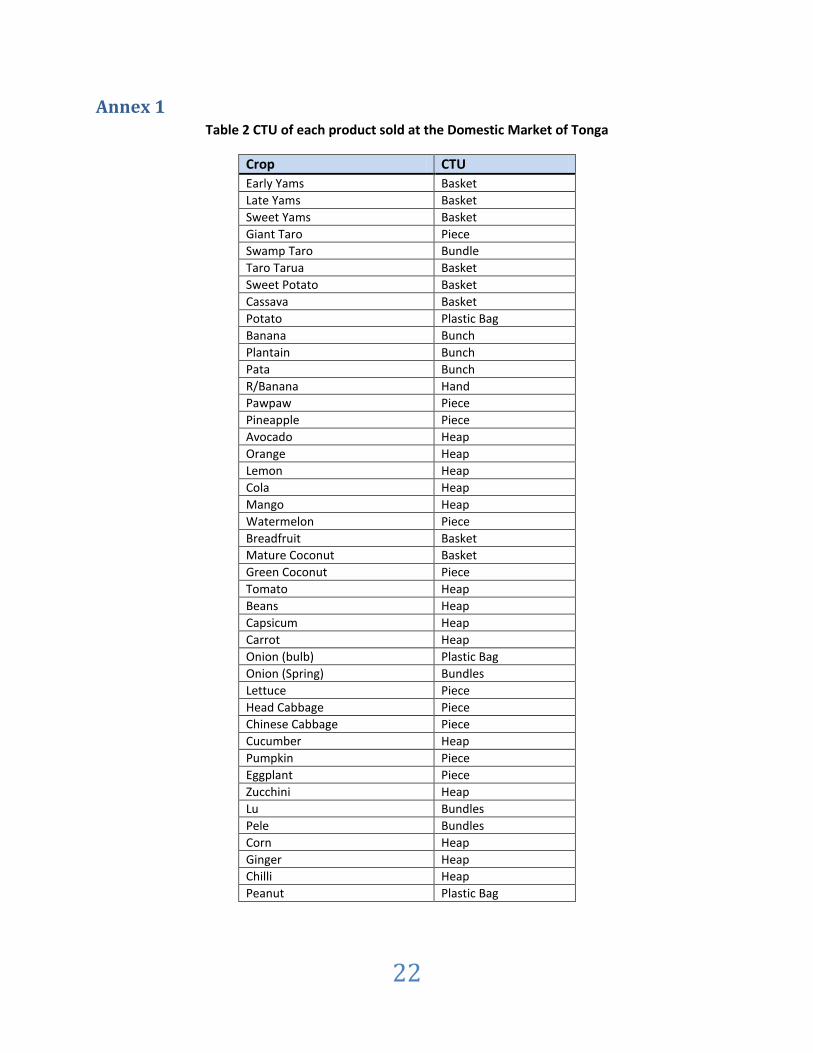
Common Trade Unit (CTU)
Fresh produce is packaged for sale in different ways. Root crops are most frequently sold by
basket or in bundles with several harvested plants tied together by their stems (e.g. Colocasia
taro). But larger crop varieties such as Giant taro are sold by piece. Green bananas are sold by
bunch, but ripe banana is sold by ‘hand’ or heap. Fruits are sold by pieces (e.g. pineapple,
pawpaw, and watermelon), heaps (e.g. mango, avocado and limes) or baskets (breadfruit and
mature coconut). Vegetables are sold in heaps (e.g. beans, capsicums and tomato) or bundles
(e.g. taro leaf, pele and spring onions) or pieces (e.g. head cabbage, lettuce and pumpkin). A full
list of CTU is included as Annex 1.
Results and Discussion
Mapping the domestic fresh produce market channels
Figure 1 below maps the fresh produce domestic market channels in 2010.There are three
major market outlets covered - Utukalongalu Municipal Market in Vava’u, Talamahu Municipal
Market in Nuku’alofa and the Roadside Markets in Tongatapu. Market outlets in other islands
of the Kingdom of Tonga, such as in Ha’apai, are not covered in this map as no formal data
collection is currently being undertaken at such sites.
Whilst the map gives an overall picture of supply and demand channels there are some limitations due to lack of information on the following supply channels:
There are no data available that could identify the amount of crops bought by resellers from Talamahu market and from farmers who sell at the road side market.
There are no data to identify the amount of crops coming from outer islands of Tonga to the Talamahu and other market outlets in Tongatapu.
At this point of time there is also no available data on demand from the different consumer groups.
In 2010 the total supply of fresh produce passing through the three markets amounted to 3,149
tonnes with the Talamahu market having at least 55.7% of the share, Roadside Markets having
36.5% and Utukalongalu Market only a 7.7% share. These numbers are significantly lower than
the peaks in 2009.
Interestingly, trade through the roadside markets which commenced in late 2006 following the
civil disturbances in Nukualofa, had gained considerable momentum in 2009. The first domestic

11
Suppliers
Semi-Commercial
Farmers
Semi-Subsistence
Farmers Individuals & Restaurants & Households. Hotels.
Customers
Consumer Market
Business Market
survey data on roadside markets was reported in the fourth quarter Domestic Market Survey
Report for 2009. At this time the Roadside Markets were recorded to have 64% of total market
share with Talahmahu having 21% share and Utukalogalu having 15% share. With stability
having returned to the capital Nukualofa a concerted government effort has been directed to
enforce Market Ordinance which prohibits roadside trading in downtown urban areas and trade
at the Talamahu Market may have been reinvigorated at the expense of the roadside markets.
Figure 8 below shows the change in volumes of root crops supplied through the two market
outlets during 2010. However, because of data limitations it is not possible to estimate how
much produce from Talamahu now recycles through the roadside markets.
Figure 1: Tonga Fresh Produce Domestic Market Map 2010
The data presented in this market map are taken from the 2010 Domestic Market Reports.
Utukalongalu Market
7.7 % Total Share
Talamahu Market
55.7% Total Share
Suppliers
Semi-Commercial
Farmers
Semi-Subsistence
Farmers
Commercial Farmers
Individuals Restaurants & Households Hotels
Customers
Consumer Market
Business Market
Reseller Markets
Vegetables Reselllers
Fruits Resellers
RootCrop Resellers
Road Side Market
36.5% Total Share
126 farmers
1243 farmers
244 tonnes
Volume?
1,755 tonnes
1,150 tonnes
109 farmers
Vol.?
Volume?

12
Figure 3. (below) Road Side market at Fanga selling a mixture of root crops, fruits and vegetables which are locally grown.
Figure 2. Road Side market(above) at Ha’ateiho selling a mixture of root crops, fruits and vegetables which are locally grown.
Figure 4. (left) Sellers and Customers at the Utukalongalu market.
Figure 5. (right) vendors at Utukalongalu market selling watermelons and leafy vegetables.
Figure 6. (left) The side View of the Talamahu market
building.
Figure 7. (right) Vendors at Talamahu Market .

13
The data in Figures 8 and 9 below clearly show the relative shift in supply from the roadside
markets to the Talamahu market in the latter half of the year. The data presented in Figure 8
show a steep decline in supply of total produce to the roadside markets from mid-year onwards
with a corresponding increase in supply to the Talamahu Market. Whilst there is a usual
seasonal decline in root crops supply towards the end of the year there is still evident a
significant shift in the relative proportions marketed through the two channels (Figure 9). This
data could be viewed as a positive indication of the implementation of the market regulations1
which limit trading through roadside outlets.
Source of data: MAFFF Domestic Market Reports
Source of data: MAFFF Domestic Market Reports
1 Market Act 1976: An Act to provide the establishment and regulation of markets
0
50
100
150
200
250
300
350
Jan Feb Mar Apr May Jun Jul Aug Sep Oct Nov Dec
Vo
lum
e to
nn
es
Figure 8: Total supply of agricultural crops at Talamahu and roadside market outlets in 2010
Talamahu
Roadside
0
2000
4000
6000
8000
10000
12000
14000
16000
18000
20000
jan Feb Mar Apr May Jun Jul Aug Sep Oct Nov Dec
Vo
lum
e kg
Figure 9: Total supply of root crops at Talamahu and roadside market outlets in 2010
Roadside
Talamahu

14
The implication of Recognized Seasonal Employer Scheme on market supply
RSE scheme initiated activity in 2007/2008 when individuals from various villages throughout
the main island groups of Tonga namely, Vava’u, Ha’apai, ‘Eua and Tongatapu were selected to
take part in the temporary migrant labor scheme in New Zealand.
Whilst studies associated with the RSE scheme have been conducted by various organizations,
such as the Waikato University and the World Bank, no local or overseas studies have really
addressed the implication of RSE scheme on the domestic agricultural markets in Tonga. In an
attempt to identify any gross impact of the temporary labour migration as measured through
total fresh produce supply on the Talamahu Market the supply data from year 2004 to 2010
have been reviewed (Figures 9 and 10).
The impact of the civil disturbances in Nukualofa in November 2006 is clearly evident in the
data with a dramatic fall in supply through the Talamahu Market. However, although supplies
remained somewhat depressed during 2007 to 2009, levels of supply had by 2010 again
reached pre-November 2006 levels. But at this level of data aggregation no impact of the RSE
scheme on supply to the market could be discerned.
Source of Data: MAFFF Domestic Market Reports
Volume data for 2011 is for the first quarter of the year only.
0.00
50.00
100.00
150.00
200.00
250.00
Jan Feb Mar Apr May Jun Jul Aug Sep Oct Nov Dec
Vo
lum
e to
nn
es
Figure 9:Total frsh produce supply at Talamahu Market 2004 - 2010
2004
2005
2006
2007
2008
2009
2006 2007 2008 2009 2010 2011
Total Volume 1609 1188 1118 1352 1746 389
Total number of Individual 0 0 283 866 739 1328
0
500
1000
1500
2000
Vo
lum
e to
nn
es
Figure 10: Talamahu Market Total Yearly Supply (tonnes) and numbers in the RSES

15
However, if numbers of seasonal workers travelling out of the Kingdom continues to rise, which
is possible with schemes currently established in both New Zealand and Australia and the
possibility also that the USA may introduce a similar scheme; a more disaggregated data
collection and focused analysis would be needed. This should include monitoring production
and marketing activities from districts where significant numbers of labourers are participating
in the scheme. It would also be interesting to compare impact on production of particular crops
which have high labour demands for planting or harvesting in seasons when labourers are
absent overseas.
High food prices and the promotion of off-season production.
Under the new Government’s National Strategic Development Framework, MAFFF is required
to improve the output of the Agricultural Sector which has prompted MAFFF to initiate the
promotion of off-season production. The promotion is mainly targeted at vegetable crops as
they are mostly seasonal in their production characteristics. However, there are a number of
root crops which are affected by seasonality factors, particularly early yams, and therefore have
potential to be included in the policy.
Figures 11-13 below present data on seasonal supply volumes and average monthly prices for
four important vegetables and early yams traded on the Talamahu Market. During the “off-
season”, approximating to the first half of the year for vegetables, volume supply is relatively
low whilst prices are high and vice versa for the latter half of the year. The reverse situation is
true for yams with the off-season being the latter half of the year.
Source of data: MAFFF Domestic Market Survey report 2010
Jan Feb Mar Apr May Jun Jul Aug Sep Oct Nov Dec
Total Volume
Tomato 4.73 3.66 0.91 0.95 2.01 4.27 5.26 8.52 9.65 9.41 11.39 10.89
Bean 0.36 0.18 0.13 0.37 0.52 0.48 0.59 0.5 0.93 0.59 0.92 0.7
Capsicum 0.93 0.81 0.45 0.85 0.87 1.18 2.13 1.99 3.34 4.38 4.34 4.25
Carrot 1.58 1.07 0.77 1.01 1.72 3.41 3.33 3.13 5.59 3.33 3.93 4.05
0
2
4
6
8
10
12
Vo
lum
e t
on
ne
s
Figure 11: Monthly supply volumes for four important traded vegetables in the Talahamu Domestic Market

16
Source of data: MAFFF Domestic Market Survey Report 2010
Source of data: MAFFF Domestic Market Survey Report 2010
A closer examination and analysis of monthly price data for early yams and the four traded
vegetables, tomato, bean capsicum and carrot over the last three years reveals some
interesting findings (Tables 1.1 & 1.2)
Comparing average yearly price inflation (year-on-year) against within-year price inflation due
to seasonality, a stark contrast is seen for all food crops reviewed. Within-year price inflation
due to seasonality can exceed annual year-on-year inflation by several orders of magnitude.
Indeed, for some crops in some years, year-on-year prices have declined, whilst in contrast
within-year price volatility due to seasonal effects has show high price variation between
lowest and highest price levels. In the case of tomatoes, the price difference can be up to
fourteen times greater in the offseason compared to the high season (Table 1.1)!
Jan Feb Mar Apr May Jun Jul Aug Sep Oct Nov Dec
Tomato 0.95 1.22 6.11 13.55 7 3.18 2.27 1.47 1.5 1.38 1.13 0.89
Bean 4.82 7.66 11.83 7.1 4.38 6 7.12 5.85 4.6 4.72 3.22 3.43
Capsicum 4.66 3.78 6.98 6.99 12.25 14.04 10.27 7.5 7.13 6.02 3.45 3.31
Carrot 1.86 1.65 2.79 5.39 7.19 4.46 3.73 3.46 3.44 4.87 3.65 4.55
0 2 4 6 8
10 12 14 16
Ave
rage
Pri
ce/k
gs
Figure 12. Average monthly prices for four important traded vegetables in the Talamahu Domestic Market
Jan Feb Mar Apr May Jun Jul Aug Sep Oct Nov Dec
Price (TOP$) E/Yam 3.91 3.31 2.81 2.72 2.73 3.63 4.51 4.36 5.2 5.17 4.73 3.73
Volume (Tons) E/Yam 3.59 2.01 5.98 5.15 7.09 4.94 2.62 1.79 1.77 1.44 1.36 2.48
0
1
2
3
4
5
6
7
8
Pri
ce (
TOP
$)/
kg
Figure 13: Comparison of Price and Volume of Early Yams

17
Table 1.1 - Seasonal variation in average monthly price (TOP$/kg) for selected agricultural products over the last three years
Jan Feb Mar Apr May Jun Jul Aug Sep Oct Nov Dec
E/Yams(2008) 3.23 2.12 2.02 1.42 2.94 2.61 3.62 3.2 3.94 3.25 2.6 2.95
E/Yams(2009) 2.89 2.67 2.27 2.33 2.14 2.65 3.56 3.56 3.88 3.88 4.14 3.99
E/Yams(2010) 3.91 3.31 2.81 2.72 2.73 3.63 4.51 4.85 5.20 5.17 4.73 3.73
Tomato2008 1.7 3.13 8.28 9.3 5.13 3.93 3.52 3.17 1.6 1.02 1.13 1.5
tomato2009 4.73 6.73 11.97 13.13 10.51 3.76 2.32 1.97 2.1 1.65 1.2 0.84
tomato2010 0.95 1.22 6.11 13.55 7 3.18 2.27 1.47 1.5 1.38 1.13 0.89
Beans2008 6.08 9.06 7.72 11.11 6.46 5.84 5.8 10 4.92 4.96 5.15 7.35
Beans2009 10.18 11.36 10.83 12.05 7.92 4.99 3.8 7.52 5.56 4.39 2.79 5.08
Beans2010 4.82 7.66 11.83 7.1 4.38 6 7.12 5.85 4.6 4.72 3.22 3.43
Capsicum2008 2.50 2.85 3 15.79 8.67 10.13 9.68 7.73 7.87 5.65 5.05 10
Capsicum2009 11.21 15.12 12.49 16.61 18.15 10.61 8.57 6.5 6.54 6.67 5.26 6.82
Capsicum2010 4.66 3.78 6.98 6.99 12.25 14.04 10.27 7.5 7.13 6.02 3.45 3.31
Carrot2008 2.96 6.58 8.96 8.06 7.2 7.51 6.74 3.37 3.52 1.74 1.53 2.2
Carrot2009 3.71 4.83 7.01 11.91 7.73 5.19 3.69 2.9 2.27 2.04 2.04 2.22
Carrot2010 1.86 1.65 2.79 5.39 7.19 4.46 3.73 3.46 3.44 4.87 3.65 4.55
Lowest seasonal average monthly prices are highlighted yellow and highest prices are highlighted green
Table 1.2: Yearly average price inflation compared to seasonal price inflation
Crop Year Year Average Yearly price inflation seasonal price inflation
E/Yams 2008 2.83 177%
2009 3.16 11.60% 93.50%
2010 3.94 24.60% 91%
Tomato 2008 3.62 803%
2009 5.08 41% 1463%
2010 3.39 -33% 1422%
Beans 2008 7.04 125%
2009 7.21 2.40% 332%
2010 5.89 -18.30% 267%
Capsicum 2008 7.41 531%
2009 10.38 40% 245%
2010 7.20 -30.6% 270%
Carrot 2008 5.03 486%
2009 4.63 -7.90% 484%
2010 3.92 -15.3% 336%

18
These findings have profound implications for policy and underline the importance of the off-
season production policy to tackle the extreme seasonal volatility in supply and consequently
price of key food crops. Undertaking research to explore ways to stabilize year-round
production should be given the highest priority. Possible fertile areas for investigation could be:
Screening of different varieties for off-season production
Use of irrigation in the dry season and plastic cover in the wet periods
Soil amendments and mulching
Hydroponics.
Jan Feb Mar Apr May Jun Jul Aug Sep Oct Nov Dec
Tomato 4505 4478 5562 12814 14052 13609 11954 12540 14495 12944 12907 9693
Bean 1731 1341 1596 2615 2279 2862 4219 2940 4281 2764 2958 2387
Carrot 2943 1766 2145 5423 12354 15234 12414 10845 19227 16209 14348 18425
Capsicum 4317 3060 3146 5933 10701 16554 21886 14898 23803 26316 14983 14069
E/Yam 14014 6641 16835 13988 19329 17947 11820 7814 9215 7459 6436 9247
0 5000
10000 15000 20000 25000 30000
Tota
l Val
ue
(TO
P$
)
Figure 14. Comparison of total value(TOP$) per month from various crops supplied to the Talamahu Market.
Tomato 22%
Bean 5%
Carrot 22%
Capsicum 27%
E/Yam 24%
Figure15: Relative shares in total value of key crops supplied on the Talamahu Market in 2010

19
Figure 14 compares the total value (TOP$/month) for the five crops discussed, and Figure 15
depicts the relative shares in total annual value of these crops supplied to the Talamahu Market
in 2010. Capsicum, with an annual value of supply of TOP$159,666 commands the largest share
in value (27%) followed by E/Yam with an annual value of TOP$140,745 (24%). Next and almost
equal, come carrots at an annual value of TOP$131,325 and tomatoes at TOP$129,553; and last
with only a small 5% share is beans at an annual value of TOP$31,910.
Clearly the four leading crops – capsicum, early yam, carrot and tomatoes are ones to prioritize under the off-season promotion policy. But tomatoes with its extreme within year price volatility could offer distinct opportunity for significant gains through extending the off-season production.
Conclusion and Recommendations Tonga has maintained over recent years a relatively strong and extensive market data collection
system relative to other countries in the region. However, even though this data has been
made available in the quarterly Domestic Market Reports, limited opportunity has been taken
to analyze the data in order to better inform policy decisions. Therefore, despite the high costs
involved in collecting this data its true value has not yet been fully realized through improved
policy decisions. An express aim of this study has been to demonstrate the policy value of
domestic market data and thus raise the profile and importance of maintaining appropriate
collection systems.
The Domestic Market Survey report has been used to investigate two policy issues, the
implications of the RSE scheme for domestic agriculture production and the value of promoting
off-season production of selected food crops.
Whilst no apparent impact of the RSE could be detected from the total supply of fresh produce
to the Talamahu Market, the analysis was somewhat confounded by the negative impacts on
supply experienced following the civil disturbance in November 2006 which disrupted trade in
central Nukualofa. Therefore it is recommended that a continued effort is made to monitor any
possible impact on domestic production if the labour mobility programs involve increasing
numbers of agricultural labourers. Furthermore, it is recommended that specific surveys are
designed to focus data collection on districts from which the maximum numbers in the RSE
program are drawn.
By contrast, the review of domestic market data on seasonality and prices reveals important
policy insights. Significant within-year fluctuations in the prices of a number of vegetable
products are detected and this data can be used to provide an indication of the potential
returns to extending the production seasons of individual crop types. Considering the potential
benefits in terms of improved farm incomes, more stable consumer prices, increased

20
contribution of the agriculture sector to the economy and enhanced food security it is strongly
recommended that the promotion of off-season crops is accorded high priority and appropriate
research and extension capacity and resources are directed to achieving this policy goal.
Whilst additional data will often be needed to supplement the data in the domestic market
survey when attempting to address specific policy issues, the existing domestic market data set
already provides a strong basis for making improvements in an evidence-based policy process.
It is therefore recommended that effort is directed toward ensuring better analysis and use of
the existing data source as well as maintaining the integrity of the current collection systems
and extending them as deemed necessary.

21
References Bedford, C., Bedford, R. and E Ho (2009) The Social Impacts of Short-term Migration for
Employment: A Review of Recent Literature, Research report for NZAID August 2009,
Population Studies Centre, University of Waikato, Hamilton, New Zealand.
Gibson, J. and D. McKenzie (2008) How Pro-Poor is the Selection of Seasonal Migrant Workers
from Tonga under New Zealand’s Recognized Seasonal Employer (RSE) Program? Department
of Economics Working Paper in Economics 8/08, June 2008, University of Waikato, Hamilton,
New Zealand.
Government of the Kingdom of Tonga (2010) Ministry of Agriculture and Food, Forests and
Fisheries, Talamahu Market Report, Qtr 1, 2, 3, 4, 2010.
Government of the Kingdom of Tonga (2006) Ministry of Finance, and Government Statistic
Department, Tonga Population Census Report, 2006.
Government of the Kingdom of Tonga (2011) Ministry of Labour and Commerce, Report on the
progress of Seasonal Labour Scheme.
22
Annex 1 Table 2 CTU of each product sold at the Domestic Market of Tonga
Crop CTU
Early Yams Basket
Late Yams Basket
Sweet Yams Basket
Giant Taro Piece
Swamp Taro Bundle
Taro Tarua Basket
Sweet Potato Basket
Cassava Basket
Potato Plastic Bag
Banana Bunch
Plantain Bunch
Pata Bunch
R/Banana Hand
Pawpaw Piece
Pineapple Piece
Avocado Heap
Orange Heap
Lemon Heap
Cola Heap
Mango Heap
Watermelon Piece
Breadfruit Basket
Mature Coconut Basket
Green Coconut Piece
Tomato Heap
Beans Heap
Capsicum Heap
Carrot Heap
Onion (bulb) Plastic Bag
Onion (Spring) Bundles
Lettuce Piece
Head Cabbage Piece
Chinese Cabbage Piece
Cucumber Heap
Pumpkin Piece
Eggplant Piece
Zucchini Heap
Lu Bundles
Pele Bundles
Corn Heap
Ginger Heap
Chilli Heap
Peanut Plastic Bag