Embed Size (px)
Citation preview
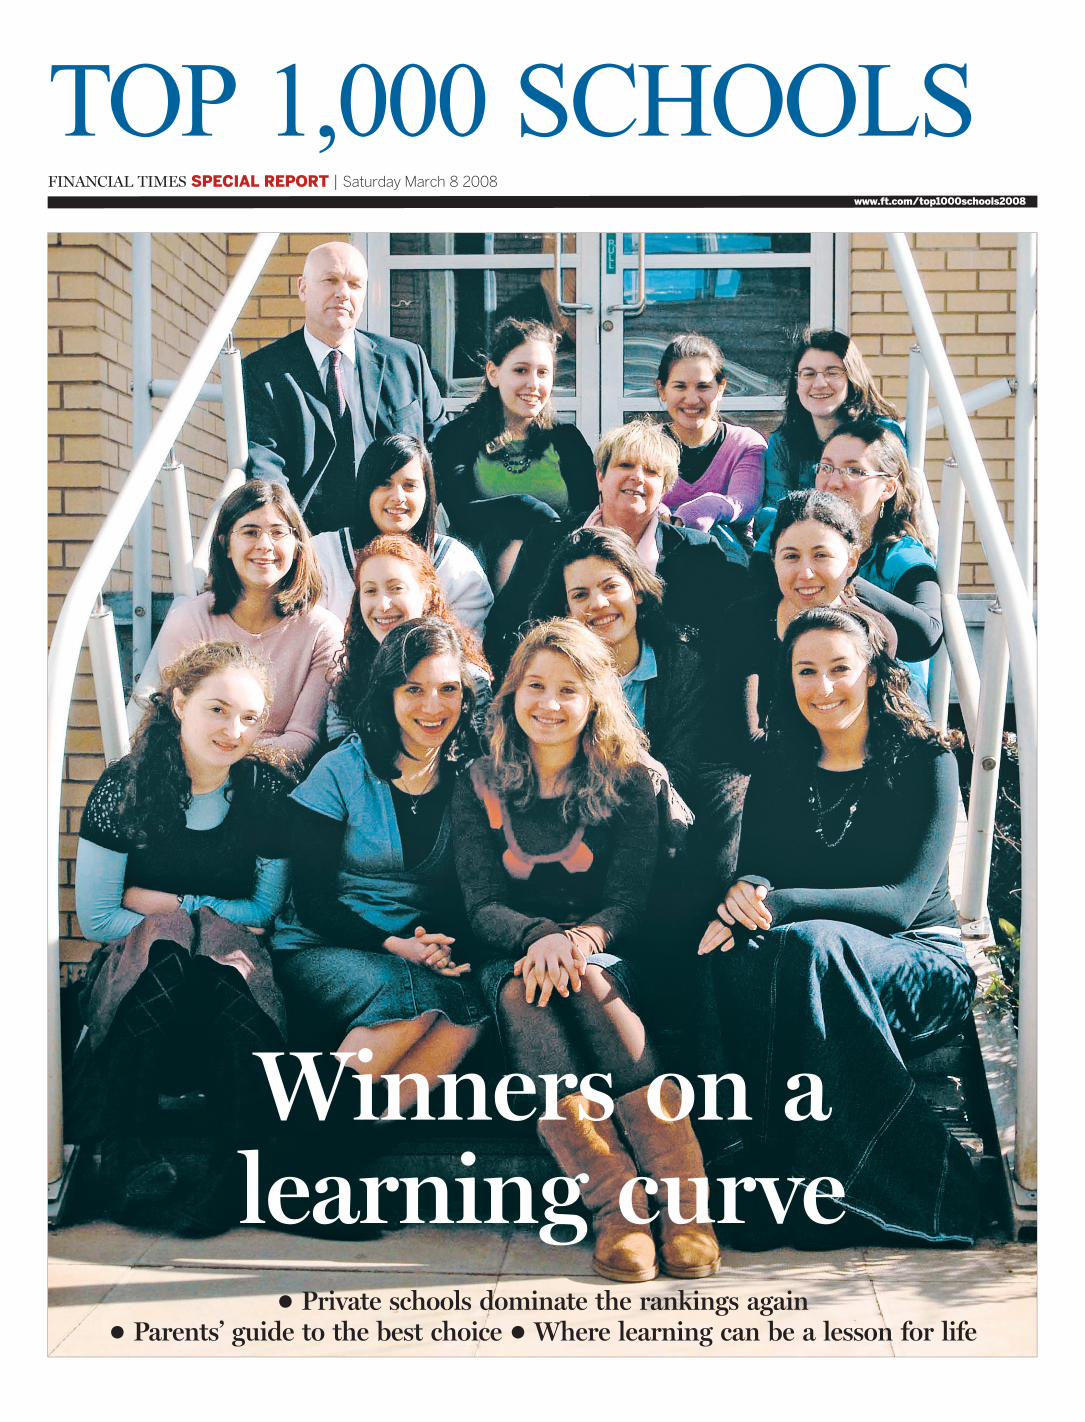
TOP 1,000 SCHOOLSFINANCIAL TIMES SPECIAL REPORT | Saturday March 8 2008
Winners on alearning curve
● Private schools dominate the rankings again● Parents’ guide to the best choice ● Where learning can be a lesson for life
www.ft.com/top1000schools2008
2 FINANCIAL TIMES SATURDAY MARCH 8 2008
Top 1,000 Schools
ContributorsDavid TurnerEducation CorrespondentSimon BriscoeStatistics EditorMiranda Green, FrancisBeckett, Liz Lightfoot,Huw RichardsFT ContributorsLisa FreedmanContributing editor,TheGood Schools GuideAndrew BaxterCommissioning EditorSteven BirdDesignerKatie CarniePicture Editor
For advertising, contact:Maria Tallon on:
+44 (0)20 7873 4906,Fax: +44 (0)20 78733064, email:[email protected]
Department for Children,Schools and Familiesdata supplied byRalph Lucas of TheGood Schools Guide(www.goodschoolsguide.co.uk)Tables compiled byJudith Pizer of Jeff HeadAssociates (Amersham)
Page one picture (by Daniel Lynch):sixthform girls at Hasmonean HighSchool in Hendon, England’shighestperforming nongrammarstate school, with Beverley Perin,head of the girls’ school and DavidFuller, executive head teacher ofboth the boys’ and girls’ schools
In This Issue
It’s not all about learningCRITERIA FOR SUCCESS In the pursuit ofbetter academic performance, have schoolslost sight of the need to produce happypupils, asks Miranda Green Page 9
Location, location, education...COSTLY DILEMMA Many families are tornbetween spending a small fortune to livenear the best state schools or paying privateschool fees, writes Liz Lightfoot Pages 45
Diploma fans say breadth is bestINTERNATIONAL BACCALAUREATE Supportersof the IB believe it is better than Alevels atdividing the very brainy from the amazinglybrainy, writes Francis Beckett Page 6
Hit rate is no flash in the panGETTING IN Just 30 schools supply a quarterof successful Oxbridge applicants.Lisa Freedman looks at the variety of factorsthat help them achieve this Pages 89
The FT Top 1,000MAIN LISTING Arranged by county, with aguide by Simon Briscoe Pages 1015
ON THE WEB An interactive version of the top100 schools in the ranking, and more tables,including the top grammar and statenongrammar schools and all the risers andfallers www.ft.com/top1000schools2008
Hard truth about ‘soft options’NEWER SUBJECTS The debate over whetherone Alevel is worth as much as another isjoined by Huw Richards Page 16
Class actionthat gets results
Once again privateschools dominatethe FinancialTimes rankings of
the top-performing 1,000institutions by A-levelresults, in a relentlesslyreproduced pattern generallyrelieved only by a smatteringof grammar schools and com-prehensives in middle-classareas. They account for nineof the top 10, and 17 of thetop 20.
Another interesting pat-tern is that 17 of the top 20are single-sex schools. Thisadds weight to recentlyresurgent arguments thatboys and girls should betaught separately becausethey learn in different ways –a point underlined by DavidFuller, head of HasmoneanHigh School, England’s best-performing non-state gram-mar, in a profile in thisreport. But there are, ofcourse, exceptions – most
notably of all Westminster,which takes bright girls inthe sixth form who help it tothe very top of the league.
Given the dominance ofprivate schools, the biggestquestion therefore is, why?How have they managed tomaintain their hold as thepurveyors of the best aca-demic results, and the insti-tutions that send dispropor-tionately high numbers ofpupils to Russell Group uni-versities?
Most independent schoolheads privately say the sec-tor has done so by adopting amuch more ruthless attitudethan a generation ago, toboth staff and pupils. Thisexplains why their share ofCambridge University under-graduate admissions hasrisen from a 1980 nadir of 31per cent to a gently undulat-ing rate of about 45 per centin the 2000s.
The head of one high-per-forming private school inYorkshire mentions a discus-sion with other heads in the1980s. It concerned how totreat coasting teachers who,not long before retirement,were not striving as much asthey should for their pupils.A head at a school both now
and then regarded as highlyacademic said the schoolshould accept such behav-iour as a fact of life. Butnowadays the teacher wouldhave been told to shape up atthe very least, and quite pos-sibly be sacked, concludesthe Yorkshire head.
Schools may treat theteachers much more harshly,but the pupils sometimeshave a worse time still.
Observers of the privateschool system note thatselection by academic ability,rather than long-standingfamily links, has becomemuch more the rule at thoseprivate schools that are over-subscribed.
There is even a series ofpossibly apocryphal urbanmyths doing the roundsamong private school heads,of alleged dirty tricks to pushschools up the tables. But nonames are mentioned, andsuch tales are unprovable.These include the claim thatpupils likely to earn poorA-levels continue to betaught by the school, buttake their exams at a differ-ent centre to avoid depress-ing the school’s statisticalaverage. Even if the storiesare untrue, the telling of
them shows the pressureheads feel under.
Moreover, the heads of pri-vate schools of even mid-dling achievement admitthey are stricter than beforeat weeding out children whoare not likely to thrive atsixth form, even though itmeans foregoing school fees.
Schools with a gentlerapproach towards pupils andstaff suffer accordingly in theleague tables.
It is a system that mostheads bemoan, but in whichthey are trapped and thatthey are propping up.
But in one importantrespect it works for the chil-dren. Research led by Fran-cis Green of Kent Universityidentified a clear earningspremium among privateschool pupils born in 1970,after stripping out socio-eco-nomic factors. The premiumof 17 per cent for men and 16per cent for women was sig-nificantly higher than forchildren born in 1958 andeducated at private school,says Prof Green – particu-larly for women. He says thisreflects better exam results,rather than an old boy or oldgirl network.
He calculates that private
The rankings areled by the usualsuspects, saysDavid Turner, buthow do they do it?
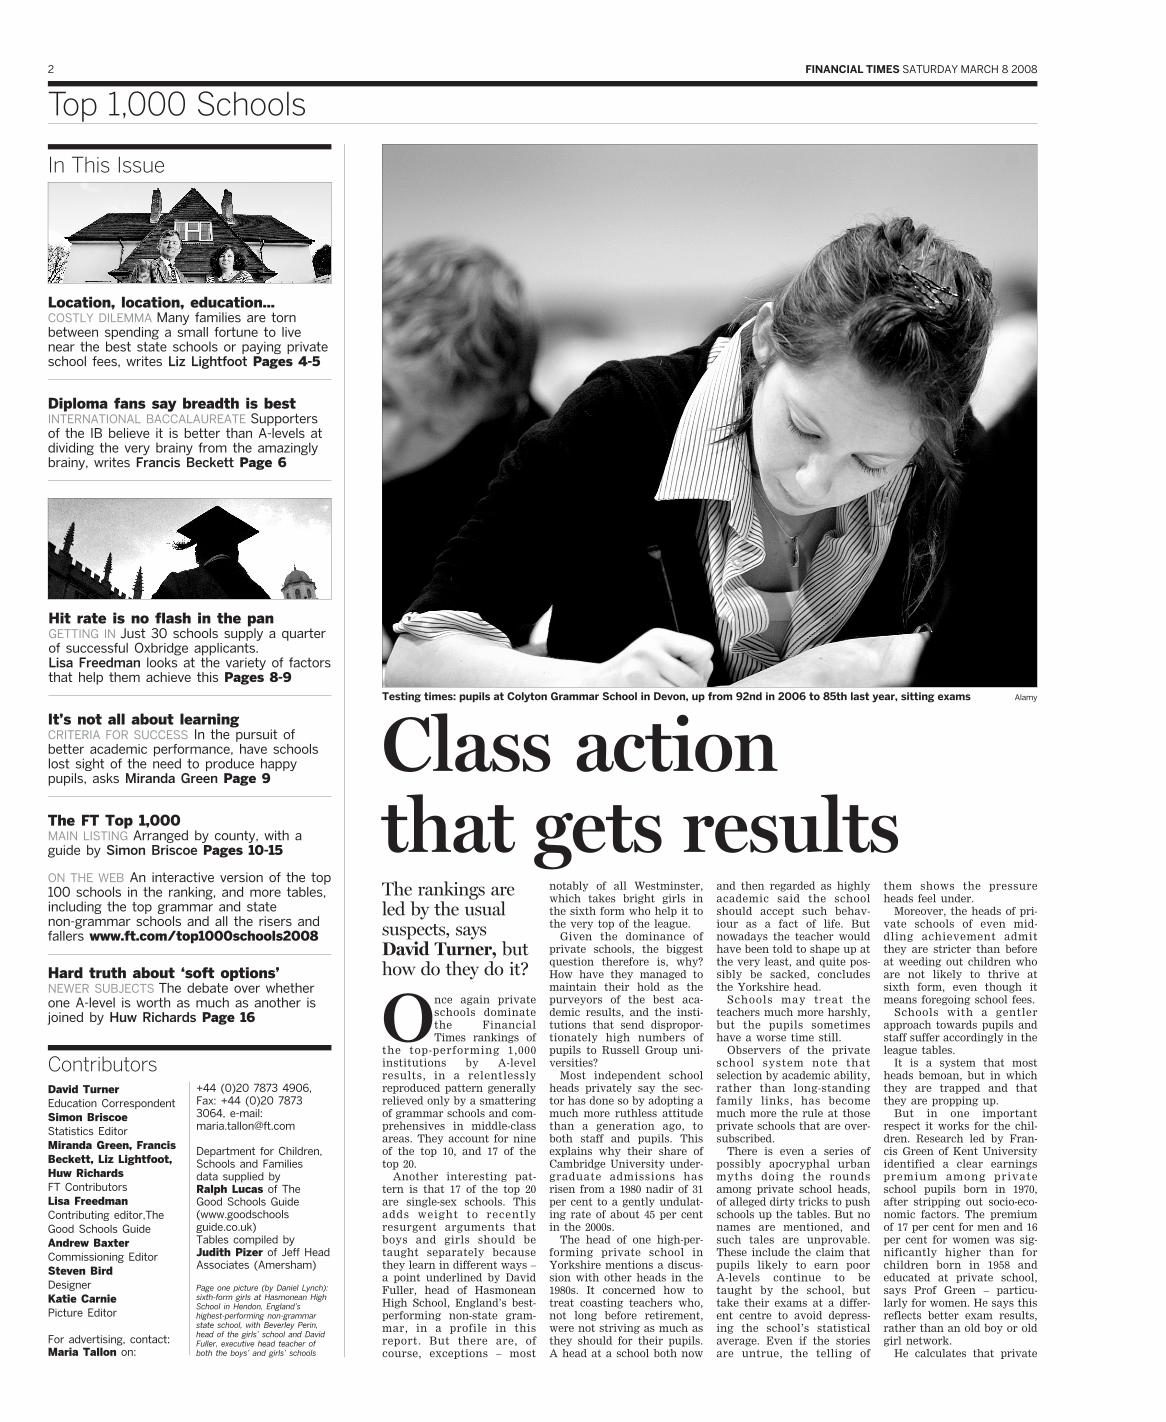
Testing times: pupils at Colyton Grammar School in Devon, up from 92nd in 2006 to 85th last year, sitting exams Alamy
FINANCIAL TIMES SATURDAY MARCH 8 2008 3
Top 1,000 Schoolsschool education produces a7 per cent annual return inreal terms, although heemphasises the figure isapproximate. This means if aparent spends £100,000 on achild’s education, the childwill earn an extra £7,000 eachyear of working life, afterstripping out inflation.
At the Nuffield Foundationseminar where Prof Greenoutlined his findings, onehead of a leading girls’ pri-vate school firmly rejected asuggestion from the audiencethat it might be better tosend the child to stateschool, and use the moneysaved to build a nest egg forthe child. Private schools,she explained, provided morethan an earnings premiumthrough academic results –they imbued character.
The notion of characterwas widely talked about inearlier days, when privateschools saw their role as pro-ducing courageous Christiangentlemen with the moralstrength to run the Empire.It has made a comeback.
One analyst of private
Notice to advertisersCalls to the Financial Times advertising department may be monitored.Acceptance of any advertisement for publication will be subject to the then current termsand conditions of insertion of advertisements in FT publications. A copy of the terms andconditions of insertion of advertisements in FT publications can be obtained from +44 (0)20 7873 3000, or viewed at www.FT.com/advertising
schools sees individualschools’ talk of instillingcharacter as clever nichemarketing, by institutionssuch as Wellington Collegeand Bedales that do not haveresults near the top of theleague and need somethingelse distinctive – though Wel-lington has shot up 71 placesto a fairly impressive 134th,
and Bedales comes a respect-able 414th.
Nowadays some privateschool heads talk about theimperative to produce“happy” pupils – a notionirrelevant and rather inde-cent in the minds of Victo-rian heads. Anthony Seldon,master of Wellington, saysboth improving academicresults and an emphasis on
Schools with agentler approachtowards pupils andstaff suffer inthe league tables
well-being have increasedparent demand for places atthe Berkshire school.
It is easy to be too cynicalabout the idea. A termtimestroll round Bedales cer-tainly leaves the impressionof a happy place, with a dis-tinctive clientele of parentsfrom the creative professionswho want a school that offersan alternative to the tradi-tional strict boarding schooleducation. Indeed, Bedaleswas set up in 1893 as a delib-erate alternative to standardprivate school education.
In Wellington’s case, theco-educational school’s imagehas changed considerablyfrom the days when it wasset up in 1853 to educate theorphan sons of army officers.But so too has the image ofprivate schools in general.The sector has a tradition ofquestioning its raison d’etre,and then adapting.
Wellington has, histori-cally, been no exception.After the 1940 rout of theBritish army in France, TCWorsley, a Wellington mas-ter, lamented: “If the public
Top 20 schools
FT R
ank
07
FT R
ank
06
Scho
ol
Tow
n
% o
f stu
dents
a
chie
vin
g a
t le
ast A
AB
in
core
su
bje
cts
1 1 Westminster School Westminster 892 2 Winchester College Winchester 723 5 Eton College Windsor 784 4 St Paul’s Girls’ School Hammersmith 855 9 Colchester Royal Gram Sch Colchester 696 8 St Paul’s School Barnes 817 7 North London Collegiate S (IB) Edgware 927 25 Radley College Abingdon 599 6 Wycombe Abbey School High Wycombe 79
10 11 James Allen’s Girls’ School Dulwich 7511 3 Manchester Grammar Sch Manchester 7011 19 Badminton School Bristol 6813 14 Withington Girls’ School Manchester 7914 14 Perse School for Girls Cambridge 7215 26 Lycee Francais Ch de G (BS) Kensington 5916 31 City of London School City 6117 14 Cheltenham Ladies’ Col Cheltenham 6718 10 Magdalen College School Oxford 6319 11 Queen Elizabeth’s School Barnet 6920 27 King Edward VI Grammar S Chelmsford 63
Source: FT. Rankings based on performance in core A levels - see tables on pages 10-15
schools are national assetsbecause of their leadershiptraining qualities, what arewe to think of those qualitieswhen we survey the messinto which their leadershiphas brought us?”
Private schools, it seems,are again showing their gen-ius for reinventing them-selves to fit the new demandsof society.
What of the grammarschools and other institu-tions that appear sometimesin rankings otherwise domi-nated by private schools?
They often face the sameaccusations of hothousing ashigh-performing privateschools.
But the head of a girls’school, which is one of thehighest-achieving grammars,turns the argument on itshead. She says teachers aremore likely to tell their self-driven pupils to ease up alittle, rather than to workthemselves harder. The riskof self-induced burn-out isvery real, she concludes.
Such is the tough world ofEngland’s top schools.
4 FINANCIAL TIMES SATURDAY MARCH 8 2008
TOP 500 INDEPENDENTSCHOOLSFINANCIAL TIMES SPECIAL REPORTS
13th September
For advertising details, please contact:
Michael West in LondonTel: +44 (0)20 7873 4907Fax: +44 (0)20 7873 3098Email: [email protected]
Please visit our website for: Advertising with FTand the online mediakit at www.ft.com/advertising
Back issues of printed Survey and FT Reports can be obtained from: Historic Newspapers,Signature Online Limited. No 1 Waterside Station Road, Harpenden, Herts, AL5 4US; Tel no: 0870 165 1470; Fax no: 01852 469 248; or email: [email protected]
Top 1,000 Schools
Location, location, education...
It is home to theNational Lottery, GeriHalliwell and the Hor-nets but now Watford
has a new claim to fame. Thetown of just 79,000 people inHertfordshire is the locationthat sired three of England’stop 10 comprehensives.
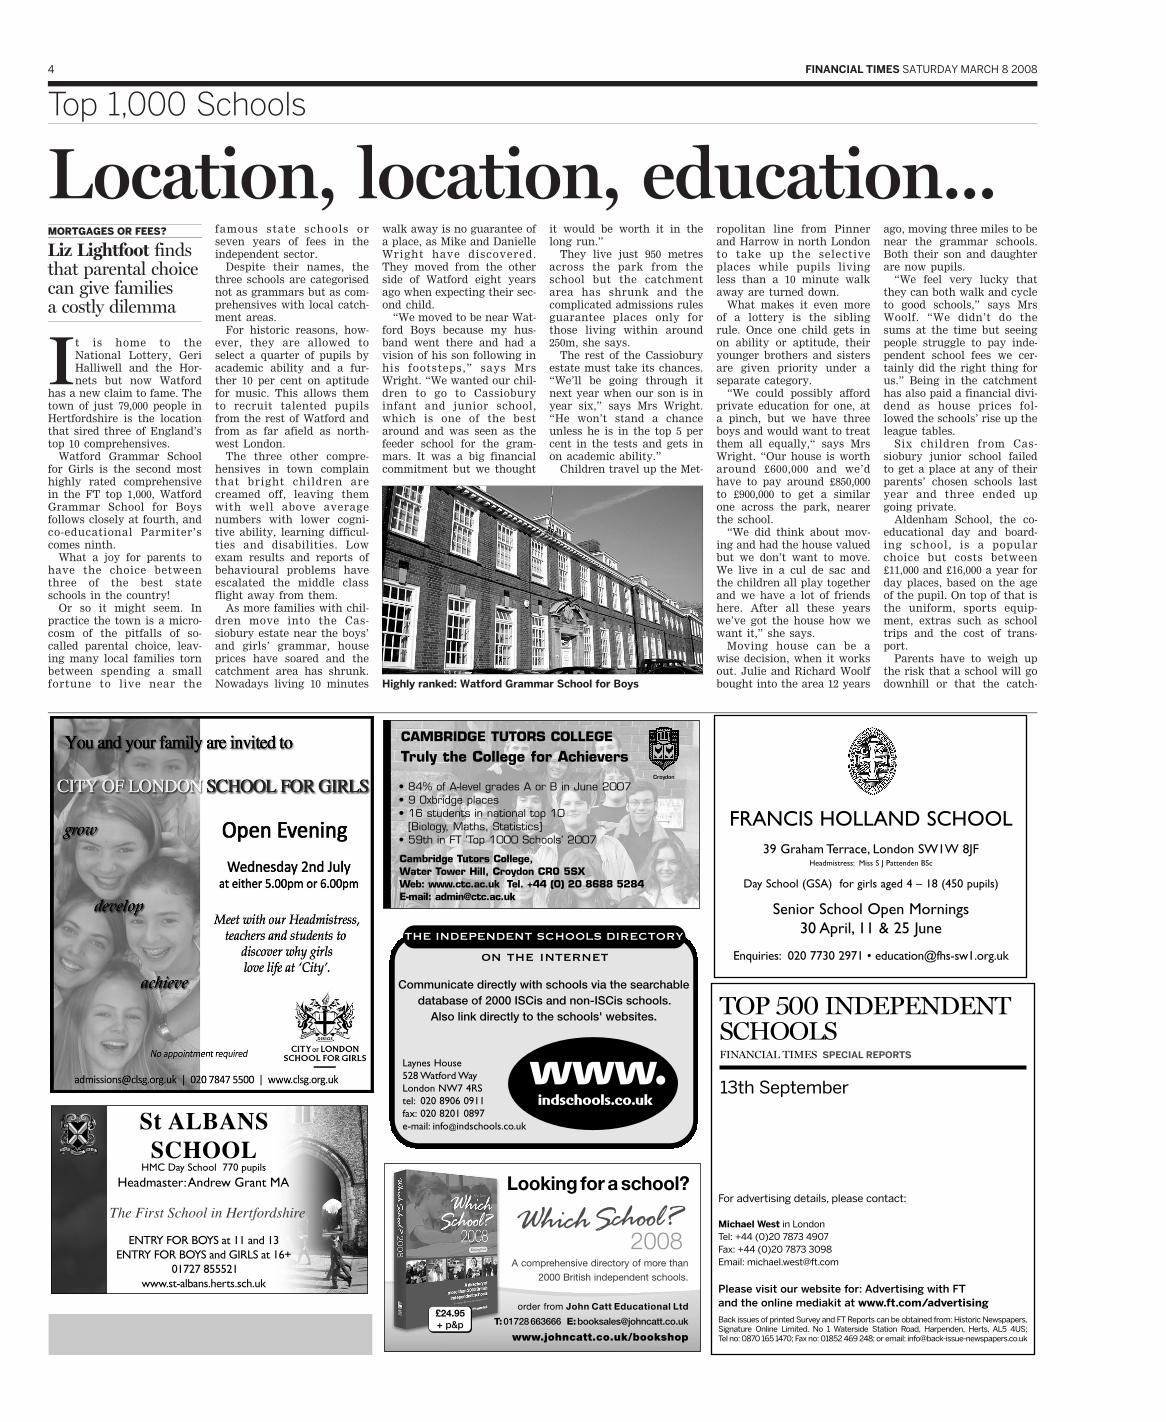
Watford Grammar Schoolfor Girls is the second mosthighly rated comprehensivein the FT top 1,000, WatfordGrammar School for Boysfollows closely at fourth, andco-educational Parmiter’scomes ninth.
What a joy for parents tohave the choice betweenthree of the best stateschools in the country!
Or so it might seem. Inpractice the town is a micro-cosm of the pitfalls of so-called parental choice, leav-ing many local families tornbetween spending a smallfortune to live near the
famous state schools orseven years of fees in theindependent sector.
Despite their names, thethree schools are categorisednot as grammars but as com-prehensives with local catch-ment areas.
For historic reasons, how-ever, they are allowed toselect a quarter of pupils byacademic ability and a fur-ther 10 per cent on aptitudefor music. This allows themto recruit talented pupilsfrom the rest of Watford andfrom as far afield as north-west London.
The three other compre-hensives in town complainthat bright children arecreamed off, leaving themwith well above averagenumbers with lower cogni-tive ability, learning difficul-ties and disabilities. Lowexam results and reports ofbehavioural problems haveescalated the middle classflight away from them.
As more families with chil-dren move into the Cas-siobury estate near the boys’and girls’ grammar, houseprices have soared and thecatchment area has shrunk.Nowadays living 10 minutes
walk away is no guarantee ofa place, as Mike and DanielleWright have discovered.They moved from the otherside of Watford eight yearsago when expecting their sec-ond child.
“We moved to be near Wat-ford Boys because my hus-band went there and had avision of his son following inhis footsteps,” says MrsWright. “We wanted our chil-dren to go to Cassioburyinfant and junior school,which is one of the bestaround and was seen as thefeeder school for the gram-mars. It was a big financialcommitment but we thought
it would be worth it in thelong run.”
They live just 950 metresacross the park from theschool but the catchmentarea has shrunk and thecomplicated admissions rulesguarantee places only forthose living within around250m, she says.
The rest of the Cassioburyestate must take its chances.“We’ll be going through itnext year when our son is inyear six,” says Mrs Wright.“He won’t stand a chanceunless he is in the top 5 percent in the tests and gets inon academic ability.”
Children travel up the Met-
ropolitan line from Pinnerand Harrow in north Londonto take up the selectiveplaces while pupils livingless than a 10 minute walkaway are turned down.
What makes it even moreof a lottery is the siblingrule. Once one child gets inon ability or aptitude, theiryounger brothers and sistersare given priority under aseparate category.
“We could possibly affordprivate education for one, ata pinch, but we have threeboys and would want to treatthem all equally,“ says MrsWright. “Our house is wortharound £600,000 and we’dhave to pay around £850,000to £900,000 to get a similarone across the park, nearerthe school.
“We did think about mov-ing and had the house valuedbut we don’t want to move.We live in a cul de sac andthe children all play togetherand we have a lot of friendshere. After all these yearswe’ve got the house how wewant it,” she says.
Moving house can be awise decision, when it worksout. Julie and Richard Woolfbought into the area 12 years
ago, moving three miles to benear the grammar schools.Both their son and daughterare now pupils.
“We feel very lucky thatthey can both walk and cycleto good schools,” says MrsWoolf. “We didn’t do thesums at the time but seeingpeople struggle to pay inde-pendent school fees we cer-tainly did the right thing forus.” Being in the catchmenthas also paid a financial divi-dend as house prices fol-lowed the schools’ rise up theleague tables.
Six children from Cas-siobury junior school failedto get a place at any of theirparents’ chosen schools lastyear and three ended upgoing private.
Aldenham School, the co-educational day and board-ing school, is a popularchoice but costs between£11,000 and £16,000 a year forday places, based on the ageof the pupil. On top of that isthe uniform, sports equip-ment, extras such as schooltrips and the cost of trans-port.
Parents have to weigh upthe risk that a school will godownhill or that the catch-
MORTGAGES OR FEES?
Liz Lightfoot findsthat parental choicecan give familiesa costly dilemma
Highly ranked: Watford Grammar School for Boys
FINANCIAL TIMES SATURDAY MARCH 8 2008 5
Top 1,000 Schools
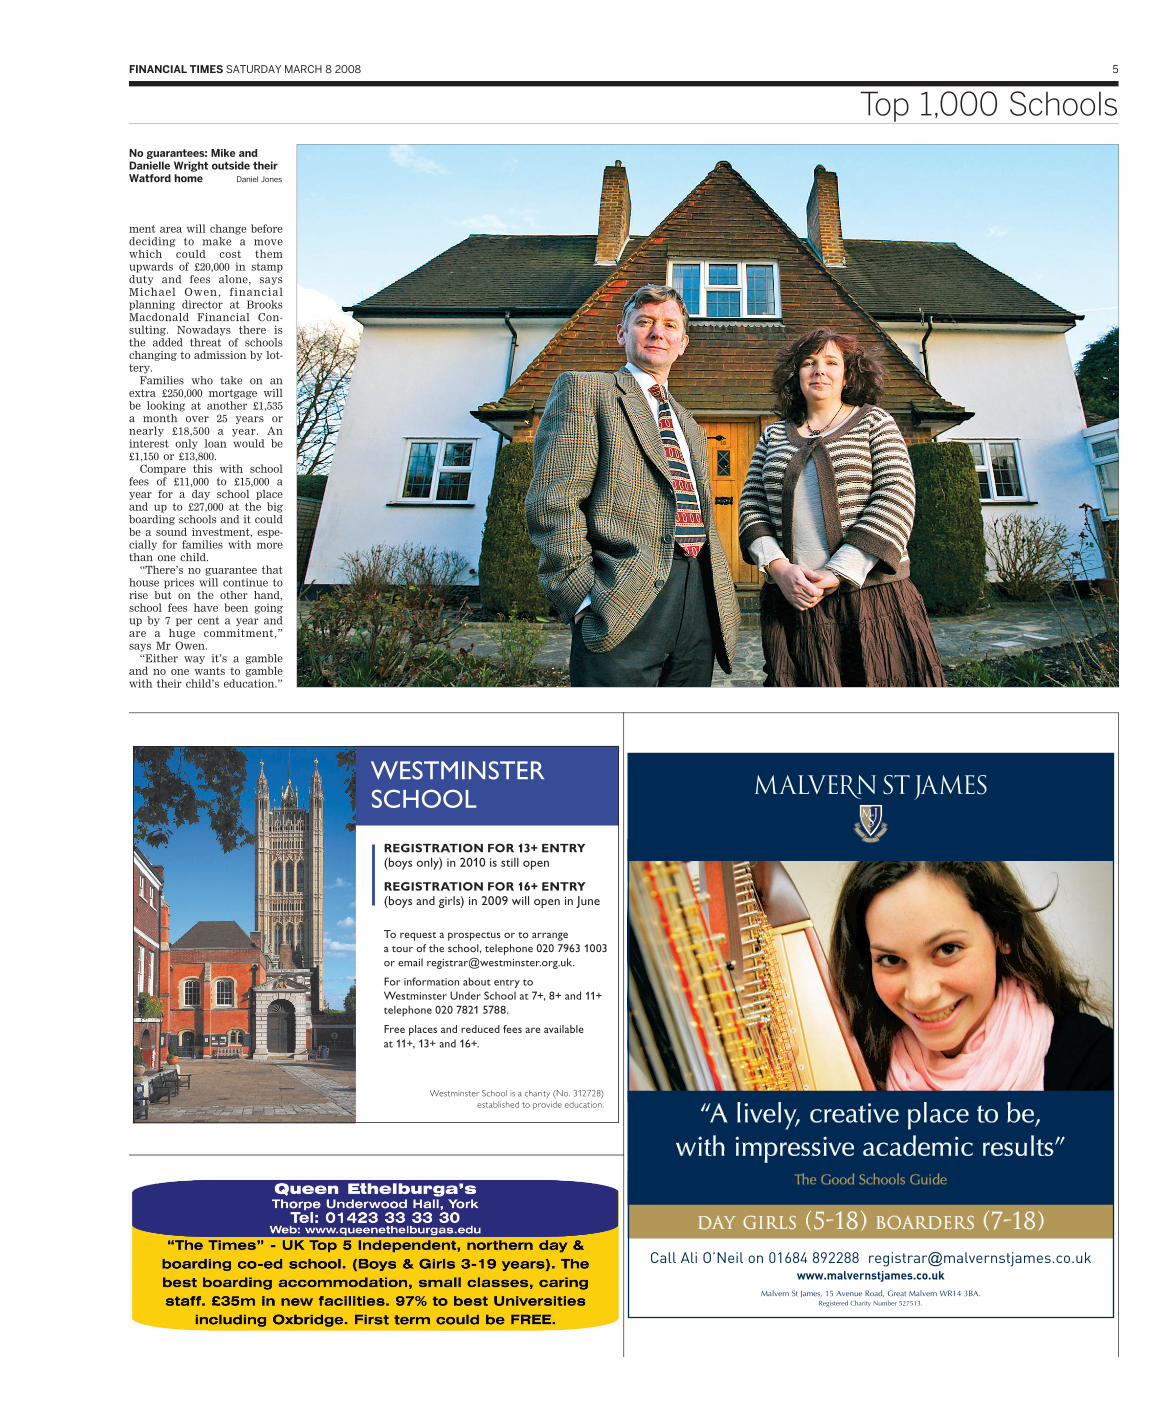
ment area will change beforedeciding to make a movewhich could cost themupwards of £20,000 in stampduty and fees alone, saysMichael Owen, financialplanning director at BrooksMacdonald Financial Con-sulting. Nowadays there isthe added threat of schoolschanging to admission by lot-tery.
Families who take on anextra £250,000 mortgage willbe looking at another £1,535a month over 25 years ornearly £18,500 a year. Aninterest only loan would be£1,150 or £13,800.
Compare this with schoolfees of £11,000 to £15,000 ayear for a day school placeand up to £27,000 at the bigboarding schools and it couldbe a sound investment, espe-cially for families with morethan one child.
“There’s no guarantee thathouse prices will continue torise but on the other hand,school fees have been goingup by 7 per cent a year andare a huge commitment,”says Mr Owen.
“Either way it’s a gambleand no one wants to gamblewith their child’s education.”
No guarantees: Mike andDanielle Wright outside theirWatford home Daniel Jones
6 FINANCIAL TIMES SATURDAY MARCH 8 2008
Top 1,000 Schools
Diploma fans say breadth is best
The holy grail foradmissions tutors intop universities is tofind a surefire means
of picking out those studentsmost likely to get a first-classdegree.
It has, of course, neverbeen found, but many ofthem now reckon that thenearest thing available inthis imperfect world is theInternational Baccalaureatediploma.
It is, they believe, betterthan A-levels at dividing thevery brainy from the amaz-ingly brainy. A large percent-age of A-level students getthe best mark there is – agrade A. But the top IB scoreof 45 is achieved by fewerthan 1 per cent of candidates.Those few who do achieve it,or even get close, are likelyto be a good bet for academicsuccess.
Even those who do not getthe top score are a better betthan A-level students,according to George Pook,the IB assessment director.“In terms of in-depth criticalthinking, and taking respon-sibility for their own learn-ing, the perceived opinion ofthe universities is that the IBprepares students better thanA-levels because of the skillsthat are developed by theprogramme,” he says.
“Universities areimpressed by the sophisti-cated intellectual and cogni-tive skills of IB students.”
That, its advocates say, isbecause the IB gives a much
broader education. All stu-dents must take one subjectfrom each of six areas includ-ing English, mathematicsand a second language.
Students who find, say,mathematics or languagesparticularly difficult, mustnonetheless continue tostudy them, although not inanything like as much depthas they study their best sub-jects.
In addition, there are corecomponents which every IBstudent must take. Theymust write an extendedessay of up to 4,000 words ona topic of their own choice.They must study the theoryof knowledge in a coursedesigned, according to the IBoffice, “to provide coherenceby exploring the nature ofknowledge across disciplines,encouraging an appreciationof other cultural perspec-tives”.
Students must also takepart in a community actionprogramme that “encouragesstudents to be involved inartistic pursuits, sports andcommunity service work,thus fostering students’awareness and appreciationof life outside the academicarena”.
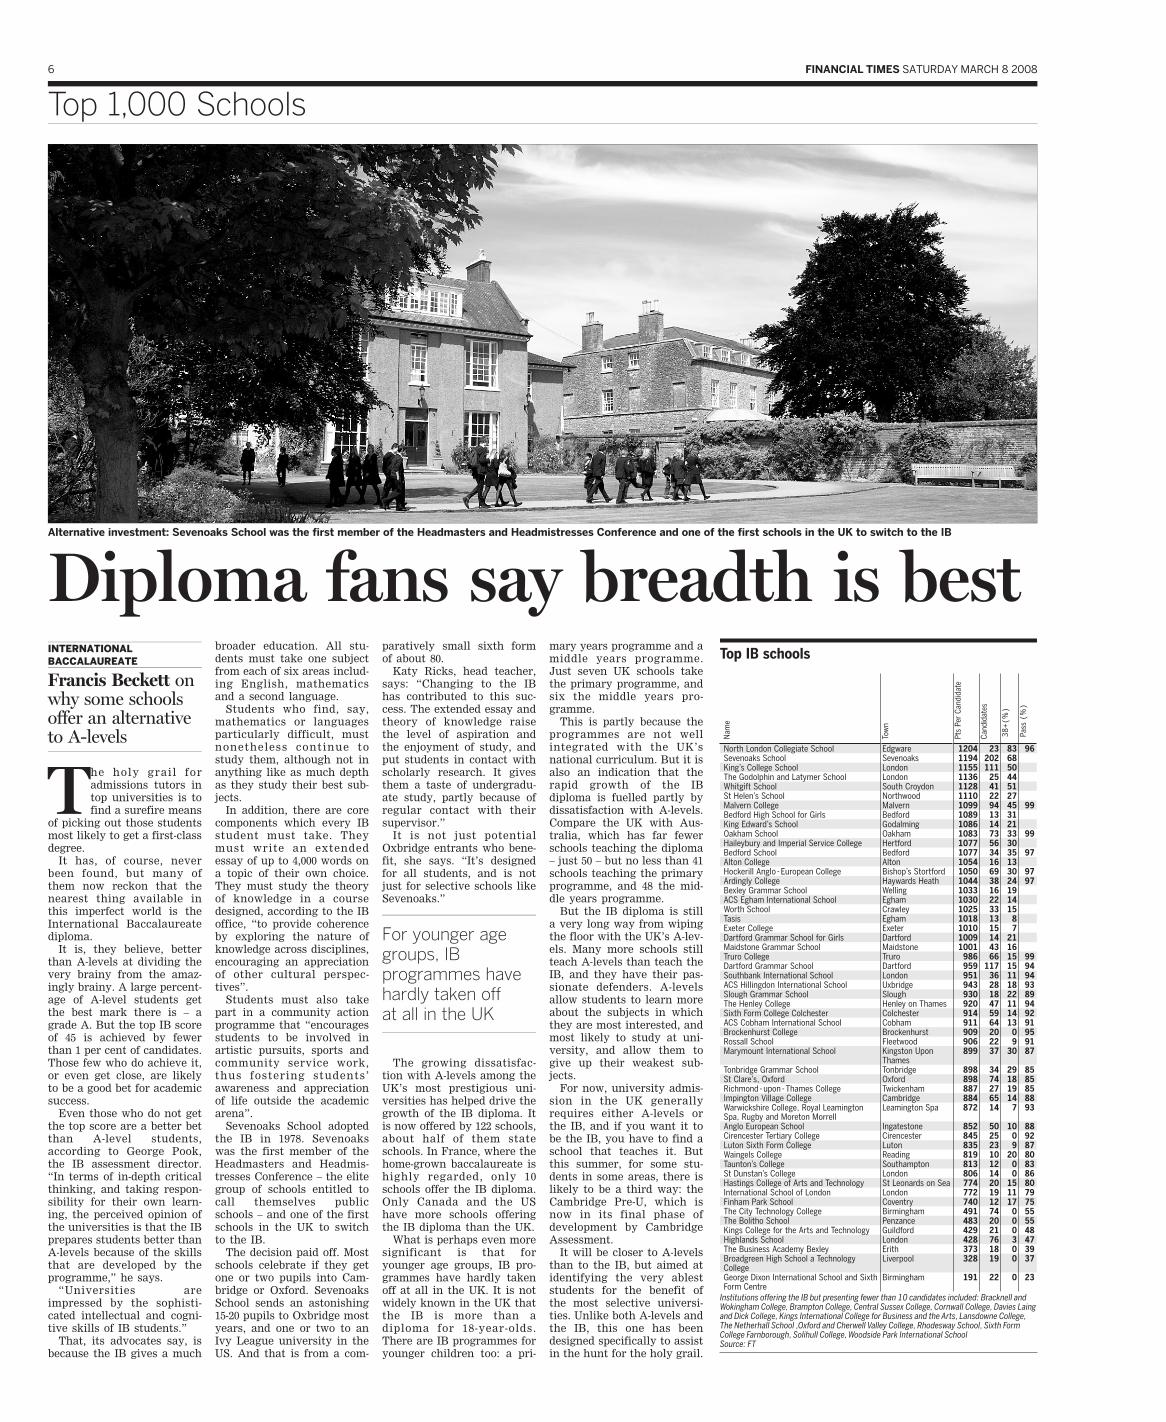
Sevenoaks School adoptedthe IB in 1978. Sevenoakswas the first member of theHeadmasters and Headmis-tresses Conference – the elitegroup of schools entitled tocall themselves publicschools – and one of the firstschools in the UK to switchto the IB.
The decision paid off. Mostschools celebrate if they getone or two pupils into Cam-bridge or Oxford. SevenoaksSchool sends an astonishing15-20 pupils to Oxbridge mostyears, and one or two to anIvy League university in theUS. And that is from a com-
paratively small sixth formof about 80.
Katy Ricks, head teacher,says: “Changing to the IBhas contributed to this suc-cess. The extended essay andtheory of knowledge raisethe level of aspiration andthe enjoyment of study, andput students in contact withscholarly research. It givesthem a taste of undergradu-ate study, partly because ofregular contact with theirsupervisor.”
It is not just potentialOxbridge entrants who bene-fit, she says. “It’s designedfor all students, and is notjust for selective schools likeSevenoaks.”
The growing dissatisfac-tion with A-levels among theUK’s most prestigious uni-versities has helped drive thegrowth of the IB diploma. Itis now offered by 122 schools,about half of them stateschools. In France, where thehome-grown baccalaureate ishighly regarded, only 10schools offer the IB diploma.Only Canada and the UShave more schools offeringthe IB diploma than the UK.
What is perhaps even moresignificant is that foryounger age groups, IB pro-grammes have hardly takenoff at all in the UK. It is notwidely known in the UK thatthe IB is more than adiploma for 18-year-olds.There are IB programmes foryounger children too: a pri-
mary years programme and amiddle years programme.Just seven UK schools takethe primary programme, andsix the middle years pro-gramme.
This is partly because theprogrammes are not wellintegrated with the UK’snational curriculum. But it isalso an indication that therapid growth of the IBdiploma is fuelled partly bydissatisfaction with A-levels.Compare the UK with Aus-tralia, which has far fewerschools teaching the diploma– just 50 – but no less than 41schools teaching the primaryprogramme, and 48 the mid-dle years programme.
But the IB diploma is stilla very long way from wipingthe floor with the UK’s A-lev-els. Many more schools stillteach A-levels than teach theIB, and they have their pas-sionate defenders. A-levelsallow students to learn moreabout the subjects in whichthey are most interested, andmost likely to study at uni-versity, and allow them togive up their weakest sub-jects.
For now, university admis-sion in the UK generallyrequires either A-levels orthe IB, and if you want it tobe the IB, you have to find aschool that teaches it. Butthis summer, for some stu-dents in some areas, there islikely to be a third way: theCambridge Pre-U, which isnow in its final phase ofdevelopment by CambridgeAssessment.
It will be closer to A-levelsthan to the IB, but aimed atidentifying the very ableststudents for the benefit ofthe most selective universi-ties. Unlike both A-levels andthe IB, this one has beendesigned specifically to assistin the hunt for the holy grail.
INTERNATIONALBACCALAUREATE
Francis Beckett onwhy some schoolsoffer an alternativeto Alevels
Alternative investment: Sevenoaks School was the first member of the Headmasters and Headmistresses Conference and one of the first schools in the UK to switch to the IB
Top IB schools
Nam
e
Tow
n
Pts
Per
Cand
idat
e
Cand
idat
es
38+
(%)
Pas
s (%
)
North London Collegiate School Edgware 1204 23 83 96Sevenoaks School Sevenoaks 1194 202 68King’s College School London 1155 111 50The Godolphin and Latymer School London 1136 25 44Whitgift School South Croydon 1128 41 51St Helen’s School Northwood 1110 22 27Malvern College Malvern 1099 94 45 99Bedford High School for Girls Bedford 1089 13 31King Edward’s School Godalming 1086 14 21Oakham School Oakham 1083 73 33 99Haileybury and Imperial Service College Hertford 1077 56 30Bedford School Bedford 1077 34 35 97Alton College Alton 1054 16 13Hockerill Anglo-European College Bishop’s Stortford 1050 69 30 97Ardingly College Haywards Heath 1044 38 24 97Bexley Grammar School Welling 1033 16 19ACS Egham International School Egham 1030 22 14Worth School Crawley 1025 33 15Tasis Egham 1018 13 8Exeter College Exeter 1010 15 7Dartford Grammar School for Girls Dartford 1009 14 21Maidstone Grammar School Maidstone 1001 43 16Truro College Truro 986 66 15 99Dartford Grammar School Dartford 959 117 15 94Southbank International School London 951 36 11 94ACS Hillingdon International School Uxbridge 943 28 18 93Slough Grammar School Slough 930 18 22 89The Henley College Henley on Thames 920 47 11 94Sixth Form College Colchester Colchester 914 59 14 92ACS Cobham International School Cobham 911 64 13 91Brockenhurst College Brockenhurst 909 20 0 95Rossall School Fleetwood 906 22 9 91Marymount International School Kingston Upon
Thames899 37 30 87
Tonbridge Grammar School Tonbridge 898 34 29 85St Clare’s, Oxford Oxford 898 74 18 85Richmond-upon-Thames College Twickenham 887 27 19 85Impington Village College Cambridge 884 65 14 88Warwickshire College, Royal Leamington Spa, Rugby and Moreton Morrell
Leamington Spa 872 14 7 93
Anglo European School Ingatestone 852 50 10 88Cirencester Tertiary College Cirencester 845 25 0 92Luton Sixth Form College Luton 835 23 9 87Waingels College Reading 819 10 20 80Taunton’s College Southampton 813 12 0 83St Dunstan’s College London 806 14 0 86Hastings College of Arts and Technology St Leonards on Sea 774 20 15 80International School of London London 772 19 11 79Finham Park School Coventry 740 12 17 75The City Technology College Birmingham 491 74 0 55The Bolitho School Penzance 483 20 0 55Kings College for the Arts and Technology Guildford 429 21 0 48Highlands School London 428 76 3 47The Business Academy Bexley Erith 373 18 0 39Broadgreen High School a Technology College
Liverpool 328 19 0 37
George Dixon International School and Sixth Form Centre
Birmingham 191 22 0 23
Institutions offering the IB but presenting fewer than 10 candidates included: Bracknell and Wokingham College, Brampton College, Central Sussex College, Cornwall College, Davies Laing and Dick College, Kings International College for Business and the Arts, Lansdowne College, The Netherhall School ,Oxford and Cherwell Valley College, Rhodesway School, Sixth Form College Farnborough, Solihull College, Woodside Park International SchoolSource: FT
For younger agegroups, IBprogrammes havehardly taken offat all in the UK

FINANCIAL TIMES SATURDAY MARCH 8 2008 7
Surrey
LondonCumbria
London South East
South East
8 FINANCIAL TIMES SATURDAY MARCH 8 2008
Top 1,000 Schools
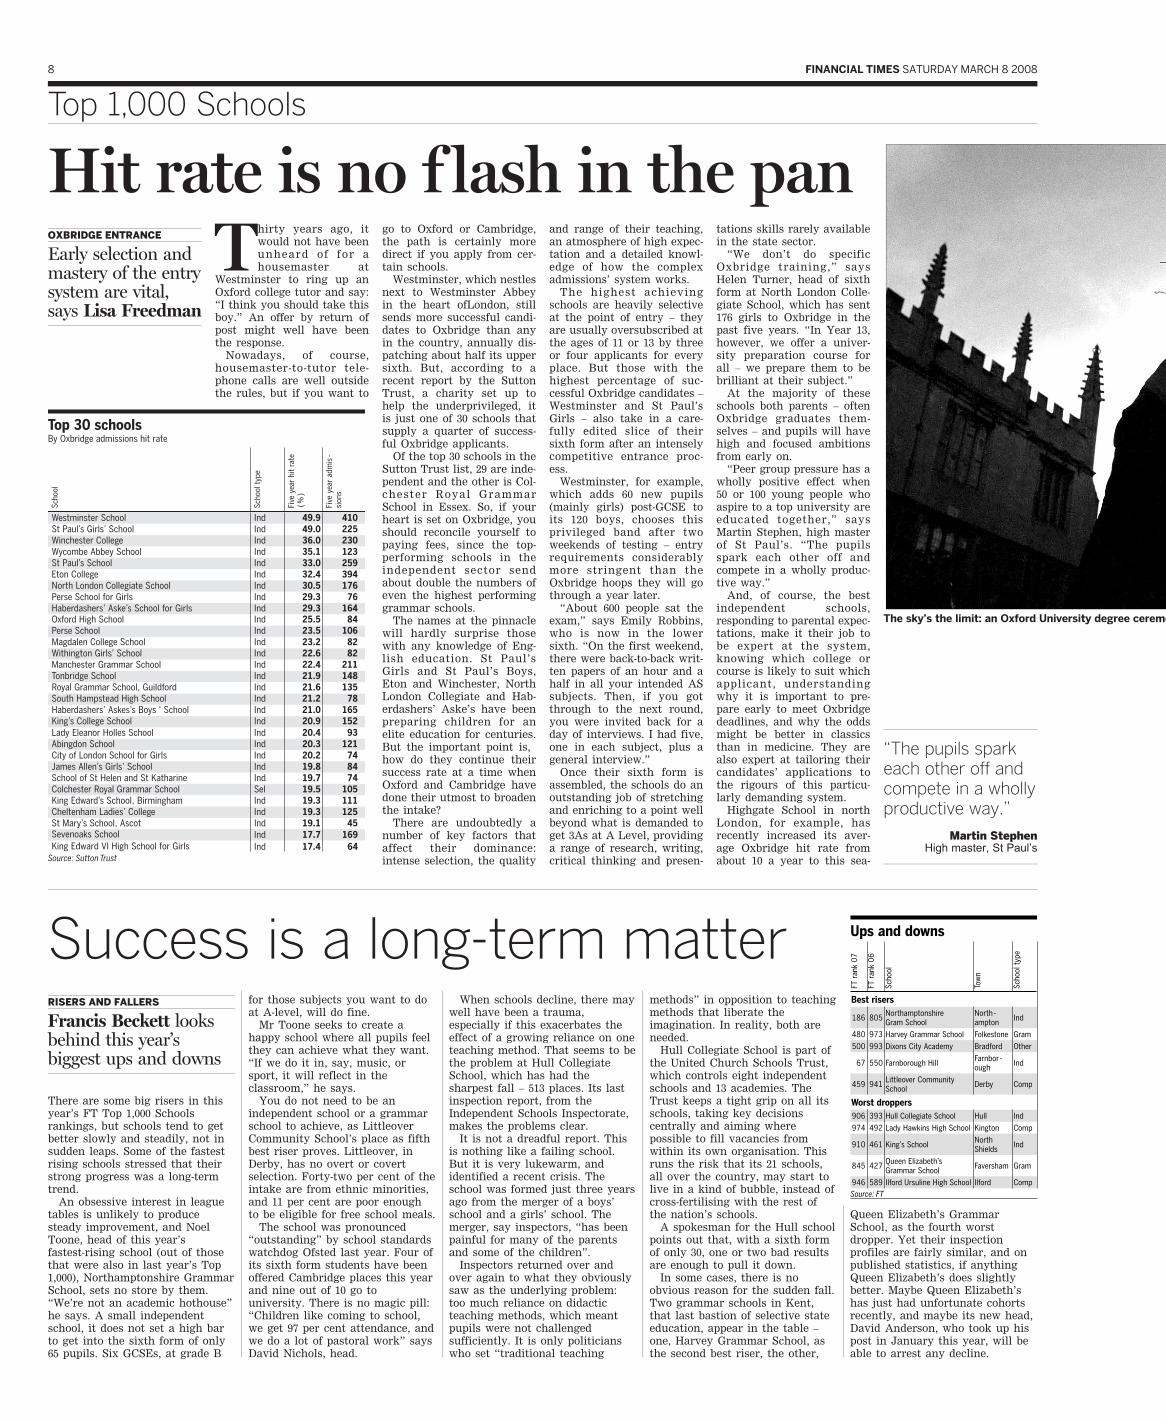
The sky’s the limit: an Oxford University degree ceremony, with the Sheldonian Theatre in the background Rob Judges
Hit rate is no f lash in the pantations skills rarely availablein the state sector.
“We don’t do specificOxbridge training,” saysHelen Turner, head of sixthform at North London Colle-giate School, which has sent176 girls to Oxbridge in thepast five years. “In Year 13,however, we offer a univer-sity preparation course forall – we prepare them to bebrilliant at their subject.”
At the majority of theseschools both parents – oftenOxbridge graduates them-selves – and pupils will havehigh and focused ambitionsfrom early on.
“Peer group pressure has awholly positive effect when50 or 100 young people whoaspire to a top university areeducated together,” saysMartin Stephen, high masterof St Paul’s. “The pupilsspark each other off andcompete in a wholly produc-tive way.”
And, of course, the bestindependent schools,responding to parental expec-tations, make it their job tobe expert at the system,knowing which college orcourse is likely to suit whichapplicant, understandingwhy it is important to pre-pare early to meet Oxbridgedeadlines, and why the oddsmight be better in classicsthan in medicine. They arealso expert at tailoring theircandidates’ applications tothe rigours of this particu-larly demanding system.
Highgate School in northLondon, for example, hasrecently increased its aver-age Oxbridge hit rate fromabout 10 a year to this sea-
Thirty years ago, itwould not have beenunheard of for ahousemaster at
Westminster to ring up anOxford college tutor and say:“I think you should take thisboy.” An offer by return ofpost might well have beenthe response.
Nowadays, of course,housemaster-to-tutor tele-phone calls are well outsidethe rules, but if you want to
go to Oxford or Cambridge,the path is certainly moredirect if you apply from cer-tain schools.
Westminster, which nestlesnext to Westminster Abbeyin the heart ofLondon, stillsends more successful candi-dates to Oxbridge than anyin the country, annually dis-patching about half its uppersixth. But, according to arecent report by the SuttonTrust, a charity set up tohelp the underprivileged, itis just one of 30 schools thatsupply a quarter of success-ful Oxbridge applicants.
Of the top 30 schools in theSutton Trust list, 29 are inde-pendent and the other is Col-chester Royal GrammarSchool in Essex. So, if yourheart is set on Oxbridge, youshould reconcile yourself topaying fees, since the top-performing schools in theindependent sector sendabout double the numbers ofeven the highest performinggrammar schools.
The names at the pinnaclewill hardly surprise thosewith any knowledge of Eng-lish education. St Paul’sGirls and St Paul’s Boys,Eton and Winchester, NorthLondon Collegiate and Hab-erdashers’ Aske’s have beenpreparing children for anelite education for centuries.But the important point is,how do they continue theirsuccess rate at a time whenOxford and Cambridge havedone their utmost to broadenthe intake?
There are undoubtedly anumber of key factors thataffect their dominance:intense selection, the quality
and range of their teaching,an atmosphere of high expec-tation and a detailed knowl-edge of how the complexadmissions’ system works.
The highest achievingschools are heavily selectiveat the point of entry – theyare usually oversubscribed atthe ages of 11 or 13 by threeor four applicants for everyplace. But those with thehighest percentage of suc-cessful Oxbridge candidates –Westminster and St Paul’sGirls – also take in a care-fully edited slice of theirsixth form after an intenselycompetitive entrance proc-ess.
Westminster, for example,which adds 60 new pupils(mainly girls) post-GCSE toits 120 boys, chooses thisprivileged band after twoweekends of testing – entryrequirements considerablymore stringent than theOxbridge hoops they will gothrough a year later.
“About 600 people sat theexam,” says Emily Robbins,who is now in the lowersixth. “On the first weekend,there were back-to-back writ-ten papers of an hour and ahalf in all your intended ASsubjects. Then, if you gotthrough to the next round,you were invited back for aday of interviews. I had five,one in each subject, plus ageneral interview.”
Once their sixth form isassembled, the schools do anoutstanding job of stretchingand enriching to a point wellbeyond what is demanded toget 3As at A Level, providinga range of research, writing,critical thinking and presen-
OXBRIDGE ENTRANCE
Early selection andmastery of the entrysystem are vital,says Lisa Freedman
Top 30 schoolsBy Oxbridge admissions hit rate
Scho
ol
Scho
ol t
ype
Five
yea
r hi
t ra
te
(%)
Five
yea
r ad
mis
-si
ons
Westminster School Ind 49.9 410St Paul’s Girls’ School Ind 49.0 225Winchester College Ind 36.0 230Wycombe Abbey School Ind 35.1 123St Paul’s School Ind 33.0 259Eton College Ind 32.4 394North London Collegiate School Ind 30.5 176Perse School for Girls Ind 29.3 76Haberdashers’ Aske’s School for Girls Ind 29.3 164Oxford High School Ind 25.5 84Perse School Ind 23.5 106Magdalen College School Ind 23.2 82Withington Girls’ School Ind 22.6 82Manchester Grammar School Ind 22.4 211Tonbridge School Ind 21.9 148Royal Grammar School, Guildford Ind 21.6 135South Hampstead High School Ind 21.2 78Haberdashers’ Askes’s Boys ‘ School Ind 21.0 165King’s College School Ind 20.9 152Lady Eleanor Holles School Ind 20.4 93Abingdon School Ind 20.3 121City of London School for Girls Ind 20.2 74James Allen’s Girls’ School Ind 19.8 84School of St Helen and St Katharine Ind 19.7 74Colchester Royal Grammar School Sel 19.5 105King Edward’s School, Birmingham Ind 19.3 111Cheltenham Ladies’ College Ind 19.3 125St MarySevenoaks School
’s School, Ascot Ind 19.1 45Ind 17.7 169
King Edward VI High School for Girls Ind 17.4 64Source: Sutton Trust
Success is a longterm matter
There are some big risers in thisyear’s FT Top 1,000 Schoolsrankings, but schools tend to getbetter slowly and steadily, not insudden leaps. Some of the fastestrising schools stressed that theirstrong progress was a long-termtrend.
An obsessive interest in leaguetables is unlikely to producesteady improvement, and NoelToone, head of this year’sfastest-rising school (out of thosethat were also in last year’s Top1,000), Northamptonshire GrammarSchool, sets no store by them.“We’re not an academic hothouse”he says. A small independentschool, it does not set a high barto get into the sixth form of only65 pupils. Six GCSEs, at grade B
for those subjects you want to doat A-level, will do fine.
Mr Toone seeks to create ahappy school where all pupils feelthey can achieve what they want.“If we do it in, say, music, orsport, it will reflect in theclassroom,” he says.
You do not need to be anindependent school or a grammarschool to achieve, as LittleoverCommunity School’s place as fifthbest riser proves. Littleover, inDerby, has no overt or covertselection. Forty-two per cent of theintake are from ethnic minorities,and 11 per cent are poor enoughto be eligible for free school meals.
The school was pronounced“outstanding” by school standardswatchdog Ofsted last year. Four ofits sixth form students have beenoffered Cambridge places this yearand nine out of 10 go touniversity. There is no magic pill:“Children like coming to school,we get 97 per cent attendance, andwe do a lot of pastoral work” saysDavid Nichols, head.
When schools decline, there maywell have been a trauma,especially if this exacerbates theeffect of a growing reliance on oneteaching method. That seems to bethe problem at Hull CollegiateSchool, which has had thesharpest fall – 513 places. Its lastinspection report, from theIndependent Schools Inspectorate,makes the problems clear.
It is not a dreadful report. Thisis nothing like a failing school.But it is very lukewarm, andidentified a recent crisis. Theschool was formed just three yearsago from the merger of a boys’school and a girls’ school. Themerger, say inspectors, “has beenpainful for many of the parentsand some of the children”.
Inspectors returned over andover again to what they obviouslysaw as the underlying problem:too much reliance on didacticteaching methods, which meantpupils were not challengedsufficiently. It is only politicianswho set “traditional teaching
methods” in opposition to teachingmethods that liberate theimagination. In reality, both areneeded.
Hull Collegiate School is part ofthe United Church Schools Trust,which controls eight independentschools and 13 academies. TheTrust keeps a tight grip on all itsschools, taking key decisionscentrally and aiming wherepossible to fill vacancies fromwithin its own organisation. Thisruns the risk that its 21 schools,all over the country, may start tolive in a kind of bubble, instead ofcross-fertilising with the rest ofthe nation’s schools.
A spokesman for the Hull schoolpoints out that, with a sixth formof only 30, one or two bad resultsare enough to pull it down.
In some cases, there is noobvious reason for the sudden fall.Two grammar schools in Kent,that last bastion of selective stateeducation, appear in the table –one, Harvey Grammar School, asthe second best riser, the other,
Queen Elizabeth’s GrammarSchool, as the fourth worstdropper. Yet their inspectionprofiles are fairly similar, and onpublished statistics, if anythingQueen Elizabeth’s does slightlybetter. Maybe Queen Elizabeth’shas just had unfortunate cohortsrecently, and maybe its new head,David Anderson, who took up hispost in January this year, will beable to arrest any decline.
RISERS AND FALLERS
Francis Beckett looksbehind this year’sbiggest ups and downs
Ups and downs
FT r
ank
07
FT r
ank
06
Scho
ol
Tow
n
Scho
ol ty
pe
Best risers
186 805 NorthamptonshireGram School
North-ampton Ind
480 973 Harvey Grammar School Folkestone Gram500 993 Dixons City Academy Bradford Other
67 550 Farnborough Hill Farnbor-ough Ind
459 941 Littleover Community School Derby Comp
Worst droppers906 393 Hull Collegiate School Hull Ind974 492 Lady Hawkins High School Kington Comp
910 461 King’s School North Shields Ind
845 427 Queen Elizabeth’sGrammar School Faversham Gram
946 589 Ilford Ursuline High School Ilford CompSource: FT
“The pupils sparkeach other off andcompete in a whollyproductive way.”
Martin StephenHigh master, St Paul’s
FINANCIAL TIMES SATURDAY MARCH 8 2008 9
Top 1,000 Schools
son’s 31, and part of thisimproved success rate canalmost certainly be attrib-uted to the approach toapplications brought in bythe head of two years, AdamPettitt.
“The personal statement iskey to Oxbridge and weencourage our students tostart drafting theirs at theend of the summer term,”says Mr Pettitt. We thenspend a lot of time makingsure our candidates are writ-ing for the correct audienceand that they’ve addressedthe elements of the course
High standards pursued religiously at Hasmonean
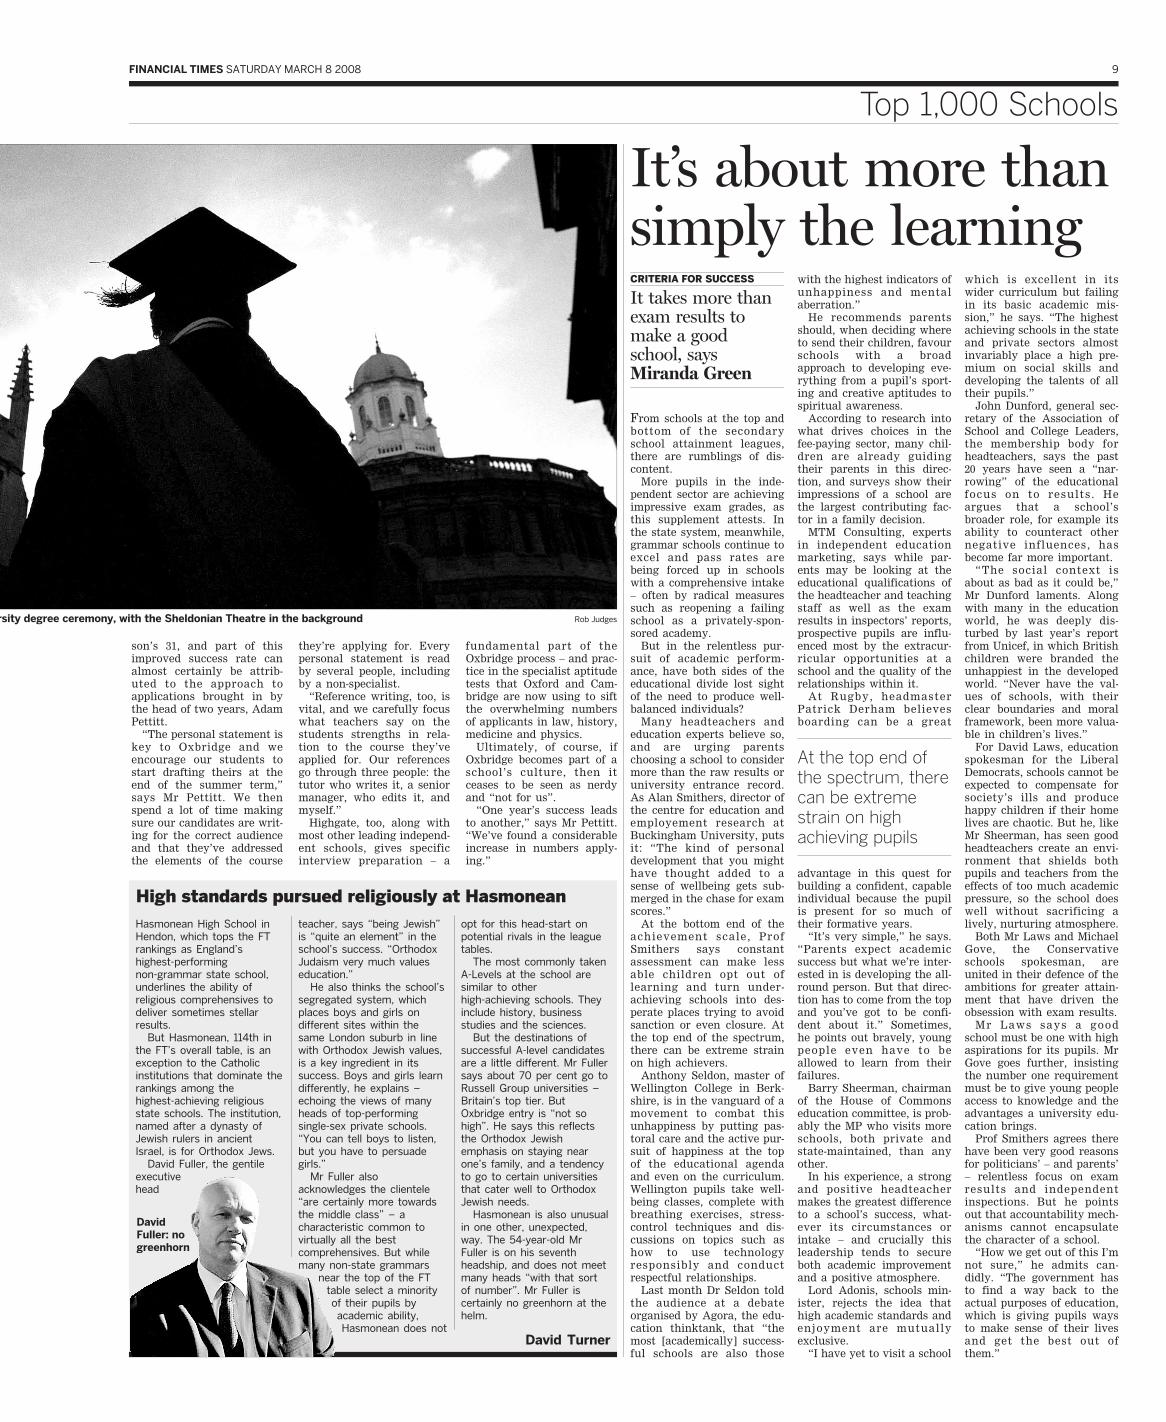
Hasmonean High School inHendon, which tops the FTrankings as England’shighestperformingnongrammar state school,underlines the ability ofreligious comprehensives todeliver sometimes stellarresults.
But Hasmonean, 114th inthe FT’s overall table, is anexception to the Catholicinstitutions that dominate therankings among thehighestachieving religiousstate schools. The institution,named after a dynasty ofJewish rulers in ancientIsrael, is for Orthodox Jews.
David Fuller, the gentileexecutivehead
teacher, says “being Jewish”is “quite an element” in theschool’s success. “OrthodoxJudaism very much valueseducation.”
He also thinks the school’ssegregated system, whichplaces boys and girls ondifferent sites within thesame London suburb in linewith Orthodox Jewish values,is a key ingredient in itssuccess. Boys and girls learndifferently, he explains –echoing the views of manyheads of topperformingsinglesex private schools.“You can tell boys to listen,but you have to persuadegirls.”
Mr Fuller alsoacknowledges the clientele“are certainly more towardsthe middle class” – acharacteristic common tovirtually all the bestcomprehensives. But whilemany nonstate grammars
near the top of the FTtable select a minorityof their pupils by
academic ability,Hasmonean does not
opt for this headstart onpotential rivals in the leaguetables.
The most commonly takenALevels at the school aresimilar to otherhighachieving schools. Theyinclude history, businessstudies and the sciences.
But the destinations ofsuccessful Alevel candidatesare a little different. Mr Fullersays about 70 per cent go toRussell Group universities –Britain’s top tier. ButOxbridge entry is “not sohigh”. He says this reflectsthe Orthodox Jewishemphasis on staying nearone’s family, and a tendencyto go to certain universitiesthat cater well to OrthodoxJewish needs.
Hasmonean is also unusualin one other, unexpected,way. The 54yearold MrFuller is on his seventhheadship, and does not meetmany heads “with that sortof number”. Mr Fuller iscertainly no greenhorn at thehelm.
David Turner
The sky’s the limit: an Oxford University degree ceremony, with the Sheldonian Theatre in the background Rob Judges
they’re applying for. Everypersonal statement is readby several people, includingby a non-specialist.
“Reference writing, too, isvital, and we carefully focuswhat teachers say on thestudents strengths in rela-tion to the course they’veapplied for. Our referencesgo through three people: thetutor who writes it, a seniormanager, who edits it, andmyself.”
Highgate, too, along withmost other leading independ-ent schools, gives specificinterview preparation – a
fundamental part of theOxbridge process – and prac-tice in the specialist aptitudetests that Oxford and Cam-bridge are now using to siftthe overwhelming numbersof applicants in law, history,medicine and physics.
Ultimately, of course, ifOxbridge becomes part of aschool’s culture, then itceases to be seen as nerdyand “not for us”.
“One year’s success leadsto another,” says Mr Pettitt.“We’ve found a considerableincrease in numbers apply-ing.”
It’s about more thansimply the learning
From schools at the top andbottom of the secondaryschool attainment leagues,there are rumblings of dis-content.
More pupils in the inde-pendent sector are achievingimpressive exam grades, asthis supplement attests. Inthe state system, meanwhile,grammar schools continue toexcel and pass rates arebeing forced up in schoolswith a comprehensive intake– often by radical measuressuch as reopening a failingschool as a privately-spon-sored academy.
But in the relentless pur-suit of academic perform-ance, have both sides of theeducational divide lost sightof the need to produce well-balanced individuals?
Many headteachers andeducation experts believe so,and are urging parentschoosing a school to considermore than the raw results oruniversity entrance record.As Alan Smithers, director ofthe centre for education andemployement research atBuckingham University, putsit: “The kind of personaldevelopment that you mighthave thought added to asense of wellbeing gets sub-merged in the chase for examscores.”
At the bottom end of theachievement scale, ProfSmithers says constantassessment can make lessable children opt out oflearning and turn under-achieving schools into des-perate places trying to avoidsanction or even closure. Atthe top end of the spectrum,there can be extreme strainon high achievers.
Anthony Seldon, master ofWellington College in Berk-shire, is in the vanguard of amovement to combat thisunhappiness by putting pas-toral care and the active pur-suit of happiness at the topof the educational agendaand even on the curriculum.Wellington pupils take well-being classes, complete withbreathing exercises, stress-control techniques and dis-cussions on topics such ashow to use technologyresponsibly and conductrespectful relationships.
Last month Dr Seldon toldthe audience at a debateorganised by Agora, the edu-cation thinktank, that “themost [academically] success-ful schools are also those
with the highest indicators ofunhappiness and mentalaberration.”
He recommends parentsshould, when deciding whereto send their children, favourschools with a broadapproach to developing eve-rything from a pupil’s sport-ing and creative aptitudes tospiritual awareness.
According to research intowhat drives choices in thefee-paying sector, many chil-dren are already guidingtheir parents in this direc-tion, and surveys show theirimpressions of a school arethe largest contributing fac-tor in a family decision.
MTM Consulting, expertsin independent educationmarketing, says while par-ents may be looking at theeducational qualifications ofthe headteacher and teachingstaff as well as the examresults in inspectors’ reports,prospective pupils are influ-enced most by the extracur-ricular opportunities at aschool and the quality of therelationships within it.
At Rugby, headmasterPatrick Derham believesboarding can be a great
advantage in this quest forbuilding a confident, capableindividual because the pupilis present for so much oftheir formative years.
“It’s very simple,” he says.“Parents expect academicsuccess but what we’re inter-ested in is developing the all-round person. But that direc-tion has to come from the topand you’ve got to be confi-dent about it.” Sometimes,he points out bravely, youngpeople even have to beallowed to learn from theirfailures.
Barry Sheerman, chairmanof the House of Commonseducation committee, is prob-ably the MP who visits moreschools, both private andstate-maintained, than anyother.
In his experience, a strongand positive headteachermakes the greatest differenceto a school’s success, what-ever its circumstances orintake – and crucially thisleadership tends to secureboth academic improvementand a positive atmosphere.
Lord Adonis, schools min-ister, rejects the idea thathigh academic standards andenjoyment are mutuallyexclusive.
“I have yet to visit a school
which is excellent in itswider curriculum but failingin its basic academic mis-sion,” he says. “The highestachieving schools in the stateand private sectors almostinvariably place a high pre-mium on social skills anddeveloping the talents of alltheir pupils.”
John Dunford, general sec-retary of the Association ofSchool and College Leaders,the membership body forheadteachers, says the past20 years have seen a “nar-rowing” of the educationalfocus on to results. Heargues that a school’sbroader role, for example itsability to counteract othernegative influences, hasbecome far more important.
“The social context isabout as bad as it could be,”Mr Dunford laments. Alongwith many in the educationworld, he was deeply dis-turbed by last year’s reportfrom Unicef, in which Britishchildren were branded theunhappiest in the developedworld. “Never have the val-ues of schools, with theirclear boundaries and moralframework, been more valua-ble in children’s lives.”
For David Laws, educationspokesman for the LiberalDemocrats, schools cannot beexpected to compensate forsociety’s ills and producehappy children if their homelives are chaotic. But he, likeMr Sheerman, has seen goodheadteachers create an envi-ronment that shields bothpupils and teachers from theeffects of too much academicpressure, so the school doeswell without sacrificing alively, nurturing atmosphere.
Both Mr Laws and MichaelGove, the Conservativeschools spokesman, areunited in their defence of theambitions for greater attain-ment that have driven theobsession with exam results.
Mr Laws says a goodschool must be one with highaspirations for its pupils. MrGove goes further, insistingthe number one requirementmust be to give young peopleaccess to knowledge and theadvantages a university edu-cation brings.
Prof Smithers agrees therehave been very good reasonsfor politicians’ – and parents’– relentless focus on examresults and independentinspections. But he pointsout that accountability mech-anisms cannot encapsulatethe character of a school.
“How we get out of this I’mnot sure,” he admits can-didly. “The government hasto find a way back to theactual purposes of education,which is giving pupils waysto make sense of their livesand get the best out ofthem.”
CRITERIA FOR SUCCESS
It takes more thanexam results tomake a goodschool, saysMiranda Green
DavidFuller: nogreenhorn
At the top end ofthe spectrum, therecan be extremestrain on highachieving pupils
10 FINANCIAL TIMES SATURDAY MARCH 8 2008
Top 1,000 Schools
Core A levels All Exams Core A lvl Grds
FT R
ank
07
FT R
ank
06
Scho
ol
Tow
n
Scho
ol ty
pe
FT s
core
Poin
ts/A
leve
l can
dida
te (
core
exa
ms)
Poin
ts/c
ore
A le
vel e
ntry
Num
ber
of c
andi
date
s (A
ll ex
ams)
Core
A le
vel e
ntrie
s/ca
ndid
ate
All A
leve
l ent
ries/
cand
idat
e
Poin
ts/c
andi
date
(al
l exa
ms)
Gov
/DCS
F ra
nk (
Poin
ts/c
and)
Rank
07-
FT m
etho
d (a
ll ex
ams)
Rank
06-
FT m
etho
d (a
ll ex
ams)
% A
gra
de/e
ntry
(co
re s
ubje
cts)
No
AB/c
andi
date
(co
re s
ubje
cts)
% c
ands
at
leas
t AA
B (c
ore
subj
ects
)
% g
irls
(A le
vel c
andi
date
s)
Pupi
ls t
akin
g A
leve
l onl
y
AB r
ank
Up/
Dow
n
Bedfordshire 412 183 151 1.9 2.6 725 0.9285 161 Bedford High School (IB) Bedford Ind 2.40 605 242 102 2.5 3.0 882 406 315 240 46 1.9 30 100 89 278 -124329 429 Bedford Modern School Bedford Ind 2.15 569 242 164 2.4 3.0 832 596 336 384 45 1.7 29 17 164 357 100178 214 Bedford School (IB) Bedford Ind 3.00 688 242 145 2.8 3.2 914 324 285 264 50 2.2 39 0 111 162 36768 Biddenham Up Sch & Sp Coll Bedford Comp 0.53 442 226 78 2.0 2.7 741 1074 941 27 1.2 10 68 78 713359 338 Dame Alice Harpur School Bedford Ind 1.96 564 238 87 2.4 3.0 821 664 284 301 45 1.6 26 100 87 398 -21711 696 Sharnbrook Up’ Sch & CC Sharnbrook Comp 0.64 453 226 274 2.0 2.7 838 563 791 640 30 1.1 12 54 271 773 -15Berkshire 495 214 86 2.1 2.8 779 1.3108 94 Abbey School Reading Reading Ind 3.49 682 254 76 2.7 3.1 968 194 87 58 63 2.3 43 100 76 119 -14429 429 Bradfi eld College Reading Ind 1.64 478 245 144 2.0 2.8 774 903 401 382 50 1.5 19 38 144 462 0617 814 Charters School Ascot Comp 0.92 436 235 144 1.9 2.6 748 1041 650 40 1.2 20 51 142 690 197116 151 Downe House School Thatcham Ind 3.42 653 257 93 2.5 3.1 1101 40 20 33 68 2.3 44 100 93 125 35539 384 Downs School Newbury Comp 1.20 486 234 74 2.1 2.7 822 656 670 359 38 1.3 18 54 74 566 -155
3 5 Eton College Windsor Ind 5.48 904 263 256 3.4 3.6 1086 51 12 19 81 3.3 78 0 256 3 2209 269 Heathfi eld St Mary’s School Ascot Ind 2.82 585 254 40 2.3 3.1 891 379 98 203 62 2.0 28 100 40 245 60633 629 Herschel Grammar School Slough Gram 0.88 530 219 99 2.4 2.9 705 1274 814 666 26 1.3 17 57 88 605 -4716 Highdown Sch & Sixth Form C Emmer Green Comp 0.63 449 227 62 2.0 2.7 673 1459 28 1.1 13 69 55 761598 420 Holt School Wokingham Comp 0.98 505 226 116 2.2 2.9 764 961 659 452 25 1.3 12 100 116 611 -17840 22 Kendrick Girls’ Grammar Sch Reading Gram 4.31 773 258 100 3.0 3.2 1046 78 59 49 71 2.7 58 100 100 45 -18
820 Kennet School Thatcham Comp 0.41 471 218 119 2.2 3.0 844 545 615 715 23 1.1 12 59 115 769322 458 Langley Grammar School Slough Gram 2.19 621 234 133 2.7 3.1 980 179 333 576 39 1.8 27 46 133 304 136278 455 Leighton Park School Reading Ind 2.45 629 239 60 2.6 3.2 788 837 369 560 39 1.9 28 28 60 280 177180 318 Luckley-Oakfi eld School Wokingham Ind 2.99 650 248 24 2.6 3.2 940 259 185 283 51 2.1 38 100 24 186 138927 687 Maiden Erlegh School Reading Comp 0.16 419 221 135 1.9 3.0 761 973 708 585 27 1.0 11 53 135 946 -240302 357 Marist Senior School Ascot Ind 2.30 550 248 23 2.2 3.0 887 390 177 300 63 1.8 30 100 23 315 55856 941 Newlands Girls’ School Maidenhead Comp 0.33 452 219 71 2.1 2.7 748 1043 677 657 28 1.0 14 100 65 861 85978 704 Piggott School Reading Comp 0.05 406 221 78 1.8 2.7 730 1133 683 27 0.9 12 43 76 1017 -274336 138 Queen Anne’s School Reading Ind 2.07 569 240 54 2.4 2.9 811 710 362 333 52 1.7 28 100 54 345 -198706 603 Ranelagh C of E School Bracknell Comp 0.65 489 221 92 2.2 2.6 729 1138 693 679 26 1.2 12 60 92 640 -103368 239 Reading Blue Coat School Reading Ind 1.94 567 237 102 2.4 3.0 882 410 388 223 41 1.7 27 29 102 367 -12966 37 Reading School Reading Gram 4.01 773 251 131 3.1 3.3 936 267 123 94 60 2.6 53 0 131 66 -29
881 Slough Grammar School (IB) Slough Gram 0.26 483 213 168 2.3 2.7 681 1408 25 1.1 12 50 133 798686 520 St Bartholomew’s School Newbury Comp 0.72 513 218 130 2.3 2.9 835 585 914 610 29 1.2 14 51 129 703 -166359 424 St Bernard’s Cath Gram Sch Slough Gram 1.96 576 236 120 2.4 3.1 981 175 376 515 40 1.6 22 54 120 389 65314 92 St George’s School Ascot Ind 2.22 549 247 40 2.2 3.0 876 426 183 54 52 1.7 25 100 40 359 -222
Core A levels All Exams Core A lvl Grds
FT R
ank
07
FT R
ank
06
Scho
ol
Tow
n
Scho
ol ty
pe
FT s
core
Poin
ts/A
leve
l can
dida
te (
core
exa
ms)
Poin
ts/c
ore
A le
vel e
ntry
Num
ber
of c
andi
date
s (A
ll ex
ams)
Core
A le
vel e
ntrie
s/ca
ndid
ate
All A
leve
l ent
ries/
cand
idat
e
Poin
ts/c
andi
date
(al
l exa
ms)
Gov
/DCS
F ra
nk (
Poin
ts/c
and)
Rank
07-
FT m
etho
d (a
ll ex
ams)
Rank
06-
FT m
etho
d (a
ll ex
ams)
% A
gra
de/e
ntry
(co
re s
ubje
cts)
No
AB/c
andi
date
(co
re s
ubje
cts)
% c
ands
at
leas
t AA
B (c
ore
subj
ects
)
% g
irls
(A le
vel c
andi
date
s)
Pupi
ls t
akin
g A
leve
l onl
y
AB r
ank
Up/
Dow
n
43 13 St Mary’s School Ascot Ascot Ind 4.28 764 259 45 3.0 3.2 1094 44 60 14 75 2.6 64 100 45 58 -30799 Theale Green Community Sch Reading Comp 0.45 426 227 116 1.9 2.8 787 840 32 1.1 14 46 116 770134 205 Wellington College Crowthorne Ind 3.32 669 252 159 2.7 3.1 879 418 181 247 59 2.3 46 19 159 131 71Buckinghamshire 517 209 118 2.2 2.9 818 1.3202 256 Aylesbury Grammar School Aylesbury Gram 2.86 674 241 178 2.8 3.2 1001 133 287 234 45 2.1 30 0 178 197 54224 200 Aylesbury High School Aylesbury Gram 2.77 623 247 173 2.5 3.0 946 246 200 194 50 2.0 30 100 173 225 -24350 324 Beaconsfi eld High School Beaconsfi eld Gram 2.01 553 241 147 2.3 3.1 862 466 295 294 41 1.7 22 100 147 380 -26626 647 Burnham Grammar School Slough Gram 0.90 465 230 100 2.0 3.0 889 383 842 999 33 1.3 17 47 100 618 21354 435 Chesham High School Chesham Gram 1.99 591 235 164 2.5 3.1 830 610 412 435 40 1.7 23 51 164 372 81
75 119 Dr Challoner’s Grammar School Amersham Gram 3.85 782 246 173 3.2 3.5 1074 57 171 168 56 2.4 46 0 173 91 44
192 121 Dr Challoner’s High School Amersham Gram 2.92 644 247 143 2.6 3.1 869 448 227 162 53 2.1 34 100 143 206 -71
395 374 John Hampden Gram School High Wy-combe Gram 1.82 564 235 116 2.4 3.1 929 283 349 475 37 1.5 19 0 116 436 -21
548 553 Ousedale School Newp’t Pagnell Comp 1.13 522 226 140 2.3 3.0 944 249 668 942 29 1.3 18 53 140 567 5
454 653 Pipers Corner School High Wy-combe Ind 1.53 547 231 30 2.4 3.2 840 556 419 437 35 1.4 20 100 30 516 199
68 67 Royal Grammar School High Wy-combe Gram 3.91 779 248 194 3.1 3.5 996 144 150 117 59 2.5 47 0 194 75 -1
307 338 Royal Latin School Buckingham Gram 2.26 611 237 184 2.6 3.1 831 603 328 354 44 1.9 28 61 184 285 31
462 532 Sir Henry Floyd Gram Sch & AC Aylesbury Gram 1.48 547 230 122 2.4 3.0 830 610 553 634 29 1.5 18 54 122 438 70
258 267 Sir William Borlase’s Gram Sch Marlow Gram 2.59 631 242 168 2.6 3.2 1015 112 313 376 45 1.9 29 53 168 270 9500 541 Stowe School Buckingham Ind 1.35 472 239 147 2.0 3.0 808 726 404 519 43 1.4 18 33 147 511 41776 Walton High Walnut Tree Comp 0.50 462 222 95 2.1 2.5 786 842 754 19 1.0 10 57 93 898
9 6 Wycombe Abbey School High Wy-combe Ind 5.21 840 267 78 3.1 3.4 1154 13 1 1 93 3.1 79 100 78 13 -3
294 269 Wycombe High School High Wy-combe Gram 2.35 577 245 199 2.4 3.0 904 348 236 217 48 1.9 26 100 199 295 -25
Cambridge and Peterborough 474 208 136 2.0 2.8 804 1.2229 289 Bellerbys College Cambridge Cambridge Ind 2.74 692 235 38 2.9 3.2 835 580 417 486 53 2.2 37 71 38 156 60
776 439 Cambridge Cent for 6th Form St Cambridge Ind 0.50 486 218 69 2.2 3.1 752 1019 745 539 25 1.3 10 41 69 603 -337
182 175 Hills Road Sixth Form College Cambridge 6th 2.98 655 247 877 2.7 3.3 1032 96 164 176 53 2.2 36 57 877 174 -7938 876 Jack Hunt School Peterborough Comp 0.13 442 216 97 2.0 2.7 807 727 25 1.1 13 47 94 784 -62324 353 Kimbolton School Huntingdon Ind 2.18 536 248 75 2.2 3.0 951 233 197 220 57 1.7 29 40 75 330 29534 455 King’s School Peterborough Comp 1.22 526 228 163 2.3 3.0 948 240 423 460 33 1.4 16 56 163 520 -79479 417 King’s School Ely Ely Ind 1.43 501 237 68 2.1 3.1 812 709 447 406 44 1.4 24 47 68 527 -62170 101 Leys School Cambridge Ind 3.03 673 245 88 2.8 3.3 902 352 246 133 50 2.1 34 39 88 186 -69559 765 Longsands College St Neots Comp 1.09 515 227 120 2.3 2.7 740 1082 839 26 1.3 15 52 114 614 20664 Mander Portman Woodward Cambridge Ind 4.04 768 252 24 3.0 3.5 994 145 110 67 2.7 46 63 24 5662 47 Perse School Cambridge Ind 4.07 745 257 106 2.9 3.3 988 164 49 40 71 2.6 58 26 106 69 -1514 14 Perse School for Girls Cambridge Ind 5.04 856 261 53 3.3 3.5 1167 10 4 13 78 3.1 72 100 53 11 0
895 Sir Harry Smith Comm Coll Whittlesey Comp 0.23 514 207 35 2.5 3.1 773 909 18 1.2 9 63 35 709792 St Ivo School St Ives Comp 0.47 457 222 123 2.1 2.7 711 1239 843 22 1.1 9 52 114 77975 319 St Mary’s School Cambridge Ind 3.85 721 256 44 2.8 3.2 956 219 84 355 68 2.6 52 100 44 65 244
487 507 Wisbech Grammar School Wisbech Ind 1.39 530 231 60 2.3 3.1 792 816 492 440 38 1.5 22 45 60 458 20Cheshire 449 197 124 2.0 2.8 786 1.1446 489 Abbey Gate College Chester Ind 1.56 537 234 27 2.3 2.7 807 733 535 831 34 1.5 22 52 27 450 43716 591 Alderley Edge School for Girls Alderley Edge Ind 0.63 452 226 38 2.0 3.0 922 303 525 531 36 1.0 16 100 38 881 -125573 899 All Hallows Catholic High Sch Macclesfi eld Comp 1.06 472 233 72 2.0 2.4 911 334 572 34 1.4 19 42 72 531 326
920 687 Alsager School Stoke-on-T’nt Comp 0.18 469 213 119 2.2 2.9 740 1083 16 1.0 8 52 119 957 -233
994 776 Bishop Heber High School Malpas Comp 0.00 396 221 79 1.8 2.5 813 701 901 17 0.9 6 57 77 1014 -218588 601 Christleton High School Chester Comp 1.00 489 229 141 2.1 2.8 813 703 599 684 32 1.3 17 53 141 588 13485 683 Fallibroome High School Macclesfi eld Comp 1.40 521 232 144 2.2 3.1 848 526 589 693 38 1.4 19 54 144 491 198203 138 Grange School Northwich Ind 2.85 609 251 94 2.4 3.1 1094 43 79 69 56 2.1 32 57 94 216 -65
983 Holmes Chapel Comp Sch Holmes Chapel Comp 0.04 453 213 71 2.1 2.9 829 617 826 25 0.9 14 44 71 1030
271 219 King’s School Macclesfi eld Ind 2.50 602 244 118 2.5 3.1 898 364 294 289 46 1.9 31 44 118 293 -5286 84 King’s School Chester Ind 3.70 741 249 91 3.0 3.3 966 199 166 131 58 2.5 48 22 91 86 -2
662 783 Poynton High School Stockport Comp 0.80 467 228 135 2.1 2.8 756 997 704 856 35 1.1 17 59 132 757 12171 151 Queen’s School Chester Ind 3.90 751 252 51 3.0 3.1 989 160 111 236 60 2.6 53 100 51 68 80
554 883 Sandbach HS & 6th Fm Col Sandbach Comp 1.11 482 232 100 2.1 2.7 873 430 545 932 32 1.3 16 100 95 592 329763 Sandbach School Sandbach Ind 0.54 474 221 75 2.1 2.9 805 742 893 26 1.1 14 0 74 804706 653 Sir John Deane’s College Northwich 6th 0.65 456 226 564 2.0 2.9 956 217 544 535 32 1.2 16 56 564 708 -53788 South Cheshire College Crewe Other 0.48 452 223 620 2.0 2.8 747 1049 920 24 1.0 13 62 308 891552 694 St Nicholas Cath High Sch Northwich Comp 1.12 483 232 124 2.1 2.6 780 865 617 562 36 1.3 18 52 112 593 142578 653 Tarporley Comm High Sch Tarporley Comp 1.04 535 222 62 2.4 2.7 884 400 871 782 25 1.1 13 56 61 737 75902 984 Tytherington High School Macclesfi eld Comp 0.22 406 225 82 1.8 2.6 708 1254 27 1.0 10 51 79 895 82
706 647 Upton-by-Chester High School Chester Comp 0.65 488 221 106 2.2 3.0 744 1065 820 759 29 1.2 13 57 106 712 -59
845 904 Wilmslow High School Wilmslow Comp 0.35 441 222 226 2.0 2.9 714 1225 685 973 26 1.1 11 53 210 802 59Cornwall 395 136 157 1.9 2.7 688 0.8776 Truro College (IB) Truro Other 0.50 458 222 1137 2.1 2.9 807 729 815 885 24 1.1 11 57 689 825267 250 Truro High School Truro Ind 2.53 626 241 27 2.6 3.0 829 615 345 324 47 1.9 37 100 27 286 -17288 262 Truro School Truro Ind 2.38 599 242 93 2.5 3.0 807 727 300 246 46 1.8 28 47 93 306 -26Cumbria 434 212 82 2.0 2.6 798 1.0
826 Appleby Grammar School Appleby-in-W Comp 0.39 457 220 41 2.1 2.5 767 934 995 29 1.2 13 55 38 664
373 507 Austin Friars St Monica’s Carlisle Ind 1.92 564 237 37 2.4 3.2 967 196 340 577 42 1.7 32 46 37 342 134199 168 Casterton School Carnforth Ind 2.88 667 243 40 2.8 3.1 951 234 332 177 40 2.2 35 100 40 160 -31541 728 Cockermouth School Cockermouth Comp 1.18 529 226 116 2.3 2.7 696 1330 734 30 1.4 18 55 114 537 187962 Dallam School Milnthorpe Comp 0.08 436 216 71 2.0 2.8 836 570 906 20 1.0 8 49 71 907978 861 Kirkbie Kendal School Kendal Comp 0.05 400 222 70 1.8 2.5 798 774 590 573 28 1.0 9 70 66 947 -117
956 Kirkby Stephen G Sch S Coll Kirkby Stephen Comp 0.09 359 229 31 1.6 2.8 766 945 919 17 0.9 3 67 30 1059
873 Lakes School Windermere Comp 0.28 433 221 69 2.0 2.6 741 1074 29 1.0 11 61 66 907593 741 Nelson Thomlinson Sch Wigton Comp 0.99 510 225 79 2.3 2.7 965 201 597 785 28 1.2 16 64 75 660 148355 345 Queen Elizabeth Gram Sch Penrith Gram 1.98 590 235 99 2.5 3.1 998 140 275 388 38 1.7 24 59 99 329 -10797 629 Queen Katherine Sch Kendal Comp 0.46 447 223 103 2.0 2.5 847 529 527 433 24 1.0 12 52 103 900 -168402 471 Sedbergh School Sedbergh Ind 1.78 578 232 89 2.5 3.1 796 789 466 621 35 1.6 21 27 89 414 69380 500 St Bees School St Bees Ind 1.88 617 228 48 2.7 3.3 963 204 374 401 46 1.8 35 33 48 307 120920 783 Ulverston Victoria High Sch Ulverston Comp 0.18 436 219 110 2.0 2.6 768 929 23 1.0 11 54 110 935 -137956 861 William Howard School Brampton Comp 0.09 420 219 140 1.9 2.5 823 654 31 1.1 16 54 140 846 -95Derbyshire 429 174 107 1.9 2.6 730 0.9630 573 Brookfi eld Community School Chesterfi eld Comp 0.89 518 221 151 2.3 2.8 841 553 728 984 24 1.2 13 50 151 629 -57239 402 Derby Grammar School Derby Ind 2.69 677 236 29 2.9 3.2 862 468 446 649 45 2.0 45 3 29 249 163322 319 Derby High School Derby Ind 2.19 586 240 34 2.4 3.0 1038 86 223 185 49 1.7 32 100 34 351 -3626 683 Derby Moor Com Sports Col Derby Comp 0.90 485 227 29 2.1 2.9 792 815 587 27 1.1 7 59 29 745 57389 507 Ecclesbourne School Belper Comp 1.85 599 230 147 2.6 3.0 872 436 425 505 37 1.6 25 55 146 391 118822 Heanor Gate Science College Heanor Comp 0.40 477 217 75 2.2 2.6 794 804 18 1.1 7 51 75 833
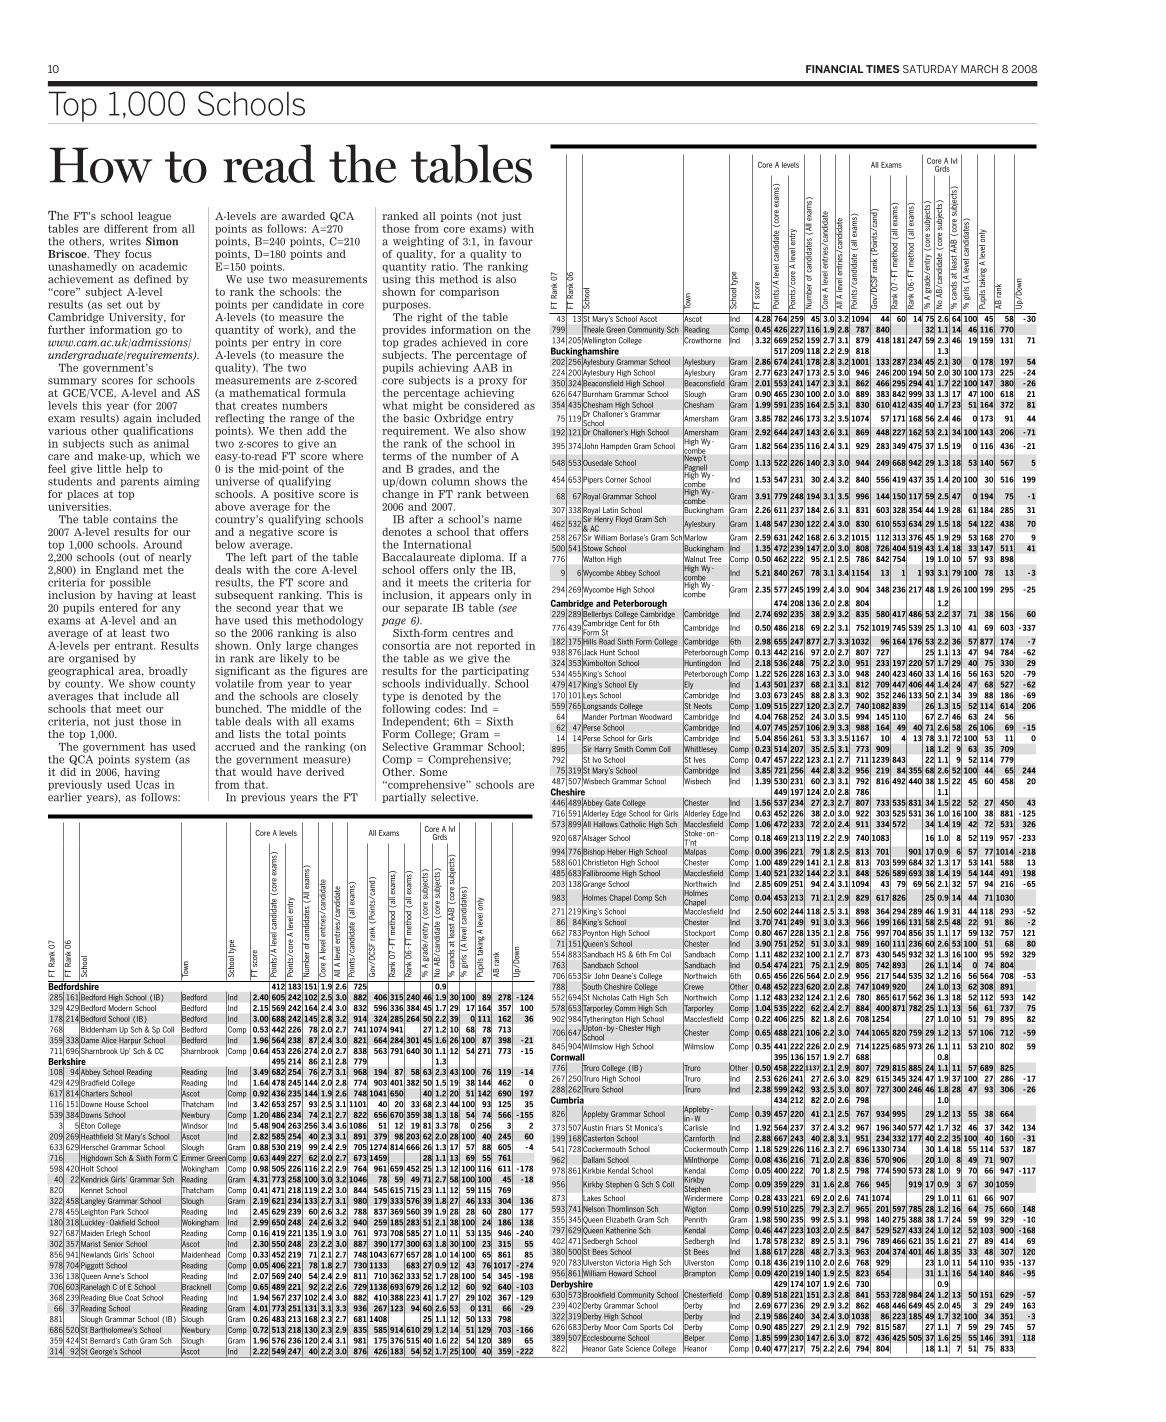
How to read the tablesThe FT’s school leaguetables are different from allthe others, writes SimonBriscoe. They focusunashamedly on academicachievement as defined by“core” subject A-levelresults (as set out byCambridge University, forfurther information go towww.cam.ac.uk/admissions/undergraduate/requirements).
The government’ssummary scores for schoolsat GCE/VCE, A-level and ASlevels this year (for 2007exam results) again includedvarious other qualificationsin subjects such as animalcare and make-up, which wefeel give little help tostudents and parents aimingfor places at topuniversities.
The table contains the2007 A-level results for ourtop 1,000 schools. Around2,200 schools (out of nearly2,800) in England met thecriteria for possibleinclusion by having at least20 pupils entered for anyexams at A-level and anaverage of at least twoA-levels per entrant. Resultsare organised bygeographical area, broadlyby county. We show countyaverages that include allschools that meet ourcriteria, not just those inthe top 1,000.
The government has usedthe QCA points system (asit did in 2006, havingpreviously used Ucas inearlier years), as follows:
A-levels are awarded QCApoints as follows: A=270points, B=240 points, C=210points, D=180 points andE=150 points.
We use two measurementsto rank the schools: thepoints per candidate in coreA-levels (to measure thequantity of work), and thepoints per entry in coreA-levels (to measure thequality). The twomeasurements are z-scored(a mathematical formulathat creates numbersreflecting the range of thepoints). We then add thetwo z-scores to give aneasy-to-read FT score where0 is the mid-point of theuniverse of qualifyingschools. A positive score isabove average for thecountry’s qualifying schoolsand a negative score isbelow average.
The left part of the tabledeals with the core A-levelresults, the FT score andsubsequent ranking. This isthe second year that wehave used this methodologyso the 2006 ranking is alsoshown. Only large changesin rank are likely to besignificant as the figures arevolatile from year to yearand the schools are closelybunched. The middle of thetable deals with all examsand lists the total pointsaccrued and the ranking (onthe government measure)that would have derivedfrom that.
In previous years the FT
ranked all points (not justthose from core exams) witha weighting of 3:1, in favourof quality, for a quality toquantity ratio. The rankingusing this method is alsoshown for comparisonpurposes.
The right of the tableprovides information on thetop grades achieved in coresubjects. The percentage ofpupils achieving AAB incore subjects is a proxy forthe percentage achievingwhat might be considered asthe basic Oxbridge entryrequirement. We also showthe rank of the school interms of the number of Aand B grades, and theup/down column shows thechange in FT rank between2006 and 2007.
IB after a school’s namedenotes a school that offersthe InternationalBaccalaureate diploma. If aschool offers only the IB,and it meets the criteria forinclusion, it appears only inour separate IB table (seepage 6).
Sixth-form centres andconsortia are not reported inthe table as we give theresults for the participatingschools individually. Schooltype is denoted by thefollowing codes: Ind =Independent; 6th = SixthForm College; Gram =Selective Grammar School;Comp = Comprehensive;Other. Some“comprehensive” schools arepartially selective.
FINANCIAL TIMES SATURDAY MARCH 8 2008 11
Core A levels All Exams Core A lvl Grds
FT R
ank
07
FT R
ank
06
Scho
ol
Tow
n
Scho
ol ty
pe
FT s
core
Poin
ts/A
leve
l can
dida
te (
core
exa
ms)
Poin
ts/c
ore
A le
vel e
ntry
Num
ber
of c
andi
date
s (A
ll ex
ams)
Core
A le
vel e
ntrie
s/ca
ndid
ate
All A
leve
l ent
ries/
cand
idat
e
Poin
ts/c
andi
date
(al
l exa
ms)
Gov
/DCS
F ra
nk (
Poin
ts/c
and)
Rank
07-
FT m
etho
d (a
ll ex
ams)
Rank
06-
FT m
etho
d (a
ll ex
ams)
% A
gra
de/e
ntry
(co
re s
ubje
cts)
No
AB/c
andi
date
(co
re s
ubje
cts)
% c
ands
at
leas
t AA
B (c
ore
subj
ects
)
% g
irls
(A le
vel c
andi
date
s)
Pupi
ls t
akin
g A
leve
l onl
y
AB r
ank
Up/
Dow
n
512 482 Highfi elds School Matlock Comp 1.33 530 229 106 2.3 2.9 926 294 516 532 35 1.4 18 56 106 523 -30652 776 Lady Manners School Bakewell Comp 0.83 444 232 125 1.9 2.9 920 307 586 36 1.2 14 54 125 704 124956 Landau Forte College Derby Other 0.09 422 219 117 1.9 2.7 773 906 943 22 0.9 9 50 111 1042459 941 Littleover Community School Derby Comp 1.50 555 229 98 2.4 3.1 844 543 523 896 34 1.4 18 60 97 513 482776 553 Mount St Mary’s College Sheffi eld Ind 0.50 427 227 33 1.9 3.1 733 1117 604 543 27 1.1 15 27 33 809 -223910 Newbold Community School Newbold Comp 0.20 473 213 41 2.2 2.5 845 537 23 1.0 17 68 41 954153 285 Ockbrook School Derby Ind 3.12 668 248 23 2.7 3.0 824 644 194 258 57 2.3 48 100 23 113 132332 635 Queen Elizabeth’s Gram Sch Ashbourne Comp 2.08 565 241 89 2.3 2.8 1000 136 410 830 54 1.8 33 52 89 311 303163 196 Repton School Derby Ind 3.08 634 252 109 2.5 3.4 933 272 105 178 65 2.3 42 47 109 143 33418 332 St Mary’s Catholic High Sch Chesterfi eld Comp 1.70 562 233 118 2.4 3.0 915 322 515 309 35 1.5 22 56 118 466 -86674 624 Trent College Nottingham Ind 0.76 426 234 90 1.8 2.7 783 852 484 434 35 1.2 13 38 90 732 -50910 674 Tupton Hall School Chesterfi eld Comp 0.20 483 211 113 2.3 2.7 685 1392 803 22 1.0 8 56 112 879 -236924 810 Woodlands School Derby Comp 0.17 460 214 82 2.1 2.8 702 1302 939 752 16 0.9 9 56 82 1055 -114Devon 431 181 113 1.9 2.6 725 0.9415 415 Blundell’s School Tiverton Ind 1.71 559 233 81 2.4 3.0 783 856 460 365 35 1.6 20 40 81 417 0404 353 Churston Ferrers Gram Sch Brixham Gram 1.77 535 239 129 2.2 3.0 961 209 276 272 42 1.6 23 59 129 411 -5185 92 Colyton Grammar School Colyton Gram 3.71 698 256 101 2.7 3.1 1272 2 15 21 68 2.4 49 48 101 96 7
432 384 Devonport High Sch for Boys Plymouth Gram 1.63 592 226 121 2.6 3.2 1003 131 406 377 26 1.5 18 0 120 456 -48340 420 Devonport High Sch for Girls Plymouth Gram 2.04 603 234 103 2.6 3.1 942 256 353 350 40 1.6 29 100 103 399 80153 110 Exeter School Exeter Ind 3.12 671 247 98 2.7 3.2 911 334 217 147 53 2.2 39 31 98 171 -43454 578 Grenville College Bideford Ind 1.53 536 233 33 2.3 2.4 711 1238 718 865 38 1.5 24 58 33 453 124902 Ivybridge Community College Ivybridge Comp 0.22 453 217 192 2.1 2.8 854 495 774 680 24 1.0 11 51 185 977748 931 Kelly College Tavistock Ind 0.57 393 235 40 1.7 2.9 756 998 475 773 34 1.2 12 28 40 677 183734 956 Kingsbridge Community Col Kingsbridge Comp 0.60 435 228 107 1.9 2.7 729 1142 644 802 31 1.2 13 61 105 668 222114 127 Maynard School Exeter Ind 3.43 704 249 52 2.8 3.1 923 298 158 98 55 2.3 42 100 52 129 13811 541 Plymouth College Plymouth Ind 0.43 433 225 106 1.9 3.0 768 926 554 527 29 1.1 11 51 106 787 -270491 876 Plymouth High Sch for Girls Plymouth Gram 1.38 571 224 80 2.6 3.0 836 576 671 33 1.4 15 100 80 488 385873 Plymstock School Plymstock Comp 0.28 451 219 82 2.1 2.8 721 1188 878 852 27 1.0 10 56 80 868669 669 Queen Elizabeth’s Com Col Crediton Comp 0.79 481 225 88 2.1 2.9 729 1138 874 769 31 1.1 15 56 88 748 0889 South Dartmoor Comm Coll Ashburton Comp 0.24 411 224 126 1.8 2.3 728 1145 749 27 1.0 10 46 120 966326 224 St Margaret’s School Exeter Ind 2.17 587 239 33 2.5 3.0 822 658 281 222 41 1.7 27 100 33 361 -102
532 Stover School Newton Abbot Ind 1.23 503 232 23 2.2 3.4 844 542 453 36 1.5 13 100 23 470
935 956 Teign School Newt’ Abbot Comp 0.14 435 218 72 2.0 2.8 674 1447 24 0.9 12 47 72 1025 21276 230 Torquay Boys’ Grammar Sch Torquay Gram 2.46 630 239 154 2.6 3.2 1050 76 212 164 44 1.9 27 0 154 260 -46386 402 Torquay Gram Sch for Girls Torquay Gram 1.86 599 230 133 2.6 3.0 777 887 489 431 33 1.7 23 100 133 376 16199 296 West Buckland School Barnstaple Ind 2.88 670 242 60 2.8 3.2 875 427 305 411 52 2.0 35 38 60 224 97Dorset 459 196 122 1.9 2.6 767 1.1317 324 Bournemouth Sch for Girls Bournemouth Gram 2.20 594 239 144 2.5 3.1 939 264 266 349 41 1.8 22 100 144 318 7411 578 Bournemouth School Bournemouth Gram 1.73 572 232 152 2.5 3.1 828 625 393 633 39 1.6 26 0 152 406 167399 349 Bryanston School B’ford Forum Ind 1.80 518 242 120 2.1 3.1 827 627 299 308 45 1.6 24 41 120 418 -50106 178 Canford School Wimborne Ind 3.50 683 254 129 2.7 3.2 928 290 94 107 65 2.3 48 43 129 114 72706 853 Clayesmore School B’ford Forum Ind 0.65 422 232 51 1.8 3.0 758 987 678 781 40 1.1 12 49 51 747 147994 Corfe Hills School Broadstone Comp 0.00 421 217 173 1.9 2.6 740 1083 20 0.9 5 53 170 1071871 715 Gillingham School Gillingham Comp 0.29 429 222 164 1.9 2.7 850 517 509 566 30 1.1 12 47 164 827 -156711 Gryphon School Sherborne Comp 0.64 450 227 122 2.0 2.5 778 879 824 34 1.2 15 56 114 713927 Highcliffe School Highcliffe Comp 0.16 428 220 58 1.9 2.5 596 1905 971 27 1.0 11 64 56 968251 224 Parkstone Grammar Sch Poole Gram 2.63 642 241 150 2.7 3.2 1018 106 248 207 49 2.0 33 100 150 233 -27347 527 Poole Grammar School Poole Gram 2.02 599 234 138 2.6 3.1 1071 60 306 489 43 1.7 32 0 138 331 180804 Purbeck School Wareham Comp 0.44 463 220 94 2.1 2.5 647 1617 29 1.0 15 61 85 896120 168 Sherborne Sch for Girls Sherborne Ind 3.39 653 256 66 2.5 3.1 888 387 118 201 61 2.4 33 100 66 105 48168 137 Sherborne School Sherborne Ind 3.04 653 248 119 2.6 3.1 869 449 209 167 51 2.2 34 0 119 172 -31760 Sir John Colfox School Bridport Comp 0.55 443 226 58 2.0 2.8 725 1163 673 21 1.1 6 61 51 797182 412 St Antony’s Leweston Sch Sherborne Ind 2.98 644 248 32 2.6 3.2 904 347 201 379 55 2.1 44 100 32 186 230296 St Mary’s School Shaftesbury Ind 2.33 622 237 37 2.6 3.0 826 635 307 37 1.8 22 100 37 30282 34 Talbot Heath School Bournemouth Ind 3.79 739 252 49 2.9 3.3 921 304 101 45 56 2.5 51 100 49 73 -48
867 965 Thomas Hardye Sch Dorchester Comp 0.30 430 222 325 1.9 2.6 884 399 721 1000 26 1.0 12 55 321 901 98895 Twynham School Christchurch Comp 0.23 435 220 96 2.0 2.7 688 1372 27 1.1 13 48 89 790Essex 434 174 153 1.9 2.7 765 0.9845 956 Boswells School Chelmsford Comp 0.35 449 220 108 2.0 2.7 939 263 664 970 21 0.9 7 63 108 988 111
920 973 Brent’d Ursuline Convent H Sch Brentwood Comp 0.18 406 224 86 1.8 2.9 874 429 948 26 1.0 10 100 86 883 53
265 363 Brentwood School Brentwood Ind 2.54 604 245 152 2.5 3.1 856 490 253 369 52 1.9 35 42 152 271 9852 50 Chelmsford C’nty HS for Girls Chelmsford Gram 4.14 780 253 135 3.1 3.3 1148 16 32 27 58 2.8 48 100 135 37 -295 190 Chigwell School Chigwell Ind 3.60 717 251 80 2.9 3.1 868 454 167 287 56 2.5 42 41 79 88 95
34 39 Colchester C’nty H Sch for Girls Colchester Gram 4.43 802 256 103 3.1 3.3 1130 23 23 48 67 2.8 60 100 103 40 5
5 9 Colchester Royal Gram Sch Colchester Gram 5.42 923 258 134 3.6 3.8 1324 1 5 6 71 3.3 69 20 134 5 4724 647 Davenant Foundation School Loughton Comp 0.62 469 223 119 2.1 2.8 814 695 661 897 32 1.2 15 51 119 696 -77332 446 Felsted School Dunmow Ind 2.08 553 243 90 2.3 3.1 804 744 359 393 48 1.7 24 40 90 332 11420 27 King Edward VI Grammar S Chelmsford Gram 4.80 857 255 155 3.4 3.6 1221 4 22 35 66 3.0 63 18 155 16 7
652 891 Mayfl ower High School Billericay Comp 0.83 469 228 92 2.1 2.8 847 528 593 27 1.2 5 49 92 720 239420 299 New Hall School Chelmsford Ind 1.69 522 239 44 2.2 3.1 858 479 319 311 41 1.7 23 100 44 343 -121
711 Newport Free Grammar Sch Saffron Walden Comp 0.64 479 222 77 2.2 2.9 831 602 736 23 1.2 11 51 76 698
500 624 Saffron Walden County H Sch Saffron W’den Comp 1.35 486 237 219 2.0 2.4 798 773 637 443 33 1.4 17 48 183 498 124
989 868 Sixth Form Col Colchester (IB) Colchester 6th 0.02 431 216 1115 2.0 2.9 863 462 876 847 22 1.0 9 54 1056 974 -121
261 336 Southend High School for Boys Southend Gram 2.58 643 239 117 2.7 3.1 1074 58 172 269 39 2.0 25 13 117 253 75
359 324 Southend High School for Girls Southend Gram 1.96 581 236 115 2.5 3.1 1058 70 274 254 34 1.6 23 94 115 392 -35468 560 St John Payne Cath Com Sch Chelmsford Comp 1.46 500 237 76 2.1 2.7 928 291 414 507 41 1.4 17 38 76 497 92924 728 St Martin’s School Brentwood Comp 0.17 413 222 143 1.9 2.9 962 207 753 724 17 1.0 6 52 143 960 -196
216 230 Westcliff High School for Boys Westcliff-on-S Gram 2.80 667 241 115 2.8 3.1 1012 120 243 297 43 2.0 31 0 115 220 14
138 107 Westcliff High School for Girls Westcliff-on-S Gram 3.29 697 247 126 2.8 3.3 999 139 141 92 50 2.3 32 97 126 135 -31
740 824 William de Ferrers School Chelmsford Comp 0.59 448 226 125 2.0 2.9 739 1090 700 766 27 1.1 10 49 115 743 84Gloucestershire 429 191 115 1.9 2.6 762 1.0
600 Balcarras School Charlton Kings Comp 0.97 470 231 124 2.0 2.7 920 310 472 834 31 1.2 10 52 119 649
776 Castle School Thornbury Comp 0.50 408 230 145 1.8 2.5 799 769 623 956 32 1.0 15 53 136 870373 236 Cheltenham College Cheltenham Ind 1.92 533 242 110 2.2 3.0 842 550 279 218 50 1.6 28 39 110 395 -13717 14 Cheltenham Ladies’ Col Cheltenham Ind 4.98 843 261 138 3.2 3.5 1045 79 17 23 77 3.0 67 100 138 17 -3
776 799 Cotswold School Cheltenham Comp 0.50 485 218 59 2.2 2.8 840 559 641 551 23 1.0 12 35 58 876 23131 224 Dean Close School Cheltenham Ind 3.34 705 247 101 2.9 3.4 932 274 152 277 52 2.3 35 53 101 137 93804 482 Farmor’s School Fairford Comp 0.44 416 228 109 1.8 2.6 739 1090 680 516 32 1.2 11 51 109 717 -322437 308 High School for Girls Gloucester Gram 1.60 551 232 107 2.4 3.0 1014 117 343 216 33 1.5 23 92 107 459 -129
642 669 Katharine Lady Berkeley’s Sch Wotton-u-Ed’ Comp 0.85 487 226 120 2.2 3.0 872 435 470 645 26 1.2 17 59 120 650 27
658 King’s School Gloucester Ind 0.82 472 227 51 2.1 2.9 787 838 537 877 30 1.1 16 37 51 842
Core A levels All Exams Core A lvl Grds
FT R
ank
07
FT R
ank
06
Scho
ol
Tow
n
Scho
ol ty
pe
FT s
core
Poin
ts/A
leve
l can
dida
te (
core
exa
ms)
Poin
ts/c
ore
A le
vel e
ntry
Num
ber
of c
andi
date
s (A
ll ex
ams)
Core
A le
vel e
ntrie
s/ca
ndid
ate
All A
leve
l ent
ries/
cand
idat
e
Poin
ts/c
andi
date
(al
l exa
ms)
Gov
/DCS
F ra
nk (
Poin
ts/c
and)
Rank
07-
FT m
etho
d (a
ll ex
ams)
Rank
06-
FT m
etho
d (a
ll ex
ams)
% A
gra
de/e
ntry
(co
re s
ubje
cts)
No
AB/c
andi
date
(co
re s
ubje
cts)
% c
ands
at
leas
t AA
B (c
ore
subj
ects
)
% g
irls
(A le
vel c
andi
date
s)
Pupi
ls t
akin
g A
leve
l onl
y
AB r
ank
Up/
Dow
n
684 578 Marling School Stroud Gram 0.73 470 226 110 2.1 3.0 822 657 596 718 32 1.3 16 0 110 622 -106895 Marlwood School Alveston Comp 0.23 447 218 108 2.0 2.6 764 955 30 1.1 15 60 105 83379 73 Pate’s Grammar School Cheltenham Gram 3.82 719 255 169 2.8 3.1 1165 11 25 41 65 2.5 52 50 169 78 -6
519 388 Rendcomb College Cirencester Ind 1.26 551 224 33 2.5 3.2 802 757 468 426 33 1.6 24 46 33 423 -131734 597 Ribston Hall High School Gloucester Gram 0.60 456 225 66 2.0 2.8 853 499 573 487 28 1.2 9 83 66 661 -137303 248 Sir Thomas Rich’s School Gloucester Gram 2.29 636 234 118 2.7 3.1 1010 121 378 226 34 1.7 19 30 118 348 -55743 965 St Edward’s School Cheltenham Ind 0.58 418 231 53 1.8 3.0 790 831 549 472 31 1.1 11 40 53 780 222500 492 Stroud High School Stroud Gram 1.35 494 236 128 2.1 2.9 843 546 424 416 37 1.5 16 100 128 477 -8519 267 Westonbirt School Tetbury Ind 1.26 531 228 27 2.3 3.0 774 903 560 257 33 1.6 22 100 27 433 -252519 653 Wycliffe College Stonehouse Ind 1.26 481 236 76 2.0 2.7 708 1257 499 541 36 1.4 11 36 76 528 134Hampshire 426 189 290 1.8 2.7 788 1.0871 984 Alton College (IB) Alton 6th 0.29 408 226 733 1.8 2.8 869 451 726 687 34 1.0 14 52 579 875 113415 451 Bay House School Gosport Comp 1.71 576 231 135 2.5 3.0 789 834 495 518 31 1.5 15 53 133 440 36414 382 Bedales School Petersfi eld Ind 1.72 542 237 93 2.3 3.0 793 807 458 356 41 1.6 24 54 93 410 -32942 904 Burgate School & 6th F’m Cen Fordingbridge Comp 0.12 417 220 92 1.9 2.9 918 313 694 800 31 1.1 11 51 92 851 -38153 274 Churcher’s College Petersfi eld Ind 3.12 666 248 70 2.7 3.1 985 170 139 250 56 2.2 44 36 70 155 12167 550 Farnborough Hill Farnborough Ind 3.94 720 258 24 2.8 3.2 938 265 99 500 73 2.5 54 100 24 70 48368 115 King Edward VI School Southampton Ind 3.91 705 260 113 2.7 3.1 920 308 62 134 76 2.5 54 31 113 80 47
377 400 Lord Wandsworth College Hook Ind 1.90 563 237 48 2.4 3.1 813 702 418 448 40 1.6 31 35 48 429 23514 635 Oaklands Catholic School Waterlooville Comp 1.28 549 225 78 2.4 2.8 726 1159 829 27 1.2 17 50 78 631 121516 469 Peter Symonds College Winchester 6th 1.27 510 231 1354 2.2 2.8 1016 111 416 453 37 1.4 21 53 1338 534 -4798 88 Portsmouth Gram Sch Portsmouth Ind 3.57 713 251 122 2.8 3.2 910 336 115 105 59 2.4 44 40 122 99 -10
192 157 Portsmouth High School Southsea Ind 2.92 640 248 31 2.6 3.0 856 491 199 172 55 2.1 42 100 31 198 -35889 997 Ringwood School Ringwood Comp 0.24 432 221 124 2.0 2.9 758 987 688 889 28 1.0 13 53 124 973 108248 451 Ryde School with Upper Chine Ryde Ind 2.64 590 250 52 2.4 3.2 903 349 228 358 61 1.9 35 50 52 288 203406 250 Salesian College Farnborough Ind 1.74 556 235 35 2.4 3.1 793 809 580 375 34 1.9 17 0 35 296 -156
635 675 Sixth Form Col Farnborough (IB) Farnborough 6th 0.87 466 230 1182 2.0 2.9 1036 90 507 553 32 1.2 15 55 1170 656 40
569 427 St Anne’s Catholic School Southampton Comp 1.07 547 221 25 2.5 2.9 764 955 740 712 19 1.3 20 100 25 573 -142399 563 St John’s College Southsea Ind 1.80 556 236 29 2.4 2.9 808 723 605 663 39 1.4 21 32 28 499 16432 80 St Swithun’s School Winchester Ind 4.47 796 258 56 3.1 3.3 1208 5 14 37 69 2.9 59 100 56 24 482 2 Winchester College Winchester Ind 5.89 962 263 148 3.7 3.8 1079 54 7 9 81 3.5 72 0 148 2 0
Hereford and Worcester 454 187 135 2.0 2.7 796 1.1429 313 Alice Ottley School Worcester Ind 1.64 538 235 52 2.3 3.0 847 529 365 408 40 1.7 25 100 52 363 -116273 279 Bromsgrove School Bromsgrove Ind 2.47 566 250 146 2.3 3.1 943 254 213 150 53 1.9 30 43 141 277 6799 734 Dyson Perrins CofE High Sch Malvern Comp 0.45 451 222 37 2.0 2.6 835 582 888 28 1.0 8 60 37 907 -65956 891 Hagley Catholic High School Stourbridge Comp 0.09 504 206 73 2.5 3.0 828 620 19 1.1 14 48 73 848 -65978 Haybridge High Sch & Sixth Hagley Comp 0.05 404 221 135 1.8 2.4 737 1103 892 917 27 0.9 14 54 127 1094461 295 Hereford Cathedral School Hereford Ind 1.49 553 230 71 2.4 3.0 794 801 455 328 39 1.4 25 55 71 502 -166581 535 Hereford Sixth Form College Hereford 6th 1.02 491 229 660 2.1 2.8 991 155 434 459 35 1.3 17 57 658 578 -46
889 844 John Kyrle H Sch & 6th F Cen Ross-on-Wye Comp 0.24 441 219 74 2.0 2.7 655 1568 933 789 27 1.0 11 51 70 892 -45
674 891 John Masefi eld High School Ledbury Comp 0.76 445 230 53 1.9 2.6 781 862 724 27 1.2 13 52 46 654 217291 389 King’s School Worcester Ind 2.37 564 248 107 2.3 3.1 880 416 210 251 55 1.8 33 44 107 301 98974 492 Lady Hawkins High School Kington Comp 0.06 483 208 22 2.3 2.7 661 1533 805 20 0.9 14 68 22 1043 -482239 303 Malvern College (IB) Malvern Ind 2.69 655 240 160 2.7 3.1 980 177 368 501 45 2.0 35 35 66 242 6480 109 Malvern St James Malvern Ind 3.81 724 254 79 2.8 3.2 928 289 148 99 68 2.5 54 100 79 88 29
510 745 Malvern, The Chase Malvern Comp 1.34 541 228 137 2.4 2.9 820 671 568 777 29 1.4 21 60 131 496 235935 Pershore High School Pershore Comp 0.14 415 221 99 1.9 2.6 782 859 822 23 0.9 7 57 96 1148545 661 Prince Henry’s High School Evesham Comp 1.15 523 227 159 2.3 2.8 832 591 757 891 28 1.3 16 58 159 623 116288 265 Royal Grammar School Worcester Ind 2.38 596 242 100 2.5 3.1 844 540 256 252 48 1.9 26 22 100 294 -23848 922 Worcester Sixth Form Col Worcester 6th 0.34 417 225 642 1.9 2.6 762 971 770 809 29 1.0 13 58 549 907 74Hertfordshire 479 191 98 2.1 2.7 751 1.1804 615 John Henry Newman RC Sch Stevenage Comp 0.44 486 216 116 2.2 2.7 698 1323 887 669 20 1.0 10 48 109 959 -189
554 971 Aldenham School Boreham-wood Ind 1.11 488 231 53 2.1 3.1 732 1124 614 935 38 1.4 15 11 53 543 417
881 776 Beaumont School St Albans Comp 0.26 438 220 124 2.0 2.8 735 1112 868 688 21 1.0 9 50 124 965 -105253 211 Berkhamsted Collegiate Sch Berkhamsted Ind 2.62 598 248 135 2.4 3.1 918 312 168 175 53 1.9 30 39 135 259 -42635 899 Bishop’s Hatfi eld Girls’ Sch Hatfi eld Comp 0.87 474 228 51 2.1 2.7 756 998 790 967 22 1.2 14 100 51 658 264
185 279 Bishop’s Stortford College Bishop’s S’ford Ind 2.96 619 252 79 2.5 3.4 897 366 131 235 59 2.1 41 32 79 217 94
528 520 Bishop’s Stortford H Sch Bishop’s S’ford Comp 1.24 472 237 136 2.0 2.7 836 575 571 628 38 1.4 18 31 131 552 -8
784 622 Broxbourne School Broxbourne Comp 0.49 471 220 99 2.1 2.8 983 174 695 775 26 1.1 14 57 98 752 -162246 174 Dame Alice Owen’s School Potters Bar Comp 2.66 642 242 192 2.7 3.0 836 571 290 266 47 2.0 34 54 192 246 -72987 Freman College Buntingford Comp 0.03 394 222 76 1.8 2.7 878 420 502 643 26 0.9 12 51 76 101723 21 Haberdashers’ Aske’s S, Boys Elstree Ind 4.74 824 259 155 3.2 3.2 946 244 43 39 73 2.9 67 0 155 25 -2
22 37 Haberdashers’ Aske’s Sch, Girls Elstree Ind 4.75 802 263 116 3.1 3.2 955 221 27 31 83 2.9 75 100 116 29 15
243 178 Haileybury & Imp Serv Coll (IB) Hertford Ind 2.67 644 241 145 2.7 3.1 933 273 384 413 43 2.0 27 44 89 228 -65
784 Hemel Hempstead School Hemel Hempstd Comp 0.49 468 220 104 2.1 2.8 853 500 834 30 1.2 14 45 104 718
969 690 Hertf’dshire & Essex H Sch Bishop’s S’ford Comp 0.07 431 217 95 2.0 2.6 732 1125 857 837 25 1.0 9 79 95 937 -279
889 Highfi eld School Letchworth Comp 0.24 416 223 65 1.9 2.9 768 927 982 31 1.0 9 51 65 948526 513 Hitchin Girls’ School Hitchin Comp 1.25 544 225 100 2.4 2.9 803 751 788 776 25 1.3 16 100 99 562 -13243 133 Immanuel College Bushey Ind 2.67 664 238 57 2.8 3.0 792 820 347 166 43 2.0 30 42 57 223 -110
756 John F Kennedy Catholic School
Hemel Hempstd Comp 0.56 486 219 97 2.2 2.9 715 1219 968 27 1.1 12 52 97 751
994 979 Knights Templar School Baldock Comp 0.00 436 215 135 2.0 2.8 703 1291 796 21 0.9 9 50 131 1013 -15885 772 Leventhorpe School Sawbridgew’th Comp 0.25 458 217 124 2.1 2.8 788 835 707 739 23 1.1 11 58 121 809 -113406 420 Loreto College St Albans Comp 1.74 563 233 82 2.4 2.8 932 276 415 446 32 1.5 21 100 82 455 1423 42 Merchant Taylors’ School Northwood Ind 4.74 812 261 117 3.1 3.3 1136 21 10 22 77 3.0 68 0 117 22 19
862 Monks Walk School Welwyn Gard C Comp 0.32 469 216 78 2.2 2.7 706 1268 21 1.1 13 47 78 855
956 Nicholas Breakspear Cath Sch St Albans Comp 0.09 440 216 57 2.0 2.9 666 1505 19 0.9 8 51 53 1009254 338 Parmiter’s School Watford Comp 2.61 621 244 135 2.5 3.1 853 500 286 367 42 2.0 25 47 135 233 84564 435 Presdales School Ware Comp 1.08 518 226 101 2.3 2.8 748 1044 669 463 28 1.3 12 99 98 600 -129128 294 Purcell School Bushey Ind 3.36 658 255 36 2.6 2.9 813 705 162 259 67 2.2 31 56 36 164 166621 501 Queens’ School Bushey Comp 0.91 475 229 126 2.1 2.7 699 1321 785 700 31 1.2 11 50 118 673 -120123 124 Queenswood School Hatfi eld Ind 3.38 676 252 56 2.7 3.2 915 321 117 112 56 2.4 30 100 56 110 1480 751 Roundwood Park School Harpenden Comp 1.41 539 230 114 2.3 2.8 931 277 550 626 33 1.5 18 47 112 451 271465 392 Royal Masonic School for Girls Rickmansw’th Ind 1.47 457 245 94 1.9 2.6 794 800 326 241 45 1.5 17 100 92 442 -73816 461 St Albans Girls’ School St Albans Comp 0.42 439 224 104 2.0 2.9 747 1048 672 403 26 1.0 11 100 104 858 -355110 96 St Albans High School for Girls St Albans Ind 3.46 686 253 78 2.7 3.2 908 340 120 108 64 2.3 42 100 77 116 -1484 101 St Albans School St Albans Ind 3.72 702 256 105 2.7 3.2 1054 73 48 89 65 2.5 45 15 105 82 17
728 591 St Christopher School Letchworth Ind 0.61 467 223 44 2.1 2.9 697 1324 602 481 23 1.2 7 40 43 721 -137598 St Clement Danes School Chorleywood Comp 0.98 439 236 120 1.9 2.7 696 1331 465 36 1.3 14 59 120 604209 495 St Columba’s College St Albans Ind 2.82 640 245 51 2.6 3.1 923 300 291 893 52 2.0 35 0 51 251 286448 402 St Edmund’s College Ware Ind 1.55 573 227 48 2.5 3.3 805 739 555 478 32 1.6 19 31 48 429 -46465 151 St Francis College Letchworth Ind 1.47 560 228 24 2.5 3.1 826 630 427 153 32 1.6 17 100 24 404 -314
Top 1,000 Schools
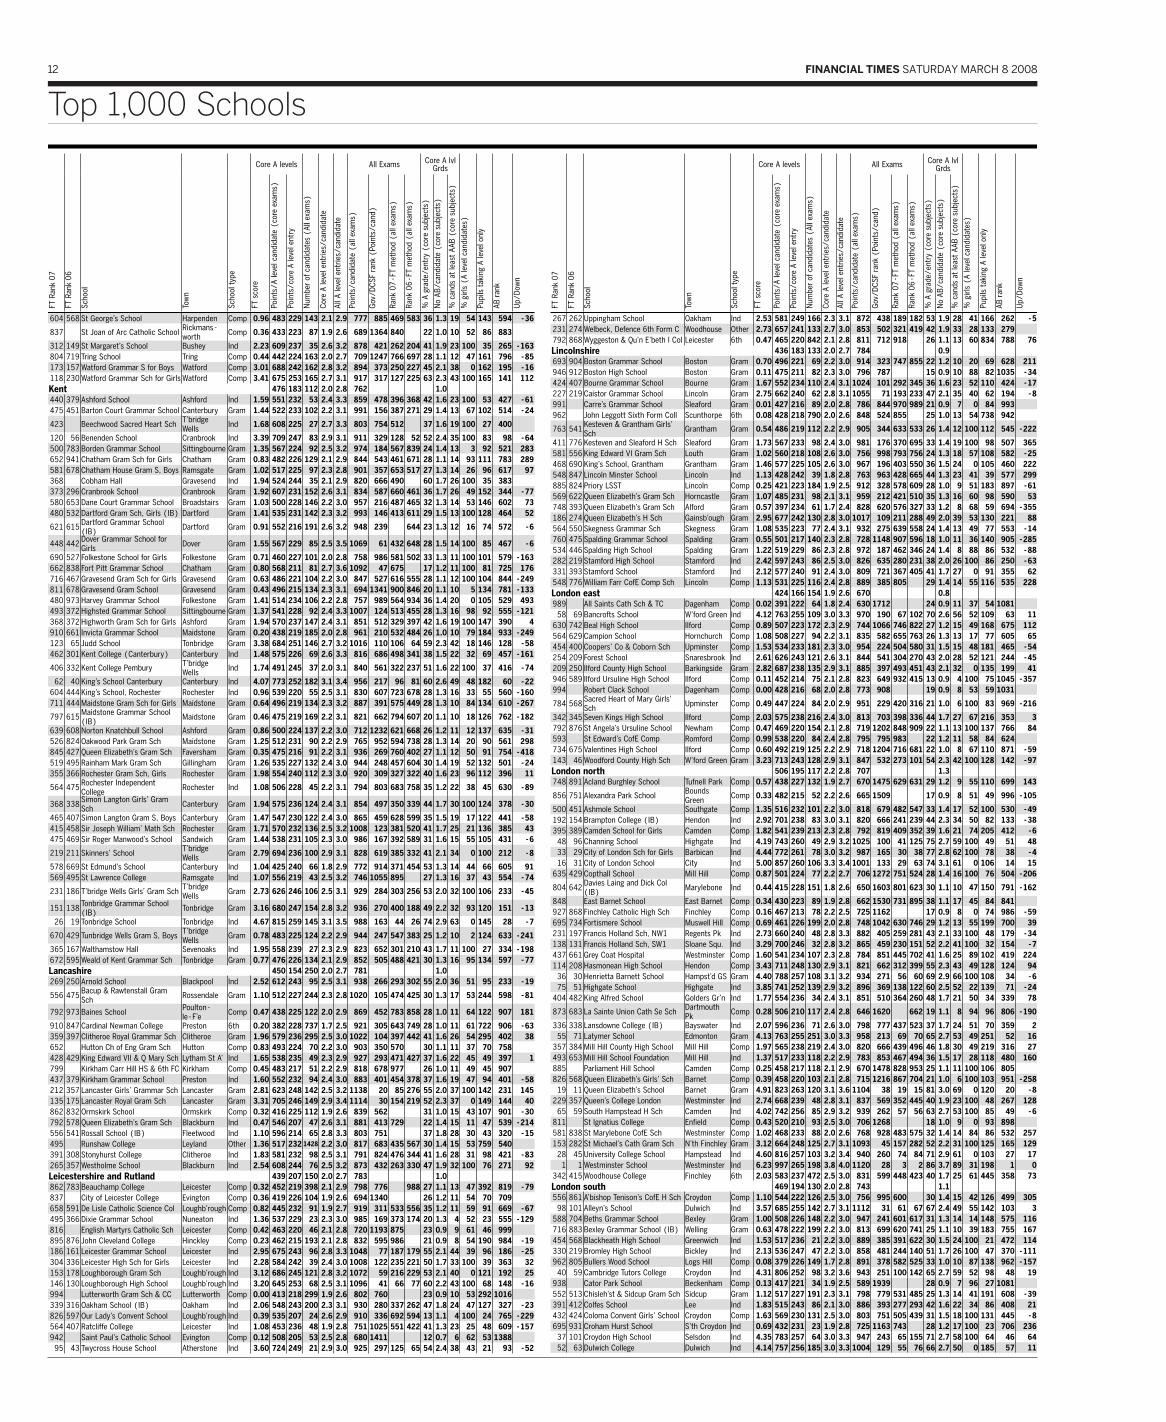
12 FINANCIAL TIMES SATURDAY MARCH 8 2008
Core A levels All Exams Core A lvl Grds
FT R
ank
07
FT R
ank
06
Scho
ol
Tow
n
Scho
ol ty
pe
FT s
core
Poin
ts/A
leve
l can
dida
te (
core
exa
ms)
Poin
ts/c
ore
A le
vel e
ntry
Num
ber
of c
andi
date
s (A
ll ex
ams)
Core
A le
vel e
ntrie
s/ca
ndid
ate
All A
leve
l ent
ries/
cand
idat
e
Poin
ts/c
andi
date
(al
l exa
ms)
Gov
/DCS
F ra
nk (
Poin
ts/c
and)
Rank
07-
FT m
etho
d (a
ll ex
ams)
Rank
06-
FT m
etho
d (a
ll ex
ams)
% A
gra
de/e
ntry
(co
re s
ubje
cts)
No
AB/c
andi
date
(co
re s
ubje
cts)
% c
ands
at
leas
t AA
B (c
ore
subj
ects
)
% g
irls
(A le
vel c
andi
date
s)
Pupi
ls t
akin
g A
leve
l onl
y
AB r
ank
Up/
Dow
n
604 568 St George’s School Harpenden Comp 0.96 483 229 143 2.1 2.9 777 885 469 583 36 1.3 19 54 143 594 -36
837 St Joan of Arc Catholic School Rickmans-worth Comp 0.36 433 223 87 1.9 2.6 689 1364 840 22 1.0 10 52 86 883
312 149 St Margaret’s School Bushey Ind 2.23 609 237 35 2.6 3.2 878 421 262 204 41 1.9 23 100 35 265 -163804 719 Tring School Tring Comp 0.44 442 224 163 2.0 2.7 709 1247 766 697 28 1.1 12 47 161 796 -85173 157 Watford Grammar S for Boys Watford Comp 3.01 688 242 162 2.8 3.2 894 373 250 227 45 2.1 38 0 162 195 -16118 230 Watford Grammar Sch for Girls Watford Comp 3.41 675 253 165 2.7 3.1 917 317 127 225 63 2.3 43 100 165 141 112Kent 476 183 112 2.0 2.8 762 1.0440 379 Ashford School Ashford Ind 1.59 551 232 53 2.4 3.3 859 478 396 368 42 1.6 23 100 53 427 -61475 451 Barton Court Grammar School Canterbury Gram 1.44 522 233 102 2.2 3.1 991 156 387 271 29 1.4 13 67 102 514 -24
423 Beechwood Sacred Heart Sch T’bridge Wells Ind 1.68 608 225 27 2.7 3.3 803 754 512 37 1.6 19 100 27 400
120 56 Benenden School Cranbrook Ind 3.39 709 247 83 2.9 3.1 911 329 128 52 52 2.4 35 100 83 98 -64500 783 Borden Grammar School Sittingbourne Gram 1.35 567 224 92 2.5 3.2 974 184 567 839 24 1.4 13 3 92 521 283652 941 Chatham Gram Sch for Girls Chatham Gram 0.83 482 226 129 2.1 2.9 844 543 461 671 28 1.1 14 93 111 783 289581 678 Chatham House Gram S, Boys Ramsgate Gram 1.02 517 225 97 2.3 2.8 901 357 653 517 27 1.3 14 26 96 617 97368 Cobham Hall Gravesend Ind 1.94 524 244 35 2.1 2.9 820 666 490 60 1.7 26 100 35 383373 296 Cranbrook School Cranbrook Gram 1.92 607 231 152 2.6 3.1 834 587 660 461 36 1.7 26 49 152 344 -77580 653 Dane Court Grammar School Broadstairs Gram 1.03 500 228 146 2.2 3.0 957 216 487 465 32 1.3 14 53 146 602 73480 532 Dartford Gram Sch, Girls (IB) Dartford Gram 1.41 535 231 142 2.3 3.2 993 146 413 611 29 1.5 13 100 128 464 52
621 615 Dartford Grammar School (IB) Dartford Gram 0.91 552 216 191 2.6 3.2 948 239 644 23 1.3 12 16 74 572 -6
448 442 Dover Grammar School for Girls Dover Gram 1.55 567 229 85 2.5 3.5 1069 61 432 648 28 1.5 14 100 85 467 -6
690 527 Folkestone School for Girls Folkestone Gram 0.71 460 227 101 2.0 2.8 758 986 581 502 33 1.3 11 100 101 579 -163662 838 Fort Pitt Grammar School Chatham Gram 0.80 568 211 81 2.7 3.6 1092 47 675 17 1.2 11 100 81 725 176716 467 Gravesend Gram Sch for Girls Gravesend Gram 0.63 486 221 104 2.2 3.0 847 527 616 555 28 1.1 12 100 104 844 -249811 678 Gravesend Gram School Gravesend Gram 0.43 496 215 134 2.3 3.1 694 1341 900 846 20 1.1 10 5 134 781 -133480 973 Harvey Grammar School Folkestone Gram 1.41 514 234 106 2.2 2.8 757 989 564 934 36 1.4 20 0 105 529 493493 372 Highsted Grammar School Sittingbourne Gram 1.37 541 228 92 2.4 3.3 1007 124 513 455 28 1.3 16 98 92 555 -121368 372 Highworth Gram Sch for Girls Ashford Gram 1.94 570 237 147 2.4 3.1 851 512 329 397 42 1.6 19 100 147 390 4910 661 Invicta Grammar School Maidstone Gram 0.20 438 219 185 2.0 2.8 961 210 532 484 26 1.0 10 79 184 933 -249123 65 Judd School Tonbridge Gram 3.38 684 251 146 2.7 3.2 1016 110 106 64 59 2.3 42 18 146 128 -58462 301 Kent College (Canterbury) Canterbury Ind 1.48 575 226 69 2.6 3.3 816 686 498 341 38 1.5 22 32 69 457 -161
406 332 Kent College Pembury T’bridge Wells Ind 1.74 491 245 37 2.0 3.1 840 561 322 237 51 1.6 22 100 37 416 -74
62 40 King’s School Canterbury Canterbury Ind 4.07 773 252 182 3.1 3.4 956 217 96 81 60 2.6 49 48 182 60 -22604 444 King’s School, Rochester Rochester Ind 0.96 539 220 55 2.5 3.1 830 607 723 678 28 1.3 16 33 55 560 -160711 444 Maidstone Gram Sch for Girls Maidstone Gram 0.64 496 219 134 2.3 3.2 887 391 575 449 28 1.3 10 84 134 610 -267
797 615 Maidstone Grammar School (IB) Maidstone Gram 0.46 475 219 169 2.2 3.1 821 662 794 607 20 1.1 10 18 126 762 -182
639 608 Norton Knatchbull School Ashford Gram 0.86 500 224 137 2.2 3.0 712 1232 621 668 26 1.2 11 12 137 635 -31526 824 Oakwood Park Gram Sch Maidstone Gram 1.25 512 231 90 2.2 2.9 765 952 594 738 28 1.3 14 20 90 561 298845 427 Queen Elizabeth’s Gram Sch Faversham Gram 0.35 475 216 91 2.2 3.1 936 269 760 402 27 1.1 12 50 91 754 -418519 495 Rainham Mark Gram Sch Gillingham Gram 1.26 535 227 132 2.4 3.0 944 248 457 604 30 1.4 19 52 132 501 -24355 366 Rochester Gram Sch, Girls Rochester Gram 1.98 554 240 112 2.3 3.0 920 309 327 322 40 1.6 23 96 112 396 11
564 475 Rochester Independent College Rochester Ind 1.08 506 228 45 2.2 3.1 794 803 683 758 35 1.2 22 38 45 630 -89
368 338 Simon Langton Girls’ Gram Sch Canterbury Gram 1.94 575 236 124 2.4 3.1 854 497 350 339 44 1.7 30 100 124 378 -30
465 407 Simon Langton Gram S, Boys Canterbury Gram 1.47 547 230 122 2.4 3.0 865 459 628 599 35 1.5 19 17 122 441 -58415 458 Sir Joseph William’ Math Sch Rochester Gram 1.71 570 232 136 2.5 3.2 1008 123 381 520 41 1.7 25 21 136 385 43475 469 Sir Roger Manwood’s School Sandwich Gram 1.44 538 231 105 2.3 3.0 986 167 392 589 31 1.6 15 55 105 431 -6
219 211 Skinners’ School T’bridge Wells Gram 2.79 694 236 100 2.9 3.1 828 619 385 332 41 2.1 34 0 100 212 -8
578 669 St Edmund’s School Canterbury Ind 1.04 425 240 66 1.8 2.9 772 914 371 454 53 1.3 14 44 66 605 91569 495 St Lawrence College Ramsgate Ind 1.07 556 219 43 2.5 3.2 746 1055 895 27 1.3 16 37 43 554 -74
231 186 T’bridge Wells Girls’ Gram Sch T’bridge Wells Gram 2.73 626 246 106 2.5 3.1 929 284 303 256 53 2.0 32 100 106 233 -45
151 138 Tonbridge Grammar School (IB) Tonbridge Gram 3.16 680 247 154 2.8 3.2 936 270 400 188 49 2.2 32 93 120 151 -13
26 19 Tonbridge School Tonbridge Ind 4.67 815 259 145 3.1 3.5 988 163 44 26 74 2.9 63 0 145 28 -7
670 429 Tunbridge Wells Gram S, Boys T’bridge Wells Gram 0.78 483 225 124 2.2 2.9 944 247 547 383 25 1.2 10 2 124 633 -241
365 167 Walthamstow Hall Sevenoaks Ind 1.95 558 239 27 2.3 2.9 823 652 301 210 43 1.7 11 100 27 334 -198672 595 Weald of Kent Grammar Sch Tonbridge Gram 0.77 476 226 134 2.1 2.9 852 505 488 421 30 1.3 16 95 134 597 -77Lancashire 450 154 250 2.0 2.7 781 1.0269 250 Arnold School Blackpool Ind 2.52 612 243 95 2.5 3.1 938 266 293 302 55 2.0 36 51 95 233 -19
556 475 Bacup & Rawtenstall Gram Sch Rossendale Gram 1.10 512 227 244 2.3 2.8 1020 105 474 425 30 1.3 17 53 244 598 -81
792 973 Baines School Poulton-le-F’e Comp 0.47 438 225 122 2.0 2.9 869 452 783 858 28 1.0 11 64 122 907 181
910 847 Cardinal Newman College Preston 6th 0.20 382 228 737 1.7 2.5 921 305 643 749 28 1.0 11 61 722 906 -63359 397 Clitheroe Royal Grammar Sch Clitheroe Gram 1.96 579 236 295 2.5 3.0 1022 104 397 442 41 1.6 26 54 295 402 38652 Hutton Ch of Eng Gram Sch Hutton Comp 0.83 493 224 70 2.2 3.0 903 350 570 30 1.1 11 37 70 758428 429 King Edward VII & Q Mary Sch Lytham St A’ Ind 1.65 538 235 49 2.3 2.9 927 293 471 427 37 1.6 22 45 49 397 1799 Kirkham Carr Hill HS & 6th FC Kirkham Comp 0.45 483 217 51 2.2 2.9 818 678 977 26 1.0 11 49 45 907437 379 Kirkham Grammar School Preston Ind 1.60 552 232 94 2.4 3.0 883 401 454 378 37 1.6 19 47 94 401 -58212 357 Lancaster Girls’ Grammar Sch Lancaster Gram 2.81 623 248 142 2.5 3.2 1138 20 85 276 55 2.0 37 100 142 231 145135 175 Lancaster Royal Gram Sch Lancaster Gram 3.31 705 246 149 2.9 3.4 1114 30 154 219 52 2.3 37 0 149 144 40862 832 Ormskirk School Ormskirk Comp 0.32 416 225 112 1.9 2.6 839 562 31 1.0 15 43 107 901 -30792 578 Queen Elizabeth’s Gram Sch Blackburn Ind 0.47 546 207 47 2.6 3.1 881 413 729 22 1.4 15 11 47 539 -214556 541 Rossall School (IB) Fleetwood Ind 1.10 596 214 65 2.8 3.3 803 751 37 1.8 28 30 43 320 -15495 Runshaw College Leyland Other 1.36 517 232 1428 2.2 3.0 817 683 435 567 30 1.4 15 53 759 540391 308 Stonyhurst College Clitheroe Ind 1.83 581 232 98 2.5 3.1 791 824 476 344 41 1.6 28 31 98 421 -83265 357 Westholme School Blackburn Ind 2.54 608 244 76 2.5 3.2 873 432 263 330 47 1.9 32 100 76 271 92Leicestershire and Rutland 439 207 150 2.0 2.7 783 1.0862 783 Beauchamp College Leicester Comp 0.32 452 219 398 2.1 2.9 798 776 988 27 1.1 13 47 392 819 -79837 City of Leicester College Evington Comp 0.36 419 226 104 1.9 2.6 694 1340 26 1.2 11 54 70 709658 591 De Lisle Catholic Science Col Loughb’rough Comp 0.82 445 232 91 1.9 2.7 919 311 533 556 35 1.2 11 59 91 669 -67495 366 Dixie Grammar School Nuneaton Ind 1.36 537 229 23 2.3 3.0 985 169 373 174 20 1.3 4 52 23 555 -129816 English Martyrs Catholic Sch Leicester Comp 0.42 463 220 46 2.1 2.8 720 1193 875 23 0.9 9 61 46 999895 876 John Cleveland College Hinckley Comp 0.23 462 215 193 2.1 2.8 832 595 986 21 0.9 8 54 190 984 -19186 161 Leicester Grammar School Leicester Ind 2.95 675 243 96 2.8 3.3 1048 77 187 179 55 2.1 44 39 96 186 -25304 336 Leicester High Sch for Girls Leicester Ind 2.28 584 242 39 2.4 3.0 1008 122 235 221 50 1.7 33 100 39 363 32153 178 Loughborough Gram Sch Loughb’rough Ind 3.12 686 245 121 2.8 3.2 1072 59 216 229 53 2.1 40 0 121 192 25146 130 Loughborough High School Loughb’rough Ind 3.20 645 253 68 2.5 3.1 1096 41 66 77 60 2.2 43 100 68 148 -16994 Lutterworth Gram Sch & CC Lutterworth Comp 0.00 413 218 299 1.9 2.6 802 760 23 0.9 10 53 292 1016339 316 Oakham School (IB) Oakham Ind 2.06 548 243 200 2.3 3.1 930 280 337 262 47 1.8 24 47 127 327 -23826 597 Our Lady’s Convent School Loughb’rough Ind 0.39 535 207 24 2.6 2.9 910 336 692 594 13 1.1 4 100 24 765 -229564 407 Ratcliffe College Leicester Ind 1.08 453 236 48 1.9 2.8 751 1025 551 422 41 1.3 23 25 48 609 -157942 Saint Paul’s Catholic School Evington Comp 0.12 508 205 53 2.5 2.8 680 1411 12 0.7 6 62 53 138895 43 Twycross House School Atherstone Ind 3.60 724 249 21 2.9 3.0 925 297 125 65 54 2.4 38 43 21 93 -52
Core A levels All Exams Core A lvl Grds
FT R
ank
07
FT R
ank
06
Scho
ol
Tow
n
Scho
ol ty
pe
FT s
core
Poin
ts/A
leve
l can
dida
te (
core
exa
ms)
Poin
ts/c
ore
A le
vel e
ntry
Num
ber
of c
andi
date
s (A
ll ex
ams)
Core
A le
vel e
ntrie
s/ca
ndid
ate
All A
leve
l ent
ries/
cand
idat
e
Poin
ts/c
andi
date
(al
l exa
ms)
Gov
/DCS
F ra
nk (
Poin
ts/c
and)
Rank
07-
FT m
etho
d (a
ll ex
ams)
Rank
06-
FT m
etho
d (a
ll ex
ams)
% A
gra
de/e
ntry
(co
re s
ubje
cts)
No
AB/c
andi
date
(co
re s
ubje
cts)
% c
ands
at
leas
t AA
B (c
ore
subj
ects
)
% g
irls
(A le
vel c
andi
date
s)
Pupi
ls t
akin
g A
leve
l onl
y
AB r
ank
Up/
Dow
n
267 262 Uppingham School Oakham Ind 2.53 581 249 166 2.3 3.1 872 438 189 182 53 1.9 28 41 166 262 -5231 274 Welbeck, Defence 6th Form C Woodhouse Other 2.73 657 241 133 2.7 3.0 853 502 321 419 42 1.9 33 28 133 279792 868 Wyggeston & Qu’n E’beth I Col Leicester 6th 0.47 465 220 842 2.1 2.8 811 712 918 26 1.1 13 60 834 788 76Lincolnshire 436 183 133 2.0 2.7 784 0.9693 904 Boston Grammar School Boston Gram 0.70 496 221 69 2.2 3.0 914 323 747 855 22 1.2 10 20 69 628 211946 912 Boston High School Boston Gram 0.11 475 211 82 2.3 3.0 796 787 15 0.9 10 88 82 1035 -34424 407 Bourne Grammar School Bourne Gram 1.67 552 234 110 2.4 3.1 1024 101 292 345 36 1.6 23 52 110 424 -17227 219 Caistor Grammar School Lincoln Gram 2.75 662 240 62 2.8 3.1 1055 71 193 233 47 2.1 35 40 62 194 -8991 Carre’s Grammar School Sleaford Gram 0.01 427 216 89 2.0 2.8 786 844 970 989 21 0.9 7 0 84 993962 John Leggott Sixth Form Coll Scunthorpe 6th 0.08 428 218 790 2.0 2.6 848 524 855 25 1.0 13 54 738 942
763 541 Kesteven & Grantham Girls’ Sch Grantham Gram 0.54 486 219 112 2.2 2.9 905 344 633 533 26 1.4 12 100 112 545 -222
411 776 Kesteven and Sleaford H Sch Sleaford Gram 1.73 567 233 98 2.4 3.0 981 176 370 695 33 1.4 19 100 98 507 365581 556 King Edward VI Gram Sch Louth Gram 1.02 560 218 108 2.6 3.0 756 998 793 756 24 1.3 18 57 108 582 -25468 690 King’s School, Grantham Grantham Gram 1.46 577 225 105 2.6 3.0 967 196 403 550 36 1.5 24 0 105 460 222548 847 Lincoln Minster School Lincoln Ind 1.13 428 242 39 1.8 2.8 763 963 428 665 44 1.3 23 41 39 577 299885 824 Priory LSST Lincoln Comp 0.25 421 223 184 1.9 2.5 912 328 578 609 28 1.0 9 51 183 897 -61569 622 Queen Elizabeth’s Gram Sch Horncastle Gram 1.07 485 231 98 2.1 3.1 959 212 421 510 35 1.3 16 60 98 590 53748 393 Queen Elizabeth’s Gram Sch Alford Gram 0.57 397 234 61 1.7 2.4 828 620 576 327 33 1.2 8 68 59 694 -355186 274 Queen Elizabeth’s H Sch Gainsb’ough Gram 2.95 677 242 130 2.8 3.0 1017 109 211 288 49 2.0 39 53 130 221 88564 550 Skegness Grammar Sch Skegness Gram 1.08 535 223 77 2.4 3.1 932 275 639 558 24 1.4 13 49 77 553 -14760 475 Spalding Grammar School Spalding Gram 0.55 501 217 140 2.3 2.8 728 1148 907 596 18 1.0 11 36 140 905 -285534 446 Spalding High School Spalding Gram 1.22 519 229 86 2.3 2.8 972 187 462 346 24 1.4 8 88 86 532 -88282 219 Stamford High School Stamford Ind 2.42 597 243 86 2.5 3.0 826 635 280 231 38 2.0 26 100 86 250 -63331 393 Stamford School Stamford Ind 2.12 577 240 91 2.4 3.0 809 721 367 405 41 1.7 27 0 91 355 62548 776 William Farr CofE Comp Sch Lincoln Comp 1.13 531 225 116 2.4 2.8 889 385 805 29 1.4 14 55 116 535 228London east 424 166 154 1.9 2.6 670 0.8989 All Saints Cath Sch & TC Dagenham Comp 0.02 391 222 64 1.8 2.4 630 1712 24 0.9 11 37 54 108158 69 Bancrofts School W’ford Green Ind 4.12 763 255 109 3.0 3.3 970 190 67 102 70 2.6 56 52 109 63 11
630 742 Beal High School Ilford Comp 0.89 507 223 172 2.3 2.9 744 1066 746 822 27 1.2 15 49 168 675 112564 629 Campion School Hornchurch Comp 1.08 508 227 94 2.2 3.1 835 582 655 763 26 1.3 13 17 77 605 65454 400 Coopers’ Co & Coborn Sch Upminster Comp 1.53 534 233 181 2.3 3.0 954 224 504 580 31 1.5 15 48 181 465 -54254 209 Forest School Snaresbrook Ind 2.61 626 243 121 2.6 3.1 844 541 304 270 43 2.0 28 52 121 244 -45209 250 Ilford County High School Barkingside Gram 2.82 687 238 135 2.9 3.1 885 397 493 451 43 2.1 32 0 135 199 41946 589 Ilford Ursuline High School Ilford Comp 0.11 452 214 75 2.1 2.8 823 649 932 415 13 0.9 4 100 75 1045 -357994 Robert Clack School Dagenham Comp 0.00 428 216 68 2.0 2.8 773 908 19 0.9 8 53 59 1031
784 568 Sacred Heart of Mary Girls’ Sch Upminster Comp 0.49 447 224 84 2.0 2.9 951 229 420 316 21 1.0 6 100 83 969 -216
342 345 Seven Kings High School Ilford Comp 2.03 575 238 216 2.4 3.0 813 703 398 336 44 1.7 27 67 216 353 3792 876 St Angela’s Ursuline School Newham Comp 0.47 469 220 154 2.1 2.8 719 1202 848 909 22 1.1 13 100 137 766 84593 St Edward’s CofE Comp Romford Comp 0.99 538 220 84 2.4 2.8 795 795 983 22 1.2 11 58 84 624734 675 Valentines High School Ilford Comp 0.60 492 219 125 2.2 2.9 718 1204 716 681 22 1.0 8 67 110 871 -59143 46 Woodford County High Sch W’ford Green Gram 3.23 713 243 128 2.9 3.1 847 532 273 101 54 2.3 42 100 128 142 -97London north 506 195 117 2.2 2.8 707 1.3748 891 Acland Burghley School Tufnell Park Comp 0.57 438 227 132 1.9 2.7 670 1475 629 631 29 1.2 9 55 110 699 143
856 751 Alexandra Park School Bounds Green Comp 0.33 482 215 52 2.2 2.6 665 1509 17 0.9 8 51 49 996 -105
500 451 Ashmole School Southgate Comp 1.35 516 232 101 2.2 3.0 818 679 482 547 33 1.4 17 52 100 530 -49192 154 Brampton College (IB) Hendon Ind 2.92 701 238 83 3.0 3.1 820 666 241 239 44 2.3 34 50 82 133 -38395 389 Camden School for Girls Camden Comp 1.82 541 239 213 2.3 2.8 792 819 409 352 39 1.6 21 74 205 412 -648 96 Channing School Highgate Ind 4.19 743 260 49 2.9 3.2 1025 100 41 125 75 2.7 59 100 49 51 4833 29 City of London Sch for Girls Barbican Ind 4.44 772 261 78 3.0 3.2 987 165 30 38 77 2.8 62 100 78 38 -416 31 City of London School City Ind 5.00 857 260 106 3.3 3.4 1001 133 29 63 74 3.1 61 0 106 14 15
635 429 Copthall School Mill Hill Comp 0.87 501 224 77 2.2 2.7 706 1272 751 524 28 1.4 16 100 76 504 -206
804 642 Davies Laing and Dick Col (IB) Marylebone Ind 0.44 415 228 151 1.8 2.6 650 1603 801 623 30 1.1 10 47 150 791 -162
848 East Barnet School East Barnet Comp 0.34 430 223 89 1.9 2.8 662 1530 731 895 38 1.1 17 45 84 841927 868 Finchley Catholic High Sch Finchley Comp 0.16 467 213 78 2.2 2.5 725 1162 17 0.9 8 0 74 986 -59695 734 Fortismere School Muswell Hill Comp 0.69 461 226 199 2.0 2.8 748 1042 630 746 29 1.2 13 55 199 700 39231 197 Francis Holland Sch, NW1 Regents Pk Ind 2.73 660 240 48 2.8 3.3 882 405 259 281 43 2.1 33 100 48 179 -34138 131 Francis Holland Sch, SW1 Sloane Squ. Ind 3.29 700 246 32 2.8 3.2 865 459 230 151 52 2.2 41 100 32 154 -7437 661 Grey Coat Hospital Westminster Comp 1.60 541 234 107 2.3 2.8 784 851 445 702 41 1.6 25 89 102 419 224114 208 Hasmonean High School Hendon Comp 3.43 711 248 130 2.9 3.1 821 662 312 399 55 2.3 43 49 128 124 9436 30 Henrietta Barnett School Hampst’d GS Gram 4.40 788 257 108 3.1 3.2 934 271 56 60 69 2.9 66 100 108 34 -675 51 Highgate School Highgate Ind 3.85 741 252 139 2.9 3.2 896 369 138 122 60 2.5 52 22 139 71 -24
404 482 King Alfred School Golders Gr’n Ind 1.77 554 236 34 2.4 3.1 851 510 364 260 48 1.7 21 50 34 339 78
873 683 La Sainte Union Cath Se Sch Dartmouth Pk Comp 0.28 506 210 117 2.4 2.8 646 1620 662 19 1.1 8 94 96 806 -190
336 338 Lansdowne College (IB) Bayswater Ind 2.07 596 236 71 2.6 3.0 798 777 437 523 37 1.7 24 51 70 359 255 71 Latymer School Edmonton Gram 4.13 763 255 251 3.0 3.3 958 213 69 70 65 2.7 53 49 251 52 16
357 384 Mill Hill County High School Mill Hill Comp 1.97 565 238 219 2.4 3.0 820 666 439 496 46 1.8 30 49 219 316 27493 653 Mill Hill School Foundation Mill Hill Ind 1.37 517 233 118 2.2 2.9 783 853 467 494 36 1.5 17 28 118 480 160885 Parliament Hill School Camden Comp 0.25 458 217 118 2.1 2.9 670 1478 828 953 25 1.1 11 100 106 805826 568 Queen Elizabeth’s Girls’ Sch Barnet Comp 0.39 458 220 103 2.1 2.8 715 1216 867 704 21 1.0 6 100 103 951 -25819 11 Queen Elizabeth’s School Barnet Gram 4.91 823 263 120 3.1 3.6 1104 38 19 15 81 3.0 69 0 120 20 -8
229 357 Queen’s College London Westminster Ind 2.74 668 239 48 2.8 3.1 837 569 352 445 40 1.9 23 100 48 267 12865 59 South Hampstead H Sch Camden Ind 4.02 742 256 85 2.9 3.2 939 262 57 56 63 2.7 53 100 85 49 -6
811 St Ignatius College Enfi eld Comp 0.43 520 210 93 2.5 3.0 706 1268 18 1.0 9 0 93 898581 838 St Marylebone CofE Sch Westminster Comp 1.02 468 233 88 2.0 2.6 768 928 483 575 32 1.4 14 84 86 532 257153 282 St Michael’s Cath Gram Sch N’th Finchley Gram 3.12 664 248 125 2.7 3.1 1093 45 157 282 52 2.2 31 100 125 165 12928 45 University College School Hampstead Ind 4.60 816 257 103 3.2 3.4 940 260 74 84 71 2.9 61 0 103 27 171 1 Westminster School Westminster Ind 6.23 997 265 198 3.8 4.0 1120 28 3 2 86 3.7 89 31 198 1 0
342 415 Woodhouse College Finchley 6th 2.03 583 237 472 2.5 3.0 831 599 448 423 40 1.7 25 61 445 358 73London south 469 194 130 2.0 2.8 743 1.1556 861 A’bishop Tenison’s CofE H Sch Croydon Comp 1.10 544 222 126 2.5 3.0 756 995 600 30 1.4 15 42 126 499 30598 101 Alleyn’s School Dulwich Ind 3.57 685 255 142 2.7 3.1 1112 31 61 67 67 2.4 49 55 142 103 3
588 704 Beths Grammar School Bexley Gram 1.00 508 226 148 2.2 3.0 947 241 601 617 31 1.3 14 14 148 575 116716 883 Bexley Grammar School (IB) Welling Gram 0.63 478 222 199 2.2 3.0 813 699 620 741 25 1.1 10 39 183 755 167454 568 Blackheath High School Greenwich Ind 1.53 517 236 21 2.2 3.0 889 385 391 622 30 1.5 24 100 21 472 114330 219 Bromley High School Bickley Ind 2.13 536 247 47 2.2 3.0 858 481 244 140 51 1.7 26 100 47 370 -111962 805 Bullers Wood School Logs Hill Comp 0.08 379 226 149 1.7 2.8 891 378 582 525 33 1.0 10 87 138 962 -15740 59 Cambridge Tutors College Croydon Ind 4.31 806 252 98 3.2 3.6 943 251 100 142 65 2.7 59 52 98 48 19
938 Cator Park School Beckenham Comp 0.13 417 221 34 1.9 2.5 589 1939 28 0.9 7 96 27 1081552 513 Chisleh’st & Sidcup Gram Sch Sidcup Gram 1.12 517 227 191 2.3 3.1 798 779 531 485 25 1.3 14 41 191 608 -39391 412 Colfes School Lee Ind 1.83 515 243 86 2.1 3.0 886 393 277 293 42 1.6 22 34 86 408 21432 424 Coloma Convent Girls’ School Croydon Comp 1.63 569 230 131 2.5 3.0 803 751 505 439 31 1.5 18 100 131 445 -8695 931 Croham Hurst School S’th Croydon Ind 0.69 432 231 23 1.9 2.8 725 1163 743 28 1.2 17 100 23 706 23637 101 Croydon High School Selsdon Ind 4.35 783 257 64 3.0 3.3 947 243 65 155 71 2.7 58 100 64 46 6452 63 Dulwich College Dulwich Ind 4.14 757 256 185 3.0 3.3 1004 129 55 76 66 2.7 50 0 185 57 11
Top 1,000 Schools
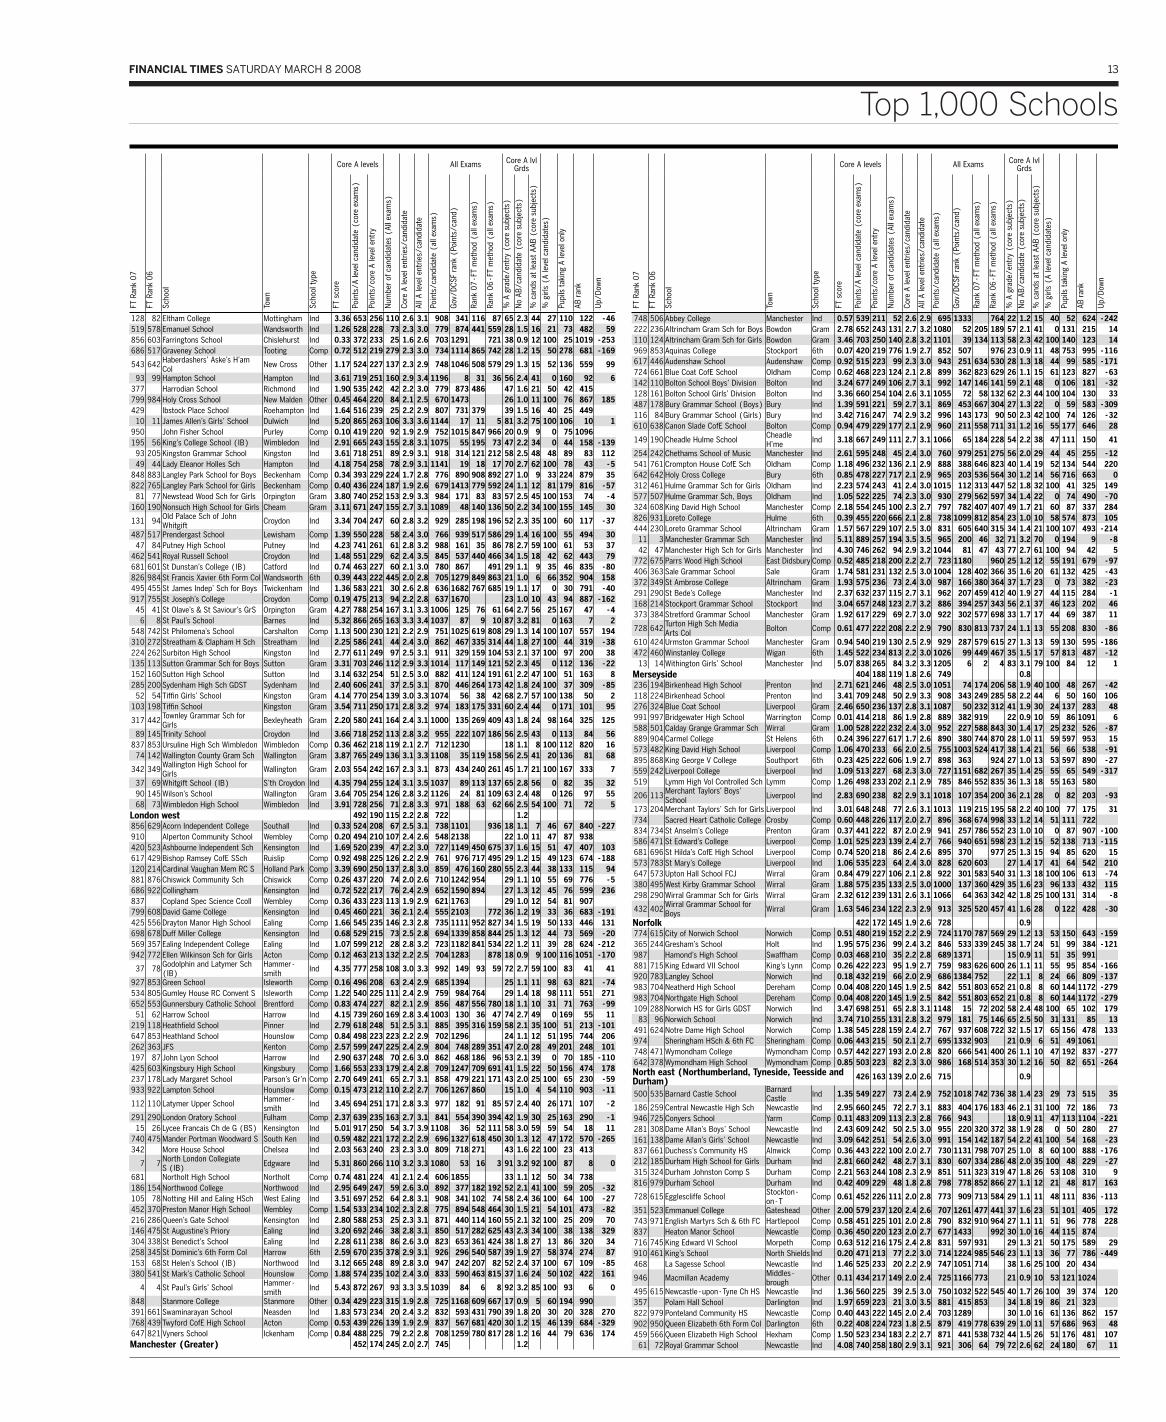
FINANCIAL TIMES SATURDAY MARCH 8 2008 13
Core A levels All Exams Core A lvl Grds
FT R
ank
07
FT R
ank
06
Scho
ol
Tow
n
Scho
ol ty
pe
FT s
core
Poin
ts/A
leve
l can
dida
te (
core
exa
ms)
Poin
ts/c
ore
A le
vel e
ntry
Num
ber
of c
andi
date
s (A
ll ex
ams)
Core
A le
vel e
ntrie
s/ca
ndid
ate
All A
leve
l ent
ries/
cand
idat
e
Poin
ts/c
andi
date
(al
l exa
ms)
Gov
/DCS
F ra
nk (
Poin
ts/c
and)
Rank
07-
FT m
etho
d (a
ll ex
ams)
Rank
06-
FT m
etho
d (a
ll ex
ams)
% A
gra
de/e
ntry
(co
re s
ubje
cts)
No
AB/c
andi
date
(co
re s
ubje
cts)
% c
ands
at
leas
t AA
B (c
ore
subj
ects
)
% g
irls
(A le
vel c
andi
date
s)
Pupi
ls t
akin
g A
leve
l onl
y
AB r
ank
Up/
Dow
n
128 82 Eltham College Mottingham Ind 3.36 653 256 110 2.6 3.1 908 341 116 87 65 2.3 44 27 110 122 -46519 578 Emanuel School Wandsworth Ind 1.26 528 228 73 2.3 3.0 779 874 441 559 28 1.5 16 21 73 482 59856 603 Farringtons School Chislehurst Ind 0.33 372 233 25 1.6 2.6 703 1291 721 38 0.9 12 100 25 1019 -253686 517 Graveney School Tooting Comp 0.72 512 219 279 2.3 3.0 734 1114 865 742 28 1.2 15 50 278 681 -169
543 642 Haberdashers’ Aske’s H’am Col New Cross Other 1.17 524 227 137 2.3 2.9 748 1046 508 579 29 1.3 15 52 136 559 99
93 99 Hampton School Hampton Ind 3.61 719 251 160 2.9 3.4 1196 8 31 36 56 2.4 41 0 160 92 6377 Harrodian School Richmond Ind 1.90 535 242 42 2.2 3.0 779 873 486 47 1.6 21 50 42 415799 984 Holy Cross School New Malden Other 0.45 464 220 84 2.1 2.5 670 1473 26 1.0 11 100 76 867 185429 Ibstock Place School Roehampton Ind 1.64 516 239 25 2.2 2.9 807 731 379 39 1.5 16 40 25 44910 11 James Allen’s Girls’ School Dulwich Ind 5.20 865 263 106 3.3 3.6 1144 17 11 5 81 3.2 75 100 106 10 1
950 John Fisher School Purley Comp 0.10 419 220 92 1.9 2.9 752 1015 847 966 20 0.9 9 0 75 1096195 56 King’s College School (IB) Wimbledon Ind 2.91 665 243 155 2.8 3.1 1075 55 195 73 47 2.2 34 0 44 158 -13993 205 Kingston Grammar School Kingston Ind 3.61 718 251 89 2.9 3.1 918 314 121 212 58 2.5 48 48 89 83 11249 44 Lady Eleanor Holles Sch Hampton Ind 4.18 754 258 78 2.9 3.1 1141 19 18 17 70 2.7 62 100 78 43 -5
848 883 Langley Park School for Boys Beckenham Comp 0.34 393 229 224 1.7 2.8 776 890 908 892 27 1.0 9 33 224 879 35822 765 Langley Park School for Girls Beckenham Comp 0.40 436 224 187 1.9 2.6 679 1413 779 592 24 1.1 12 81 179 816 -5781 77 Newstead Wood Sch for Girls Orpington Gram 3.80 740 252 153 2.9 3.3 984 171 83 83 57 2.5 45 100 153 74 -4
160 190 Nonsuch High School for Girls Cheam Gram 3.11 671 247 155 2.7 3.1 1089 48 140 136 50 2.2 34 100 155 145 30
131 94 Old Palace Sch of John Whitgift Croydon Ind 3.34 704 247 60 2.8 3.2 929 285 198 196 52 2.3 35 100 60 117 -37
487 517 Prendergast School Lewisham Comp 1.39 550 228 58 2.4 3.0 766 939 517 586 29 1.4 16 100 55 494 3047 84 Putney High School Putney Ind 4.23 741 261 61 2.8 3.2 988 161 35 86 78 2.7 59 100 61 53 37
462 541 Royal Russell School Croydon Ind 1.48 551 229 62 2.4 3.5 845 537 440 466 34 1.5 18 42 62 443 79681 601 St Dunstan’s College (IB) Catford Ind 0.74 463 227 60 2.1 3.0 780 867 491 29 1.1 9 35 46 835 -80826 984 St Francis Xavier 6th Form Col Wandsworth 6th 0.39 443 222 445 2.0 2.8 705 1279 849 863 21 1.0 6 66 352 904 158495 455 St James Indep’ Sch for Boys Twickenham Ind 1.36 583 221 30 2.6 2.8 636 1682 767 685 19 1.1 17 0 30 791 -40917 755 St Joseph’s College Croydon Comp 0.19 475 213 94 2.2 2.8 637 1670 23 1.0 10 43 94 887 -16245 41 St Olave’s & St Saviour’s GrS Orpington Gram 4.27 788 254 167 3.1 3.3 1006 125 76 61 64 2.7 56 25 167 47 -46 8 St Paul’s School Barnes Ind 5.32 866 265 163 3.3 3.4 1037 87 9 10 87 3.2 81 0 163 7 2
548 742 St Philomena’s School Carshalton Comp 1.13 500 230 121 2.2 2.9 751 1025 619 808 29 1.3 14 100 107 557 194310 272 Streatham & Clapham H Sch Streatham Ind 2.25 586 241 44 2.4 3.0 862 467 335 314 44 1.8 27 100 44 319 -38224 262 Surbiton High School Kingston Ind 2.77 611 249 97 2.5 3.1 911 329 159 104 53 2.1 37 100 97 200 38135 113 Sutton Grammar Sch for Boys Sutton Gram 3.31 703 246 112 2.9 3.3 1014 117 149 121 52 2.3 45 0 112 136 -22152 160 Sutton High School Sutton Ind 3.14 632 254 51 2.5 3.0 882 411 124 191 61 2.2 47 100 51 163 8285 200 Sydenham High Sch GDST Sydenham Ind 2.40 606 241 37 2.5 3.1 870 446 264 173 42 1.8 24 100 37 309 -8552 54 Tiffi n Girls’ School Kingston Gram 4.14 770 254 139 3.0 3.3 1074 56 38 42 68 2.7 57 100 138 50 2
103 198 Tiffi n School Kingston Gram 3.54 711 250 171 2.8 3.2 974 183 175 331 60 2.4 44 0 171 101 95
317 442 Townley Grammar Sch for Girls Bexleyheath Gram 2.20 580 241 164 2.4 3.1 1000 135 269 409 43 1.8 24 98 164 325 125
89 145 Trinity School Croydon Ind 3.66 718 252 113 2.8 3.2 955 222 107 186 56 2.5 43 0 113 84 56837 853 Ursuline High Sch Wimbledon Wimbledon Comp 0.36 462 218 119 2.1 2.7 712 1230 18 1.1 8 100 112 820 1674 142 Wallington County Gram Sch Wallington Gram 3.87 765 249 136 3.1 3.3 1108 35 119 158 56 2.5 41 20 136 81 68
342 349 Wallington High School for Girls Wallington Gram 2.03 554 242 167 2.3 3.1 873 434 240 261 45 1.7 21 100 167 333 7
37 69 Whitgift School (IB) S’th Croydon Ind 4.35 794 255 124 3.1 3.5 1037 89 113 137 65 2.8 56 0 82 35 3290 145 Wilson’s School Wallington Gram 3.64 705 254 126 2.8 3.2 1126 24 81 109 63 2.4 48 0 126 97 5568 73 Wimbledon High School Wimbledon Ind 3.91 728 256 71 2.8 3.3 971 188 63 62 66 2.5 54 100 71 72 5
London west 492 190 115 2.2 2.8 722 1.2856 629 Acorn Independent College Southall Ind 0.33 524 208 67 2.5 3.1 738 1101 936 18 1.1 7 46 67 840 -227910 Alperton Community School Wembley Comp 0.20 494 210 107 2.4 2.6 548 2138 22 1.0 11 47 87 938420 523 Ashbourne Independent Sch Kensington Ind 1.69 520 239 47 2.2 3.0 727 1149 450 675 37 1.6 15 51 47 407 103617 429 Bishop Ramsey CofE SSch Ruislip Comp 0.92 498 225 126 2.2 2.9 761 976 717 495 29 1.2 15 49 123 674 -188120 214 Cardinal Vaughan Mem RC S Holland Park Comp 3.39 690 250 137 2.8 3.0 859 476 160 280 55 2.3 44 38 133 115 94881 876 Chiswick Community Sch Chiswick Comp 0.26 437 220 74 2.0 2.6 710 1242 954 29 1.1 10 55 69 776 -5686 922 Collingham Kensington Ind 0.72 522 217 76 2.4 2.9 652 1590 894 27 1.3 12 45 76 599 236837 Copland Spec Science Ccoll Wembley Comp 0.36 433 223 113 1.9 2.9 621 1763 29 1.0 12 54 81 907799 608 David Game College Kensington Ind 0.45 460 221 36 2.1 2.4 555 2103 772 36 1.2 19 33 36 683 -191425 556 Drayton Manor High School Ealing Comp 1.66 545 235 146 2.3 2.8 735 1111 952 827 34 1.5 19 50 133 446 131698 678 Duff Miller College Kensington Ind 0.68 529 215 73 2.5 2.8 694 1339 858 844 25 1.3 12 44 73 569 -20569 357 Ealing Independent College Ealing Ind 1.07 599 212 28 2.8 3.2 723 1182 841 534 22 1.2 11 39 28 624 -212942 772 Ellen Wilkinson Sch for Girls Acton Comp 0.12 463 213 132 2.2 2.5 704 1283 878 18 0.9 9 100 116 1051 -170
37 78 Godolphin and Latymer Sch (IB)
Hammer-smith Ind 4.35 777 258 108 3.0 3.3 992 149 93 59 72 2.7 59 100 83 41 41
927 853 Green School Isleworth Comp 0.16 496 208 63 2.4 2.9 685 1394 25 1.1 11 98 63 821 -74534 805 Gumley House RC Convent S Isleworth Comp 1.22 540 225 111 2.4 2.9 759 984 764 29 1.4 18 98 111 551 271652 553 Gunnersbury Catholic School Brentford Comp 0.83 474 227 82 2.1 2.9 856 487 556 780 18 1.1 10 31 71 763 -9951 62 Harrow School Harrow Ind 4.15 739 260 169 2.8 3.4 1003 130 36 47 74 2.7 49 0 169 55 11
219 118 Heathfi eld School Pinner Ind 2.79 618 248 51 2.5 3.1 885 395 316 159 58 2.1 35 100 51 213 -101647 853 Heathland School Hounslow Comp 0.84 498 223 223 2.2 2.9 702 1296 24 1.1 12 51 195 744 206262 363 JFS Kenton Comp 2.57 599 247 225 2.4 2.9 804 748 289 351 47 2.0 28 49 201 248 101197 87 John Lyon School Harrow Ind 2.90 637 248 70 2.6 3.0 862 468 186 96 53 2.1 39 0 70 185 -110425 603 Kingsbury High School Kingsbury Comp 1.66 553 233 179 2.4 2.8 709 1247 709 691 41 1.5 22 50 156 474 178237 178 Lady Margaret School Parson’s Gr’n Comp 2.70 649 241 65 2.7 3.1 858 479 221 171 43 2.0 25 100 65 230 -59933 922 Lampton School Hounslow Comp 0.15 473 212 110 2.2 2.7 706 1267 860 15 1.0 4 54 110 903 -11
112 110 Latymer Upper School Hammer-smith Ind 3.45 694 251 171 2.8 3.3 977 182 91 85 57 2.4 40 26 171 107 -2
291 290 London Oratory School Fulham Comp 2.37 639 235 163 2.7 3.1 841 554 390 394 42 1.9 30 25 163 290 -115 26 Lycee Francais Ch de G (BS) Kensington Ind 5.01 917 250 54 3.7 3.9 1108 36 52 111 58 3.0 59 59 54 18 11
740 475 Mander Portman Woodward S South Ken Ind 0.59 482 221 172 2.2 2.9 696 1327 618 450 30 1.3 12 47 172 570 -265342 More House School Chelsea Ind 2.03 563 240 23 2.3 3.0 809 718 271 43 1.6 22 100 23 413
7 7 North London Collegiate S (IB) Edgware Ind 5.31 860 266 110 3.2 3.3 1080 53 16 3 91 3.2 92 100 87 8 0
681 Northolt High School Northolt Comp 0.74 481 224 41 2.1 2.4 606 1855 33 1.1 12 50 34 738186 154 Northwood College Northwood Ind 2.95 649 247 59 2.6 3.0 892 377 182 192 52 2.1 41 100 59 205 -32105 78 Notting Hill and Ealing HSch West Ealing Ind 3.51 697 252 64 2.8 3.1 908 341 102 74 58 2.4 36 100 64 100 -27452 370 Preston Manor High School Wembley Comp 1.54 533 234 102 2.3 2.8 775 894 548 464 30 1.5 21 54 101 473 -82216 286 Queen’s Gate School Kensington Ind 2.80 588 253 25 2.3 3.1 871 440 114 160 55 2.1 32 100 25 209 70146 475 St Augustine’s Priory Ealing Ind 3.20 692 246 38 2.8 3.1 850 517 282 625 43 2.3 34 100 38 138 329304 338 St Benedict’s School Ealing Ind 2.28 611 238 86 2.6 3.0 823 653 361 424 38 1.8 27 13 86 320 34258 345 St Dominic’s 6th Form Col Harrow 6th 2.59 670 235 378 2.9 3.1 926 296 540 587 39 1.9 27 58 374 274 87153 68 St Helen’s School (IB) Northwood Ind 3.12 665 248 89 2.8 3.0 947 242 207 82 52 2.4 37 100 67 109 -85380 541 St Mark’s Catholic School Hounslow Comp 1.88 574 235 102 2.4 3.0 833 590 463 815 37 1.6 24 50 102 422 161
4 4 St Paul’s Girls’ School Hammer-smith Ind 5.43 872 267 93 3.3 3.5 1039 84 6 8 92 3.2 85 100 93 6 0
848 Stanmore College Stanmore Other 0.34 429 223 315 1.9 2.8 725 1168 609 667 17 0.9 5 60 194 990391 661 Swaminarayan School Neasden Ind 1.83 573 234 20 2.4 3.2 832 593 431 790 39 1.8 20 30 20 328 270768 439 Twyford CofE High School Acton Comp 0.53 439 226 139 1.9 2.9 837 567 681 420 30 1.2 15 46 139 684 -329647 821 Vyners School Ickenham Comp 0.84 488 225 79 2.2 2.8 708 1259 780 817 28 1.2 16 44 79 636 174Manchester (Greater) 452 174 245 2.0 2.7 745 1.2
Core A levels All Exams Core A lvl Grds
FT R
ank
07
FT R
ank
06
Scho
ol
Tow
n
Scho
ol ty
pe
FT s
core
Poin
ts/A
leve
l can
dida
te (
core
exa
ms)
Poin
ts/c
ore
A le
vel e
ntry
Num
ber
of c
andi
date
s (A
ll ex
ams)
Core
A le
vel e
ntrie
s/ca
ndid
ate
All A
leve
l ent
ries/
cand
idat
e
Poin
ts/c
andi
date
(al
l exa
ms)
Gov
/DCS
F ra
nk (
Poin
ts/c
and)
Rank
07-
FT m
etho
d (a
ll ex
ams)
Rank
06-
FT m
etho
d (a
ll ex
ams)
% A
gra
de/e
ntry
(co
re s
ubje
cts)
No
AB/c
andi
date
(co
re s
ubje
cts)
% c
ands
at
leas
t AA
B (c
ore
subj
ects
)
% g
irls
(A le
vel c
andi
date
s)
Pupi
ls t
akin
g A
leve
l onl
y
AB r
ank
Up/
Dow
n
748 506 Abbey College Manchester Ind 0.57 539 211 52 2.6 2.9 695 1333 764 22 1.2 15 40 52 624 -242222 236 Altrincham Gram Sch for Boys Bowdon Gram 2.78 652 243 131 2.7 3.2 1080 52 205 189 57 2.1 41 0 131 215 14110 124 Altrincham Gram Sch for Girls Bowdon Gram 3.46 703 250 140 2.8 3.2 1101 39 134 113 58 2.3 42 100 140 123 14969 853 Aquinas College Stockport 6th 0.07 420 219 776 1.9 2.7 852 507 976 23 0.9 11 48 753 995 -116617 446 Audenshaw School Audenshaw Comp 0.92 515 223 99 2.3 3.0 943 251 634 530 28 1.3 18 44 99 585 -171724 661 Blue Coat CofE School Oldham Comp 0.62 468 223 124 2.1 2.8 899 362 823 629 26 1.1 15 61 123 827 -63142 110 Bolton School Boys’ Division Bolton Ind 3.24 677 249 106 2.7 3.1 992 147 146 141 59 2.1 48 0 106 181 -32128 161 Bolton School Girls’ Division Bolton Ind 3.36 660 254 104 2.6 3.1 1055 72 58 132 62 2.3 44 100 104 130 33487 178 Bury Grammar School (Boys) Bury Ind 1.39 591 221 59 2.7 3.1 869 453 667 304 27 1.3 22 0 59 583 -309116 84 Bury Grammar School (Girls) Bury Ind 3.42 716 247 74 2.9 3.2 996 143 173 90 50 2.3 42 100 74 126 -32610 638 Canon Slade CofE School Bolton Comp 0.94 479 229 177 2.1 2.9 960 211 558 711 31 1.2 16 55 177 646 28
149 190 Cheadle Hulme School Cheadle H’me Ind 3.18 667 249 111 2.7 3.1 1066 65 184 228 54 2.2 38 47 111 150 41
254 242 Chethams School of Music Manchester Ind 2.61 595 248 45 2.4 3.0 760 979 251 275 56 2.0 29 44 45 255 -12541 761 Crompton House CofE Sch Oldham Comp 1.18 496 232 136 2.1 2.9 888 388 646 823 40 1.4 19 52 134 544 220642 642 Holy Cross College Bury 6th 0.85 478 227 717 2.1 2.9 965 203 536 564 30 1.2 14 56 716 663 0312 461 Hulme Grammar Sch for Girls Oldham Ind 2.23 574 243 41 2.4 3.0 1015 112 313 447 52 1.8 32 100 41 325 149577 507 Hulme Grammar Sch, Boys Oldham Ind 1.05 522 225 74 2.3 3.0 930 279 562 597 34 1.4 22 0 74 490 -70324 608 King David High School Manchester Comp 2.18 554 245 100 2.3 2.7 797 782 407 407 49 1.7 21 60 87 337 284826 931 Loreto College Hulme 6th 0.39 455 220 666 2.1 2.8 738 1099 812 854 23 1.0 10 58 574 873 105444 230 Loreto Grammar School Altrincham Gram 1.57 567 229 107 2.5 3.0 831 605 640 315 34 1.4 21 100 107 493 -21411 3 Manchester Grammar Sch Manchester Ind 5.11 889 257 194 3.5 3.5 965 200 46 32 71 3.2 70 0 194 9 -842 47 Manchester High Sch for Girls Manchester Ind 4.30 746 262 94 2.9 3.2 1044 81 47 43 77 2.7 61 100 94 42 5
772 675 Parrs Wood High School East Didsbury Comp 0.52 485 218 200 2.2 2.7 723 1180 960 25 1.2 12 55 191 679 -97406 363 Sale Grammar School Sale Gram 1.74 581 231 132 2.5 3.0 1004 128 402 366 35 1.6 20 61 132 425 -43372 349 St Ambrose College Altrincham Gram 1.93 575 236 73 2.4 3.0 987 166 380 364 37 1.7 23 0 73 382 -23291 290 St Bede’s College Manchester Ind 2.37 632 237 115 2.7 3.1 962 207 459 412 40 1.9 27 44 115 284 -1168 214 Stockport Grammar School Stockport Ind 3.04 657 248 123 2.7 3.2 886 394 257 343 56 2.1 37 46 123 202 46373 384 Stretford Grammar School Manchester Gram 1.92 617 229 69 2.7 3.0 922 302 577 698 33 1.7 17 44 69 387 11
728 642 Turton High Sch Media Arts Col Bolton Comp 0.61 477 222 208 2.2 2.9 790 830 813 737 24 1.1 13 55 208 830 -86
610 424 Urmston Grammar School Manchester Gram 0.94 540 219 130 2.5 2.9 929 287 579 615 27 1.3 13 59 130 595 -186472 460 Winstanley College Wigan 6th 1.45 522 234 813 2.2 3.0 1026 99 449 467 35 1.5 17 57 813 487 -1213 14 Withington Girls’ School Manchester Ind 5.07 838 265 84 3.2 3.3 1205 6 2 4 83 3.1 79 100 84 12 1
Merseyside 404 188 119 1.8 2.6 749 0.8236 194 Birkenhead High School Prenton Ind 2.71 621 246 48 2.5 3.0 1051 74 174 206 58 1.9 40 100 48 267 -42118 224 Birkenhead School Prenton Ind 3.41 709 248 50 2.9 3.3 908 343 249 285 58 2.2 44 6 50 160 106276 324 Blue Coat School Liverpool Gram 2.46 650 236 137 2.8 3.1 1087 50 232 312 41 1.9 30 24 137 283 48991 997 Bridgewater High School Warrington Comp 0.01 414 218 86 1.9 2.8 889 382 919 22 0.9 10 59 86 1091 6588 501 Calday Grange Grammar Sch Wirral Gram 1.00 528 222 232 2.4 3.0 952 227 588 843 30 1.4 17 25 232 526 -87889 904 Carmel College St Helens 6th 0.24 396 227 617 1.7 2.6 890 380 744 870 28 1.0 11 59 597 953 15573 482 King David High School Liverpool Comp 1.06 470 233 66 2.0 2.5 755 1003 524 417 38 1.4 21 56 66 538 -91895 868 King George V College Southport 6th 0.23 425 222 606 1.9 2.7 898 363 924 27 1.0 13 53 597 890 -27559 242 Liverpool College Liverpool Ind 1.09 513 227 68 2.3 3.0 727 1151 682 267 35 1.4 25 55 65 549 -317519 Lymm High Vol Controlled Sch Lymm Comp 1.26 498 233 202 2.1 2.9 785 846 552 835 36 1.3 18 55 163 580
206 113 Merchant Taylors’ Boys’ School Liverpool Ind 2.83 690 238 82 2.9 3.1 1018 107 354 200 36 2.1 28 0 82 203 -93
173 204 Merchant Taylors’ Sch for Girls Liverpool Ind 3.01 648 248 77 2.6 3.1 1013 119 215 195 58 2.2 40 100 77 175 31734 Sacred Heart Catholic College Crosby Comp 0.60 448 226 117 2.0 2.7 896 368 674 998 33 1.2 14 51 111 722834 734 St Anselm’s College Prenton Gram 0.37 441 222 87 2.0 2.9 941 257 786 552 23 1.0 10 0 87 907 -100586 471 St Edward’s College Liverpool Comp 1.01 525 223 139 2.4 2.7 766 940 651 598 23 1.2 15 52 138 713 -115681 696 St Hilda’s CofE High School Liverpool Comp 0.74 520 218 86 2.4 2.6 895 370 977 25 1.3 15 94 85 620 15573 783 St Mary’s College Liverpool Ind 1.06 535 223 64 2.4 3.0 828 620 603 27 1.4 17 41 64 542 210647 573 Upton Hall School FCJ Wirral Gram 0.84 479 227 106 2.1 2.8 922 301 583 540 31 1.3 18 100 106 613 -74380 495 West Kirby Grammar School Wirral Gram 1.88 575 235 133 2.5 3.0 1000 137 360 429 35 1.6 23 96 133 432 115298 290 Wirral Grammar Sch for Girls Wirral Gram 2.32 612 239 131 2.6 3.1 1066 64 363 342 42 1.8 25 100 131 314 -8
432 402 Wirral Grammar School for Boys Wirral Gram 1.63 546 234 122 2.3 2.9 913 325 520 457 41 1.6 28 0 122 428 -30
Norfolk 422 172 145 1.9 2.6 728 0.9774 615 City of Norwich School Norwich Comp 0.51 480 219 152 2.2 2.9 724 1170 787 569 29 1.2 13 53 150 643 -159365 244 Gresham’s School Holt Ind 1.95 575 236 99 2.4 3.2 846 533 339 245 38 1.7 24 51 99 384 -121987 Hamond’s High School Swaffham Comp 0.03 468 210 35 2.2 2.8 689 1371 15 0.9 11 51 35 991881 715 King Edward VII School King’s Lynn Comp 0.26 422 223 95 1.9 2.7 759 983 626 600 26 1.1 11 55 95 854 -166920 783 Langley School Norwich Ind 0.18 432 219 66 2.0 2.9 686 1384 752 22 1.1 8 24 66 809 -137983 704 Neatherd High School Dereham Comp 0.04 408 220 145 1.9 2.5 842 551 803 652 21 0.8 8 60 144 1172 -279983 704 Northgate High School Dereham Comp 0.04 408 220 145 1.9 2.5 842 551 803 652 21 0.8 8 60 144 1172 -279109 288 Norwich HS for Girls GDST Norwich Ind 3.47 698 251 65 2.8 3.1 1148 15 72 202 58 2.4 48 100 65 102 17983 96 Norwich School Norwich Ind 3.74 710 255 131 2.8 3.2 979 181 75 146 65 2.5 50 31 131 85 13
491 624 Notre Dame High School Norwich Comp 1.38 545 228 159 2.4 2.7 767 937 608 722 32 1.5 17 65 156 478 133974 Sheringham HSch & 6th FC Sheringham Comp 0.06 443 215 50 2.1 2.7 695 1332 903 21 0.9 6 51 49 1061748 471 Wymondham College Wymondham Comp 0.57 442 227 193 2.0 2.8 820 666 541 400 26 1.1 10 47 192 837 -277642 378 Wymondham High School Wymondham Comp 0.85 503 223 82 2.3 3.0 986 168 514 353 30 1.2 16 50 82 651 -264North east (Northumberland, Tyneside, Teesside and Durham) 426 163 139 2.0 2.6 715 0.9
500 535 Barnard Castle School Barnard Castle Ind 1.35 549 227 73 2.4 2.9 752 1018 742 736 38 1.4 23 29 73 515 35
186 259 Central Newcastle High Sch Newcastle Ind 2.95 660 245 72 2.7 3.1 883 404 176 183 46 2.1 31 100 72 186 73946 725 Conyers School Yarm Comp 0.11 483 209 113 2.3 2.8 766 943 18 0.9 11 47 113 1104 -221281 308 Dame Allan’s Boys’ School Newcastle Ind 2.43 609 242 50 2.5 3.0 955 220 320 372 38 1.9 28 0 50 280 27161 138 Dame Allan’s Girls’ School Newcastle Ind 3.09 642 251 54 2.6 3.0 991 154 142 187 54 2.2 41 100 54 168 -23837 661 Duchess’s Community HS Alnwick Comp 0.36 443 222 100 2.0 2.7 730 1131 798 707 25 1.0 8 60 100 888 -176212 185 Durham High School for Girls Durham Ind 2.81 660 242 48 2.7 3.1 830 607 334 286 48 2.0 35 100 48 229 -27315 324 Durham Johnston Comp S Durham Comp 2.21 563 244 108 2.3 2.9 851 511 323 319 47 1.8 26 53 108 310 9816 979 Durham School Durham Ind 0.42 409 229 48 1.8 2.8 798 778 852 866 27 1.1 12 21 48 817 163
728 615 Egglescliffe School Stockton-on-T Comp 0.61 452 226 111 2.0 2.8 773 909 713 584 29 1.1 11 48 111 836 -113
351 523 Emmanuel College Gateshead Other 2.00 579 237 120 2.4 2.6 707 1261 477 441 37 1.6 23 51 101 405 172743 971 English Martyrs Sch & 6th FC Hartlepool Comp 0.58 451 225 101 2.0 2.8 790 832 910 964 27 1.1 11 51 96 778 228837 Heaton Manor School Newcastle Comp 0.36 450 220 123 2.0 2.7 677 1433 992 30 1.0 16 44 115 874716 745 King Edward VI School Morpeth Comp 0.63 512 216 175 2.4 2.8 831 597 931 29 1.3 21 50 175 589 29910 461 King’s School North Shields Ind 0.20 471 213 77 2.2 3.0 714 1224 985 546 23 1.1 13 36 77 786 -449468 La Sagesse School Newcastle Ind 1.46 525 233 20 2.2 2.9 747 1051 714 38 1.6 25 100 20 434
946 Macmillan Academy Middles-brough Other 0.11 434 217 149 2.0 2.4 725 1166 773 21 0.9 10 53 121 1024
495 615 Newcastle-upon-Tyne Ch HS Newcastle Ind 1.36 560 225 39 2.5 3.0 750 1032 522 545 40 1.7 26 100 39 374 120357 Polam Hall School Darlington Ind 1.97 659 223 21 3.0 3.5 881 415 853 34 1.8 19 86 21 323822 979 Ponteland Community HS Newcastle Comp 0.40 443 222 145 2.0 2.4 703 1289 30 1.0 16 61 136 862 157902 950 Queen Elizabeth 6th Form Col Darlington 6th 0.22 408 224 723 1.8 2.5 879 419 778 639 29 1.0 11 57 686 963 48459 566 Queen Elizabeth High School Hexham Comp 1.50 523 234 183 2.2 2.7 871 441 538 732 44 1.5 26 51 176 481 10761 72 Royal Grammar School Newcastle Ind 4.08 740 258 180 2.9 3.1 921 306 64 79 72 2.6 62 24 180 67 11
Top 1,000 Schools
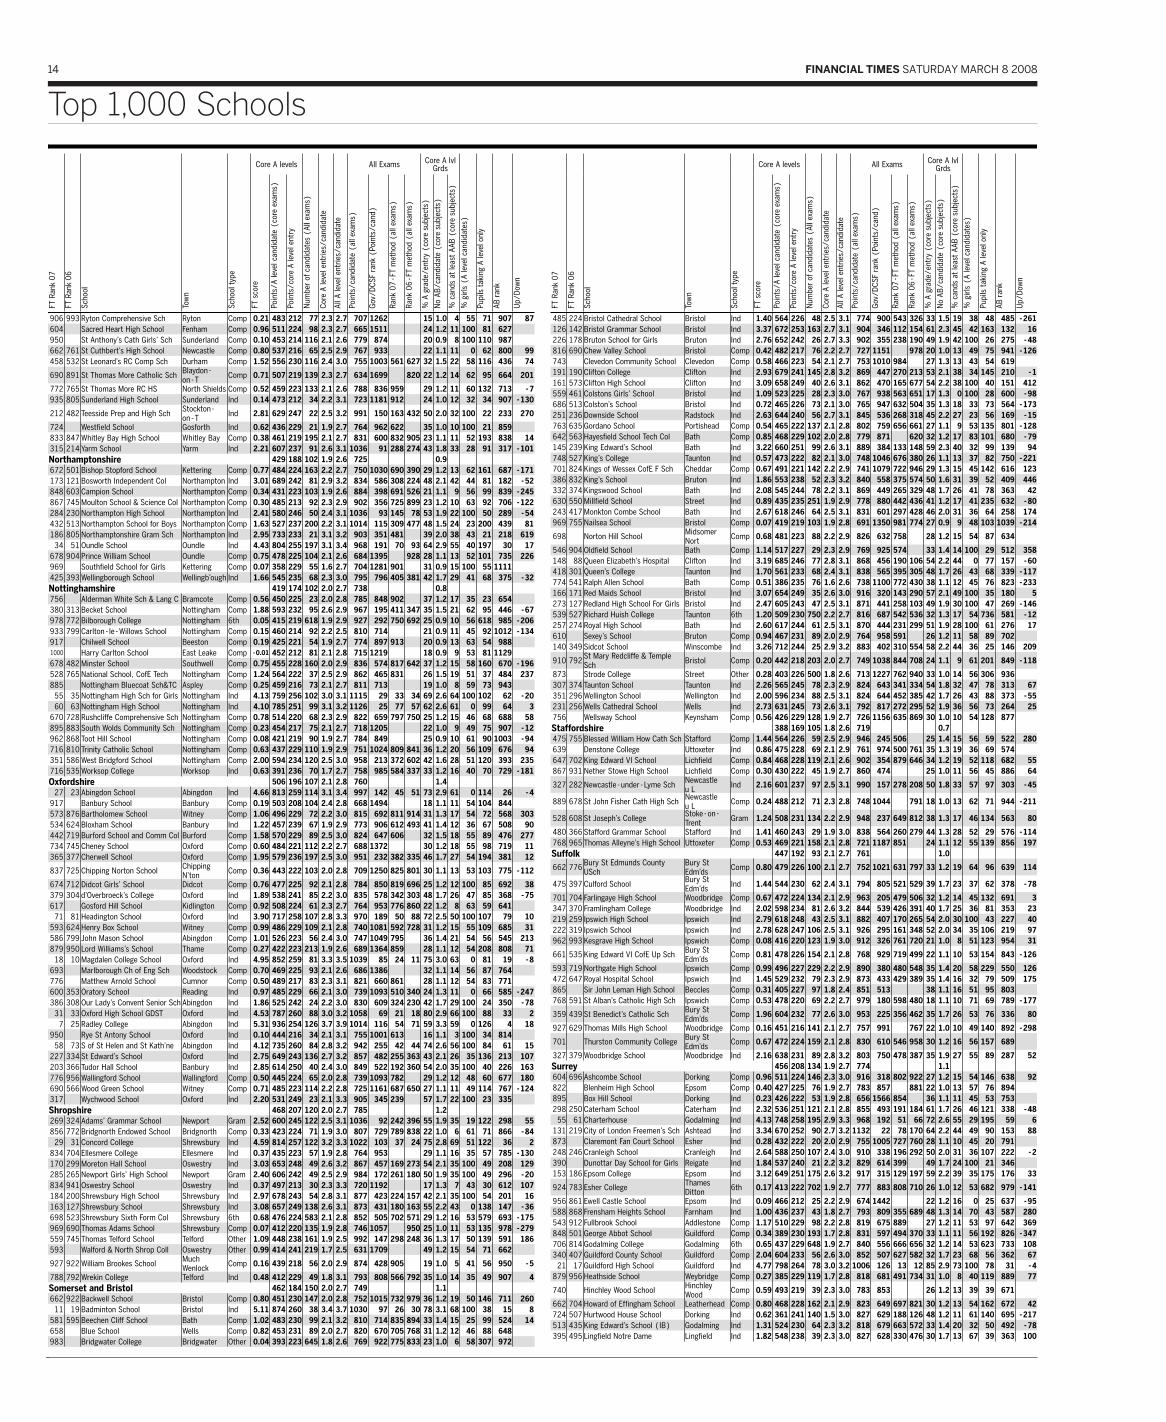
14 FINANCIAL TIMES SATURDAY MARCH 8 2008
Top 1,000 Schools
Core A levels All Exams Core A lvl Grds
FT R
ank
07
FT R
ank
06
Scho
ol
Tow
n
Scho
ol ty
pe
FT s
core
Poin
ts/A
leve
l can
dida
te (
core
exa
ms)
Poin
ts/c
ore
A le
vel e
ntry
Num
ber
of c
andi
date
s (A
ll ex
ams)
Core
A le
vel e
ntrie
s/ca
ndid
ate
All A
leve
l ent
ries/
cand
idat
e
Poin
ts/c
andi
date
(al
l exa
ms)
Gov
/DCS
F ra
nk (
Poin
ts/c
and)
Rank
07-
FT m
etho
d (a
ll ex
ams)
Rank
06-
FT m
etho
d (a
ll ex
ams)
% A
gra
de/e
ntry
(co
re s
ubje
cts)
No
AB/c
andi
date
(co
re s
ubje
cts)
% c
ands
at
leas
t AA
B (c
ore
subj
ects
)
% g
irls
(A le
vel c
andi
date
s)
Pupi
ls t
akin
g A
leve
l onl
y
AB r
ank
Up/
Dow
n
906 993 Ryton Comprehensive Sch Ryton Comp 0.21 483 212 77 2.3 2.7 707 1262 15 1.0 4 55 71 907 87604 Sacred Heart High School Fenham Comp 0.96 511 224 98 2.3 2.7 665 1511 24 1.2 11 100 81 627950 St Anthony’s Cath Girls’ Sch Sunderland Comp 0.10 453 214 116 2.1 2.6 779 874 20 0.9 8 100 110 987662 761 St Cuthbert’s High School Newcastle Comp 0.80 537 216 65 2.5 2.9 767 933 22 1.1 11 0 62 800 99458 532 St Leonard’s RC Comp Sch Durham Comp 1.52 556 230 116 2.4 3.0 755 1003 561 627 32 1.5 22 58 116 436 74
690 891 St Thomas More Catholic Sch Blaydon-on-T Comp 0.71 507 219 139 2.3 2.7 634 1699 820 22 1.2 14 62 95 664 201
772 765 St Thomas More RC HS North Shields Comp 0.52 459 223 133 2.1 2.6 788 836 959 29 1.2 11 60 132 713 -7935 805 Sunderland High School Sunderland Ind 0.14 473 212 34 2.2 3.1 723 1181 912 24 1.0 12 32 34 907 -130
212 482 Teesside Prep and High Sch Stockton-on-T Ind 2.81 629 247 22 2.5 3.2 991 150 163 432 50 2.0 32 100 22 233 270
724 Westfi eld School Gosforth Ind 0.62 436 229 21 1.9 2.7 764 962 622 35 1.0 10 100 21 859833 847 Whitley Bay High School Whitley Bay Comp 0.38 461 219 195 2.1 2.7 831 600 832 905 23 1.1 11 52 193 838 14315 214 Yarm School Yarm Ind 2.21 607 237 91 2.6 3.1 1036 91 288 274 43 1.8 33 28 91 317 -101Northamptonshire 429 188 102 1.9 2.6 725 0.9672 501 Bishop Stopford School Kettering Comp 0.77 484 224 163 2.2 2.7 750 1030 690 390 29 1.2 13 62 161 687 -171173 121 Bosworth Independent Col Northampton Ind 3.01 689 242 81 2.9 3.2 834 586 308 224 48 2.1 42 44 81 182 -52848 603 Campion School Northampton Comp 0.34 431 223 103 1.9 2.6 884 398 691 526 21 1.1 9 56 99 839 -245867 745 Moulton School & Science Col Northampton Comp 0.30 485 213 92 2.3 2.9 902 356 725 899 23 1.2 10 63 92 706 -122284 230 Northampton High School Northampton Ind 2.41 580 246 50 2.4 3.1 1036 93 145 78 53 1.9 22 100 50 289 -54432 513 Northampton School for Boys Northampton Comp 1.63 527 237 200 2.2 3.1 1014 115 309 477 48 1.5 24 23 200 439 81186 805 Northamptonshire Gram Sch Northampton Ind 2.95 733 233 21 3.1 3.2 903 351 481 39 2.0 38 43 21 218 61934 51 Oundle School Oundle Ind 4.43 804 255 197 3.1 3.4 968 191 70 93 64 2.9 55 40 197 30 17
678 904 Prince William School Oundle Comp 0.75 478 225 104 2.1 2.6 684 1395 928 28 1.1 13 52 101 735 226969 Southfi eld School for Girls Kettering Comp 0.07 358 229 55 1.6 2.7 704 1281 901 31 0.9 15 100 55 1111425 393 Wellingborough School Wellingb’ough Ind 1.66 545 235 68 2.3 3.0 795 796 405 381 42 1.7 29 41 68 375 -32Nottinghamshire 419 174 102 2.0 2.7 738 0.8756 Alderman White Sch & Lang C Bramcote Comp 0.56 450 225 23 2.0 2.8 785 848 902 37 1.2 17 35 23 654380 313 Becket School Nottingham Comp 1.88 593 232 95 2.6 2.9 967 195 411 347 35 1.5 21 62 95 446 -67978 772 Bilborough College Nottingham 6th 0.05 415 219 618 1.9 2.9 927 292 750 692 25 0.9 10 56 618 985 -206933 799 Carlton-le-Willows School Nottingham Comp 0.15 460 214 92 2.2 2.5 810 714 21 0.9 11 45 92 1012 -134917 Chilwell School Beeston Comp 0.19 425 221 54 1.9 2.7 774 897 913 20 0.9 13 63 54 9881000 Harry Carlton School East Leake Comp -0.01 452 212 81 2.1 2.8 715 1219 18 0.9 9 53 81 1129678 482 Minster School Southwell Comp 0.75 455 228 160 2.0 2.9 836 574 817 642 37 1.2 15 58 160 670 -196528 765 National School, CofE Tech Nottingham Comp 1.24 564 222 37 2.5 2.9 862 465 831 26 1.5 19 51 37 484 237885 Nottingham Bluecoat Sch&TC Aspley Comp 0.25 459 216 73 2.1 2.7 811 713 19 1.0 8 59 73 94355 35 Nottingham High Sch for Girls Nottingham Ind 4.13 759 256 102 3.0 3.1 1115 29 33 34 69 2.6 64 100 102 62 -2060 63 Nottingham High School Nottingham Ind 4.10 785 251 99 3.1 3.2 1126 25 77 57 62 2.6 61 0 99 64 3
670 728 Rushcliffe Comprehensive Sch Nottingham Comp 0.78 514 220 68 2.3 2.9 822 659 797 750 25 1.2 15 46 68 688 58895 883 South Wolds Community Sch Nottingham Comp 0.23 454 217 75 2.1 2.7 718 1205 22 1.0 9 49 75 907 -12962 868 Toot Hill School Nottingham Comp 0.08 421 219 90 1.9 2.7 784 849 25 0.9 10 61 90 1003 -94716 810 Trinity Catholic School Nottingham Comp 0.63 437 229 110 1.9 2.9 751 1024 809 841 36 1.2 20 56 109 676 94351 586 West Bridgford School Nottingham Comp 2.00 594 234 120 2.5 3.0 958 213 372 602 42 1.6 28 51 120 393 235716 535 Worksop College Worksop Ind 0.63 391 236 70 1.7 2.7 758 985 584 337 33 1.2 16 40 70 729 -181Oxfordshire 506 196 107 2.1 2.8 760 1.4
27 23 Abingdon School Abingdon Ind 4.66 813 259 114 3.1 3.4 997 142 45 51 73 2.9 61 0 114 26 -4917 Banbury School Banbury Comp 0.19 503 208 104 2.4 2.8 668 1494 18 1.1 11 54 104 844573 876 Bartholomew School Witney Comp 1.06 496 229 72 2.2 3.0 815 692 811 914 31 1.3 17 54 72 568 303534 624 Bloxham School Banbury Ind 1.22 457 239 67 1.9 2.9 773 906 612 493 41 1.4 12 36 67 508 90442 719 Burford School and Comm Col Burford Comp 1.58 570 229 89 2.5 3.0 824 647 606 32 1.5 18 55 89 476 277734 745 Cheney School Oxford Comp 0.60 484 221 112 2.2 2.7 688 1372 30 1.2 18 55 98 719 11365 377 Cherwell School Oxford Comp 1.95 579 236 197 2.5 3.0 951 232 382 335 46 1.7 27 54 194 381 12
837 725 Chipping Norton School Chipping N’ton Comp 0.36 443 222 103 2.0 2.8 709 1250 825 801 30 1.1 13 53 103 775 -112
674 712 Didcot Girls’ School Didcot Comp 0.76 477 225 92 2.1 2.8 784 850 819 696 25 1.2 12 100 85 692 38379 304 d’Overbroeck’s College Oxford Ind 1.89 538 241 85 2.2 3.0 835 578 342 303 48 1.7 26 47 85 368 -75617 Gosford Hill School Kidlington Comp 0.92 508 224 61 2.3 2.7 764 953 776 860 22 1.2 8 63 59 64171 81 Headington School Oxford Ind 3.90 717 258 107 2.8 3.3 970 189 50 88 72 2.5 50 100 107 79 10
593 624 Henry Box School Witney Comp 0.99 486 229 109 2.1 2.8 740 1081 592 728 31 1.2 15 55 109 685 31586 799 John Mason School Abingdon Comp 1.01 526 223 56 2.4 3.0 747 1049 795 36 1.4 21 54 56 545 213879 950 Lord Williams’s School Thame Comp 0.27 422 223 213 1.9 2.6 689 1364 859 28 1.1 12 54 208 808 7118 10 Magdalen College School Oxford Ind 4.95 852 259 81 3.3 3.5 1039 85 24 11 75 3.0 63 0 81 19 -8
693 Marlborough Ch of Eng Sch Woodstock Comp 0.70 469 225 93 2.1 2.6 686 1386 32 1.1 14 56 87 764776 Matthew Arnold School Cumnor Comp 0.50 489 217 83 2.3 3.1 821 660 861 28 1.1 12 54 83 771600 353 Oratory School Reading Ind 0.97 485 229 66 2.1 3.0 739 1093 510 340 24 1.3 11 0 66 585 -247386 308 Our Lady’s Convent Senior Sch Abingdon Ind 1.86 525 242 24 2.2 3.0 830 609 324 230 42 1.7 29 100 24 350 -7831 33 Oxford High School GDST Oxford Ind 4.53 787 260 88 3.0 3.2 1058 69 21 18 80 2.9 66 100 88 33 27 25 Radley College Abingdon Ind 5.31 936 254 126 3.7 3.9 1014 116 54 71 59 3.3 59 0 126 4 18
950 Rye St Antony School Oxford Ind 0.10 444 216 34 2.1 3.1 755 1001 613 16 1.1 3 100 34 81458 73 S of St Helen and St Kath’ne Abingdon Ind 4.12 735 260 84 2.8 3.2 942 255 42 44 74 2.6 56 100 84 61 15
227 334 St Edward’s School Oxford Ind 2.75 649 243 136 2.7 3.2 857 482 255 363 43 2.1 26 35 136 213 107203 366 Tudor Hall School Banbury Ind 2.85 614 250 40 2.4 3.0 849 522 192 360 54 2.0 35 100 40 226 163776 956 Wallingford School Wallingford Comp 0.50 445 224 65 2.0 2.8 739 1093 782 29 1.2 12 48 60 677 180690 566 Wood Green School Witney Comp 0.71 485 223 114 2.2 2.8 725 1161 687 650 27 1.1 11 49 114 767 -124317 Wychwood School Oxford Ind 2.20 531 249 23 2.1 3.3 905 345 239 57 1.7 22 100 23 335Shropshire 468 207 120 2.0 2.7 785 1.2269 324 Adams’ Grammar School Newport Gram 2.52 600 245 122 2.5 3.1 1036 92 242 396 55 1.9 35 19 122 298 55856 772 Bridgnorth Endowed School Bridgnorth Comp 0.33 423 224 71 1.9 3.0 807 729 789 838 22 1.0 6 61 71 866 -8429 31 Concord College Shrewsbury Ind 4.59 814 257 122 3.2 3.3 1022 103 37 24 75 2.8 69 51 122 36 2
834 704 Ellesmere College Ellesmere Ind 0.37 435 223 57 1.9 2.8 764 953 29 1.1 16 35 57 785 -130170 299 Moreton Hall School Oswestry Ind 3.03 653 248 49 2.6 3.2 867 457 169 273 54 2.1 35 100 49 208 129285 265 Newport Girls’ High School Newport Gram 2.40 606 242 49 2.5 2.9 984 172 261 180 50 1.9 35 100 49 296 -20834 941 Oswestry School Oswestry Ind 0.37 497 213 30 2.3 3.3 720 1192 17 1.3 7 43 30 612 107184 200 Shrewsbury High School Shrewsbury Ind 2.97 678 243 54 2.8 3.1 877 423 224 157 42 2.1 35 100 54 201 16163 127 Shrewsbury School Shrewsbury Ind 3.08 657 249 138 2.6 3.1 873 431 180 163 55 2.2 43 0 138 147 -36698 523 Shrewsbury Sixth Form Col Shrewsbury 6th 0.68 476 224 583 2.1 2.8 852 505 702 571 29 1.2 16 53 579 693 -175969 690 Thomas Adams School Shrewsbury Comp 0.07 412 220 135 1.9 2.8 746 1057 950 25 1.0 11 53 135 978 -279559 745 Thomas Telford School Telford Other 1.09 448 238 161 1.9 2.5 992 147 298 248 36 1.3 17 50 139 591 186593 Walford & North Shrop Coll Oswestry Other 0.99 414 241 219 1.7 2.5 631 1709 49 1.2 15 54 71 662
927 922 William Brookes School Much Wenlock Comp 0.16 439 218 56 2.0 2.9 874 428 905 19 1.0 5 41 56 950 -5
788 792 Wrekin College Telford Ind 0.48 412 229 49 1.8 3.1 793 808 566 792 35 1.0 14 35 49 907 4Somerset and Bristol 462 184 150 2.0 2.7 749 1.1662 922 Backwell School Bristol Comp 0.80 451 230 147 2.0 2.8 752 1015 732 979 36 1.2 19 50 146 711 26011 19 Badminton School Bristol Ind 5.11 874 260 38 3.4 3.7 1030 97 26 30 78 3.1 68 100 38 15 8
581 595 Beechen Cliff School Bath Comp 1.02 483 230 99 2.1 3.2 810 714 835 894 33 1.4 15 25 99 524 14658 Blue School Wells Comp 0.82 453 231 89 2.0 2.7 820 670 705 768 31 1.2 12 46 88 648983 Bridgwater College Bridgwater Other 0.04 393 223 645 1.8 2.6 769 922 775 833 23 1.0 6 58 307 972
Core A levels All Exams Core A lvl Grds
FT R
ank
07
FT R
ank
06
Scho
ol
Tow
n
Scho
ol ty
pe
FT s
core
Poin
ts/A
leve
l can
dida
te (
core
exa
ms)
Poin
ts/c
ore
A le
vel e
ntry
Num
ber
of c
andi
date
s (A
ll ex
ams)
Core
A le
vel e
ntrie
s/ca
ndid
ate
All A
leve
l ent
ries/
cand
idat
e
Poin
ts/c
andi
date
(al
l exa
ms)
Gov
/DCS
F ra
nk (
Poin
ts/c
and)
Rank
07-
FT m
etho
d (a
ll ex
ams)
Rank
06-
FT m
etho
d (a
ll ex
ams)
% A
gra
de/e
ntry
(co
re s
ubje
cts)
No
AB/c
andi
date
(co
re s
ubje
cts)
% c
ands
at
leas
t AA
B (c
ore
subj
ects
)
% g
irls
(A le
vel c
andi
date
s)
Pupi
ls t
akin
g A
leve
l onl
y
AB r
ank
Up/
Dow
n
485 224 Bristol Cathedral School Bristol Ind 1.40 564 226 48 2.5 3.1 774 900 543 326 33 1.5 19 38 48 485 -261126 142 Bristol Grammar School Bristol Ind 3.37 672 253 163 2.7 3.1 904 346 112 154 61 2.3 45 42 163 132 16226 178 Bruton School for Girls Bruton Ind 2.76 652 242 26 2.7 3.3 902 355 238 190 49 1.9 42 100 26 275 -48816 690 Chew Valley School Bristol Comp 0.42 482 217 76 2.2 2.7 727 1151 978 20 1.0 13 49 75 941 -126743 Clevedon Community School Clevedon Comp 0.58 466 223 54 2.1 2.7 753 1010 984 27 1.3 13 43 54 619191 190 Clifton College Clifton Ind 2.93 679 241 145 2.8 3.2 869 447 270 213 53 2.1 38 34 145 210 -1161 573 Clifton High School Clifton Ind 3.09 658 249 40 2.6 3.1 862 470 165 677 54 2.2 38 100 40 151 412559 461 Colstons Girls’ School Bristol Ind 1.09 523 225 28 2.3 3.0 767 938 563 651 17 1.3 0 100 28 600 -98686 513 Colston’s School Bristol Ind 0.72 465 226 73 2.1 3.0 765 947 632 504 35 1.3 18 33 73 564 -173251 236 Downside School Radstock Ind 2.63 644 240 56 2.7 3.1 845 536 268 318 45 2.2 27 23 56 169 -15763 635 Gordano School Portishead Comp 0.54 465 222 137 2.1 2.8 802 759 656 661 27 1.1 9 53 135 801 -128642 563 Hayesfi eld School Tech Col Bath Comp 0.85 468 229 102 2.0 2.8 779 871 620 32 1.2 17 83 101 680 -79145 239 King Edward’s School Bath Ind 3.22 660 251 99 2.6 3.1 889 384 133 148 59 2.3 40 32 99 139 94748 527 King’s College Taunton Ind 0.57 473 222 82 2.1 3.0 748 1046 676 380 26 1.1 13 37 82 750 -221701 824 Kings of Wessex CofE F Sch Cheddar Comp 0.67 491 221 142 2.2 2.9 741 1079 722 946 29 1.3 15 45 142 616 123386 832 King’s School Bruton Ind 1.86 553 238 52 2.3 3.2 840 558 375 574 50 1.6 31 39 52 409 446332 374 Kingswood School Bath Ind 2.08 545 244 78 2.2 3.1 869 449 265 329 48 1.7 26 41 78 363 42630 550 Millfi eld School Street Ind 0.89 435 235 251 1.9 2.9 778 880 442 436 41 1.2 17 41 235 632 -80243 417 Monkton Combe School Bath Ind 2.67 618 246 64 2.5 3.1 831 601 297 428 46 2.0 31 36 64 258 174969 755 Nailsea School Bristol Comp 0.07 419 219 103 1.9 2.8 691 1350 981 774 27 0.9 9 48 103 1039 -214
698 Norton Hill School Midsomer Nort Comp 0.68 481 223 88 2.2 2.9 826 632 758 28 1.2 15 54 87 634
546 904 Oldfi eld School Bath Comp 1.14 517 227 29 2.3 2.9 769 925 574 33 1.4 14 100 29 512 358148 88 Queen Elizabeth’s Hospital Clifton Ind 3.19 685 246 77 2.8 3.1 868 456 190 106 54 2.2 44 0 77 157 -60418 301 Queen’s College Taunton Ind 1.70 561 233 68 2.4 3.1 838 565 395 305 48 1.7 26 43 68 339 -117774 541 Ralph Allen School Bath Comp 0.51 386 235 76 1.6 2.6 738 1100 772 430 38 1.1 12 45 76 823 -233166 171 Red Maids School Bristol Ind 3.07 654 249 35 2.6 3.0 916 320 143 290 57 2.1 49 100 35 180 5273 127 Redland High School For Girls Bristol Ind 2.47 605 243 47 2.5 3.1 871 441 258 103 49 1.9 30 100 47 269 -146539 527 Richard Huish College Taunton 6th 1.20 509 230 750 2.2 2.7 816 687 542 536 32 1.3 17 54 736 581 -12257 274 Royal High School Bath Ind 2.60 617 244 61 2.5 3.1 870 444 231 299 51 1.9 28 100 61 276 17610 Sexey’s School Bruton Comp 0.94 467 231 89 2.0 2.9 764 958 591 26 1.2 11 58 89 702140 349 Sidcot School Winscombe Ind 3.26 712 244 25 2.9 3.2 883 402 310 554 58 2.2 44 36 25 146 209
910 792 St Mary Redcliffe & Temple Sch Bristol Comp 0.20 442 218 203 2.0 2.7 749 1038 844 708 24 1.1 9 61 201 849 -118
873 Strode College Street Other 0.28 403 226 500 1.8 2.6 713 1227 762 940 33 1.0 14 56 306 936307 374 Taunton School Taunton Ind 2.26 565 245 78 2.3 2.9 824 643 341 334 54 1.8 32 47 78 313 67351 296 Wellington School Wellington Ind 2.00 596 234 88 2.5 3.1 824 644 452 385 42 1.7 26 43 88 373 -55231 256 Wells Cathedral School Wells Ind 2.73 631 245 73 2.6 3.1 792 817 272 295 52 1.9 36 56 73 264 25756 Wellsway School Keynsham Comp 0.56 426 229 128 1.9 2.7 726 1156 635 869 30 1.0 10 54 128 877Staffordshire 388 169 105 1.8 2.6 719 0.7475 755 Blessed William How Cath Sch Stafford Comp 1.44 564 226 59 2.5 2.9 946 245 506 25 1.4 15 56 59 522 280639 Denstone College Uttoxeter Ind 0.86 475 228 69 2.1 2.9 761 974 500 761 35 1.3 19 36 69 574647 702 King Edward VI School Lichfi eld Comp 0.84 468 228 119 2.1 2.6 902 354 879 646 34 1.2 19 52 118 682 55867 931 Nether Stowe High School Lichfi eld Comp 0.30 430 222 45 1.9 2.7 860 474 25 1.0 11 56 45 886 64
327 282 Newcastle-under-Lyme Sch Newcastle u L Ind 2.16 601 237 97 2.5 3.1 990 157 278 208 50 1.8 33 57 97 303 -45
889 678 St John Fisher Cath High Sch Newcastle u L Comp 0.24 488 212 71 2.3 2.8 748 1044 791 18 1.0 13 62 71 944 -211
528 608 St Joseph’s College Stoke-on-Trent Gram 1.24 508 231 134 2.2 2.9 948 237 649 812 38 1.3 17 46 134 563 80
480 366 Stafford Grammar School Stafford Ind 1.41 460 243 29 1.9 3.0 838 564 260 279 44 1.3 28 52 29 576 -114768 965 Thomas Alleyne’s High School Uttoxeter Comp 0.53 469 221 158 2.1 2.8 721 1187 851 24 1.1 12 55 139 856 197Suffolk 447 192 93 2.1 2.7 761 1.0
662 776 Bury St Edmunds County USch
Bury St Edm’ds Comp 0.80 479 226 100 2.1 2.7 752 1021 631 797 33 1.2 19 64 96 639 114
475 397 Culford School Bury St Edm’ds Ind 1.44 544 230 62 2.4 3.1 794 805 521 529 39 1.7 23 37 62 378 -78
701 704 Farlingaye High School Woodbridge Comp 0.67 472 224 134 2.1 2.9 963 205 479 506 32 1.2 14 45 132 691 3347 370 Framlingham College Woodbridge Ind 2.02 598 234 81 2.6 3.2 844 539 426 391 40 1.7 25 36 81 353 23219 259 Ipswich High School Ipswich Ind 2.79 618 248 43 2.5 3.1 882 407 170 265 54 2.0 30 100 43 227 40222 319 Ipswich School Ipswich Ind 2.78 628 247 106 2.5 3.1 926 295 161 348 52 2.0 34 35 106 219 97962 993 Kesgrave High School Ipswich Comp 0.08 416 220 123 1.9 3.0 912 326 761 720 21 1.0 8 51 123 954 31
661 535 King Edward VI CofE Up Sch Bury St Edm’ds Comp 0.81 478 226 154 2.1 2.8 768 929 719 499 22 1.1 10 53 154 843 -126
593 719 Northgate High School Ipswich Comp 0.99 496 227 229 2.2 2.9 890 380 480 548 35 1.4 20 58 229 550 126472 647 Royal Hospital School Ipswich Ind 1.45 529 232 79 2.3 2.9 873 433 429 389 35 1.4 16 32 79 509 175865 Sir John Leman High School Beccles Comp 0.31 405 227 97 1.8 2.4 851 513 38 1.1 16 51 95 803768 591 St Alban’s Catholic High Sch Ipswich Comp 0.53 478 220 69 2.2 2.7 979 180 598 480 18 1.1 10 71 69 789 -177
359 439 St Benedict’s Catholic Sch Bury St Edm’ds Comp 1.96 604 232 77 2.6 3.0 953 225 356 462 35 1.7 26 53 76 336 80
927 629 Thomas Mills High School Woodbridge Comp 0.16 451 216 141 2.1 2.7 757 991 767 22 1.0 10 49 140 892 -298
701 Thurston Community College Bury St Edm’ds Comp 0.67 472 224 159 2.1 2.8 830 610 546 958 30 1.2 16 56 157 689
327 379 Woodbridge School Woodbridge Ind 2.16 638 231 89 2.8 3.2 803 750 478 387 35 1.9 27 55 89 287 52Surrey 456 208 134 1.9 2.7 774 1.1604 696 Ashcombe School Dorking Comp 0.96 511 224 146 2.3 3.0 916 318 802 922 27 1.2 15 54 146 638 92822 Blenheim High School Epsom Comp 0.40 427 225 76 1.9 2.7 783 857 881 22 1.0 13 57 76 894895 Box Hill School Dorking Ind 0.23 426 222 53 1.9 2.8 656 1566 854 36 1.1 11 45 53 753298 250 Caterham School Caterham Ind 2.32 536 251 121 2.1 2.8 855 493 191 184 61 1.7 26 46 121 338 -4855 61 Charterhouse Godalming Ind 4.13 748 258 195 2.9 3.3 968 192 51 66 72 2.6 55 29 195 59 6
131 219 City of London Freemen’s Sch Ashtead Ind 3.34 670 252 90 2.7 3.2 1132 22 78 170 64 2.2 44 49 90 153 88873 Claremont Fan Court School Esher Ind 0.28 432 222 20 2.0 2.9 755 1005 727 760 28 1.1 10 45 20 791248 246 Cranleigh School Cranleigh Ind 2.64 588 250 107 2.4 3.0 910 338 196 292 50 2.0 31 36 107 222 -2390 Dunottar Day School for Girls Reigate Ind 1.84 537 240 21 2.2 3.2 829 614 399 49 1.7 24 100 21 346153 186 Epsom College Epsom Ind 3.12 649 251 175 2.6 3.2 917 315 129 197 59 2.2 39 35 175 176 33
924 783 Esher College Thames Ditton 6th 0.17 413 222 702 1.9 2.7 777 883 808 710 26 1.0 12 53 682 979 -141
956 861 Ewell Castle School Epsom Ind 0.09 466 212 25 2.2 2.9 674 1442 22 1.2 16 0 25 637 -95588 868 Frensham Heights School Farnham Ind 1.00 436 237 43 1.8 2.7 793 809 355 689 48 1.3 14 70 43 587 280543 912 Fullbrook School Addlestone Comp 1.17 510 229 98 2.2 2.8 819 675 889 27 1.2 11 53 97 642 369848 501 George Abbot School Guildford Comp 0.34 389 230 193 1.7 2.8 831 597 494 370 33 1.1 11 56 192 826 -347706 814 Godalming College Godalming 6th 0.65 437 229 648 1.9 2.7 840 556 666 656 32 1.2 14 53 623 733 108340 407 Guildford County School Guildford Comp 2.04 604 233 56 2.6 3.0 852 507 627 582 32 1.7 23 68 56 362 6721 17 Guildford High School Guildford Ind 4.77 798 264 78 3.0 3.2 1006 126 13 12 85 2.9 73 100 78 31 -4
879 956 Heathside School Weybridge Comp 0.27 385 229 119 1.7 2.8 818 681 491 734 31 1.0 8 40 119 889 77
740 Hinchley Wood School Hinchley Wood Comp 0.59 493 219 39 2.3 3.0 783 853 26 1.2 13 39 39 671
662 704 Howard of Effi ngham School Leatherhead Comp 0.80 468 228 162 2.1 2.9 823 649 697 821 30 1.2 13 54 162 672 42724 507 Hurtwood House School Dorking Ind 0.62 361 241 140 1.5 3.0 827 629 188 126 48 1.2 11 61 140 695 -217513 435 King Edward’s School (IB) Godalming Ind 1.31 524 230 64 2.3 3.2 818 679 663 572 33 1.4 20 32 50 492 -78395 495 Lingfi eld Notre Dame Lingfi eld Ind 1.82 548 238 39 2.3 3.0 827 628 330 476 30 1.7 13 67 39 363 100
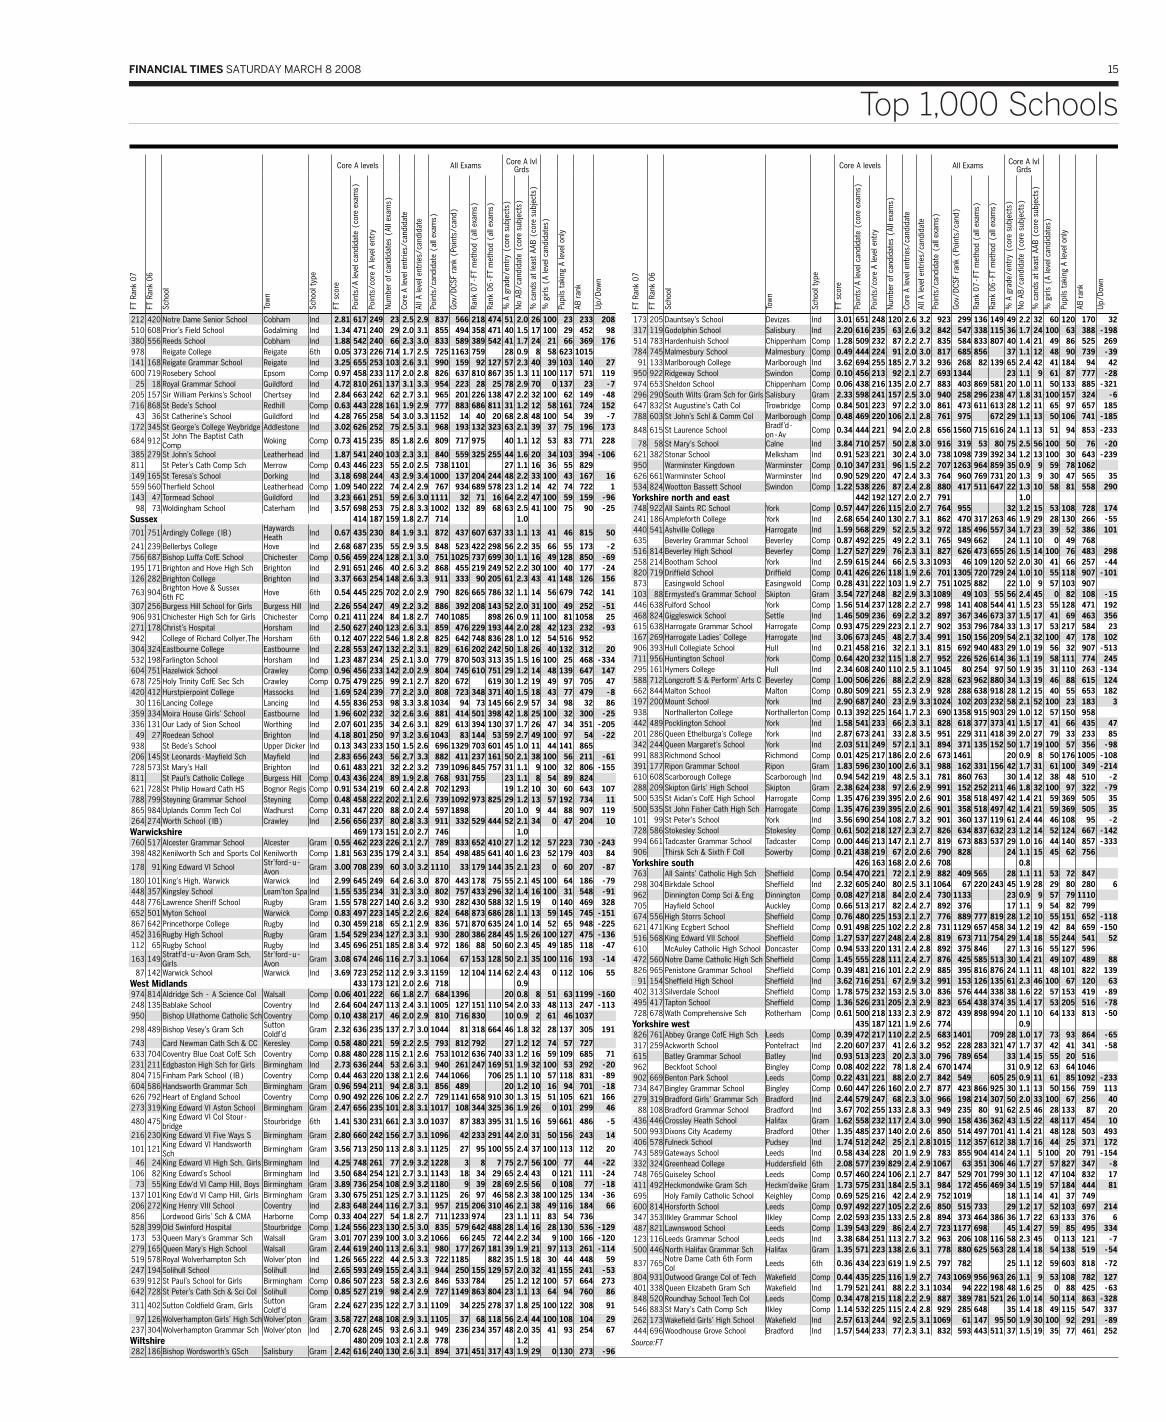
FINANCIAL TIMES SATURDAY MARCH 8 2008 15
Top 1,000 Schools
Core A levels All Exams Core A lvl Grds
FT R
ank
07
FT R
ank
06
Scho
ol
Tow
n
Scho
ol ty
pe
FT s
core
Poin
ts/A
leve
l can
dida
te (
core
exa
ms)
Poin
ts/c
ore
A le
vel e
ntry
Num
ber
of c
andi
date
s (A
ll ex
ams)
Core
A le
vel e
ntrie
s/ca
ndid
ate
All A
leve
l ent
ries/
cand
idat
e
Poin
ts/c
andi
date
(al
l exa
ms)
Gov
/DCS
F ra
nk (
Poin
ts/c
and)
Rank
07-
FT m
etho
d (a
ll ex
ams)
Rank
06-
FT m
etho
d (a
ll ex
ams)
% A
gra
de/e
ntry
(co
re s
ubje
cts)
No
AB/c
andi
date
(co
re s
ubje
cts)
% c
ands
at
leas
t AA
B (c
ore
subj
ects
)
% g
irls
(A le
vel c
andi
date
s)
Pupi
ls t
akin
g A
leve
l onl
y
AB r
ank
Up/
Dow
n
212 420 Notre Dame Senior School Cobham Ind 2.81 617 249 23 2.5 2.9 837 566 218 474 51 2.0 26 100 23 233 208510 608 Prior’s Field School Godalming Ind 1.34 471 240 29 2.0 3.1 855 494 358 471 40 1.5 17 100 29 452 98380 556 Reeds School Cobham Ind 1.88 542 240 66 2.3 3.0 833 589 389 542 41 1.7 24 21 66 369 176978 Reigate College Reigate 6th 0.05 373 226 714 1.7 2.5 725 1163 759 28 0.9 8 58 623 1015141 168 Reigate Grammar School Reigate Ind 3.25 655 253 103 2.6 3.1 990 159 92 127 57 2.3 40 39 103 140 27600 719 Rosebery School Epsom Comp 0.97 458 233 117 2.0 2.8 826 637 810 867 35 1.3 11 100 117 571 11925 18 Royal Grammar School Guildford Ind 4.72 810 261 137 3.1 3.3 954 223 28 25 78 2.9 70 0 137 23 -7
205 157 Sir William Perkins’s School Chertsey Ind 2.84 663 242 62 2.7 3.1 965 201 226 138 47 2.2 32 100 62 149 -48716 868 St Bede’s School Redhill Comp 0.63 443 228 161 1.9 2.9 777 883 686 811 31 1.2 12 58 161 724 15243 36 St Catherine’s School Guildford Ind 4.28 765 258 54 3.0 3.3 1152 14 40 20 68 2.8 48 100 54 39 -7
172 345 St George’s College Weybridge Addlestone Ind 3.02 626 252 75 2.5 3.1 968 193 132 323 63 2.1 39 37 75 196 173
684 912 St John The Baptist Cath Comp Woking Comp 0.73 415 235 85 1.8 2.6 809 717 975 40 1.1 12 53 83 771 228
385 279 St John’s School Leatherhead Ind 1.87 541 240 103 2.3 3.1 840 559 325 255 44 1.6 20 34 103 394 -106811 St Peter’s Cath Comp Sch Merrow Comp 0.43 446 223 55 2.0 2.5 738 1101 27 1.1 16 36 55 829149 165 St Teresa’s School Dorking Ind 3.18 698 244 43 2.9 3.4 1000 137 204 244 48 2.2 33 100 43 167 16559 560 Therfi eld School Leatherhead Comp 1.09 540 222 74 2.4 2.9 767 934 689 578 23 1.2 14 42 74 722 1143 47 Tormead School Guildford Ind 3.23 661 251 59 2.6 3.0 1111 32 71 16 64 2.2 47 100 59 159 -9698 73 Woldingham School Caterham Ind 3.57 698 253 75 2.8 3.3 1002 132 89 68 63 2.5 41 100 75 90 -25
Sussex 414 187 159 1.8 2.7 714 1.0
701 751 Ardingly College (IB) Haywards Heath Ind 0.67 435 230 84 1.9 3.1 872 437 607 637 33 1.1 13 41 46 815 50
241 239 Bellerbys College Hove Ind 2.68 687 235 55 2.9 3.5 848 523 422 298 56 2.2 35 66 55 173 -2756 687 Bishop Luffa CofE School Chichester Comp 0.56 459 224 128 2.1 3.0 751 1025 737 699 30 1.1 16 49 128 850 -69195 171 Brighton and Hove High Sch Brighton Ind 2.91 651 246 40 2.6 3.2 868 455 219 249 52 2.2 30 100 40 177 -24126 282 Brighton College Brighton Ind 3.37 663 254 148 2.6 3.3 911 333 90 205 61 2.3 43 41 148 126 156
763 904 Brighton Hove & Sussex 6th FC Hove 6th 0.54 445 225 702 2.0 2.9 790 826 665 786 32 1.1 14 56 679 742 141
307 256 Burgess Hill School for Girls Burgess Hill Ind 2.26 554 247 49 2.2 3.2 886 392 208 143 52 2.0 31 100 49 252 -51906 931 Chichester High Sch for Girls Chichester Comp 0.21 411 224 84 1.8 2.7 740 1085 898 26 0.9 11 100 81 1058 25271 178 Christ’s Hospital Horsham Ind 2.50 627 240 123 2.6 3.1 859 476 229 193 44 2.0 28 42 123 232 -93942 College of Richard Collyer,The Horsham 6th 0.12 407 222 546 1.8 2.8 825 642 748 836 28 1.0 12 54 516 952304 324 Eastbourne College Eastbourne Ind 2.28 553 247 132 2.2 3.1 829 616 202 242 50 1.8 26 40 132 312 20532 198 Farlington School Horsham Ind 1.23 487 234 25 2.1 3.0 779 870 503 313 35 1.5 16 100 25 468 -334604 751 Hazelwick School Crawley Comp 0.96 456 233 142 2.0 2.9 804 745 610 751 29 1.2 14 48 139 647 147678 725 Holy Trinity CofE Sec Sch Crawley Comp 0.75 479 225 99 2.1 2.7 820 672 619 30 1.2 19 49 97 705 47420 412 Hurstpierpoint College Hassocks Ind 1.69 524 239 77 2.2 3.0 808 723 348 371 40 1.5 18 43 77 479 -830 116 Lancing College Lancing Ind 4.55 836 253 98 3.3 3.8 1034 94 73 145 66 2.9 57 34 98 32 86
359 334 Moira House Girls’ School Eastbourne Ind 1.96 602 232 32 2.6 3.6 881 414 501 398 42 1.8 25 100 32 300 -25336 131 Our Lady of Sion School Worthing Ind 2.07 601 235 34 2.6 3.1 829 613 394 130 37 1.7 26 47 34 351 -20549 27 Roedean School Brighton Ind 4.18 801 250 97 3.2 3.6 1043 83 144 53 59 2.7 49 100 97 54 -22
938 St Bede’s School Upper Dicker Ind 0.13 343 233 150 1.5 2.6 696 1329 703 601 45 1.0 11 44 141 865206 145 St Leonards-Mayfi eld Sch Mayfi eld Ind 2.83 656 243 56 2.7 3.3 882 411 237 161 50 2.1 38 100 56 211 -61728 573 St Mary’s Hall Brighton Ind 0.61 483 221 32 2.2 3.2 739 1096 845 757 31 1.1 9 100 32 806 -155811 St Paul’s Catholic College Burgess Hill Comp 0.43 436 224 89 1.9 2.8 768 931 755 23 1.1 8 54 89 824621 728 St Philip Howard Cath HS Bognor Regis Comp 0.91 534 219 60 2.4 2.8 702 1293 19 1.2 10 30 60 643 107788 799 Steyning Grammar School Steyning Comp 0.48 458 222 202 2.1 2.6 739 1092 973 825 29 1.2 13 57 192 734 11865 984 Uplands Comm Tech Col Wadhurst Comp 0.31 447 220 88 2.0 2.4 597 1898 20 1.0 9 44 88 907 119264 274 Worth School (IB) Crawley Ind 2.56 656 237 80 2.8 3.3 911 332 529 444 52 2.1 34 0 47 204 10Warwickshire 469 173 151 2.0 2.7 746 1.0760 517 Alcester Grammar School Alcester Gram 0.55 462 223 226 2.1 2.7 789 833 652 410 27 1.2 12 57 223 730 -243398 482 Kenilworth Sch and Sports Col Kenilworth Comp 1.81 563 235 179 2.4 3.1 854 498 485 641 40 1.6 23 52 179 403 84
178 91 King Edward VI School Str’ford-u-Avon Gram 3.00 708 239 60 3.0 3.2 1110 33 179 144 35 2.1 23 0 60 207 -87
180 101 King’s High, Warwick Warwick Ind 2.99 645 249 64 2.6 3.0 870 443 178 75 55 2.1 45 100 64 186 -79448 357 Kingsley School Leam’ton Spa Ind 1.55 535 234 31 2.3 3.0 802 757 433 296 32 1.4 16 100 31 548 -91448 776 Lawrence Sheriff School Rugby Gram 1.55 578 227 140 2.6 3.2 930 282 430 588 32 1.5 19 0 140 469 328652 501 Myton School Warwick Comp 0.83 497 223 145 2.2 2.6 824 648 873 686 28 1.1 13 59 145 745 -151867 642 Princethorpe College Rugby Ind 0.30 459 218 65 2.1 2.9 836 571 870 635 24 1.0 14 52 65 948 -225452 316 Rugby High School Rugby Gram 1.54 529 234 127 2.3 3.1 930 280 386 284 45 1.5 26 100 127 475 -136112 65 Rugby School Rugby Ind 3.45 696 251 185 2.8 3.4 972 186 88 50 60 2.3 45 49 185 118 -47
163 149 Stratf’d-u-Avon Gram Sch, Girls
Str’ford-u-Avon Gram 3.08 674 246 116 2.7 3.1 1064 67 153 128 50 2.1 35 100 116 193 -14
87 142 Warwick School Warwick Ind 3.69 723 252 112 2.9 3.3 1159 12 104 114 62 2.4 43 0 112 106 55West Midlands 433 173 121 2.0 2.6 718 0.9974 814 Aldridge Sch - A Science Col Walsall Comp 0.06 401 222 66 1.8 2.7 684 1396 20 0.8 8 51 63 1199 -160248 135 Bablake School Coventry Ind 2.64 604 247 113 2.4 3.1 1005 127 151 110 54 2.0 33 48 113 247 -113950 Bishop Ullathorne Catholic Sch Coventry Comp 0.10 438 217 46 2.0 2.9 810 716 830 10 0.9 2 61 46 1037
298 489 Bishop Vesey’s Gram Sch Sutton Coldf’d Gram 2.32 636 235 137 2.7 3.0 1044 81 318 664 46 1.8 32 28 137 305 191
743 Card Newman Cath Sch & CC Keresley Comp 0.58 480 221 59 2.2 2.5 793 812 792 27 1.2 12 74 57 727633 704 Coventry Blue Coat CofE Sch Coventry Comp 0.88 480 228 115 2.1 2.6 753 1012 636 740 33 1.2 16 59 109 685 71231 211 Edgbaston High Sch for Girls Birmingham Ind 2.73 636 244 53 2.6 3.1 940 261 247 169 51 1.9 32 100 53 292 -20804 715 Finham Park School (IB) Coventry Comp 0.44 463 220 138 2.1 2.6 744 1066 706 25 1.1 10 57 118 831 -89604 586 Handsworth Grammar Sch Birmingham Gram 0.96 594 211 94 2.8 3.1 856 489 20 1.2 10 16 94 701 -18626 792 Heart of England School Coventry Comp 0.90 492 226 106 2.2 2.7 729 1141 658 910 30 1.3 15 51 105 621 166273 319 King Edward VI Aston School Birmingham Gram 2.47 656 235 101 2.8 3.1 1017 108 344 325 36 1.9 26 0 101 299 46
480 475 King Edward VI Col Stour-bridge Stourbridge 6th 1.41 530 231 661 2.3 3.0 1037 87 383 395 31 1.5 16 59 661 486 -5
216 230 King Edward VI Five Ways S Birmingham Gram 2.80 660 242 156 2.7 3.1 1096 42 233 291 44 2.0 31 50 156 243 14
101 121 King Edward VI Handsworth Sch Birmingham Gram 3.56 713 250 113 2.8 3.1 1125 27 95 100 55 2.4 37 100 113 112 20
46 24 King Edward VI High Sch, Girls Birmingham Ind 4.25 748 261 77 2.9 3.2 1228 3 8 7 75 2.7 56 100 77 44 -22106 82 King Edward’s School Birmingham Ind 3.50 684 254 121 2.7 3.1 1143 18 34 29 65 2.4 43 0 121 111 -2473 55 King Edw’d VI Camp Hill, Boys Birmingham Gram 3.89 736 254 108 2.9 3.2 1180 9 39 28 69 2.5 56 0 108 77 -18
137 101 King Edw’d VI Camp Hill, Girls Birmingham Gram 3.30 675 251 125 2.7 3.1 1125 26 97 46 58 2.3 38 100 125 134 -36206 272 King Henry VIII School Coventry Ind 2.83 648 244 116 2.7 3.1 957 215 206 310 46 2.1 38 49 116 184 66856 Lordwood Girls’ Sch & CMA Harborne Comp 0.33 404 227 54 1.8 2.7 711 1233 974 23 1.1 11 83 54 736528 399 Old Swinford Hospital Stourbridge Comp 1.24 556 223 130 2.5 3.0 835 579 642 488 28 1.4 16 28 130 536 -129173 53 Queen Mary’s Grammar Sch Walsall Gram 3.01 707 239 100 3.0 3.2 1066 66 245 72 44 2.2 34 9 100 166 -120279 165 Queen Mary’s High School Walsall Gram 2.44 619 240 113 2.6 3.1 980 177 267 181 39 1.9 21 97 113 261 -114519 578 Royal Wolverhampton Sch Wolver’pton Ind 1.26 565 222 44 2.5 3.3 722 1185 882 35 1.5 18 30 44 448 59247 194 Solihull School Solihull Ind 2.65 593 249 155 2.4 3.1 944 250 155 129 57 2.0 32 41 155 241 -53639 912 St Paul’s School for Girls Birmingham Comp 0.86 507 223 58 2.3 2.6 846 533 784 25 1.2 12 100 57 664 273642 728 St Peter’s Cath Sch & Sci Col Solihull Comp 0.85 527 219 98 2.4 2.9 727 1149 863 804 23 1.1 13 64 94 760 86
311 402 Sutton Coldfi eld Gram, Girls Sutton Coldf’d Gram 2.24 627 235 122 2.7 3.1 1109 34 225 278 37 1.8 25 100 122 308 91
97 126 Wolverhampton Girls’ High Sch Wolver’pton Gram 3.58 727 248 108 2.9 3.1 1105 37 68 118 56 2.4 44 100 108 104 29237 304 Wolverhampton Grammar Sch Wolver’pton Ind 2.70 628 245 93 2.6 3.1 949 236 234 357 48 2.0 35 41 93 254 67Wiltshire 480 209 103 2.1 2.8 778 1.2282 186 Bishop Wordsworth’s GSch Salisbury Gram 2.42 616 240 130 2.6 3.1 894 371 451 317 43 1.9 29 0 130 273 -96
Core A levels All Exams Core A lvl Grds
FT R
ank
07
FT R
ank
06
Scho
ol
Tow
n
Scho
ol ty
pe
FT s
core
Poin
ts/A
leve
l can
dida
te (
core
exa
ms)
Poin
ts/c
ore
A le
vel e
ntry
Num
ber
of c
andi
date
s (A
ll ex
ams)
Core
A le
vel e
ntrie
s/ca
ndid
ate
All A
leve
l ent
ries/
cand
idat
e
Poin
ts/c
andi
date
(al
l exa
ms)
Gov
/DCS
F ra
nk (
Poin
ts/c
and)
Rank
07-
FT m
etho
d (a
ll ex
ams)
Rank
06-
FT m
etho
d (a
ll ex
ams)
% A
gra
de/e
ntry
(co
re s
ubje
cts)
No
AB/c
andi
date
(co
re s
ubje
cts)
% c
ands
at
leas
t AA
B (c
ore
subj
ects
)
% g
irls
(A le
vel c
andi
date
s)
Pupi
ls t
akin
g A
leve
l onl
y
AB r
ank
Up/
Dow
n
173 205 Dauntsey’s School Devizes Ind 3.01 651 248 120 2.6 3.2 923 299 136 149 49 2.2 32 60 120 170 32317 119 Godolphin School Salisbury Ind 2.20 616 235 63 2.6 3.2 842 547 338 115 36 1.7 24 100 63 388 -198514 783 Hardenhuish School Chippenham Comp 1.28 509 232 87 2.2 2.7 835 584 833 807 40 1.4 21 49 86 525 269784 745 Malmesbury School Malmesbury Comp 0.49 444 224 91 2.0 3.0 817 685 856 37 1.1 12 48 90 739 -3991 133 Marlborough College Marlborough Ind 3.62 694 255 185 2.7 3.2 936 268 82 139 65 2.4 42 41 184 94 42
950 922 Ridgeway School Swindon Comp 0.10 456 213 92 2.1 2.7 693 1344 23 1.1 9 61 87 777 -28974 653 Sheldon School Chippenham Comp 0.06 438 216 135 2.0 2.7 883 403 869 581 20 1.0 11 50 133 885 -321296 290 South Wilts Gram Sch for Girls Salisbury Gram 2.33 598 241 157 2.5 3.0 940 258 296 238 47 1.8 31 100 157 324 -6647 832 St Augustine’s Cath Col Trowbridge Comp 0.84 501 223 97 2.2 3.0 861 473 611 613 28 1.2 11 65 97 657 185788 603 St John’s Schl & Comm Col Marlborough Comp 0.48 469 220 106 2.1 2.8 761 975 672 29 1.1 13 50 106 741 -185
848 615 St Laurence School Bradf’d-on-Av Comp 0.34 444 221 94 2.0 2.8 656 1560 715 616 24 1.1 13 51 94 853 -233
78 58 St Mary’s School Calne Ind 3.84 710 257 50 2.8 3.0 916 319 53 80 75 2.5 56 100 50 76 -20621 382 Stonar School Melksham Ind 0.91 523 221 30 2.4 3.0 738 1098 739 392 34 1.2 13 100 30 643 -239950 Warminster Kingdown Warminster Comp 0.10 347 231 96 1.5 2.2 707 1263 964 859 35 0.9 9 59 78 1062626 661 Warminster School Warminster Ind 0.90 529 220 47 2.4 3.3 764 960 769 731 20 1.3 9 30 47 565 35534 824 Wootton Bassett School Swindon Comp 1.22 538 226 87 2.4 2.8 880 417 511 647 22 1.3 10 58 81 558 290Yorkshire north and east 442 192 127 2.0 2.7 791 1.0748 922 All Saints RC School York Comp 0.57 447 226 115 2.0 2.7 764 955 32 1.2 15 53 108 728 174241 186 Ampleforth College York Ind 2.68 654 240 130 2.7 3.1 862 470 317 263 46 1.9 29 28 130 266 -55440 541 Ashville College Harrogate Ind 1.59 568 229 52 2.5 3.2 972 185 496 557 34 1.7 23 39 52 386 101635 Beverley Grammar School Beverley Comp 0.87 492 225 49 2.2 3.1 765 949 662 24 1.1 10 0 49 768516 814 Beverley High School Beverley Comp 1.27 527 229 76 2.3 3.1 827 626 473 655 26 1.5 14 100 76 483 298258 214 Bootham School York Ind 2.59 615 244 66 2.5 3.3 1093 46 109 120 52 2.0 30 41 66 257 -44820 719 Driffi eld School Driffi eld Comp 0.41 426 226 118 1.9 2.6 701 1305 720 729 24 1.0 10 55 118 907 -101873 Easingwold School Easingwold Comp 0.28 431 222 103 1.9 2.7 751 1025 882 22 1.0 9 57 103 907103 88 Ermysted’s Grammar School Skipton Gram 3.54 727 248 82 2.9 3.3 1089 49 103 55 56 2.4 45 0 82 108 -15446 638 Fulford School York Comp 1.56 514 237 128 2.2 2.7 998 141 408 544 41 1.5 23 55 128 471 192468 824 Giggleswick School Settle Ind 1.46 509 236 69 2.2 3.2 897 367 346 673 37 1.5 17 41 69 463 356615 638 Harrogate Grammar School Harrogate Comp 0.93 475 229 223 2.1 2.7 902 353 796 784 33 1.3 17 53 217 584 23167 269 Harrogate Ladies’ College Harrogate Ind 3.06 673 245 48 2.7 3.4 991 150 156 209 54 2.1 32 100 47 178 102906 393 Hull Collegiate School Hull Ind 0.21 458 216 32 2.1 3.1 815 692 940 483 29 1.0 19 56 32 907 -513711 956 Huntington School York Comp 0.64 420 232 115 1.8 2.7 952 226 526 614 36 1.1 19 58 111 774 245295 161 Hymers College Hull Ind 2.34 608 240 110 2.5 3.1 1045 80 254 97 50 1.9 35 31 110 263 -134588 712 Longcroft S & Perform’ Arts C Beverley Comp 1.00 506 226 88 2.2 2.9 828 623 962 880 34 1.3 19 46 88 615 124662 844 Malton School Malton Comp 0.80 509 221 55 2.3 2.9 928 288 638 918 28 1.2 15 40 55 653 182197 200 Mount School York Ind 2.90 687 240 23 2.9 3.3 1024 102 203 232 58 2.1 52 100 23 183 3938 Northallerton College Northallerton Comp 0.13 392 225 164 1.7 2.3 690 1358 915 903 29 1.0 12 57 150 958442 489 Pocklington School York Ind 1.58 541 233 66 2.3 3.1 828 618 377 373 41 1.5 17 41 66 435 47201 286 Queen Ethelburga’s College York Ind 2.87 673 241 33 2.8 3.5 951 229 311 418 39 2.0 27 79 33 233 85342 244 Queen Margaret’s School York Ind 2.03 511 249 57 2.1 3.1 894 371 135 152 50 1.7 19 100 57 356 -98991 883 Richmond School Richmond Comp 0.01 425 217 186 2.0 2.6 673 1461 20 0.9 8 50 176 1005 -108391 177 Ripon Grammar School Ripon Gram 1.83 596 230 100 2.6 3.1 988 162 331 156 42 1.7 31 61 100 349 -214610 608 Scarborough College Scarborough Ind 0.94 542 219 48 2.5 3.1 781 860 763 30 1.4 12 38 48 510 -2288 209 Skipton Girls’ High School Skipton Gram 2.38 624 238 97 2.6 2.9 991 152 252 211 46 1.8 32 100 97 322 -79500 535 St Aidan’s CofE High School Harrogate Comp 1.35 476 239 395 2.0 2.6 901 358 518 497 42 1.4 21 59 369 505 35500 535 St John Fisher Cath High Sch Harrogate Comp 1.35 476 239 395 2.0 2.6 901 358 518 497 42 1.4 21 59 369 505 35101 99 St Peter’s School York Ind 3.56 690 254 108 2.7 3.2 901 360 137 119 61 2.4 44 46 108 95 -2728 586 Stokesley School Stokesley Comp 0.61 502 218 127 2.3 2.7 826 634 837 632 23 1.2 14 52 124 667 -142994 661 Tadcaster Grammar School Tadcaster Comp 0.00 446 213 147 2.1 2.7 819 673 883 537 29 1.0 16 44 140 857 -333906 Thirsk Sch & Sixth F Coll Sowerby Comp 0.21 438 219 67 2.0 2.6 790 828 24 1.1 15 45 62 756Yorkshire south 426 163 168 2.0 2.6 708 0.8763 All Saints’ Catholic High Sch Sheffi eld Comp 0.54 470 221 72 2.1 2.9 882 409 565 28 1.1 11 53 72 847298 304 Birkdale School Sheffi eld Ind 2.32 605 240 80 2.5 3.1 1064 67 220 243 45 1.9 28 29 80 280 6962 Dinnington Comp Sci & Eng Dinnington Comp 0.08 427 218 84 2.0 2.4 730 1133 23 0.9 9 57 79 1110705 Hayfi eld School Auckley Comp 0.66 513 217 82 2.4 2.7 892 376 17 1.1 9 54 82 799674 556 High Storrs School Sheffi eld Comp 0.76 480 225 153 2.1 2.7 776 889 777 819 28 1.2 10 55 151 652 -118621 471 King Ecgbert School Sheffi eld Comp 0.91 498 225 102 2.2 2.8 731 1129 657 458 34 1.2 19 42 84 659 -150516 568 King Edward VII School Sheffi eld Comp 1.27 537 227 248 2.4 2.8 819 673 711 754 29 1.4 18 55 244 541 52610 McAuley Catholic High School Doncaster Comp 0.94 533 220 131 2.4 2.8 892 375 846 27 1.3 16 55 127 596472 560 Notre Dame Catholic High Sch Sheffi eld Comp 1.45 555 228 111 2.4 2.7 876 425 585 513 30 1.4 21 49 107 489 88826 965 Penistone Grammar School Sheffi eld Comp 0.39 481 216 101 2.2 2.9 885 395 816 876 24 1.1 11 48 101 822 13991 154 Sheffi eld High School Sheffi eld Ind 3.62 716 251 67 2.9 3.2 991 153 126 135 61 2.3 46 100 67 120 63
402 313 Silverdale School Sheffi eld Comp 1.78 575 232 153 2.5 3.0 836 576 444 338 38 1.6 22 57 153 419 -89495 417 Tapton School Sheffi eld Comp 1.36 526 231 205 2.3 2.9 823 654 438 374 35 1.4 17 53 205 516 -78728 678 Wath Comprehensive Sch Rotherham Comp 0.61 500 218 133 2.3 2.9 872 439 898 994 20 1.1 10 64 133 813 -50Yorkshire west 435 187 121 1.9 2.6 774 0.9826 761 Abbey Grange CofE High Sch Leeds Comp 0.39 472 217 110 2.2 2.5 683 1401 709 28 1.0 17 73 93 864 -65317 259 Ackworth School Pontefract Ind 2.20 607 237 41 2.6 3.2 952 228 283 321 47 1.7 37 42 41 341 -58615 Batley Grammar School Batley Ind 0.93 513 223 20 2.3 3.0 796 789 654 33 1.4 15 55 20 516962 Beckfoot School Bingley Comp 0.08 402 222 78 1.8 2.4 670 1474 31 0.9 12 63 64 1046902 669 Benton Park School Leeds Comp 0.22 431 221 88 2.0 2.7 842 549 605 25 0.9 11 61 85 1092 -233734 847 Bingley Grammar School Bingley Comp 0.60 447 226 160 2.0 2.7 877 423 866 925 30 1.1 13 50 156 759 113279 319 Bradford Girls’ Grammar Sch Bradford Ind 2.44 579 247 68 2.3 3.0 966 198 214 307 50 2.0 33 100 67 256 4088 108 Bradford Grammar School Bradford Ind 3.67 702 255 133 2.8 3.3 949 235 80 91 62 2.5 46 28 133 87 20
436 446 Crossley Heath School Halifax Gram 1.62 558 232 117 2.4 3.0 990 158 436 362 43 1.5 22 48 117 454 10500 993 Dixons City Academy Bradford Other 1.35 485 237 140 2.0 2.6 850 514 497 701 41 1.4 21 48 128 503 493406 578 Fulneck School Pudsey Ind 1.74 512 242 25 2.1 2.8 1015 112 357 612 38 1.7 16 44 25 371 172743 589 Gateways School Leeds Ind 0.58 434 228 20 1.9 2.9 783 855 904 414 24 1.1 5 100 20 791 -154332 324 Greenhead College Huddersfi eld 6th 2.08 577 239 829 2.4 2.9 1067 63 351 306 46 1.7 27 57 827 347 -8748 765 Guiseley School Leeds Comp 0.57 460 224 106 2.1 2.7 847 529 701 799 30 1.1 12 47 104 832 17411 492 Heckmondwike Gram Sch Heckm’dwike Gram 1.73 575 231 184 2.5 3.1 984 172 456 469 34 1.5 19 57 184 444 81695 Holy Family Catholic School Keighley Comp 0.69 525 216 42 2.4 2.9 752 1019 18 1.1 14 41 37 749600 814 Horsforth School Leeds Comp 0.97 492 227 105 2.2 2.6 850 515 733 29 1.2 17 52 103 697 214347 353 Ilkley Grammar School Ilkley Comp 2.02 593 235 133 2.5 2.8 894 373 464 386 36 1.7 22 63 133 376 6487 821 Lawnswood School Leeds Comp 1.39 543 229 86 2.4 2.7 723 1177 698 45 1.4 27 59 85 495 334123 116 Leeds Grammar School Leeds Ind 3.38 684 251 113 2.7 3.2 963 206 108 116 58 2.3 45 0 113 121 -7500 446 North Halifax Grammar Sch Halifax Gram 1.35 571 223 138 2.6 3.1 778 880 625 563 28 1.4 18 54 138 519 -54
837 765 Notre Dame Cath 6th Form Col Leeds 6th 0.36 434 223 619 1.9 2.5 797 782 25 1.1 12 59 603 818 -72
804 931 Outwood Grange Col of Tech Wakefi eld Comp 0.44 435 225 116 1.9 2.7 743 1069 956 963 26 1.1 9 53 108 782 127401 338 Queen Elizabeth Gram Sch Wakefi eld Ind 1.79 521 241 88 2.2 3.1 1034 94 222 198 48 1.6 25 0 88 425 -63848 520 Roundhay School Tech Col Leeds Comp 0.34 478 215 118 2.2 2.9 887 389 781 521 26 1.0 14 50 114 863 -328546 883 St Mary’s Cath Comp Sch Ilkley Comp 1.14 532 225 115 2.4 2.8 929 285 648 35 1.4 18 49 115 547 337262 173 Wakefi eld Girls’ High School Wakefi eld Ind 2.57 613 244 92 2.5 3.1 1069 61 147 95 50 1.9 30 100 92 291 -89444 696 Woodhouse Grove School Bradford Ind 1.57 544 233 77 2.3 3.1 832 593 443 511 37 1.5 19 35 77 461 252
Source:FT
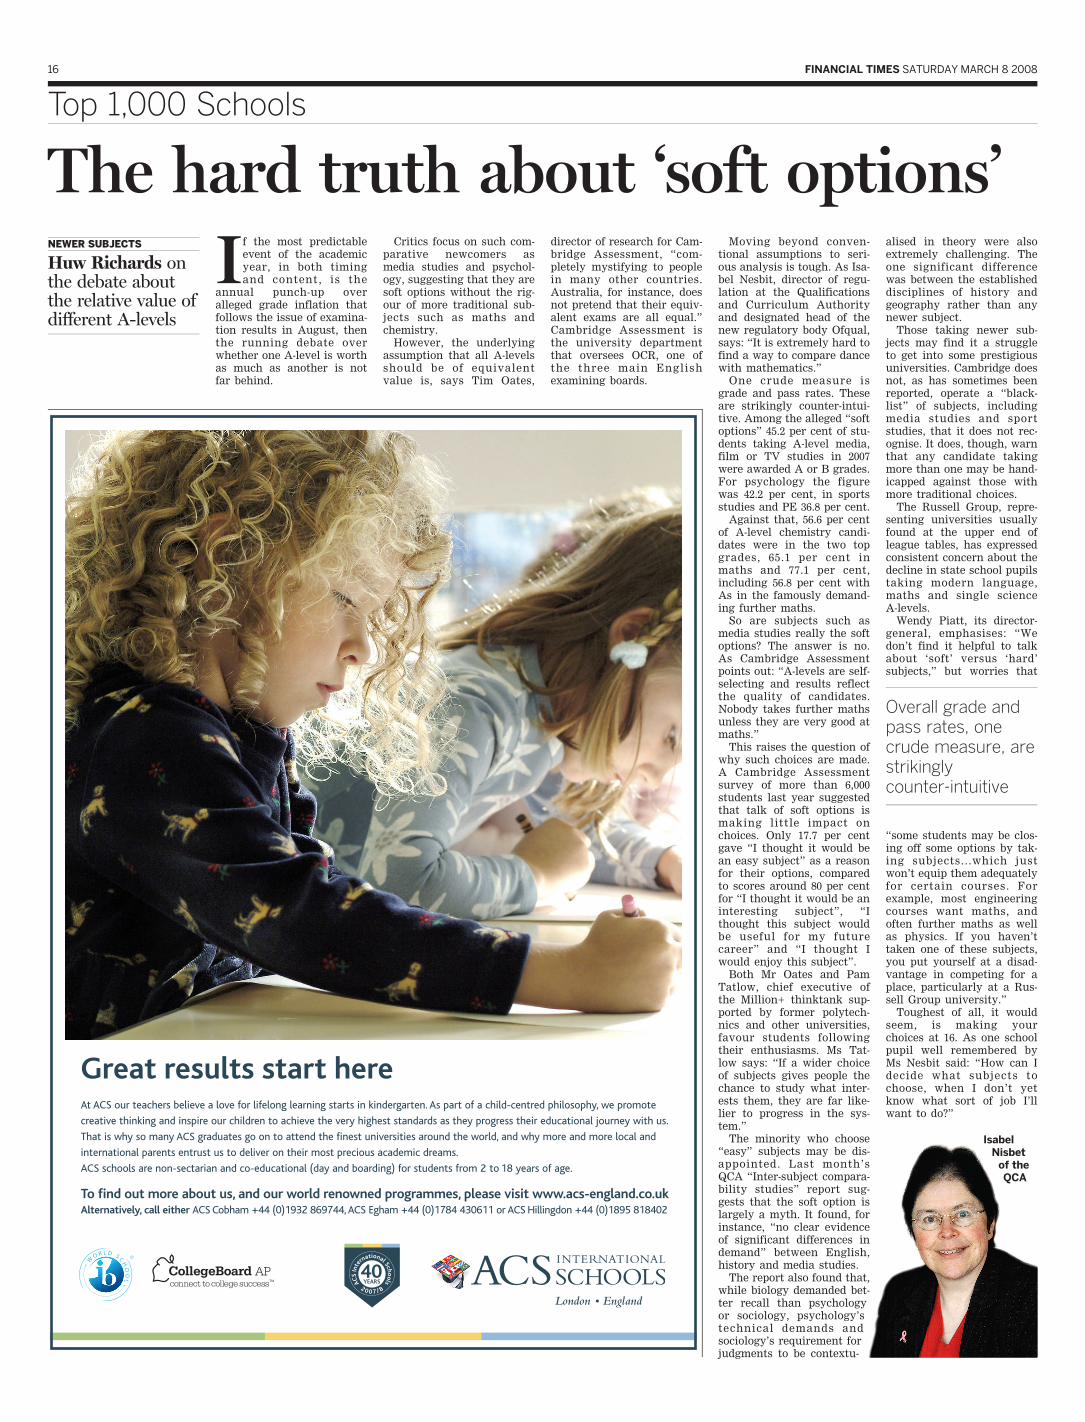
16 FINANCIAL TIMES SATURDAY MARCH 8 2008
Top 1,000 Schools
The hard truth about ‘soft options’If the most predictable
event of the academicyear, in both timingand content, is the
annual punch-up overalleged grade inflation thatfollows the issue of examina-tion results in August, thenthe running debate overwhether one A-level is worthas much as another is notfar behind.
Critics focus on such com-parative newcomers asmedia studies and psychol-ogy, suggesting that they aresoft options without the rig-our of more traditional sub-jects such as maths andchemistry.
However, the underlyingassumption that all A-levelsshould be of equivalentvalue is, says Tim Oates,
director of research for Cam-bridge Assessment, “com-pletely mystifying to peoplein many other countries.Australia, for instance, doesnot pretend that their equiv-alent exams are all equal.”Cambridge Assessment isthe university departmentthat oversees OCR, one ofthe three main Englishexamining boards.
Moving beyond conven-tional assumptions to seri-ous analysis is tough. As Isa-bel Nesbit, director of regu-lation at the Qualificationsand Curriculum Authorityand designated head of thenew regulatory body Ofqual,says: “It is extremely hard tofind a way to compare dancewith mathematics.”
One crude measure isgrade and pass rates. Theseare strikingly counter-intui-tive. Among the alleged “softoptions” 45.2 per cent of stu-dents taking A-level media,film or TV studies in 2007were awarded A or B grades.For psychology the figurewas 42.2 per cent, in sportsstudies and PE 36.8 per cent.
Against that, 56.6 per centof A-level chemistry candi-dates were in the two topgrades, 65.1 per cent inmaths and 77.1 per cent,including 56.8 per cent withAs in the famously demand-ing further maths.
So are subjects such asmedia studies really the softoptions? The answer is no.As Cambridge Assessmentpoints out: “A-levels are self-selecting and results reflectthe quality of candidates.Nobody takes further mathsunless they are very good atmaths.”
This raises the question ofwhy such choices are made.A Cambridge Assessmentsurvey of more than 6,000students last year suggestedthat talk of soft options ismaking little impact onchoices. Only 17.7 per centgave “I thought it would bean easy subject” as a reasonfor their options, comparedto scores around 80 per centfor “I thought it would be aninteresting subject”, “Ithought this subject wouldbe useful for my futurecareer” and “I thought Iwould enjoy this subject”.
Both Mr Oates and PamTatlow, chief executive ofthe Million+ thinktank sup-ported by former polytech-nics and other universities,favour students followingtheir enthusiasms. Ms Tat-low says: “If a wider choiceof subjects gives people thechance to study what inter-ests them, they are far like-lier to progress in the sys-tem.”
The minority who choose“easy” subjects may be dis-appointed. Last month’sQCA “Inter-subject compara-bility studies” report sug-gests that the soft option islargely a myth. It found, forinstance, “no clear evidenceof significant differences indemand” between English,history and media studies.
The report also found that,while biology demanded bet-ter recall than psychologyor sociology, psychology’stechnical demands andsociology’s requirement forjudgments to be contextu-
alised in theory were alsoextremely challenging. Theone significant differencewas between the establisheddisciplines of history andgeography rather than anynewer subject.
Those taking newer sub-jects may find it a struggleto get into some prestigiousuniversities. Cambridge doesnot, as has sometimes beenreported, operate a “black-list” of subjects, includingmedia studies and sportstudies, that it does not rec-ognise. It does, though, warnthat any candidate takingmore than one may be hand-icapped against those withmore traditional choices.
The Russell Group, repre-senting universities usuallyfound at the upper end ofleague tables, has expressedconsistent concern about thedecline in state school pupilstaking modern language,maths and single scienceA-levels.
Wendy Piatt, its director-general, emphasises: “Wedon’t find it helpful to talkabout ‘soft’ versus ‘hard’subjects,” but worries that
“some students may be clos-ing off some options by tak-ing subjects...which justwon’t equip them adequatelyfor certain courses. Forexample, most engineeringcourses want maths, andoften further maths as wellas physics. If you haven’ttaken one of these subjects,you put yourself at a disad-vantage in competing for aplace, particularly at a Rus-sell Group university.”
Toughest of all, it wouldseem, is making yourchoices at 16. As one schoolpupil well remembered byMs Nesbit said: “How can Idecide what subjects tochoose, when I don’t yetknow what sort of job I’llwant to do?”
NEWER SUBJECTS
Huw Richards onthe debate aboutthe relative value ofdifferent Alevels
Overall grade andpass rates, onecrude measure, arestrikinglycounterintuitive
IsabelNisbet
of theQ QCA

![Priors arXiv:1802.04073v2 [cs.CV] 15 Mar 2018static.tongtianta.site/paper_pdf/871b0816-ec63-11e8-a02c-00163e08bb86.pdfMuhammad Asim , Fahad Shamshad , and Ali Ahmed The authors have](https://img.pdfslide.net/doc/110x75/5ec87c30e4298e5de66f8bc2/priors-arxiv180204073v2-cscv-15-mar-muhammad-asim-fahad-shamshad-and-ali.jpg)