Embed Size (px)
Citation preview
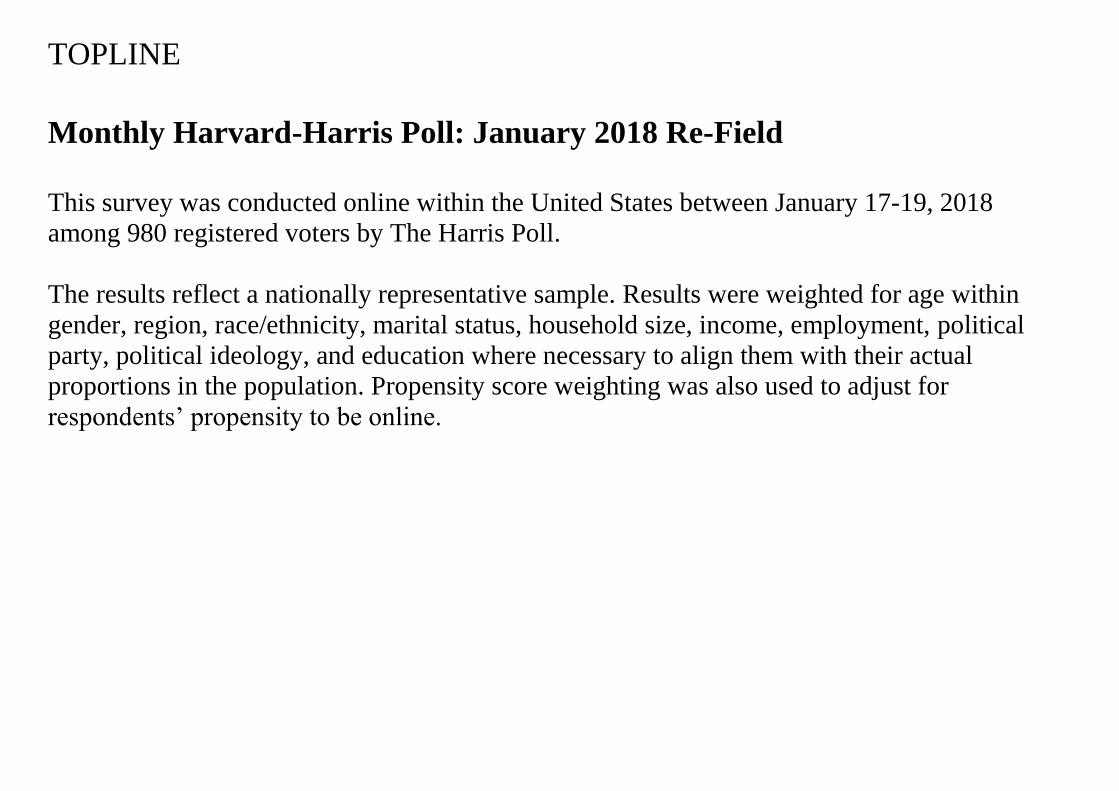
TOPLINE
Monthly Harvard-Harris Poll: January 2018 Re-Field
This survey was conducted online within the United States between January 17-19, 2018
among 980 registered voters by The Harris Poll.
The results reflect a nationally representative sample. Results were weighted for age within
gender, region, race/ethnicity, marital status, household size, income, employment, political
party, political ideology, and education where necessary to align them with their actual
proportions in the population. Propensity score weighting was also used to adjust for
respondents’ propensity to be online.
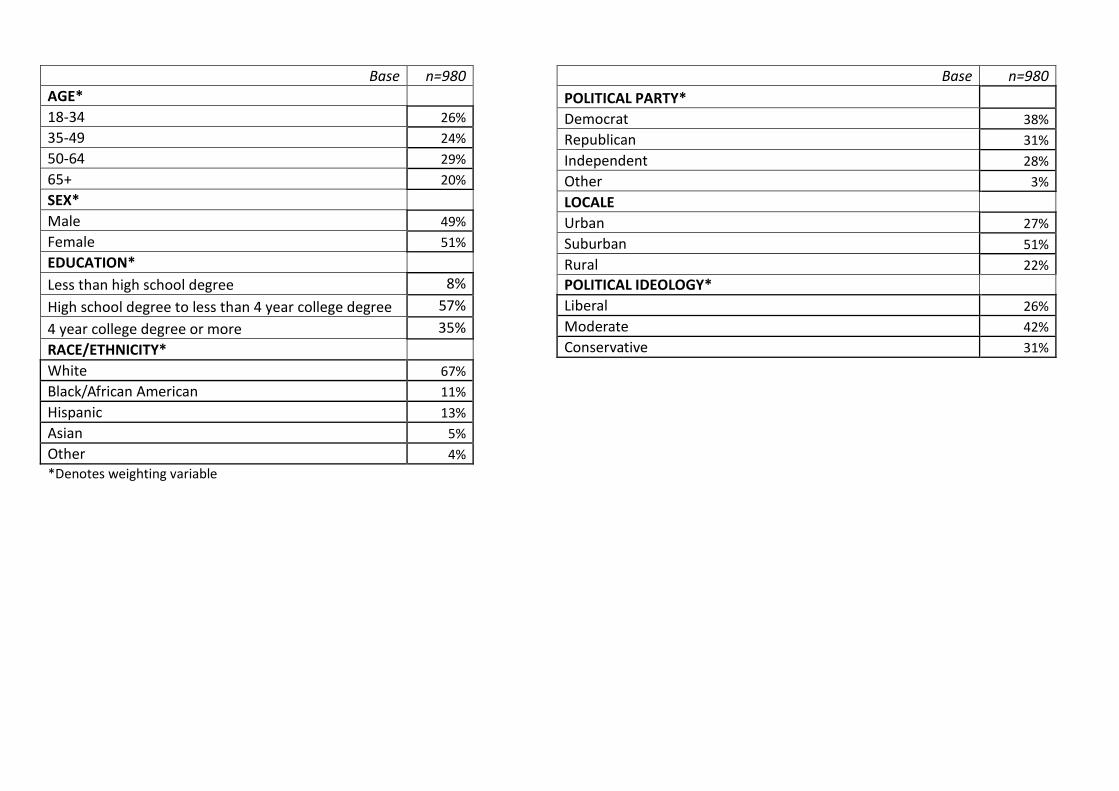
Base n=980
AGE*
18-34 26%
35-49 24%
50-64 29%
65+ 20%
SEX*
Male 49%
Female 51%
EDUCATION*
Less than high school degree 8% High school degree to less than 4 year college degree 57% 4 year college degree or more 35% RACE/ETHNICITY*
White 67%
Black/African American 11%
Hispanic 13%
Asian 5%
Other 4%
*Denotes weighting variable
Base n=980
POLITICAL PARTY*
Democrat 38%
Republican 31%
Independent 28%
Other 3%
LOCALE
Urban 27%
Suburban 51%
Rural 22%
POLITICAL IDEOLOGY*
Liberal 26%
Moderate 42%
Conservative 31%

Page 1
QuickQuery
Fielding Period: January 17-19, 2018
HCAPS (Filtered on Registered Voters)
Weighted To The U.S. General Adult Population - Propensity
20 Jan 2018
Table 1
D1 What is your age?
Base: All Respondents
Total
Unweighted Base 980
Weighted Base 985
Effective Base 624
18-34 260
26%
35-49 237
24%
50-64 286
29%
65+ 201
20%
Mean 48.3
Std. Dev. 16.80
Std. Err. 0.54
Sigma 985
100%
Page 2
QuickQuery
Fielding Period: January 17-19, 2018
HCAPS (Filtered on Registered Voters)
Weighted To The U.S. General Adult Population - Propensity
20 Jan 2018
Table 2
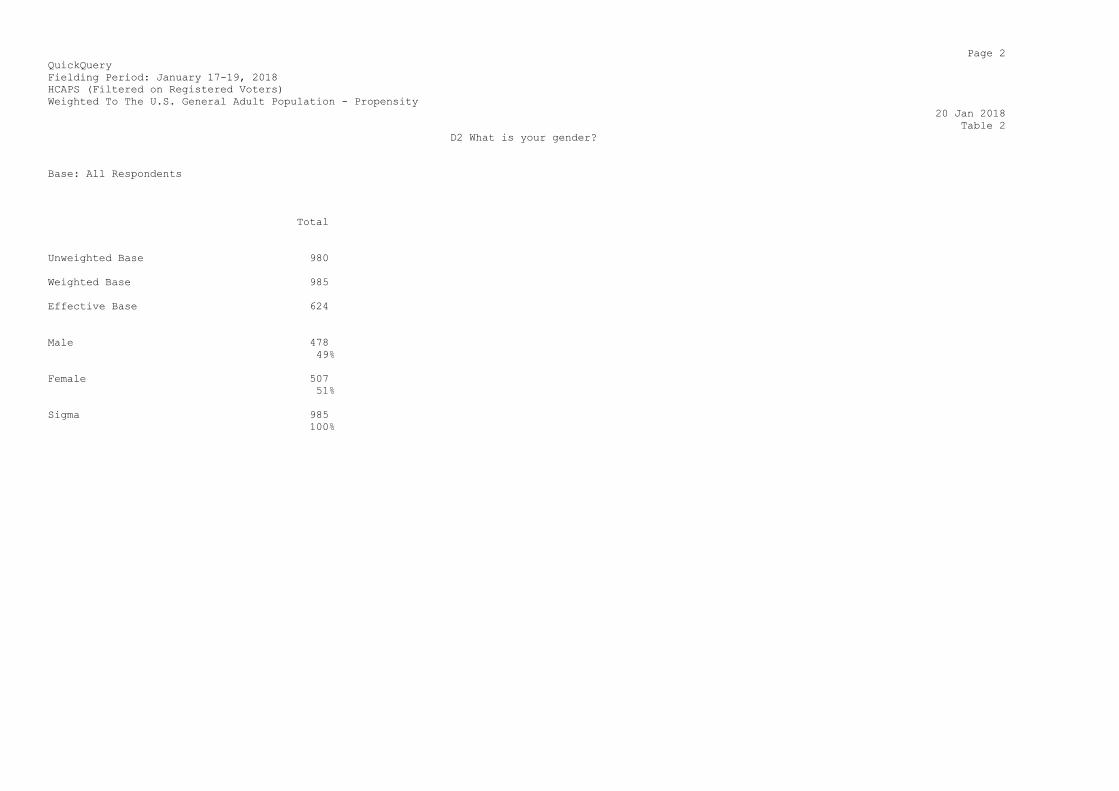
D2 What is your gender?
Base: All Respondents
Total
Unweighted Base 980
Weighted Base 985
Effective Base 624
Male 478
49%
Female 507
51%
Sigma 985
100%
Page 3
QuickQuery
Fielding Period: January 17-19, 2018
HCAPS (Filtered on Registered Voters)
Weighted To The U.S. General Adult Population - Propensity
20 Jan 2018
Table 3
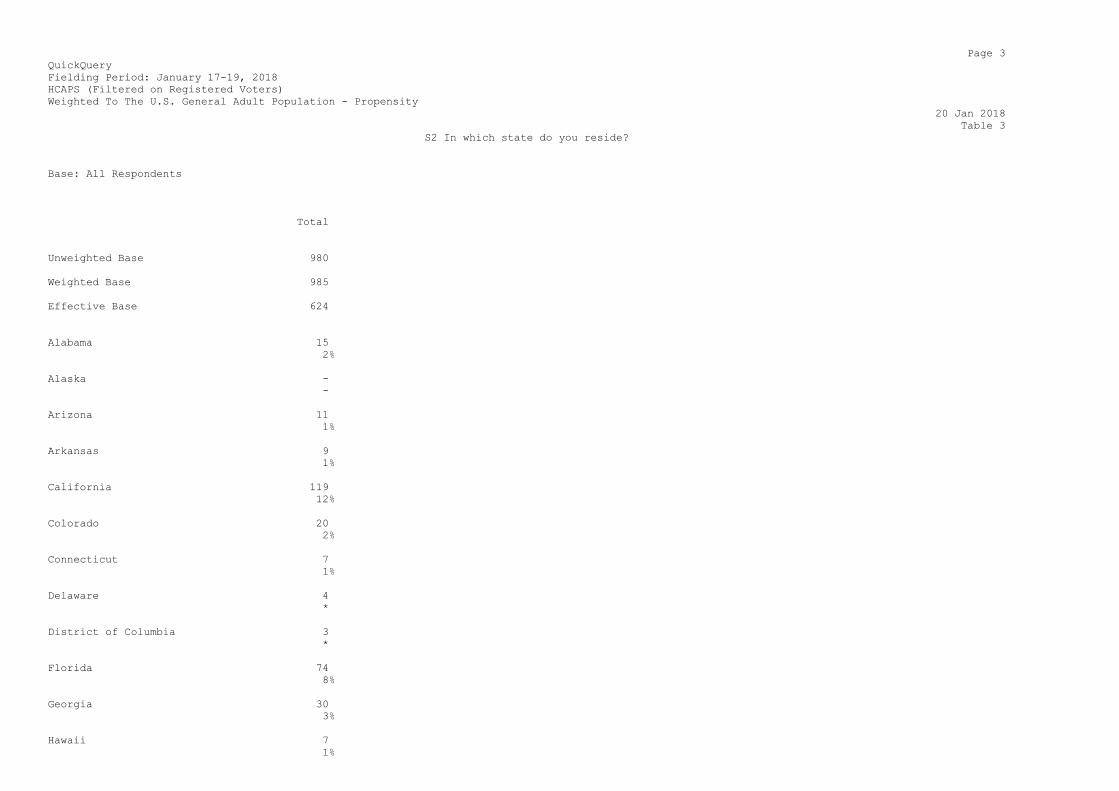
S2 In which state do you reside?
Base: All Respondents
Total
Unweighted Base 980
Weighted Base 985
Effective Base 624
Alabama 15
2%
Alaska -
-
Arizona 11
1%
Arkansas 9
1%
California 119
12%
Colorado 20
2%
Connecticut 7
1%
Delaware 4
*
District of Columbia 3
*
Florida 74
8%
Georgia 30
3%
Hawaii 7
1%

Idaho 9
1%
Illinois 52
5%
Indiana 14
1%
Iowa 10
1%
Kansas 8
1%

Page 4
QuickQuery
Fielding Period: January 17-19, 2018
HCAPS (Filtered on Registered Voters)
Weighted To The U.S. General Adult Population - Propensity
20 Jan 2018
Table 3
S2 In which state do you reside?
Base: All Respondents
Total
Weighted Base 985
Kentucky 15
2%
Louisiana 10
1%
Maine 5
*
Maryland 12
1%
Massachusetts 24
2%
Michigan 45
5%
Minnesota 13
1%
Mississippi 4
*
Missouri 19
2%
Montana 1
*
Nebraska 4
*
Nevada 5
*
New Hampshire 6
1%
New Jersey 30
3%

New Mexico 6
1%
New York 77
8%
North Carolina 34
3%
North Dakota 1
*
Ohio 19
2%
Page 5
QuickQuery
Fielding Period: January 17-19, 2018
HCAPS (Filtered on Registered Voters)
Weighted To The U.S. General Adult Population - Propensity
20 Jan 2018
Table 3
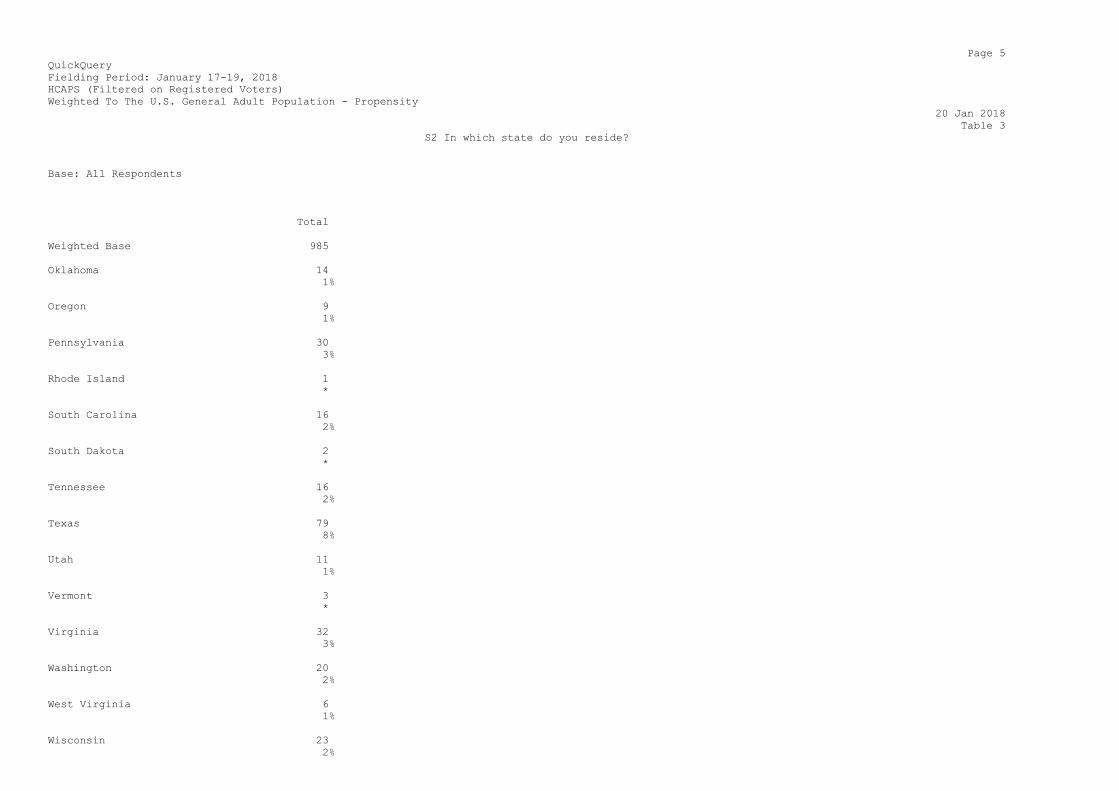
S2 In which state do you reside?
Base: All Respondents
Total
Weighted Base 985
Oklahoma 14
1%
Oregon 9
1%
Pennsylvania 30
3%
Rhode Island 1
*
South Carolina 16
2%
South Dakota 2
*
Tennessee 16
2%
Texas 79
8%
Utah 11
1%
Vermont 3
*
Virginia 32
3%
Washington 20
2%
West Virginia 6
1%
Wisconsin 23
2%

Wyoming 1
*
Sigma 985
100%
Page 6
QuickQuery
Fielding Period: January 17-19, 2018
HCAPS (Filtered on Registered Voters)
Weighted To The U.S. General Adult Population - Propensity
20 Jan 2018
Table 4
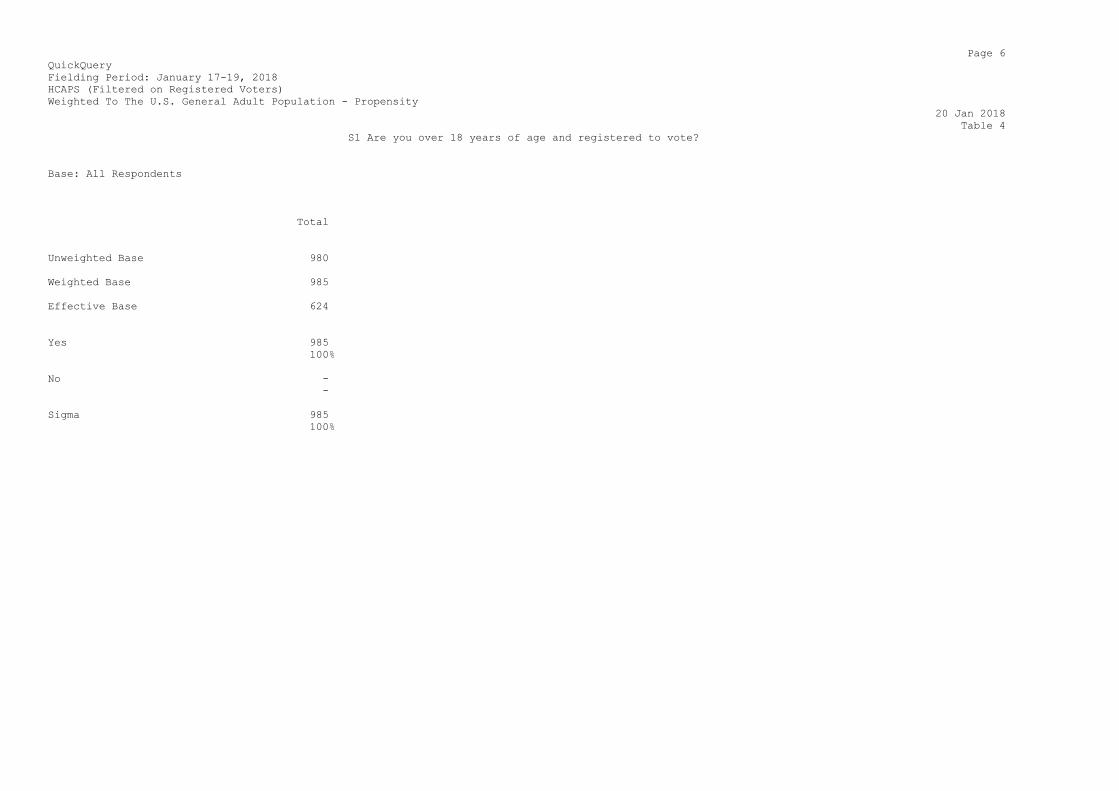
S1 Are you over 18 years of age and registered to vote?
Base: All Respondents
Total
Unweighted Base 980
Weighted Base 985
Effective Base 624
Yes 985
100%
No -
-
Sigma 985
100%
Page 7
QuickQuery
Fielding Period: January 17-19, 2018
HCAPS (Filtered on Registered Voters)
Weighted To The U.S. General Adult Population - Propensity
20 Jan 2018
Table 5
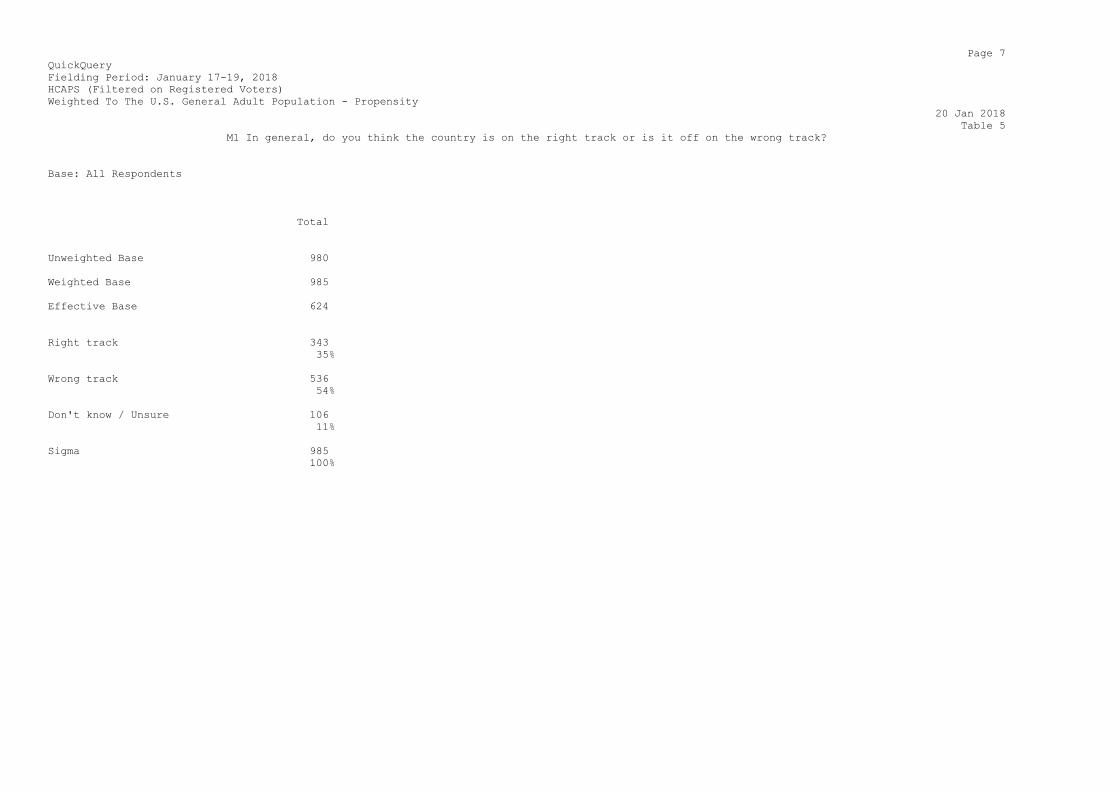
M1 In general, do you think the country is on the right track or is it off on the wrong track?
Base: All Respondents
Total
Unweighted Base 980
Weighted Base 985
Effective Base 624
Right track 343
35%
Wrong track 536
54%
Don't know / Unsure 106
11%
Sigma 985
100%

Page 8
QuickQuery
Fielding Period: January 17-19, 2018
HCAPS (Filtered on Registered Voters)
Weighted To The U.S. General Adult Population - Propensity
20 Jan 2018
Table 6
M2 In general, do you think the American economy is on right track or is it off on the wrong track?
Base: All Respondents
Total
Unweighted Base 980
Weighted Base 985
Effective Base 624
Right track 506
51%
Wrong track 317
32%
Don't know / Unsure 162
16%
Sigma 985
100%
Page 9
QuickQuery
Fielding Period: January 17-19, 2018
HCAPS (Filtered on Registered Voters)
Weighted To The U.S. General Adult Population - Propensity
20 Jan 2018
Table 7
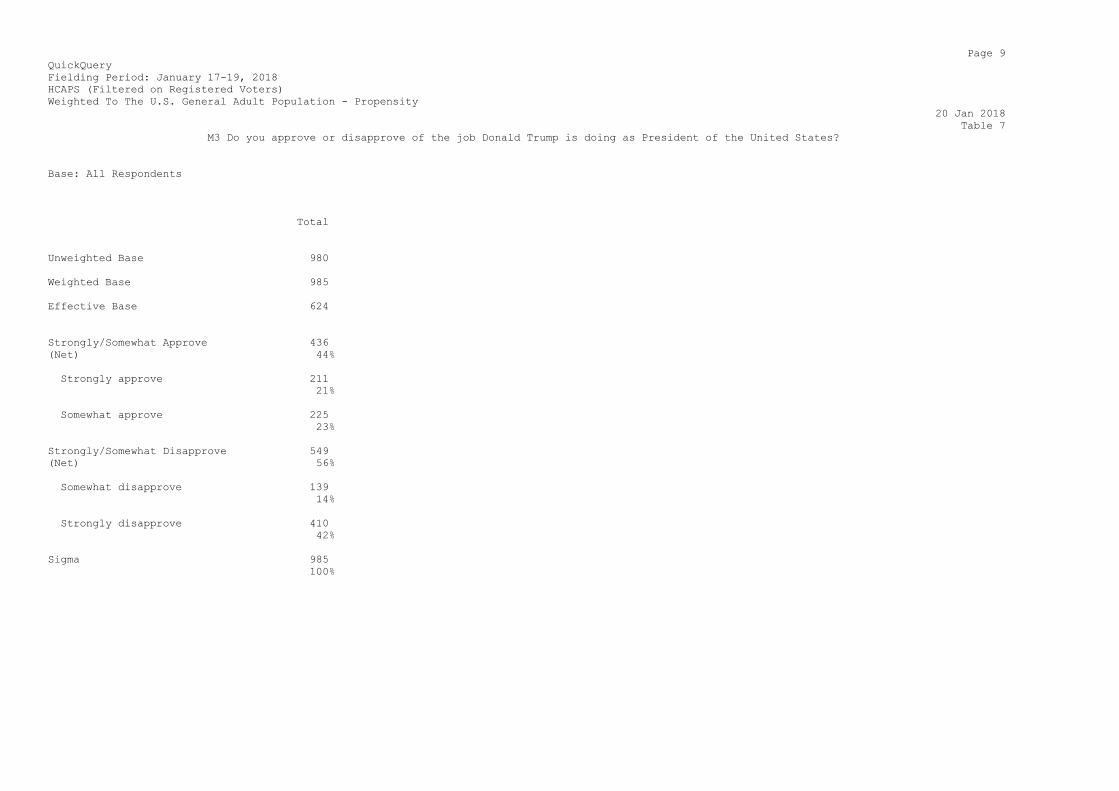
M3 Do you approve or disapprove of the job Donald Trump is doing as President of the United States?
Base: All Respondents
Total
Unweighted Base 980
Weighted Base 985
Effective Base 624
Strongly/Somewhat Approve 436
(Net) 44%
Strongly approve 211
21%
Somewhat approve 225
23%
Strongly/Somewhat Disapprove 549
(Net) 56%
Somewhat disapprove 139
14%
Strongly disapprove 410
42%
Sigma 985
100%

Page 10
QuickQuery
Fielding Period: January 17-19, 2018
HCAPS (Filtered on Registered Voters)
Weighted To The U.S. General Adult Population - Propensity
20 Jan 2018
Table 8
M3A Do you approve or disapprove of the job President Trump is doing on ...?
Summary Of Approve
Base: All Respondents
Total
Unweighted Base 980
Weighted Base 985
Effective Base 624
Stimulating jobs 582
59%
The economy 581
59%
Fighting terrorism 514
52%
Immigration 434
44%
Administering the government 402
41%
Foreign affairs 401
41%
Page 11
QuickQuery
Fielding Period: January 17-19, 2018
HCAPS (Filtered on Registered Voters)
Weighted To The U.S. General Adult Population - Propensity
20 Jan 2018
Table 9
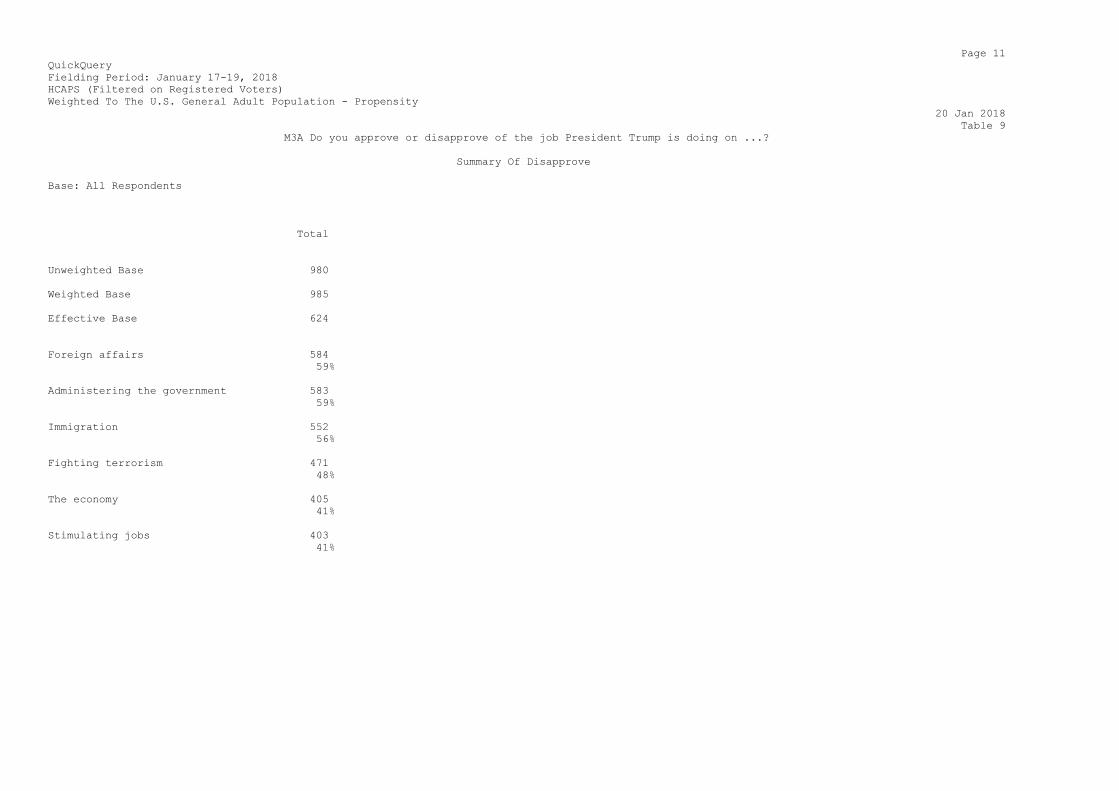
M3A Do you approve or disapprove of the job President Trump is doing on ...?
Summary Of Disapprove
Base: All Respondents
Total
Unweighted Base 980
Weighted Base 985
Effective Base 624
Foreign affairs 584
59%
Administering the government 583
59%
Immigration 552
56%
Fighting terrorism 471
48%
The economy 405
41%
Stimulating jobs 403
41%
Page 12
QuickQuery
Fielding Period: January 17-19, 2018
HCAPS (Filtered on Registered Voters)
Weighted To The U.S. General Adult Population - Propensity
20 Jan 2018
Table 10
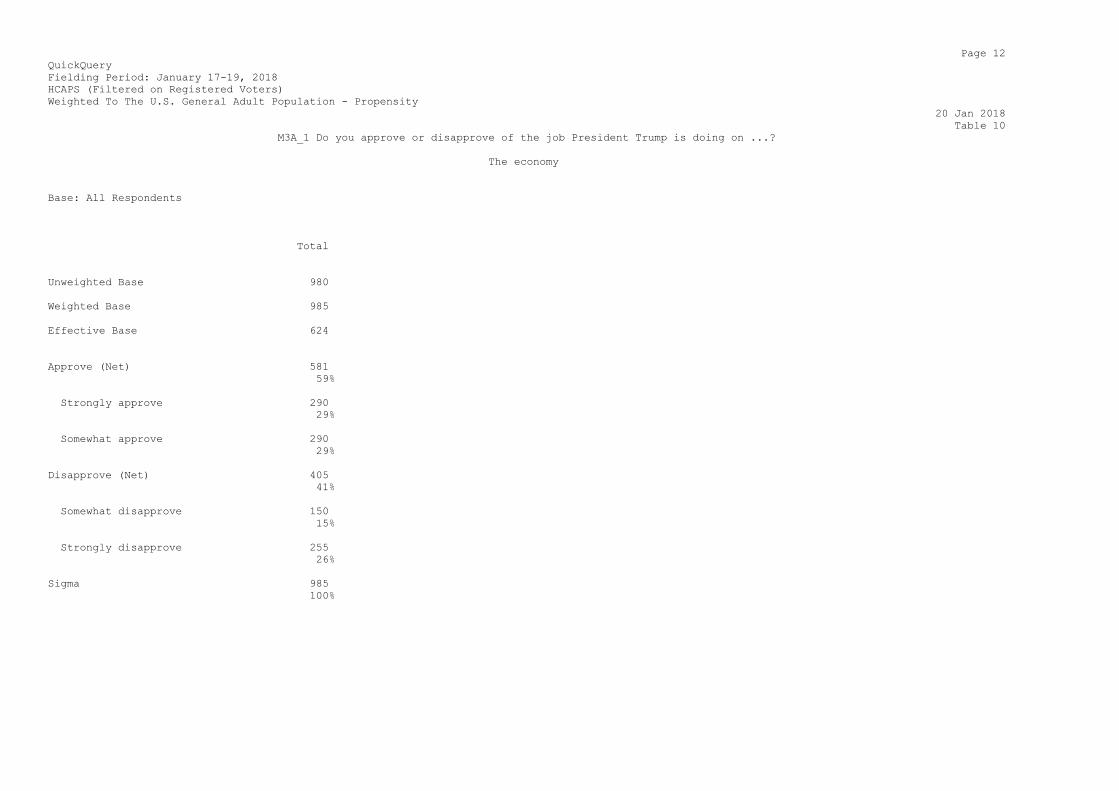
M3A_1 Do you approve or disapprove of the job President Trump is doing on ...?
The economy
Base: All Respondents
Total
Unweighted Base 980
Weighted Base 985
Effective Base 624
Approve (Net) 581
59%
Strongly approve 290
29%
Somewhat approve 290
29%
Disapprove (Net) 405
41%
Somewhat disapprove 150
15%
Strongly disapprove 255
26%
Sigma 985
100%
Page 13
QuickQuery
Fielding Period: January 17-19, 2018
HCAPS (Filtered on Registered Voters)
Weighted To The U.S. General Adult Population - Propensity
20 Jan 2018
Table 11
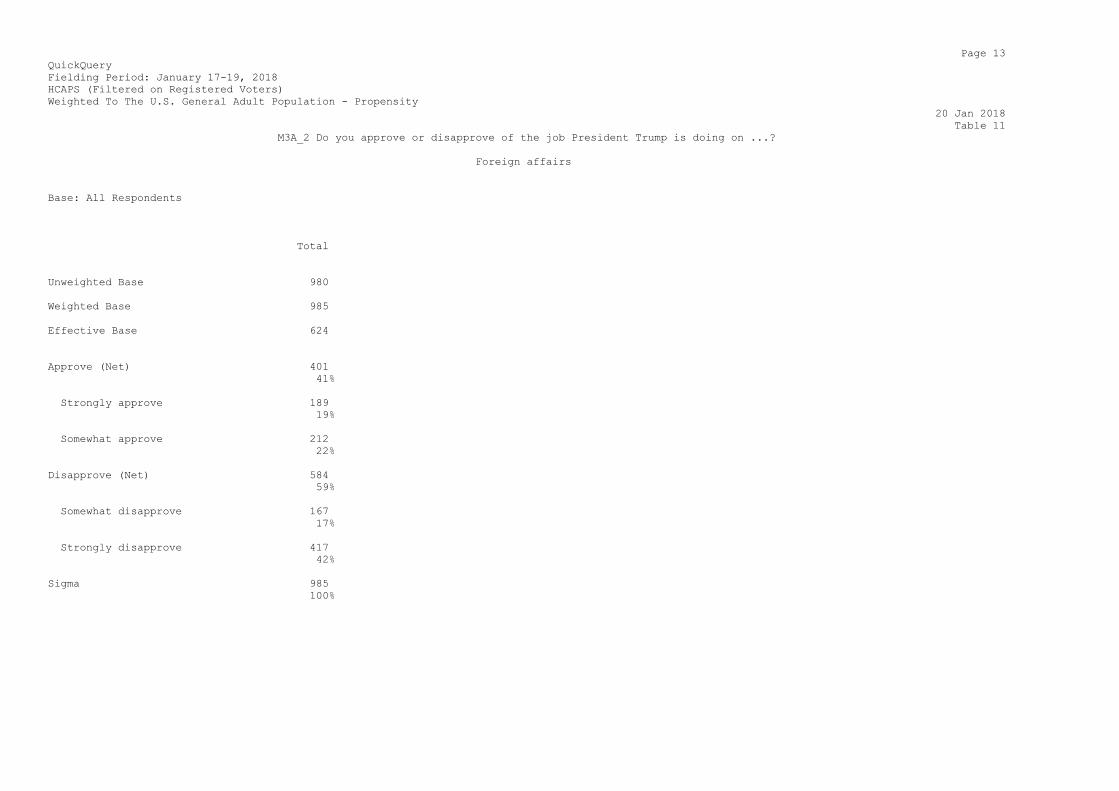
M3A_2 Do you approve or disapprove of the job President Trump is doing on ...?
Foreign affairs
Base: All Respondents
Total
Unweighted Base 980
Weighted Base 985
Effective Base 624
Approve (Net) 401
41%
Strongly approve 189
19%
Somewhat approve 212
22%
Disapprove (Net) 584
59%
Somewhat disapprove 167
17%
Strongly disapprove 417
42%
Sigma 985
100%

Page 14
QuickQuery
Fielding Period: January 17-19, 2018
HCAPS (Filtered on Registered Voters)
Weighted To The U.S. General Adult Population - Propensity
20 Jan 2018
Table 12
M3A_3 Do you approve or disapprove of the job President Trump is doing on ...?
Fighting terrorism
Base: All Respondents
Total
Unweighted Base 980
Weighted Base 985
Effective Base 624
Approve (Net) 514
52%
Strongly approve 262
27%
Somewhat approve 252
26%
Disapprove (Net) 471
48%
Somewhat disapprove 182
18%
Strongly disapprove 289
29%
Sigma 985
100%
Page 15
QuickQuery
Fielding Period: January 17-19, 2018
HCAPS (Filtered on Registered Voters)
Weighted To The U.S. General Adult Population - Propensity
20 Jan 2018
Table 13
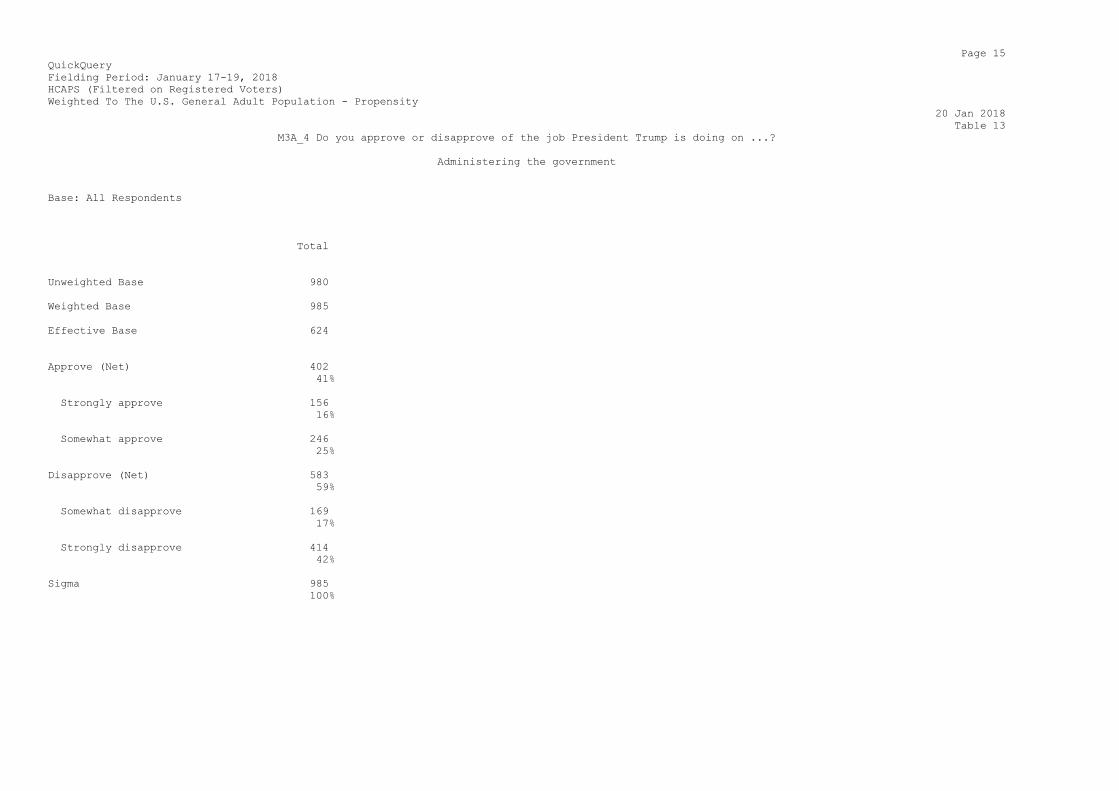
M3A_4 Do you approve or disapprove of the job President Trump is doing on ...?
Administering the government
Base: All Respondents
Total
Unweighted Base 980
Weighted Base 985
Effective Base 624
Approve (Net) 402
41%
Strongly approve 156
16%
Somewhat approve 246
25%
Disapprove (Net) 583
59%
Somewhat disapprove 169
17%
Strongly disapprove 414
42%
Sigma 985
100%

Page 16
QuickQuery
Fielding Period: January 17-19, 2018
HCAPS (Filtered on Registered Voters)
Weighted To The U.S. General Adult Population - Propensity
20 Jan 2018
Table 14
M3A_5 Do you approve or disapprove of the job President Trump is doing on ...?
Stimulating jobs
Base: All Respondents
Total
Unweighted Base 980
Weighted Base 985
Effective Base 624
Approve (Net) 582
59%
Strongly approve 294
30%
Somewhat approve 288
29%
Disapprove (Net) 403
41%
Somewhat disapprove 154
16%
Strongly disapprove 249
25%
Sigma 985
100%
Page 17
QuickQuery
Fielding Period: January 17-19, 2018
HCAPS (Filtered on Registered Voters)
Weighted To The U.S. General Adult Population - Propensity
20 Jan 2018
Table 15
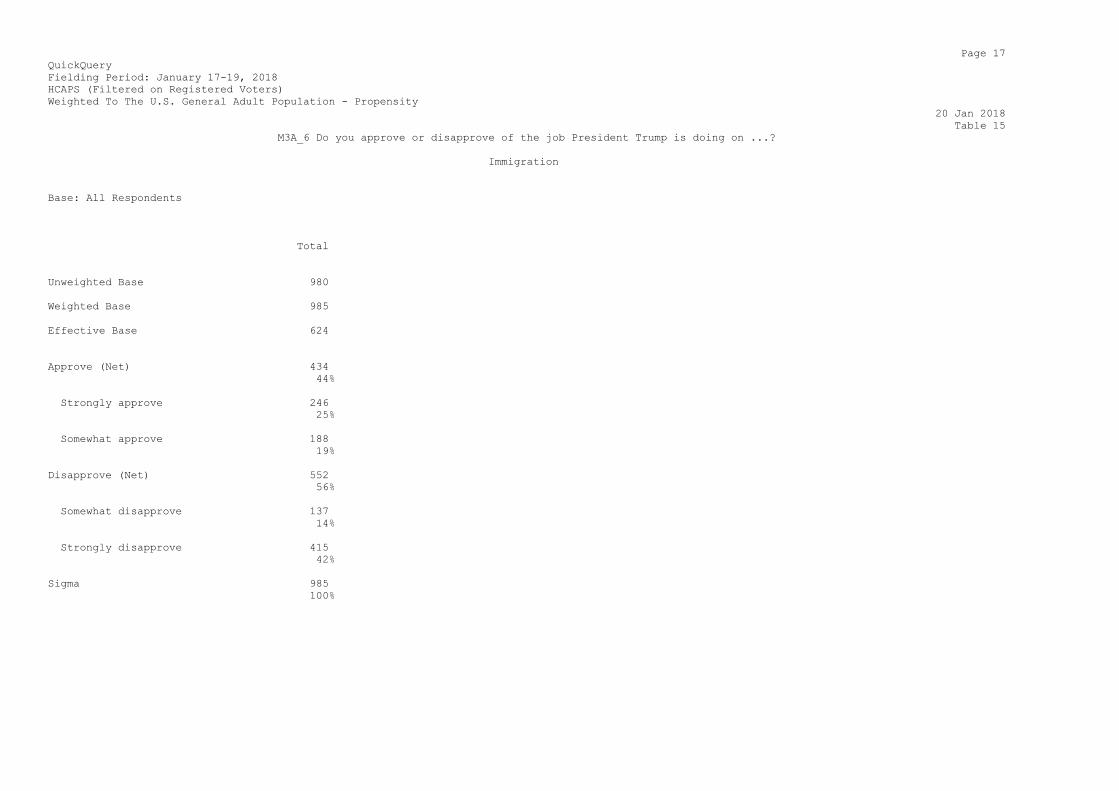
M3A_6 Do you approve or disapprove of the job President Trump is doing on ...?
Immigration
Base: All Respondents
Total
Unweighted Base 980
Weighted Base 985
Effective Base 624
Approve (Net) 434
44%
Strongly approve 246
25%
Somewhat approve 188
19%
Disapprove (Net) 552
56%
Somewhat disapprove 137
14%
Strongly disapprove 415
42%
Sigma 985
100%
Page 18
QuickQuery
Fielding Period: January 17-19, 2018
HCAPS (Filtered on Registered Voters)
Weighted To The U.S. General Adult Population - Propensity
20 Jan 2018
Table 16
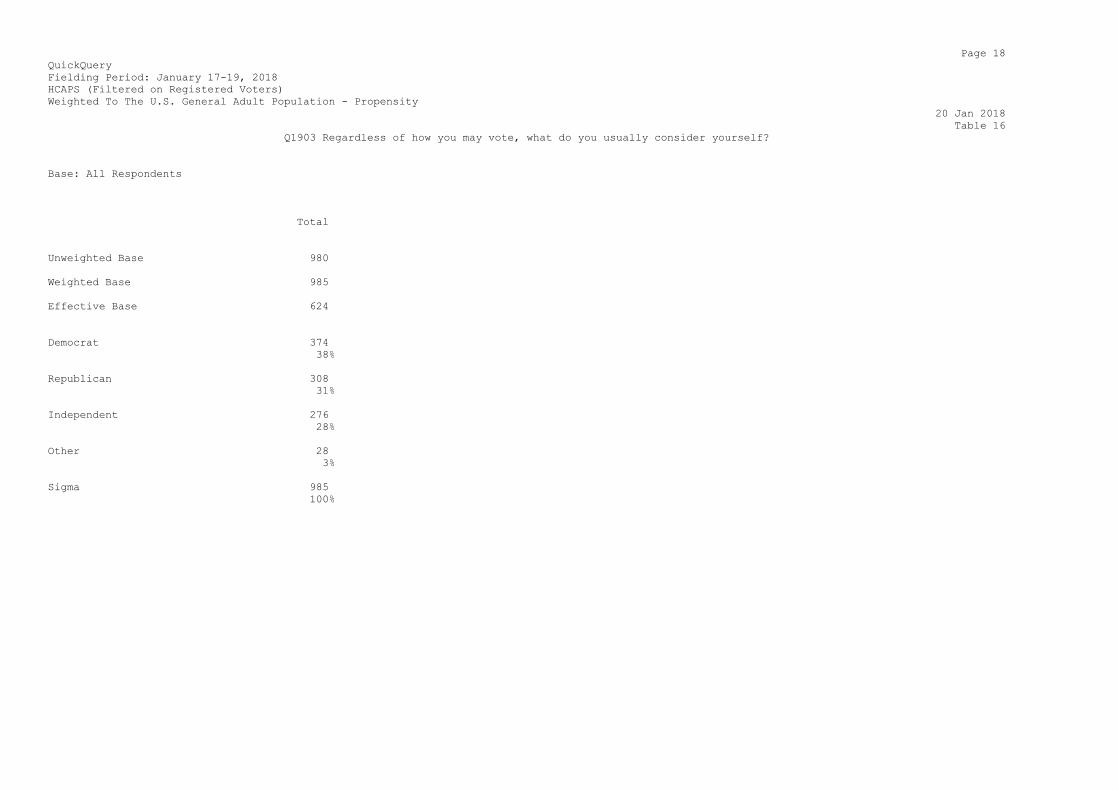
Q1903 Regardless of how you may vote, what do you usually consider yourself?
Base: All Respondents
Total
Unweighted Base 980
Weighted Base 985
Effective Base 624
Democrat 374
38%
Republican 308
31%
Independent 276
28%
Other 28
3%
Sigma 985
100%
Page 19
QuickQuery
Fielding Period: January 17-19, 2018
HCAPS (Filtered on Registered Voters)
Weighted To The U.S. General Adult Population - Propensity
20 Jan 2018
Table 17
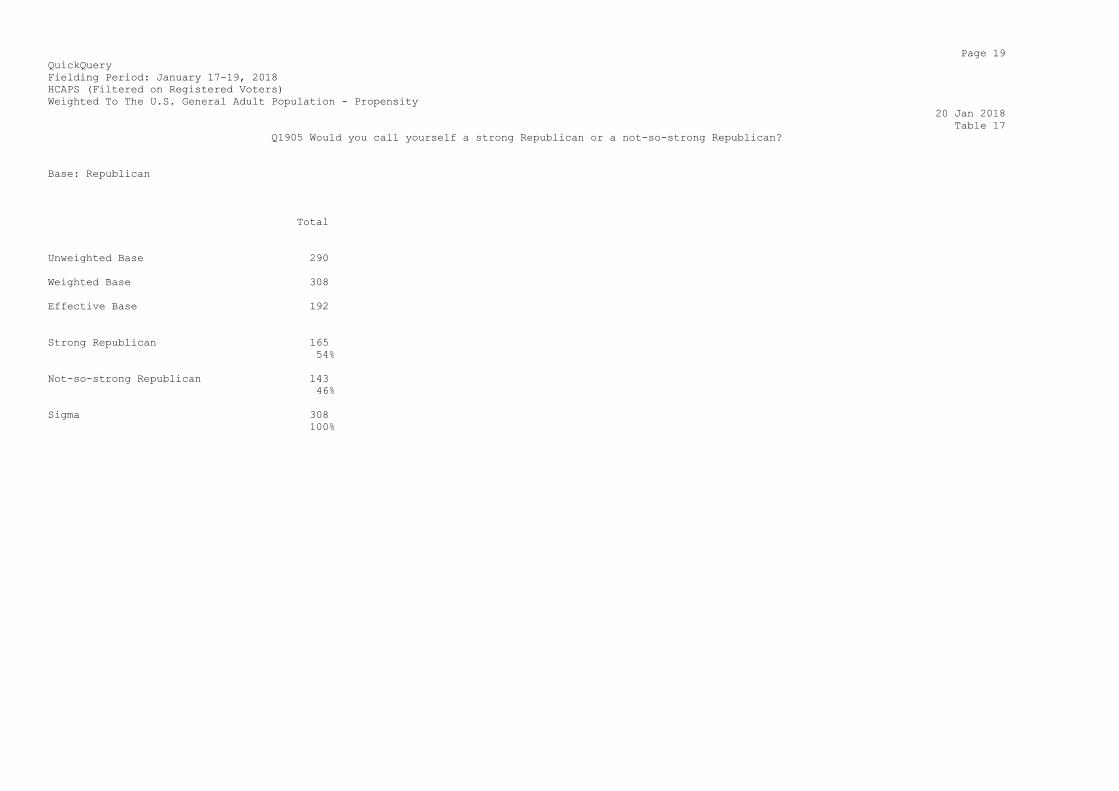
Q1905 Would you call yourself a strong Republican or a not-so-strong Republican?
Base: Republican
Total
Unweighted Base 290
Weighted Base 308
Effective Base 192
Strong Republican 165
54%
Not-so-strong Republican 143
46%
Sigma 308
100%
Page 20
QuickQuery
Fielding Period: January 17-19, 2018
HCAPS (Filtered on Registered Voters)
Weighted To The U.S. General Adult Population - Propensity
20 Jan 2018
Table 18
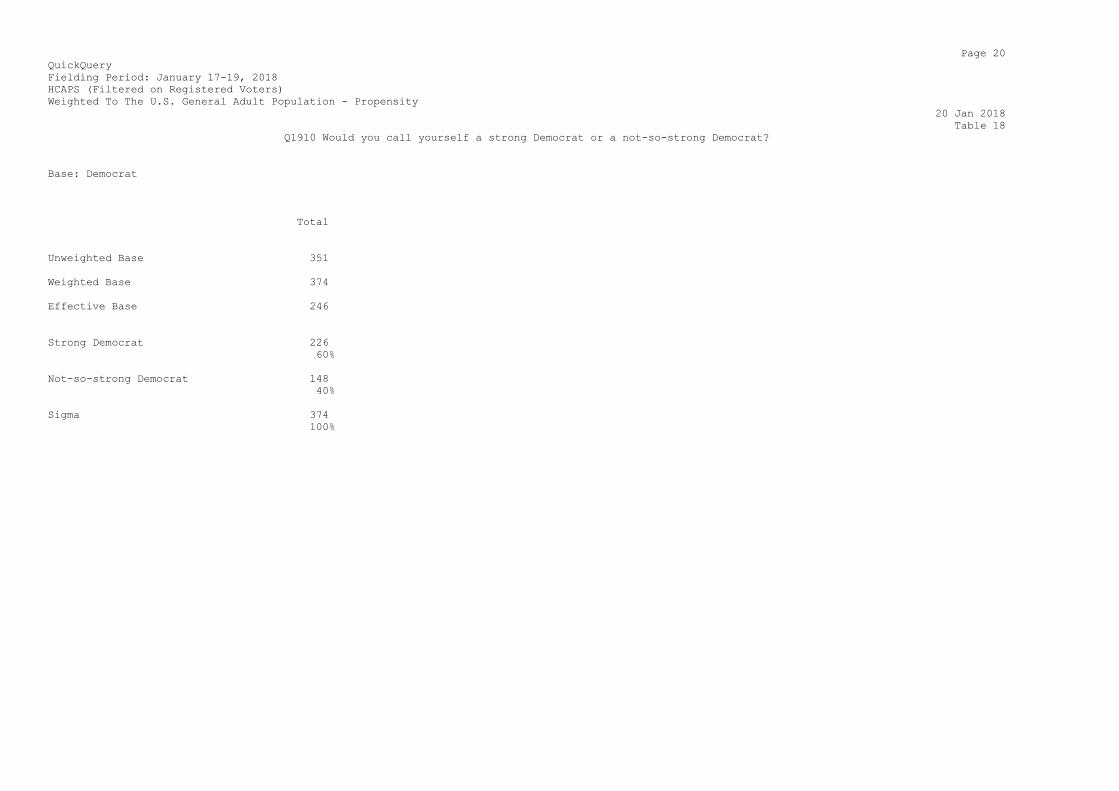
Q1910 Would you call yourself a strong Democrat or a not-so-strong Democrat?
Base: Democrat
Total
Unweighted Base 351
Weighted Base 374
Effective Base 246
Strong Democrat 226
60%
Not-so-strong Democrat 148
40%
Sigma 374
100%
Page 21
QuickQuery
Fielding Period: January 17-19, 2018
HCAPS (Filtered on Registered Voters)
Weighted To The U.S. General Adult Population - Propensity
20 Jan 2018
Table 19
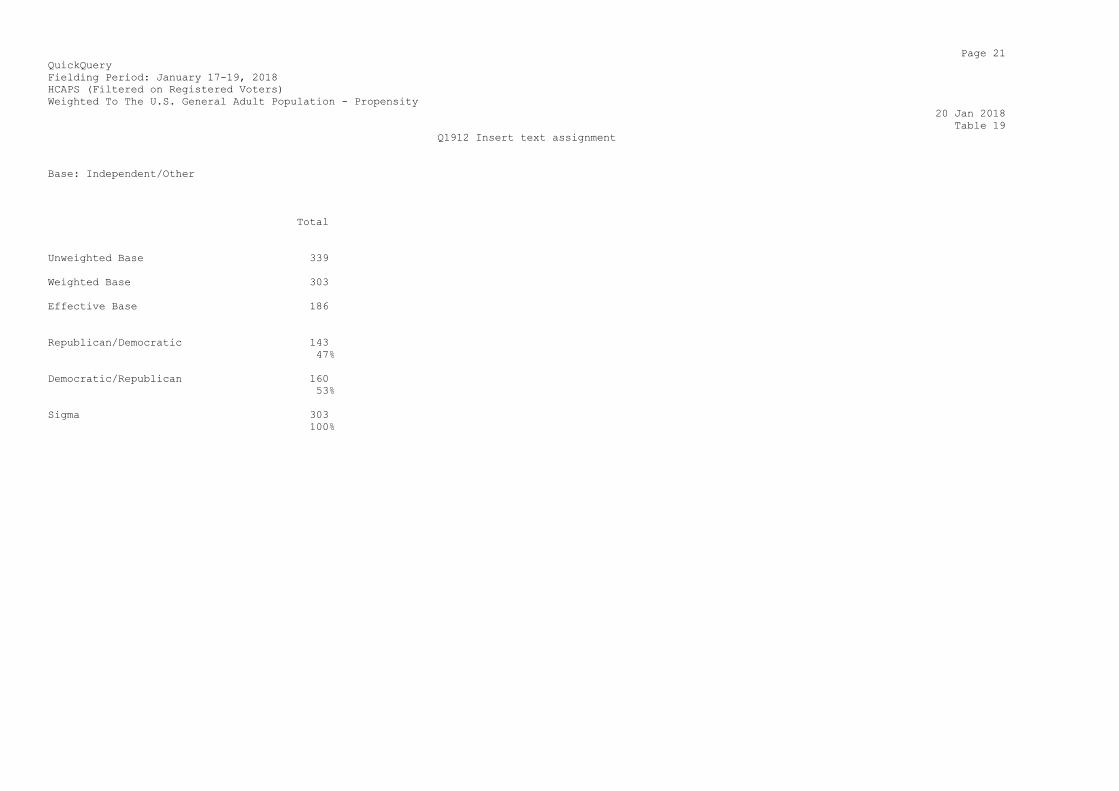
Q1912 Insert text assignment
Base: Independent/Other
Total
Unweighted Base 339
Weighted Base 303
Effective Base 186
Republican/Democratic 143
47%
Democratic/Republican 160
53%
Sigma 303
100%
Page 22
QuickQuery
Fielding Period: January 17-19, 2018
HCAPS (Filtered on Registered Voters)
Weighted To The U.S. General Adult Population - Propensity
20 Jan 2018
Table 20
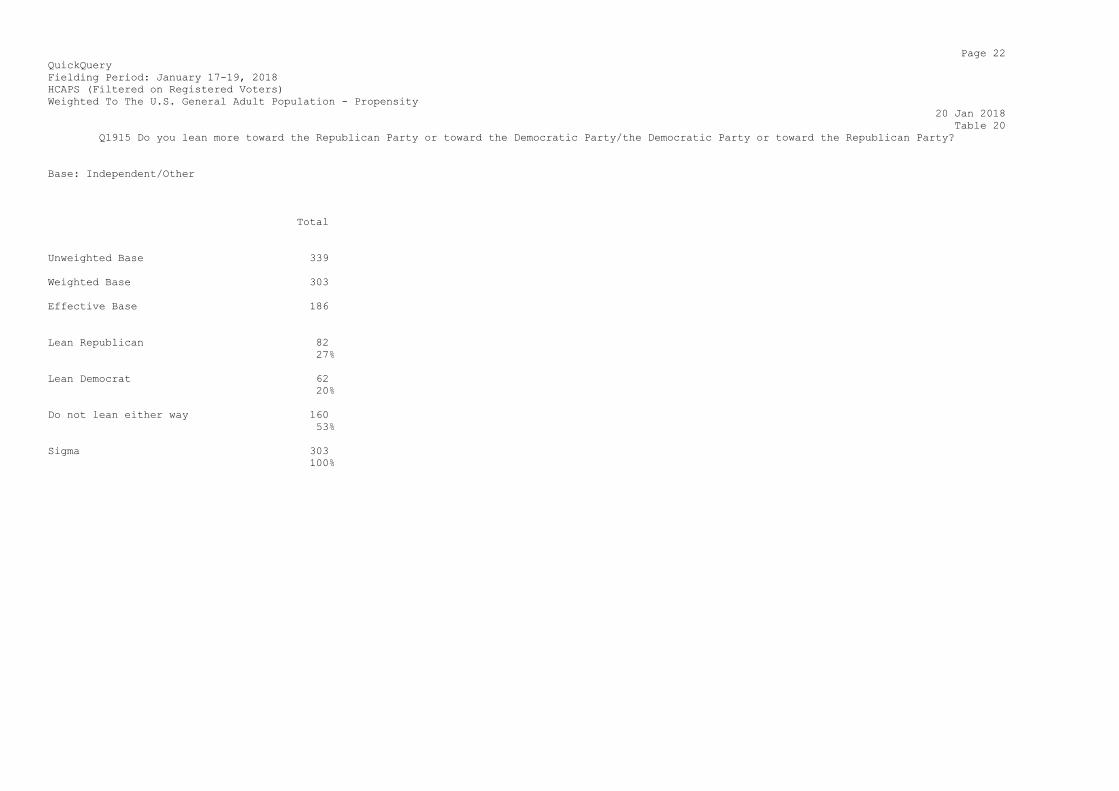
Q1915 Do you lean more toward the Republican Party or toward the Democratic Party/the Democratic Party or toward the Republican Party?
Base: Independent/Other
Total
Unweighted Base 339
Weighted Base 303
Effective Base 186
Lean Republican 82
27%
Lean Democrat 62
20%
Do not lean either way 160
53%
Sigma 303
100%
Page 23
QuickQuery
Fielding Period: January 17-19, 2018
HCAPS (Filtered on Registered Voters)
Weighted To The U.S. General Adult Population - Propensity
20 Jan 2018
Table 21
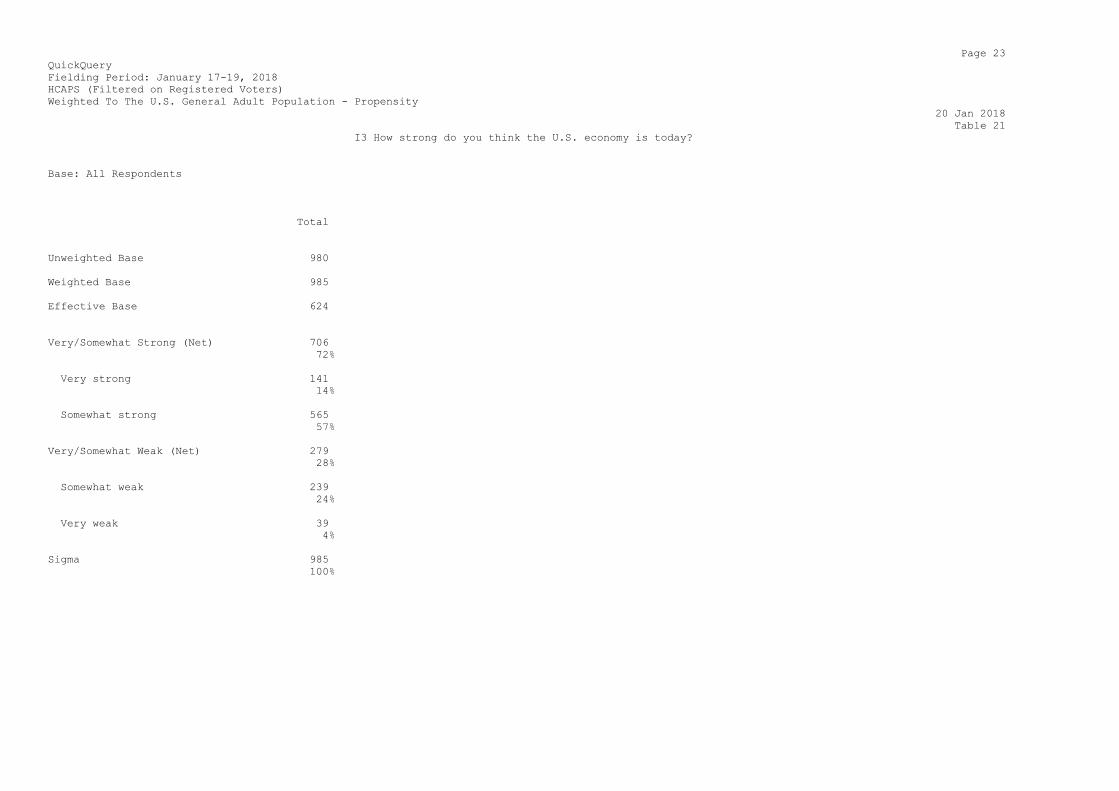
I3 How strong do you think the U.S. economy is today?
Base: All Respondents
Total
Unweighted Base 980
Weighted Base 985
Effective Base 624
Very/Somewhat Strong (Net) 706
72%
Very strong 141
14%
Somewhat strong 565
57%
Very/Somewhat Weak (Net) 279
28%
Somewhat weak 239
24%
Very weak 39
4%
Sigma 985
100%
Page 24
QuickQuery
Fielding Period: January 17-19, 2018
HCAPS (Filtered on Registered Voters)
Weighted To The U.S. General Adult Population - Propensity
20 Jan 2018
Table 22
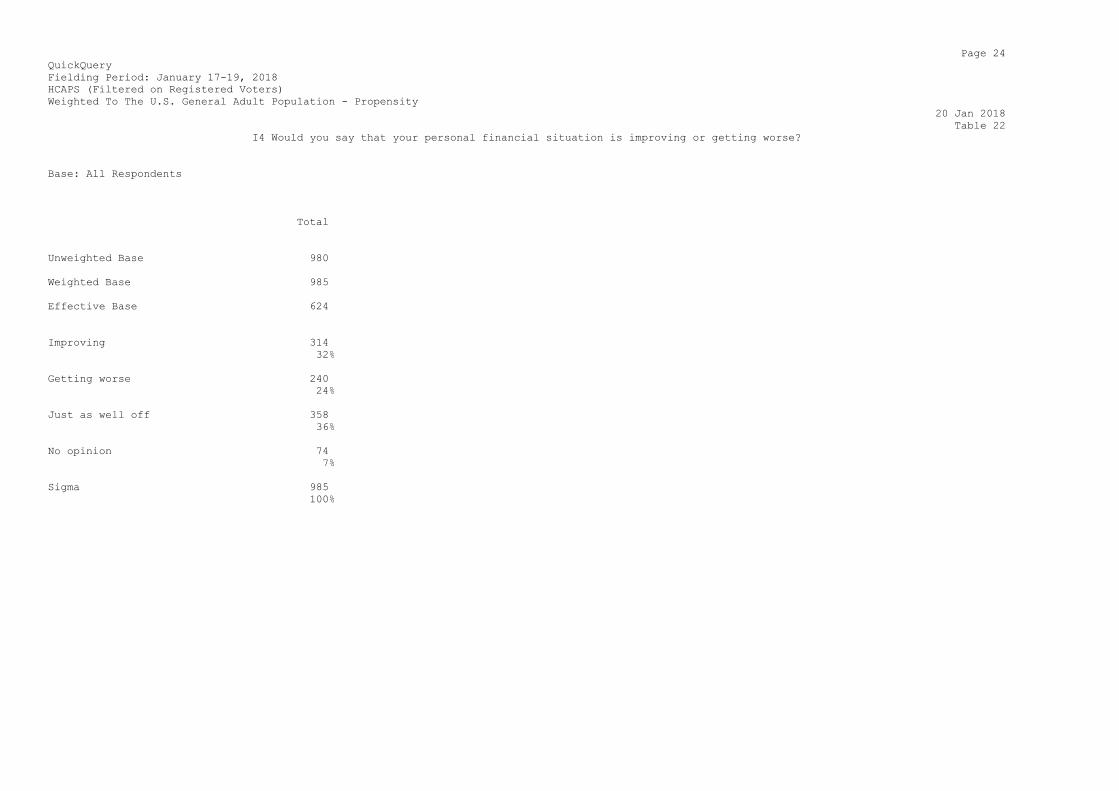
I4 Would you say that your personal financial situation is improving or getting worse?
Base: All Respondents
Total
Unweighted Base 980
Weighted Base 985
Effective Base 624
Improving 314
32%
Getting worse 240
24%
Just as well off 358
36%
No opinion 74
7%
Sigma 985
100%
Page 25
QuickQuery
Fielding Period: January 17-19, 2018
HCAPS (Filtered on Registered Voters)
Weighted To The U.S. General Adult Population - Propensity
20 Jan 2018
Table 23
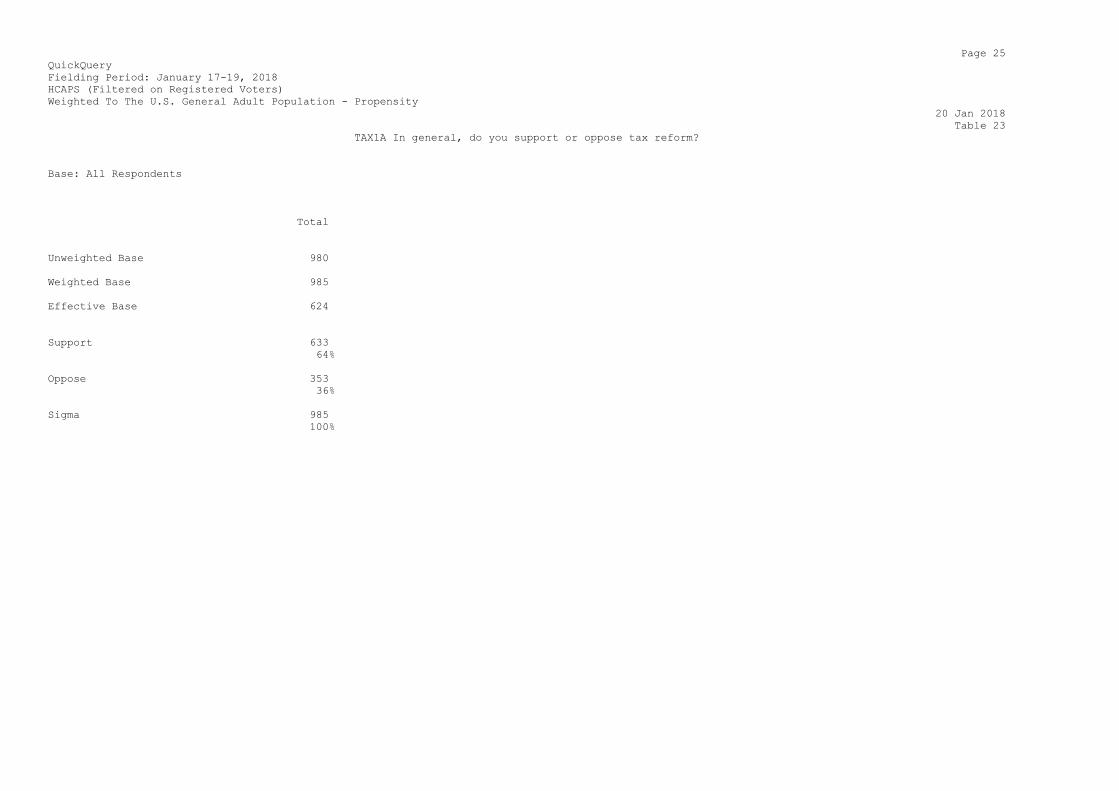
TAX1A In general, do you support or oppose tax reform?
Base: All Respondents
Total
Unweighted Base 980
Weighted Base 985
Effective Base 624
Support 633
64%
Oppose 353
36%
Sigma 985
100%
Page 26
QuickQuery
Fielding Period: January 17-19, 2018
HCAPS (Filtered on Registered Voters)
Weighted To The U.S. General Adult Population - Propensity
20 Jan 2018
Table 24
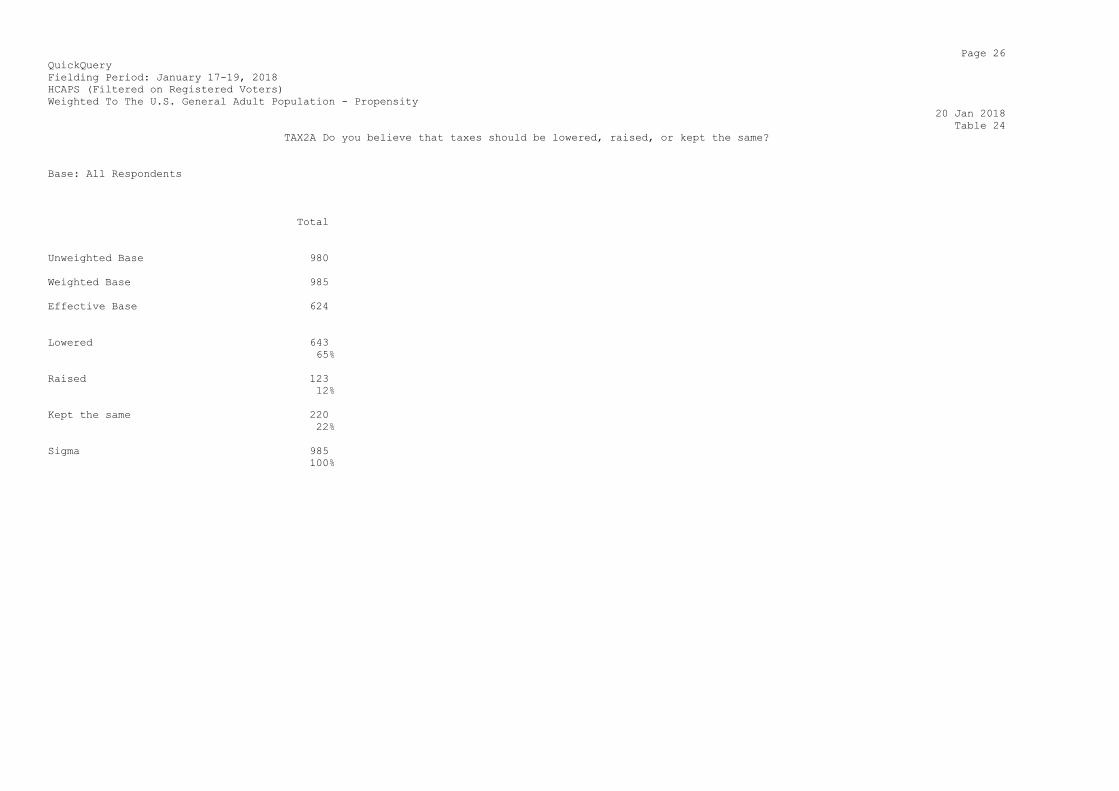
TAX2A Do you believe that taxes should be lowered, raised, or kept the same?
Base: All Respondents
Total
Unweighted Base 980
Weighted Base 985
Effective Base 624
Lowered 643
65%
Raised 123
12%
Kept the same 220
22%
Sigma 985
100%

Page 27
QuickQuery
Fielding Period: January 17-19, 2018
HCAPS (Filtered on Registered Voters)
Weighted To The U.S. General Adult Population - Propensity
20 Jan 2018
Table 25
TAX3A Do you favor or oppose the tax bill that was recently passed by the U.S. Congress?
Base: All Respondents
Total
Unweighted Base 980
Weighted Base 985
Effective Base 624
Favor 462
47%
Oppose 523
53%
Sigma 985
100%

Page 28
QuickQuery
Fielding Period: January 17-19, 2018
HCAPS (Filtered on Registered Voters)
Weighted To The U.S. General Adult Population - Propensity
20 Jan 2018
Table 26
TAX1 Will you get a tax cut in 2018 or not?
Base: All Respondents
Total
Unweighted Base 980
Weighted Base 985
Effective Base 624
Yes 198
20%
No 294
30%
Don't Know / Unsure 493
50%
Sigma 985
100%
Page 29
QuickQuery
Fielding Period: January 17-19, 2018
HCAPS (Filtered on Registered Voters)
Weighted To The U.S. General Adult Population - Propensity
20 Jan 2018
Table 27
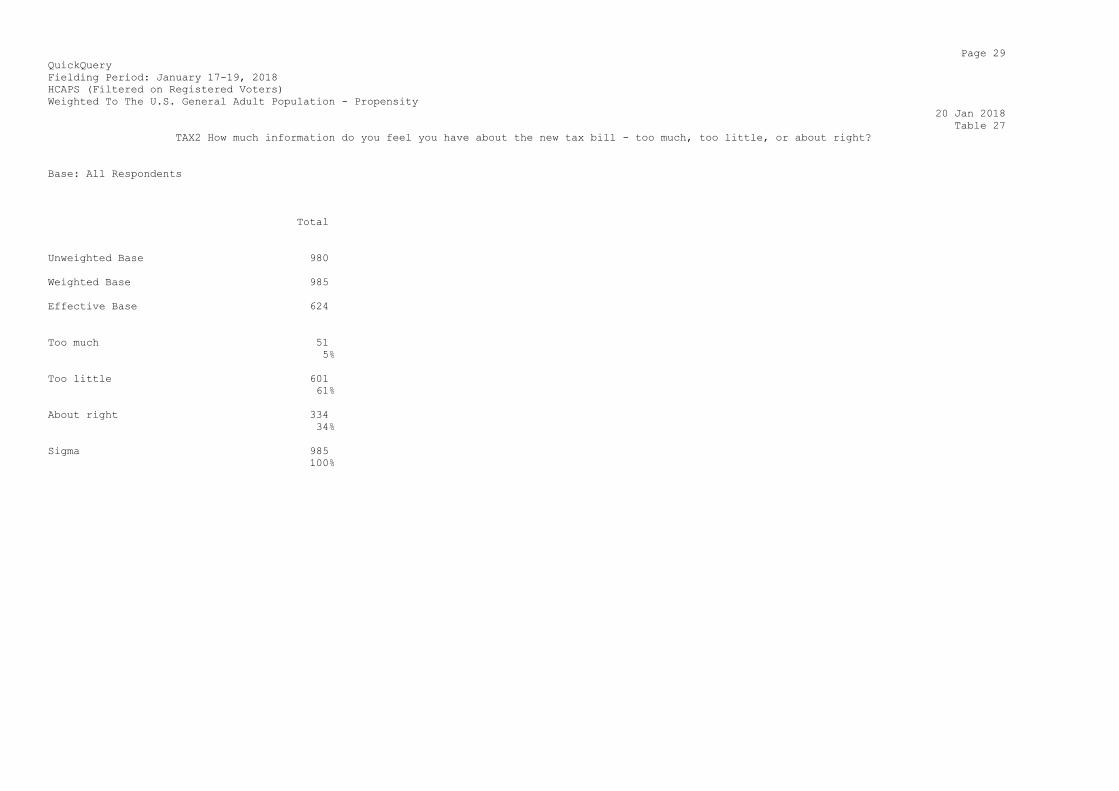
TAX2 How much information do you feel you have about the new tax bill - too much, too little, or about right?
Base: All Respondents
Total
Unweighted Base 980
Weighted Base 985
Effective Base 624
Too much 51
5%
Too little 601
61%
About right 334
34%
Sigma 985
100%
Page 30
QuickQuery
Fielding Period: January 17-19, 2018
HCAPS (Filtered on Registered Voters)
Weighted To The U.S. General Adult Population - Propensity
20 Jan 2018
Table 28
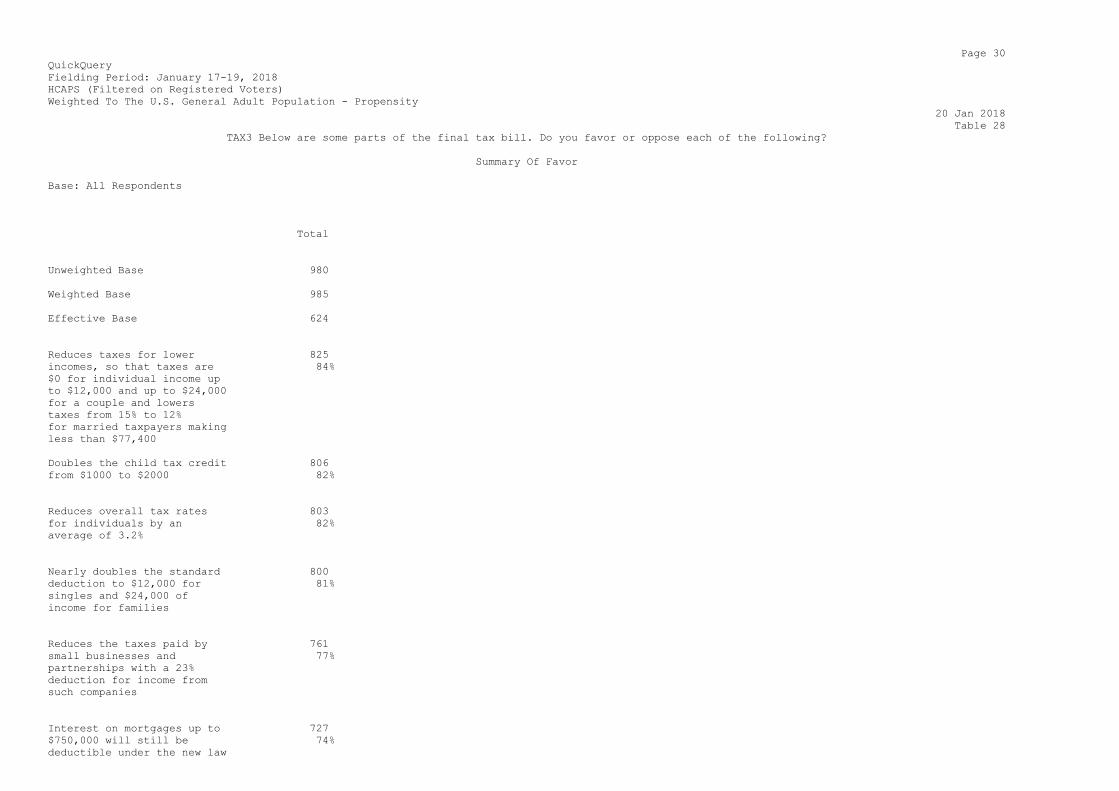
TAX3 Below are some parts of the final tax bill. Do you favor or oppose each of the following?
Summary Of Favor
Base: All Respondents
Total
Unweighted Base 980
Weighted Base 985
Effective Base 624
Reduces taxes for lower 825
incomes, so that taxes are 84%
$0 for individual income up
to $12,000 and up to $24,000
for a couple and lowers
taxes from 15% to 12%
for married taxpayers making
less than $77,400
Doubles the child tax credit 806
from $1000 to $2000 82%
Reduces overall tax rates 803
for individuals by an 82%
average of 3.2%
Nearly doubles the standard 800
deduction to $12,000 for 81%
singles and $24,000 of
income for families
Reduces the taxes paid by 761
small businesses and 77%
partnerships with a 23%
deduction for income from
such companies
Interest on mortgages up to 727
$750,000 will still be 74%
deductible under the new law

(down from the old $1M cap)
Lowers the threshold of 690
deductible medical expenses 70%
from 10% to 7.5%
The bill makes no changes to 644
the student loan deduction 65%
or the "tuition waiver" for
college and graduate
students
Page 31
QuickQuery
Fielding Period: January 17-19, 2018
HCAPS (Filtered on Registered Voters)
Weighted To The U.S. General Adult Population - Propensity
20 Jan 2018
Table 28
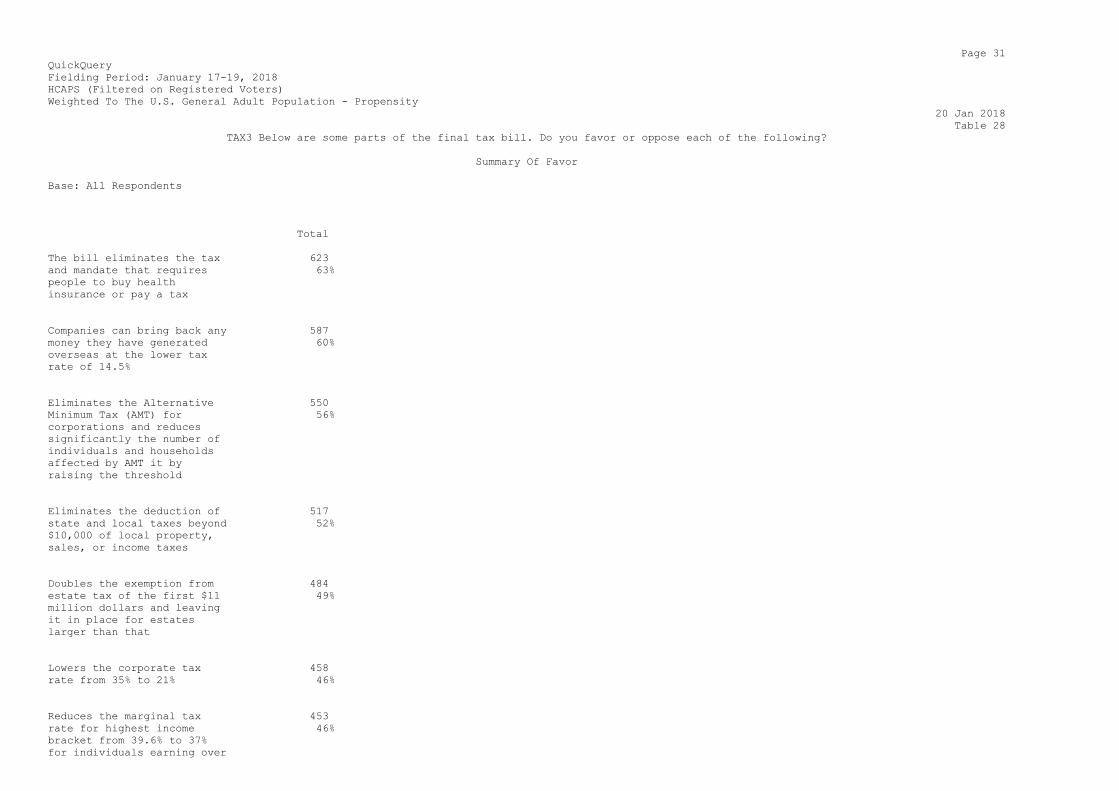
TAX3 Below are some parts of the final tax bill. Do you favor or oppose each of the following?
Summary Of Favor
Base: All Respondents
Total
The bill eliminates the tax 623
and mandate that requires 63%
people to buy health
insurance or pay a tax
Companies can bring back any 587
money they have generated 60%
overseas at the lower tax
rate of 14.5%
Eliminates the Alternative 550
Minimum Tax (AMT) for 56%
corporations and reduces
significantly the number of
individuals and households
affected by AMT it by
raising the threshold
Eliminates the deduction of 517
state and local taxes beyond 52%
$10,000 of local property,
sales, or income taxes
Doubles the exemption from 484
estate tax of the first $11 49%
million dollars and leaving
it in place for estates
larger than that
Lowers the corporate tax 458
rate from 35% to 21% 46%
Reduces the marginal tax 453
rate for highest income 46%
bracket from 39.6% to 37%
for individuals earning over

$500,000 and families
earning over $600,000
Page 32
QuickQuery
Fielding Period: January 17-19, 2018
HCAPS (Filtered on Registered Voters)
Weighted To The U.S. General Adult Population - Propensity
20 Jan 2018
Table 29
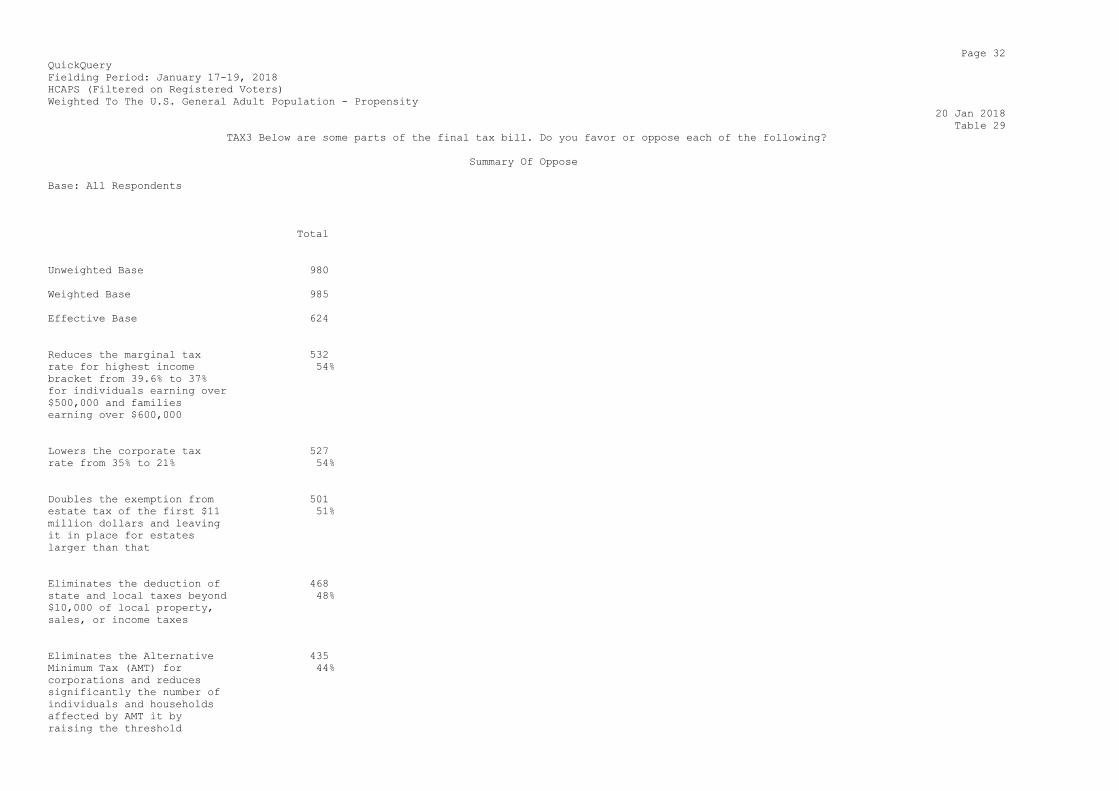
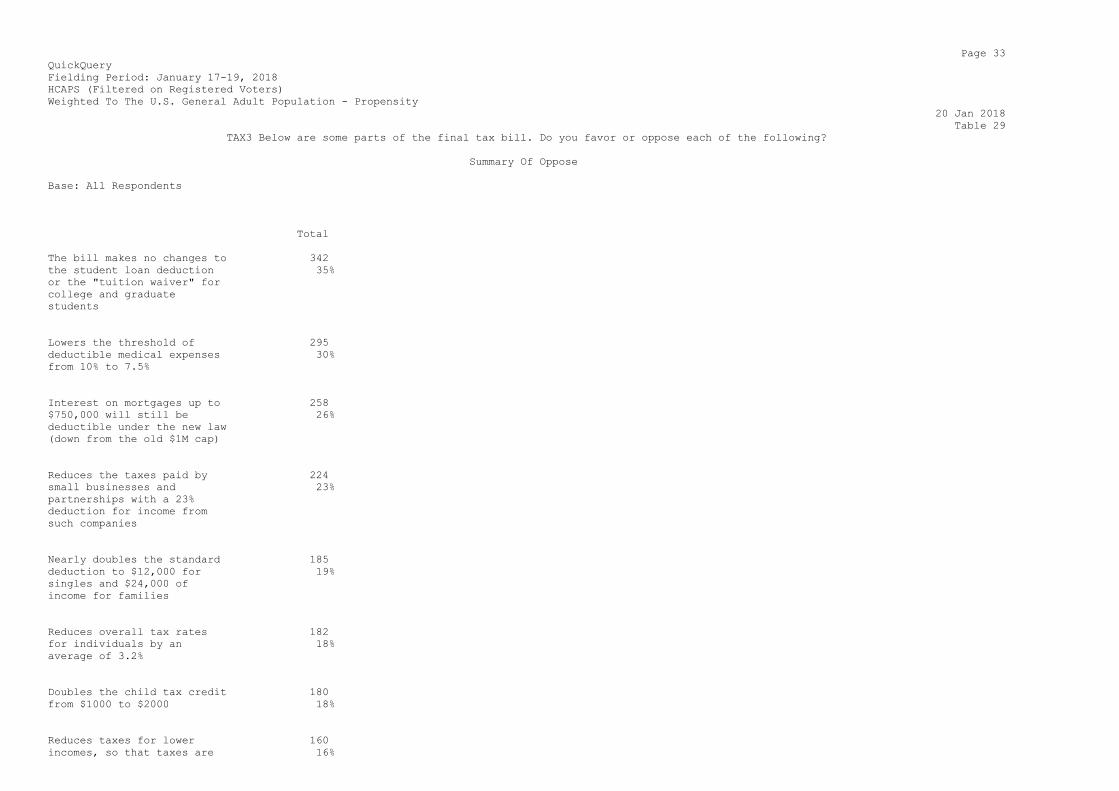
TAX3 Below are some parts of the final tax bill. Do you favor or oppose each of the following?
Summary Of Oppose
Base: All Respondents
Total
Unweighted Base 980
Weighted Base 985
Effective Base 624
Reduces the marginal tax 532
rate for highest income 54%
bracket from 39.6% to 37%
for individuals earning over
$500,000 and families
earning over $600,000
Lowers the corporate tax 527
rate from 35% to 21% 54%
Doubles the exemption from 501
estate tax of the first $11 51%
million dollars and leaving
it in place for estates
larger than that
Eliminates the deduction of 468
state and local taxes beyond 48%
$10,000 of local property,
sales, or income taxes
Eliminates the Alternative 435
Minimum Tax (AMT) for 44%
corporations and reduces
significantly the number of
individuals and households
affected by AMT it by
raising the threshold

Companies can bring back any 398
money they have generated 40%
overseas at the lower tax
rate of 14.5%
The bill eliminates the tax 362
and mandate that requires 37%
people to buy health
insurance or pay a tax
Page 33
QuickQuery
Fielding Period: January 17-19, 2018
HCAPS (Filtered on Registered Voters)
Weighted To The U.S. General Adult Population - Propensity
20 Jan 2018
Table 29
TAX3 Below are some parts of the final tax bill. Do you favor or oppose each of the following?
Summary Of Oppose
Base: All Respondents
Total
The bill makes no changes to 342
the student loan deduction 35%
or the "tuition waiver" for
college and graduate
students
Lowers the threshold of 295
deductible medical expenses 30%
from 10% to 7.5%
Interest on mortgages up to 258
$750,000 will still be 26%
deductible under the new law
(down from the old $1M cap)
Reduces the taxes paid by 224
small businesses and 23%
partnerships with a 23%
deduction for income from
such companies
Nearly doubles the standard 185
deduction to $12,000 for 19%
singles and $24,000 of
income for families
Reduces overall tax rates 182
for individuals by an 18%
average of 3.2%
Doubles the child tax credit 180
from $1000 to $2000 18%
Reduces taxes for lower 160
incomes, so that taxes are 16%

$0 for individual income up
to $12,000 and up to $24,000
for a couple and lowers
taxes from 15% to 12%
for married taxpayers making
less than $77,400

Page 34
QuickQuery
Fielding Period: January 17-19, 2018
HCAPS (Filtered on Registered Voters)
Weighted To The U.S. General Adult Population - Propensity
20 Jan 2018
Table 30
TAX3_1 Below are some parts of the final tax bill. Do you favor or oppose each of the following?
Reduces overall tax rates for individuals by an average of 3.2%
Base: All Respondents
Total
Unweighted Base 980
Weighted Base 985
Effective Base 624
Favor 803
82%
Oppose 182
18%
Sigma 985
100%

Page 35
QuickQuery
Fielding Period: January 17-19, 2018
HCAPS (Filtered on Registered Voters)
Weighted To The U.S. General Adult Population - Propensity
20 Jan 2018
Table 31
TAX3_2 Below are some parts of the final tax bill. Do you favor or oppose each of the following?
Reduces taxes for lower incomes, so that taxes are $0 for individual income up to $12,000 and up to $24,000 for a couple and lowers taxes from 15% to
12% for
married taxpayers making less than $77,400
Base: All Respondents
Total
Unweighted Base 980
Weighted Base 985
Effective Base 624
Favor 825
84%
Oppose 160
16%
Sigma 985
100%
Page 36
QuickQuery
Fielding Period: January 17-19, 2018
HCAPS (Filtered on Registered Voters)
Weighted To The U.S. General Adult Population - Propensity
20 Jan 2018
Table 32
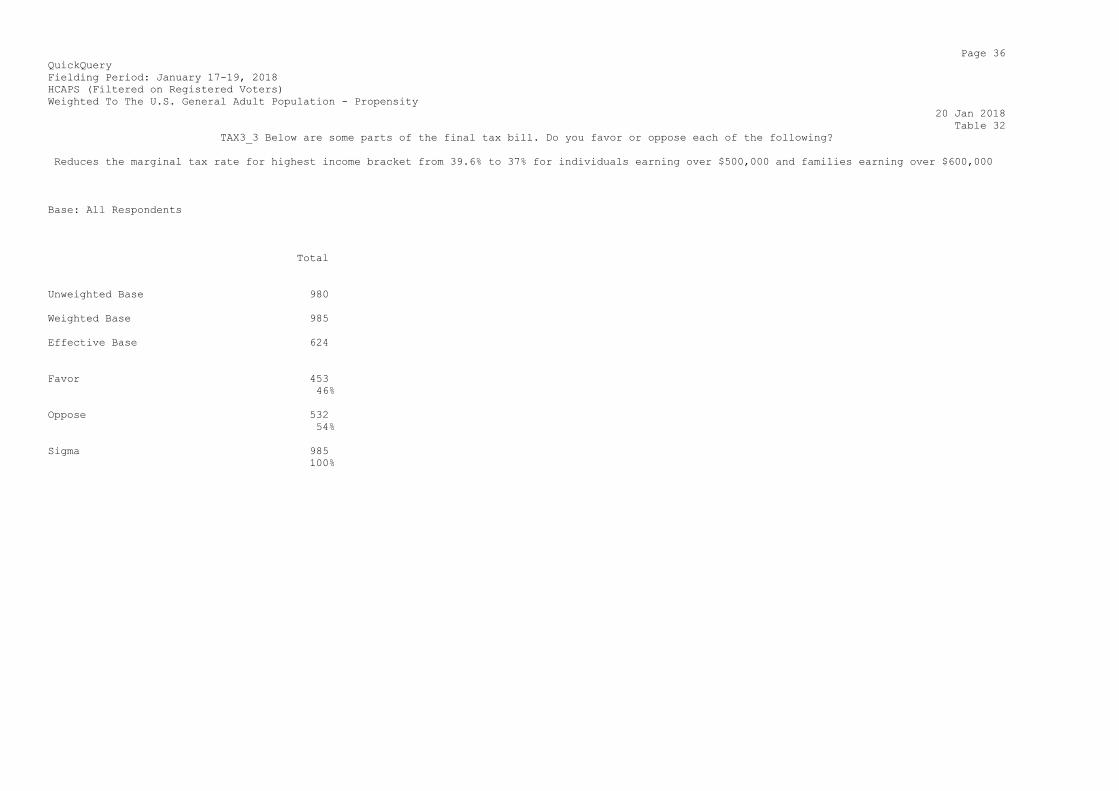
TAX3_3 Below are some parts of the final tax bill. Do you favor or oppose each of the following?
Reduces the marginal tax rate for highest income bracket from 39.6% to 37% for individuals earning over $500,000 and families earning over $600,000
Base: All Respondents
Total
Unweighted Base 980
Weighted Base 985
Effective Base 624
Favor 453
46%
Oppose 532
54%
Sigma 985
100%
Page 37
QuickQuery
Fielding Period: January 17-19, 2018
HCAPS (Filtered on Registered Voters)
Weighted To The U.S. General Adult Population - Propensity
20 Jan 2018
Table 33
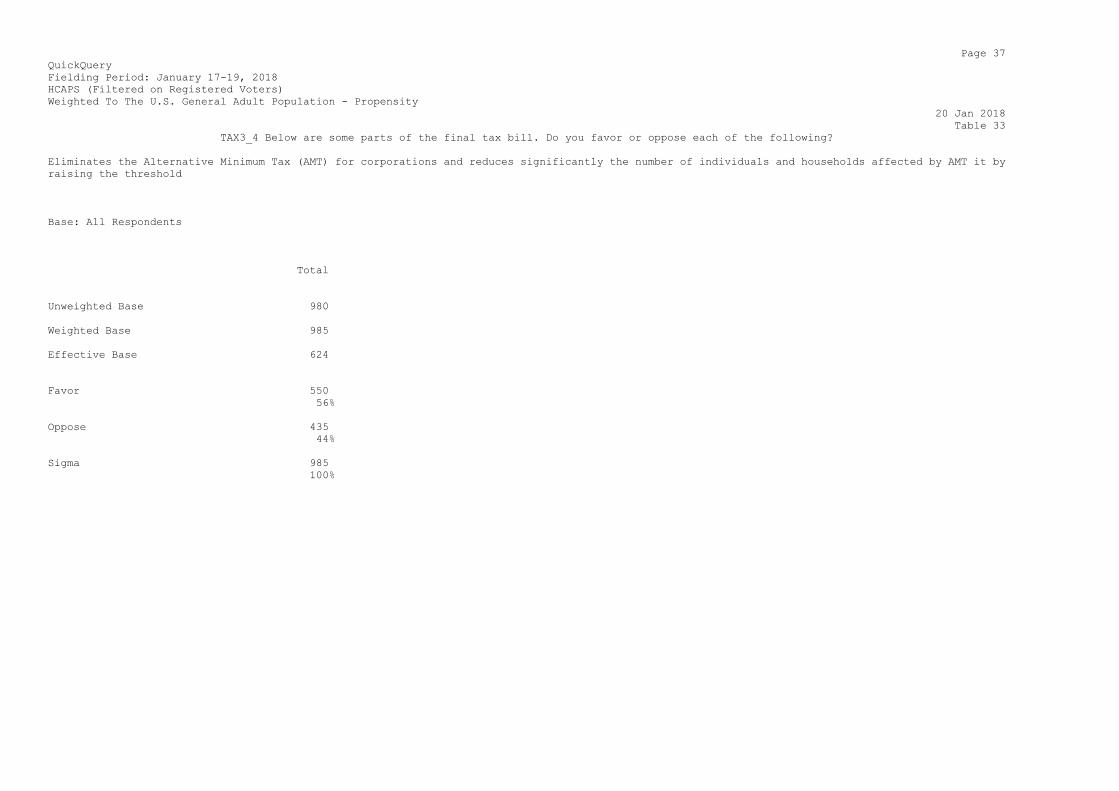
TAX3_4 Below are some parts of the final tax bill. Do you favor or oppose each of the following?
Eliminates the Alternative Minimum Tax (AMT) for corporations and reduces significantly the number of individuals and households affected by AMT it by
raising the threshold
Base: All Respondents
Total
Unweighted Base 980
Weighted Base 985
Effective Base 624
Favor 550
56%
Oppose 435
44%
Sigma 985
100%
Page 38
QuickQuery
Fielding Period: January 17-19, 2018
HCAPS (Filtered on Registered Voters)
Weighted To The U.S. General Adult Population - Propensity
20 Jan 2018
Table 34
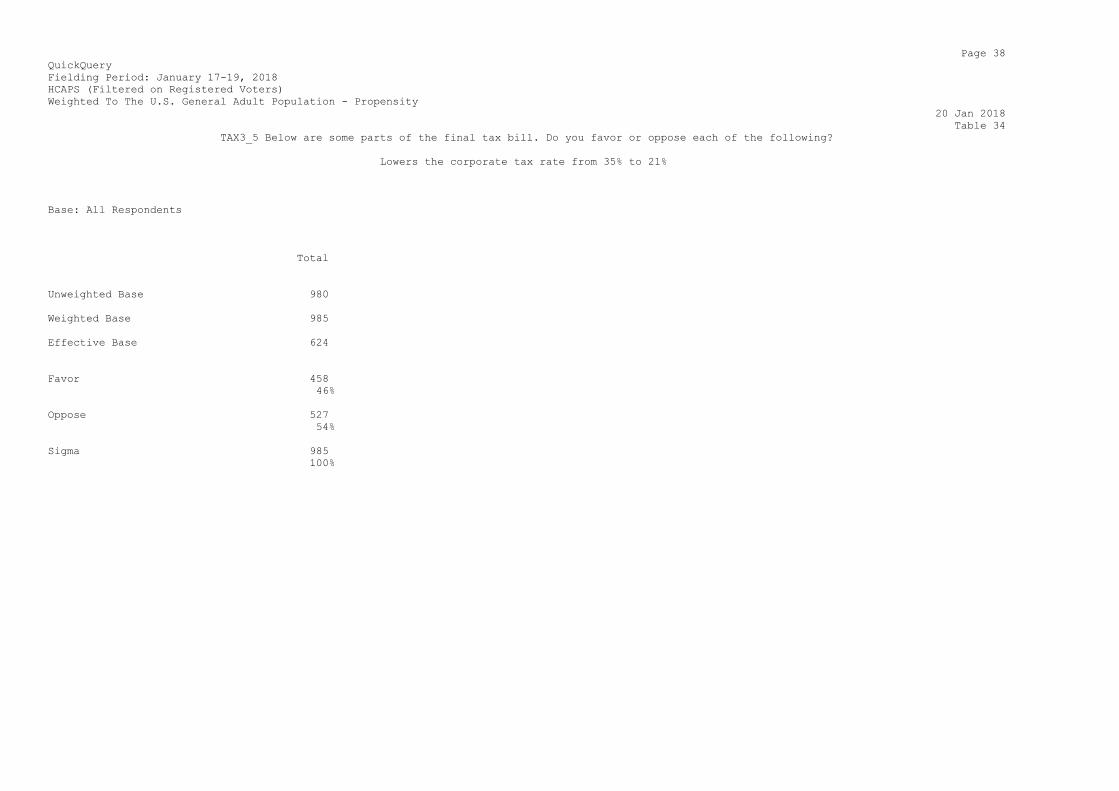
TAX3_5 Below are some parts of the final tax bill. Do you favor or oppose each of the following?
Lowers the corporate tax rate from 35% to 21%
Base: All Respondents
Total
Unweighted Base 980
Weighted Base 985
Effective Base 624
Favor 458
46%
Oppose 527
54%
Sigma 985
100%
Page 39
QuickQuery
Fielding Period: January 17-19, 2018
HCAPS (Filtered on Registered Voters)
Weighted To The U.S. General Adult Population - Propensity
20 Jan 2018
Table 35
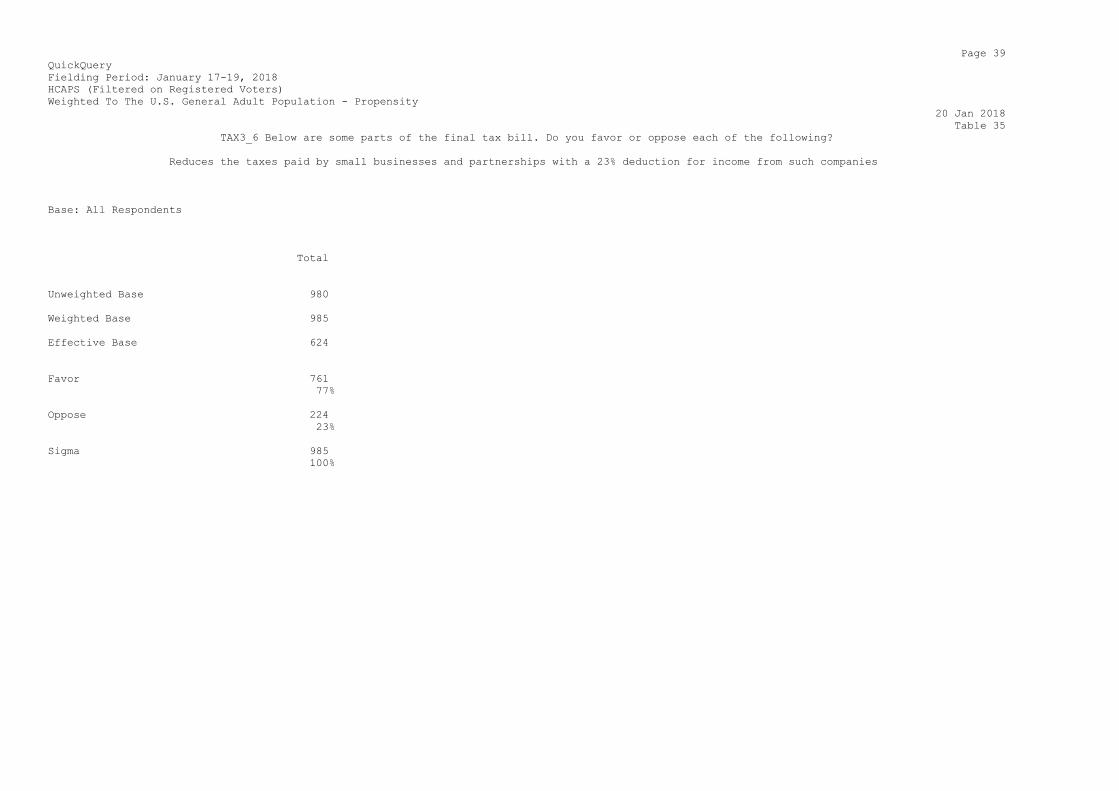
TAX3_6 Below are some parts of the final tax bill. Do you favor or oppose each of the following?
Reduces the taxes paid by small businesses and partnerships with a 23% deduction for income from such companies
Base: All Respondents
Total
Unweighted Base 980
Weighted Base 985
Effective Base 624
Favor 761
77%
Oppose 224
23%
Sigma 985
100%
Page 40
QuickQuery
Fielding Period: January 17-19, 2018
HCAPS (Filtered on Registered Voters)
Weighted To The U.S. General Adult Population - Propensity
20 Jan 2018
Table 36
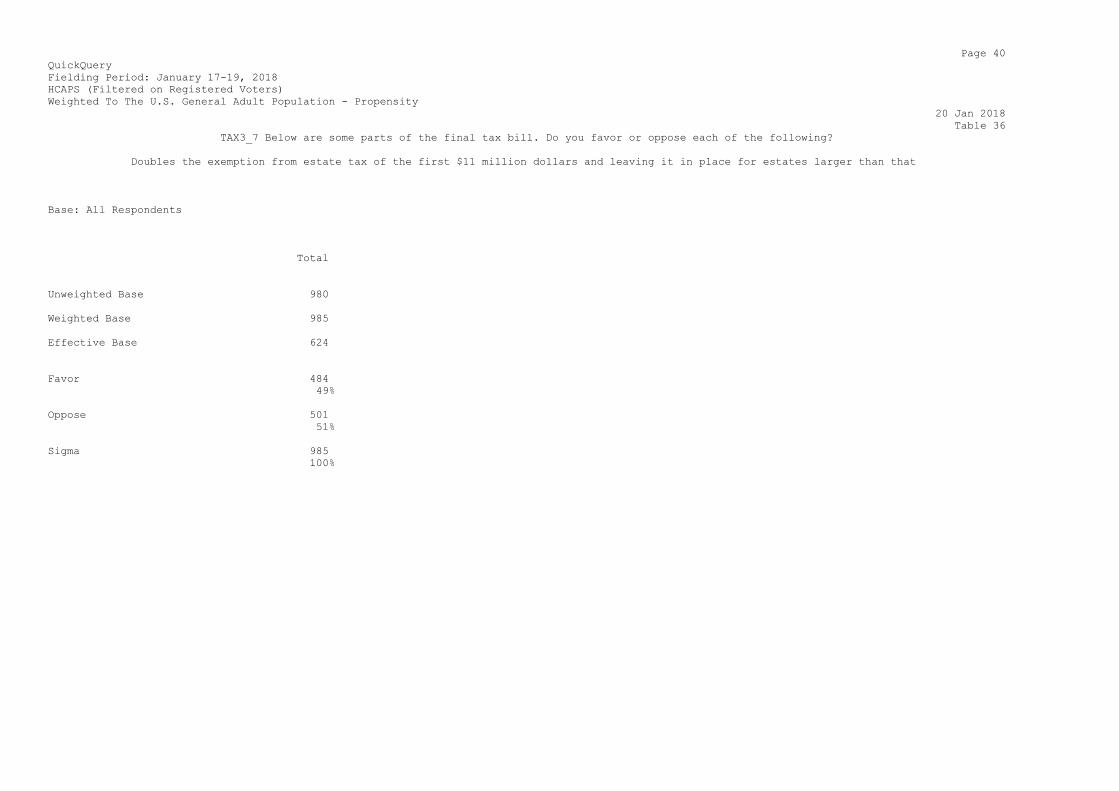
TAX3_7 Below are some parts of the final tax bill. Do you favor or oppose each of the following?
Doubles the exemption from estate tax of the first $11 million dollars and leaving it in place for estates larger than that
Base: All Respondents
Total
Unweighted Base 980
Weighted Base 985
Effective Base 624
Favor 484
49%
Oppose 501
51%
Sigma 985
100%

Page 41
QuickQuery
Fielding Period: January 17-19, 2018
HCAPS (Filtered on Registered Voters)
Weighted To The U.S. General Adult Population - Propensity
20 Jan 2018
Table 37
TAX3_8 Below are some parts of the final tax bill. Do you favor or oppose each of the following?
Eliminates the deduction of state and local taxes beyond $10,000 of local property, sales, or income taxes
Base: All Respondents
Total
Unweighted Base 980
Weighted Base 985
Effective Base 624
Favor 517
52%
Oppose 468
48%
Sigma 985
100%
Page 42
QuickQuery
Fielding Period: January 17-19, 2018
HCAPS (Filtered on Registered Voters)
Weighted To The U.S. General Adult Population - Propensity
20 Jan 2018
Table 38
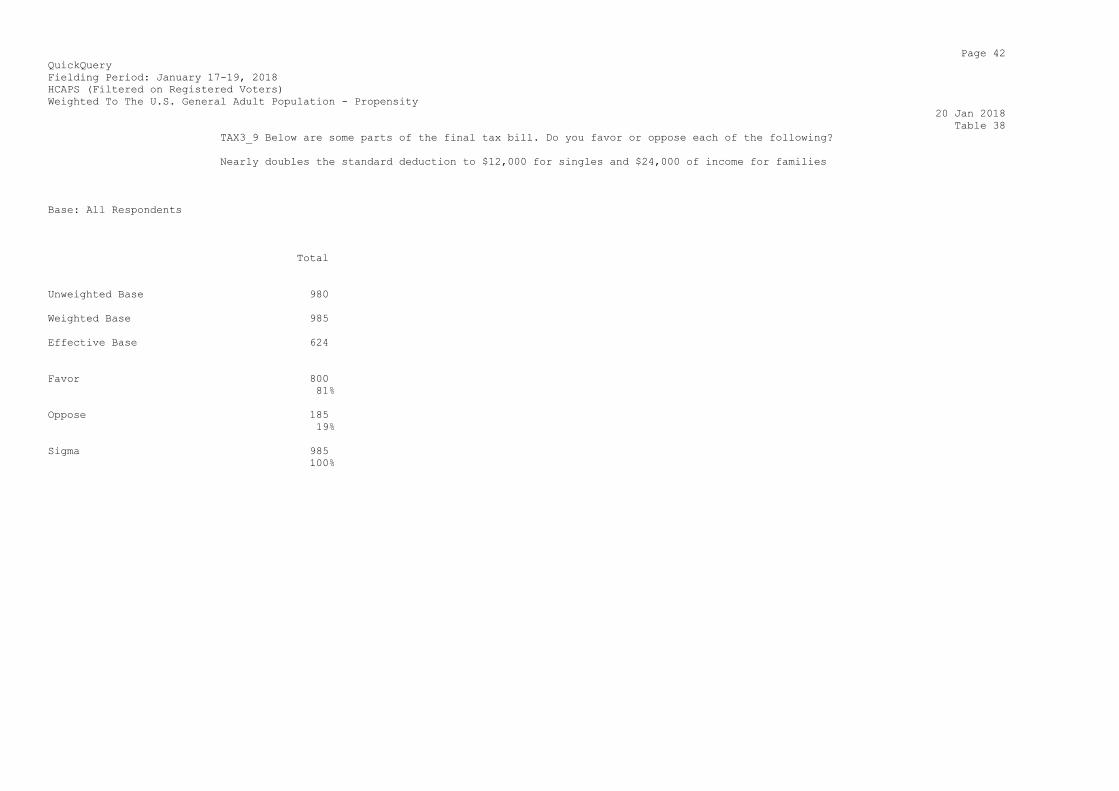
TAX3_9 Below are some parts of the final tax bill. Do you favor or oppose each of the following?
Nearly doubles the standard deduction to $12,000 for singles and $24,000 of income for families
Base: All Respondents
Total
Unweighted Base 980
Weighted Base 985
Effective Base 624
Favor 800
81%
Oppose 185
19%
Sigma 985
100%
Page 43
QuickQuery
Fielding Period: January 17-19, 2018
HCAPS (Filtered on Registered Voters)
Weighted To The U.S. General Adult Population - Propensity
20 Jan 2018
Table 39
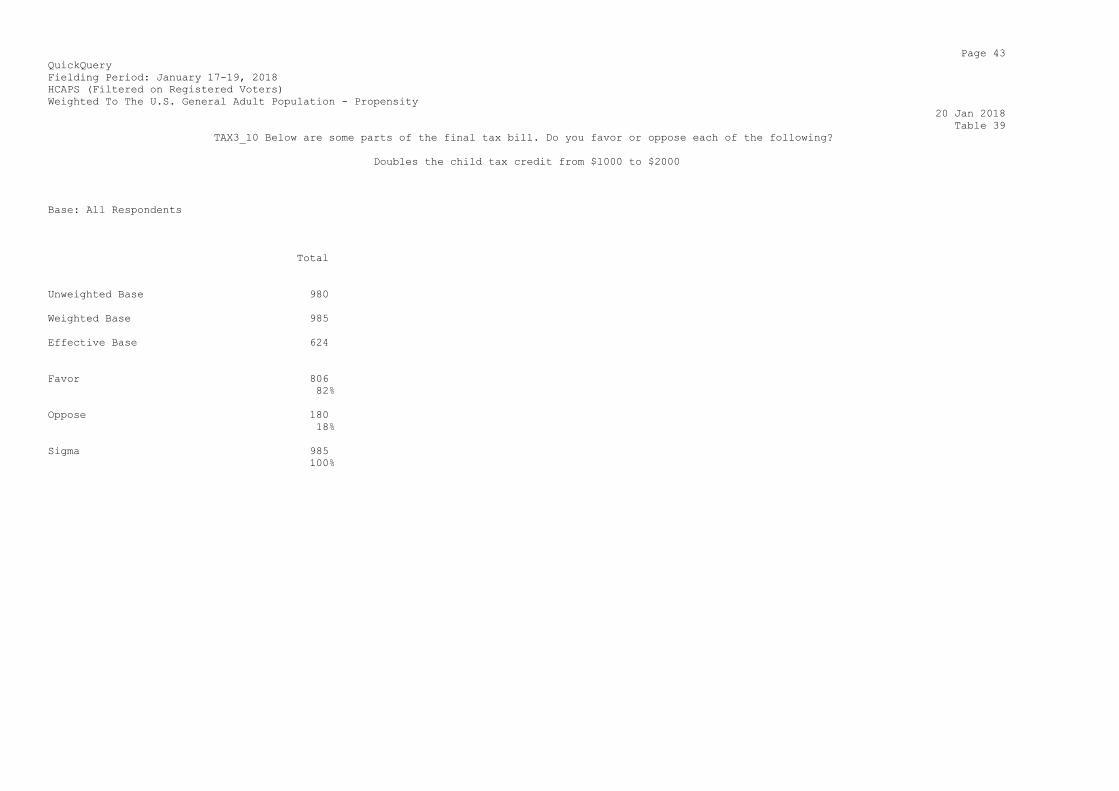
TAX3_10 Below are some parts of the final tax bill. Do you favor or oppose each of the following?
Doubles the child tax credit from $1000 to $2000
Base: All Respondents
Total
Unweighted Base 980
Weighted Base 985
Effective Base 624
Favor 806
82%
Oppose 180
18%
Sigma 985
100%

Page 44
QuickQuery
Fielding Period: January 17-19, 2018
HCAPS (Filtered on Registered Voters)
Weighted To The U.S. General Adult Population - Propensity
20 Jan 2018
Table 40
TAX3_11 Below are some parts of the final tax bill. Do you favor or oppose each of the following?
The bill makes no changes to the student loan deduction or the "tuition waiver" for college and graduate students
Base: All Respondents
Total
Unweighted Base 980
Weighted Base 985
Effective Base 624
Favor 644
65%
Oppose 342
35%
Sigma 985
100%

Page 45
QuickQuery
Fielding Period: January 17-19, 2018
HCAPS (Filtered on Registered Voters)
Weighted To The U.S. General Adult Population - Propensity
20 Jan 2018
Table 41
TAX3_12 Below are some parts of the final tax bill. Do you favor or oppose each of the following?
The bill eliminates the tax and mandate that requires people to buy health insurance or pay a tax
Base: All Respondents
Total
Unweighted Base 980
Weighted Base 985
Effective Base 624
Favor 623
63%
Oppose 362
37%
Sigma 985
100%
Page 46
QuickQuery
Fielding Period: January 17-19, 2018
HCAPS (Filtered on Registered Voters)
Weighted To The U.S. General Adult Population - Propensity
20 Jan 2018
Table 42
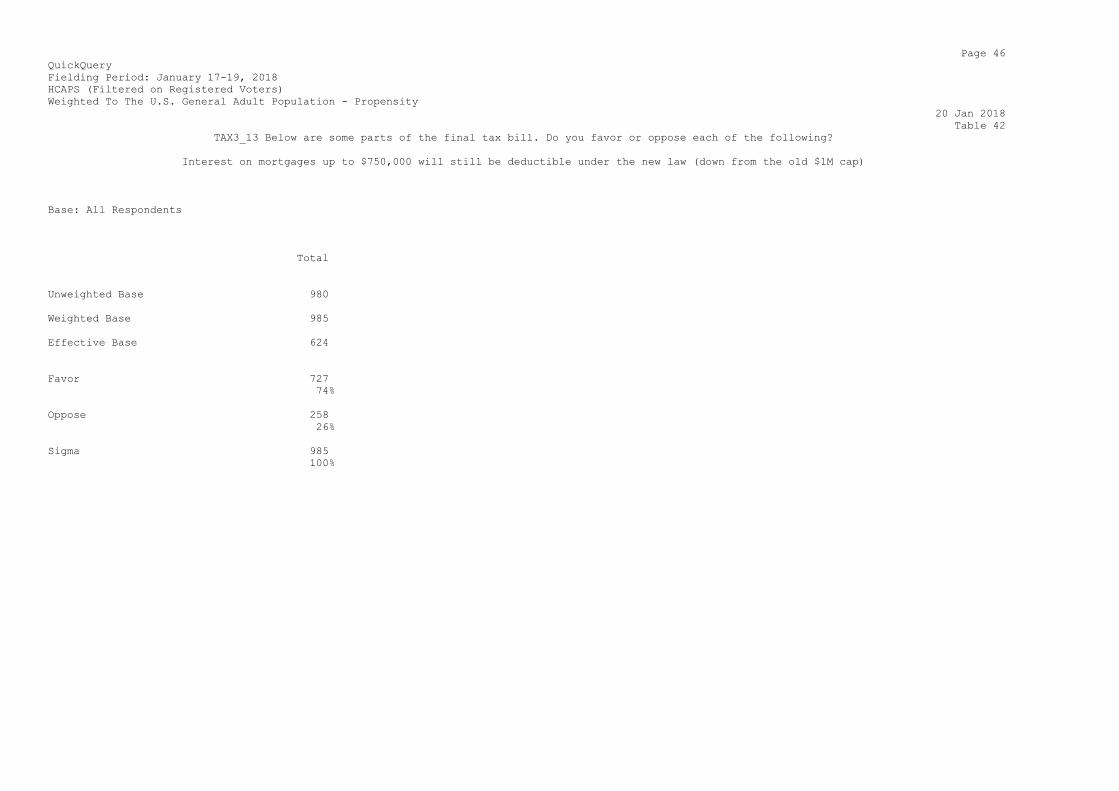
TAX3_13 Below are some parts of the final tax bill. Do you favor or oppose each of the following?
Interest on mortgages up to $750,000 will still be deductible under the new law (down from the old $1M cap)
Base: All Respondents
Total
Unweighted Base 980
Weighted Base 985
Effective Base 624
Favor 727
74%
Oppose 258
26%
Sigma 985
100%
Page 47
QuickQuery
Fielding Period: January 17-19, 2018
HCAPS (Filtered on Registered Voters)
Weighted To The U.S. General Adult Population - Propensity
20 Jan 2018
Table 43
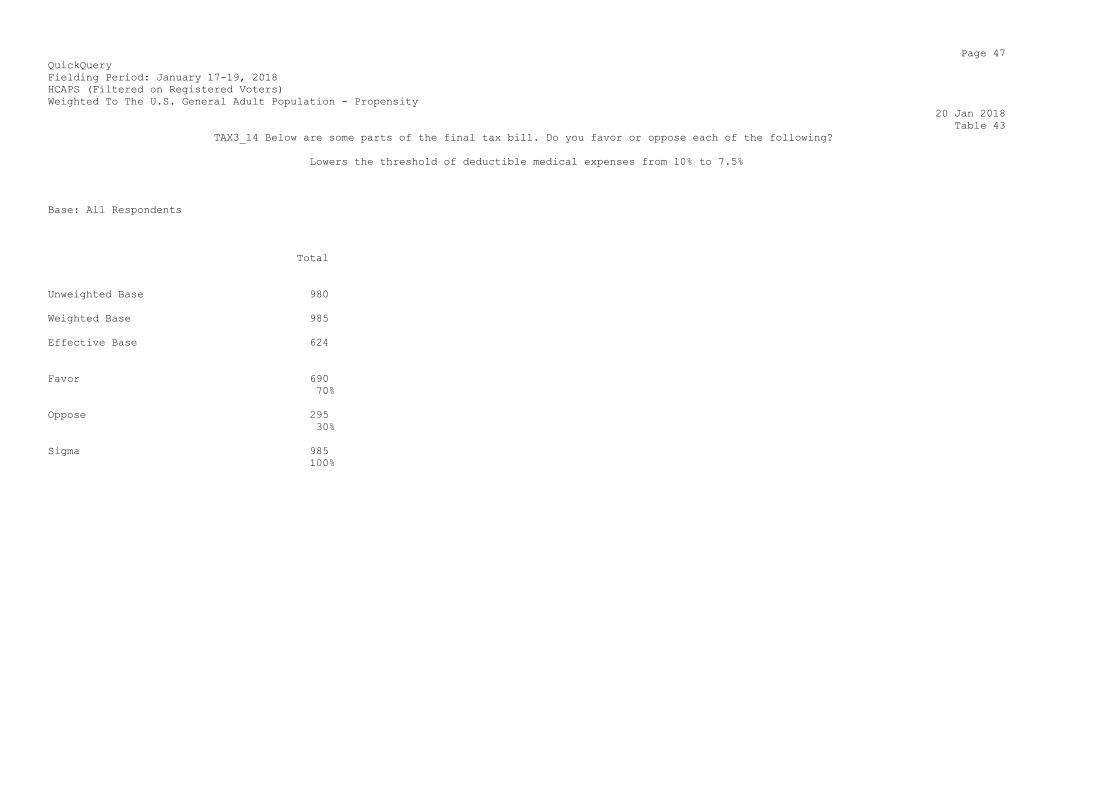
TAX3_14 Below are some parts of the final tax bill. Do you favor or oppose each of the following?
Lowers the threshold of deductible medical expenses from 10% to 7.5%
Base: All Respondents
Total
Unweighted Base 980
Weighted Base 985
Effective Base 624
Favor 690
70%
Oppose 295
30%
Sigma 985
100%

Page 48
QuickQuery
Fielding Period: January 17-19, 2018
HCAPS (Filtered on Registered Voters)
Weighted To The U.S. General Adult Population - Propensity
20 Jan 2018
Table 44
TAX3_15 Below are some parts of the final tax bill. Do you favor or oppose each of the following?
Companies can bring back any money they have generated overseas at the lower tax rate of 14.5%
Base: All Respondents
Total
Unweighted Base 980
Weighted Base 985
Effective Base 624
Favor 587
60%
Oppose 398
40%
Sigma 985
100%
Page 49
QuickQuery
Fielding Period: January 17-19, 2018
HCAPS (Filtered on Registered Voters)
Weighted To The U.S. General Adult Population - Propensity
20 Jan 2018
Table 45
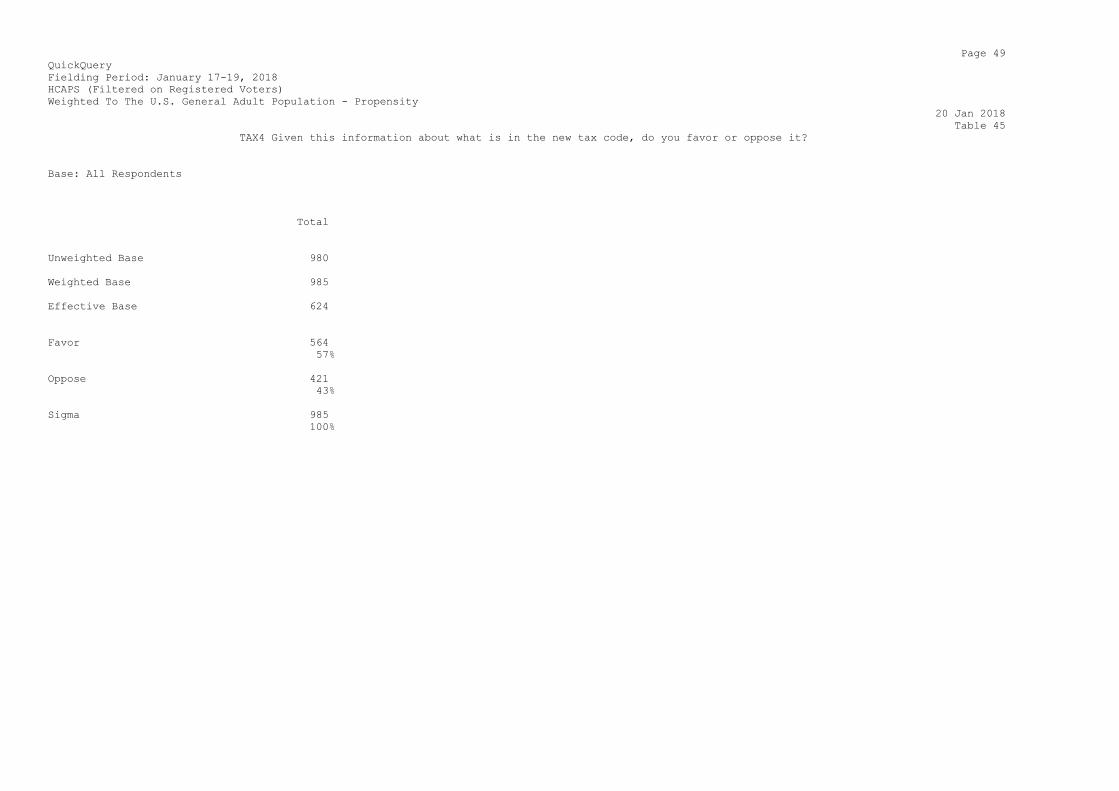
TAX4 Given this information about what is in the new tax code, do you favor or oppose it?
Base: All Respondents
Total
Unweighted Base 980
Weighted Base 985
Effective Base 624
Favor 564
57%
Oppose 421
43%
Sigma 985
100%
Page 50
QuickQuery
Fielding Period: January 17-19, 2018
HCAPS (Filtered on Registered Voters)
Weighted To The U.S. General Adult Population - Propensity
20 Jan 2018
Table 46
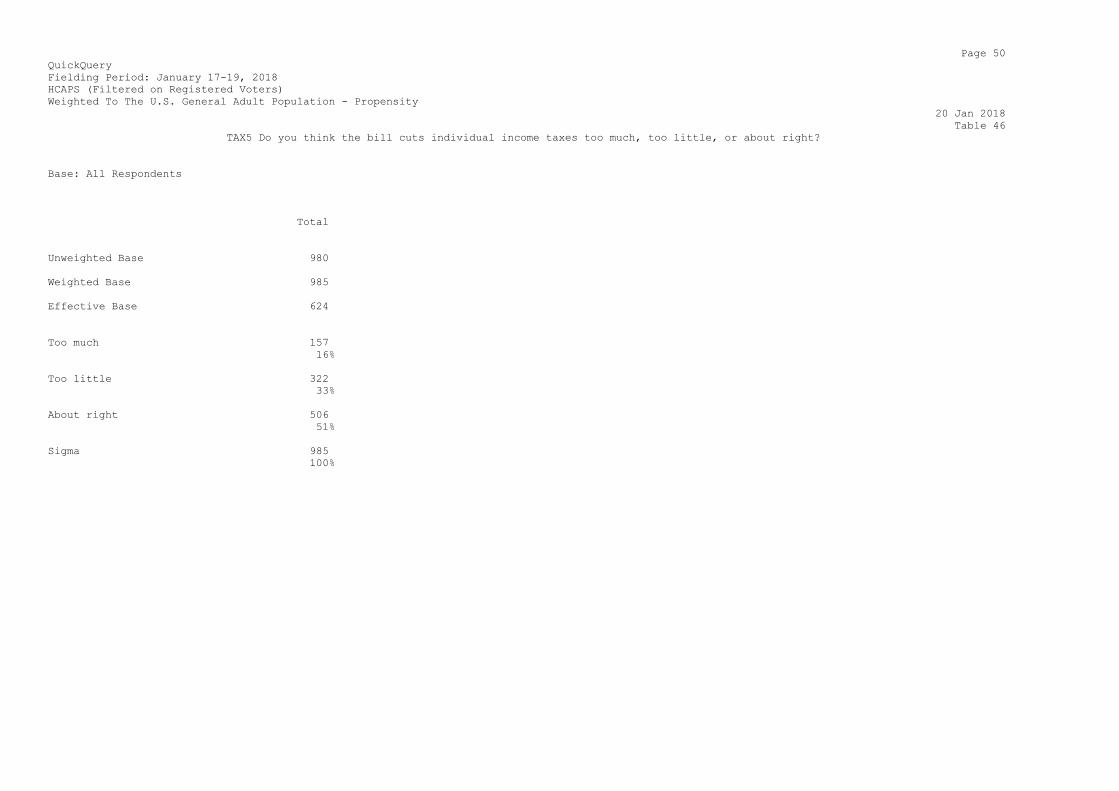
TAX5 Do you think the bill cuts individual income taxes too much, too little, or about right?
Base: All Respondents
Total
Unweighted Base 980
Weighted Base 985
Effective Base 624
Too much 157
16%
Too little 322
33%
About right 506
51%
Sigma 985
100%

Page 51
QuickQuery
Fielding Period: January 17-19, 2018
HCAPS (Filtered on Registered Voters)
Weighted To The U.S. General Adult Population - Propensity
20 Jan 2018
Table 47
TAX6 Do you think the bill cuts taxes on large businesses too much, too little, or about right?
Base: All Respondents
Total
Unweighted Base 980
Weighted Base 985
Effective Base 624
Too much 389
39%
Too little 249
25%
About right 348
35%
Sigma 985
100%

Page 52
QuickQuery
Fielding Period: January 17-19, 2018
HCAPS (Filtered on Registered Voters)
Weighted To The U.S. General Adult Population - Propensity
20 Jan 2018
Table 48
TAX7 Do you think the bill cuts taxes on small business too much, too little, or about right?
Base: All Respondents
Total
Unweighted Base 980
Weighted Base 985
Effective Base 624
Too much 161
16%
Too little 233
24%
About right 592
60%
Sigma 985
100%
Page 53
QuickQuery
Fielding Period: January 17-19, 2018
HCAPS (Filtered on Registered Voters)
Weighted To The U.S. General Adult Population - Propensity
20 Jan 2018
Table 49
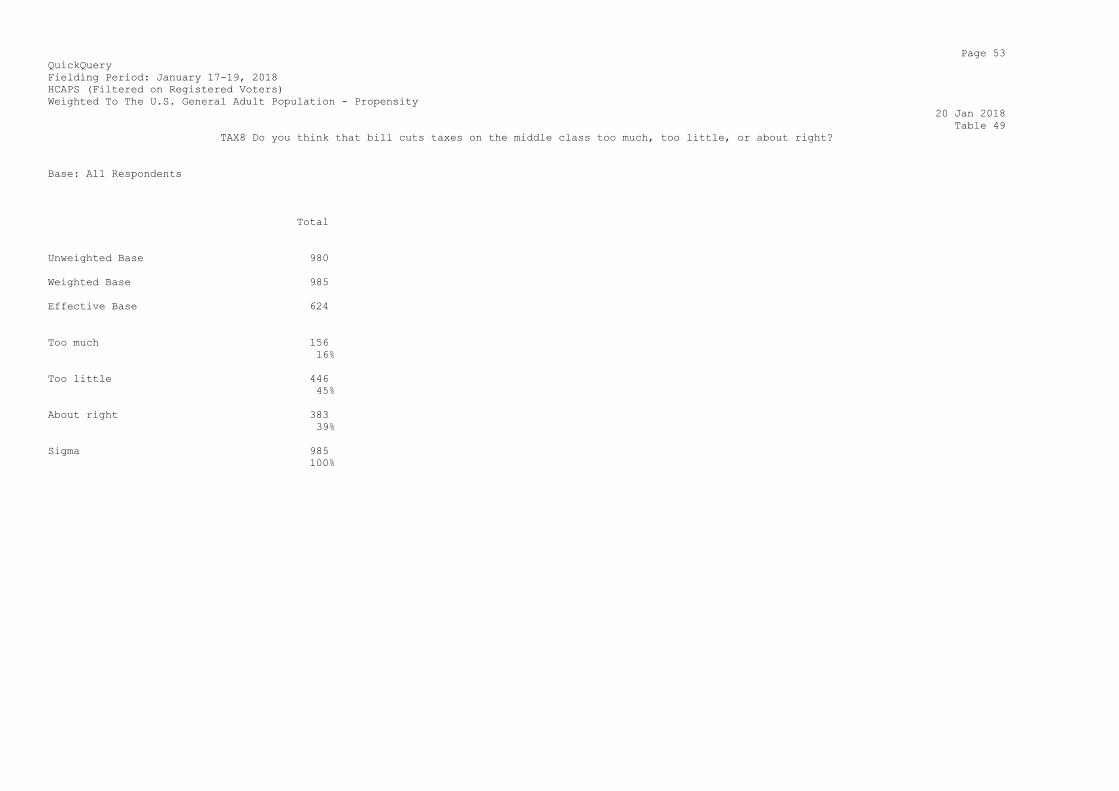
TAX8 Do you think that bill cuts taxes on the middle class too much, too little, or about right?
Base: All Respondents
Total
Unweighted Base 980
Weighted Base 985
Effective Base 624
Too much 156
16%
Too little 446
45%
About right 383
39%
Sigma 985
100%
Page 54
QuickQuery
Fielding Period: January 17-19, 2018
HCAPS (Filtered on Registered Voters)
Weighted To The U.S. General Adult Population - Propensity
20 Jan 2018
Table 50
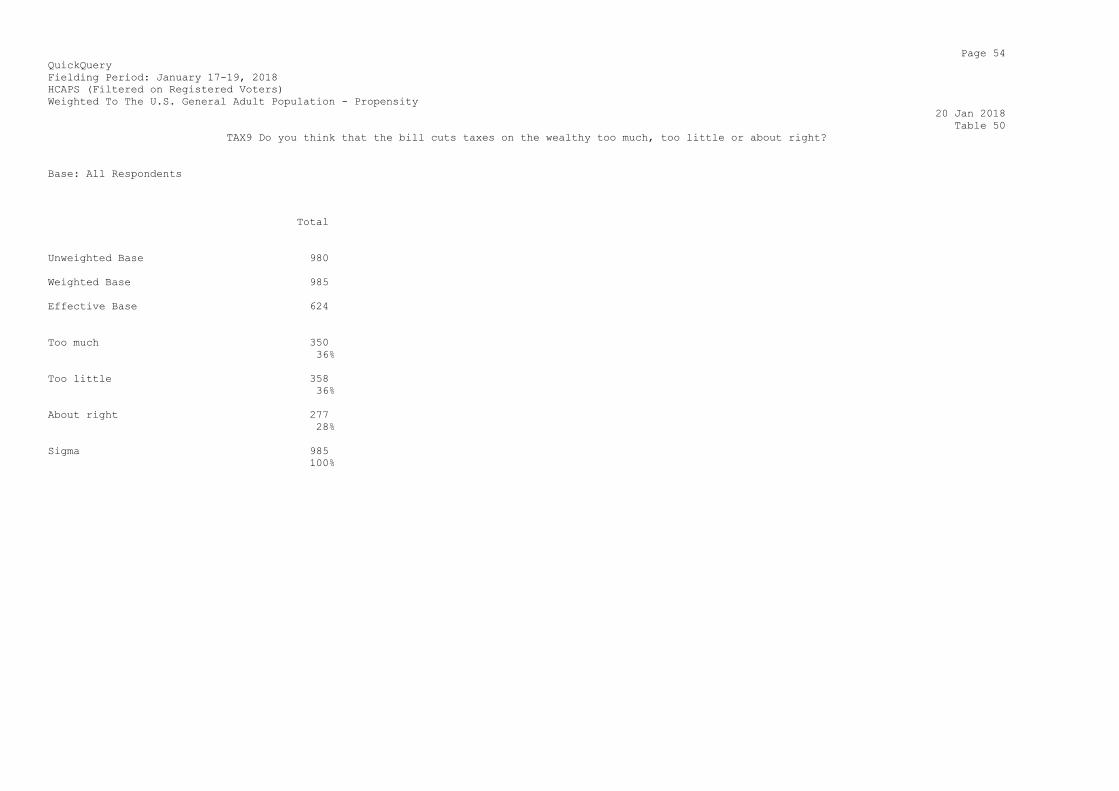
TAX9 Do you think that the bill cuts taxes on the wealthy too much, too little or about right?
Base: All Respondents
Total
Unweighted Base 980
Weighted Base 985
Effective Base 624
Too much 350
36%
Too little 358
36%
About right 277
28%
Sigma 985
100%
Page 55
QuickQuery
Fielding Period: January 17-19, 2018
HCAPS (Filtered on Registered Voters)
Weighted To The U.S. General Adult Population - Propensity
20 Jan 2018
Table 51
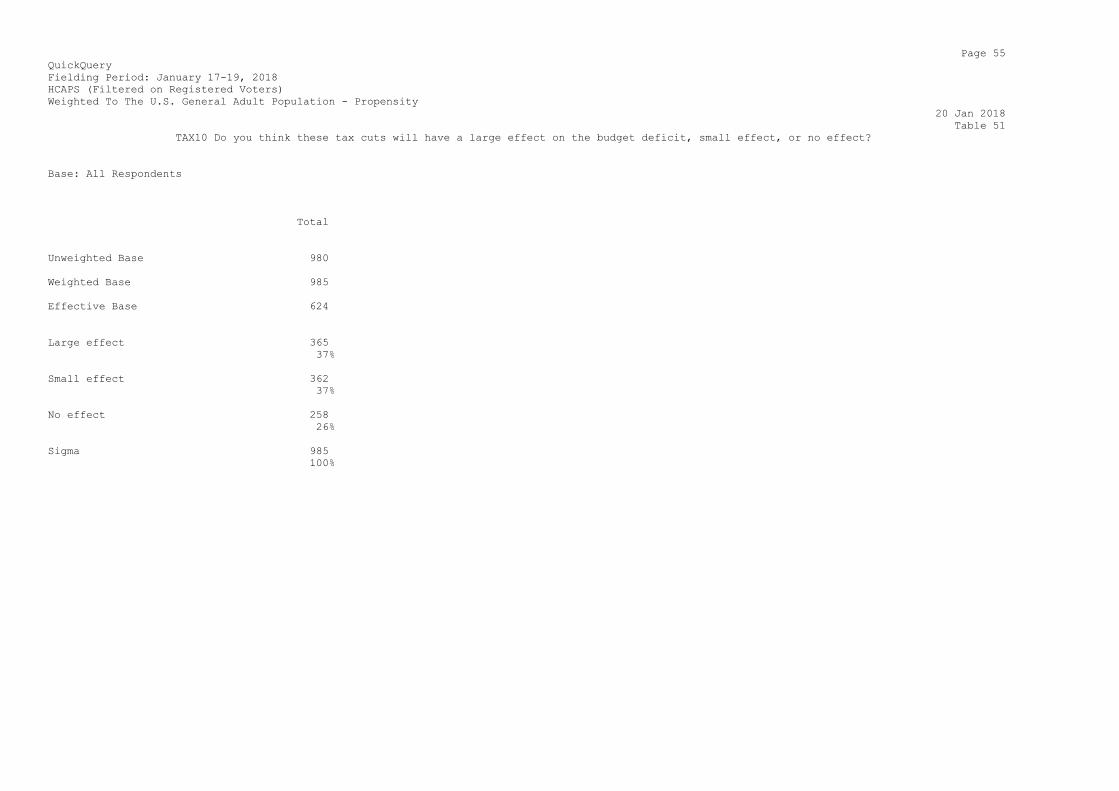
TAX10 Do you think these tax cuts will have a large effect on the budget deficit, small effect, or no effect?
Base: All Respondents
Total
Unweighted Base 980
Weighted Base 985
Effective Base 624
Large effect 365
37%
Small effect 362
37%
No effect 258
26%
Sigma 985
100%

Page 56
QuickQuery
Fielding Period: January 17-19, 2018
HCAPS (Filtered on Registered Voters)
Weighted To The U.S. General Adult Population - Propensity
20 Jan 2018
Table 52
TAX11 Do you think that these tax cuts will have a large effect on growing the economy, small effect, or no effect?
Base: All Respondents
Total
Unweighted Base 980
Weighted Base 985
Effective Base 624
Large effect 338
34%
Small effect 415
42%
No effect 233
24%
Sigma 985
100%
Page 57
QuickQuery
Fielding Period: January 17-19, 2018
HCAPS (Filtered on Registered Voters)
Weighted To The U.S. General Adult Population - Propensity
20 Jan 2018
Table 53
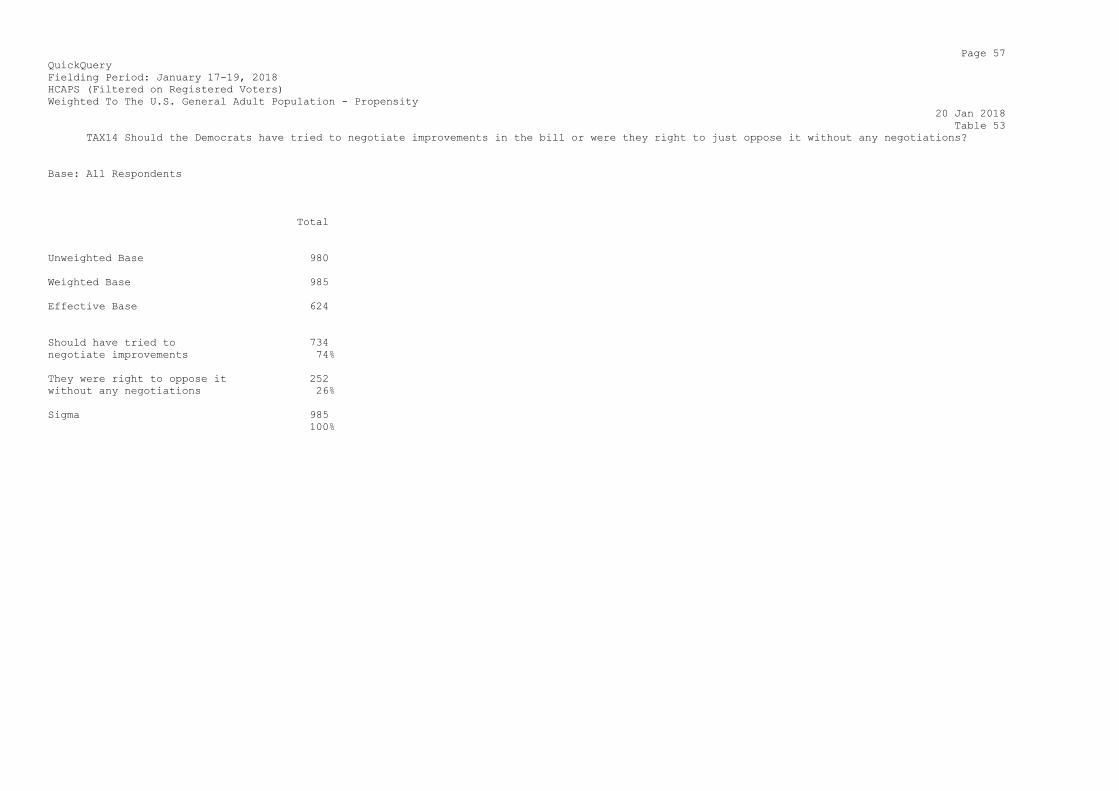
TAX14 Should the Democrats have tried to negotiate improvements in the bill or were they right to just oppose it without any negotiations?
Base: All Respondents
Total
Unweighted Base 980
Weighted Base 985
Effective Base 624
Should have tried to 734
negotiate improvements 74%
They were right to oppose it 252
without any negotiations 26%
Sigma 985
100%
Page 60
QuickQuery
Fielding Period: January 17-19, 2018
HCAPS (Filtered on Registered Voters)
Weighted To The U.S. General Adult Population - Propensity
20 Jan 2018
Table 56
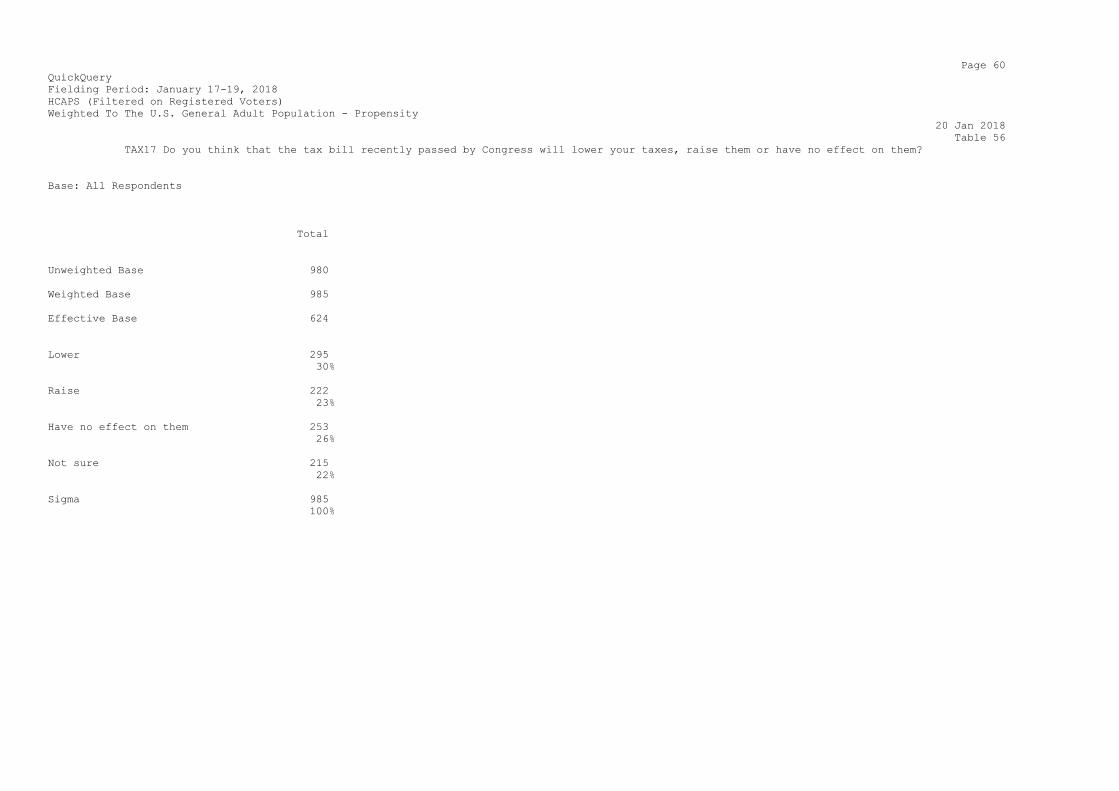
TAX17 Do you think that the tax bill recently passed by Congress will lower your taxes, raise them or have no effect on them?
Base: All Respondents
Total
Unweighted Base 980
Weighted Base 985
Effective Base 624
Lower 295
30%
Raise 222
23%
Have no effect on them 253
26%
Not sure 215
22%
Sigma 985
100%
Page 61
QuickQuery
Fielding Period: January 17-19, 2018
HCAPS (Filtered on Registered Voters)
Weighted To The U.S. General Adult Population - Propensity
20 Jan 2018
Table 57
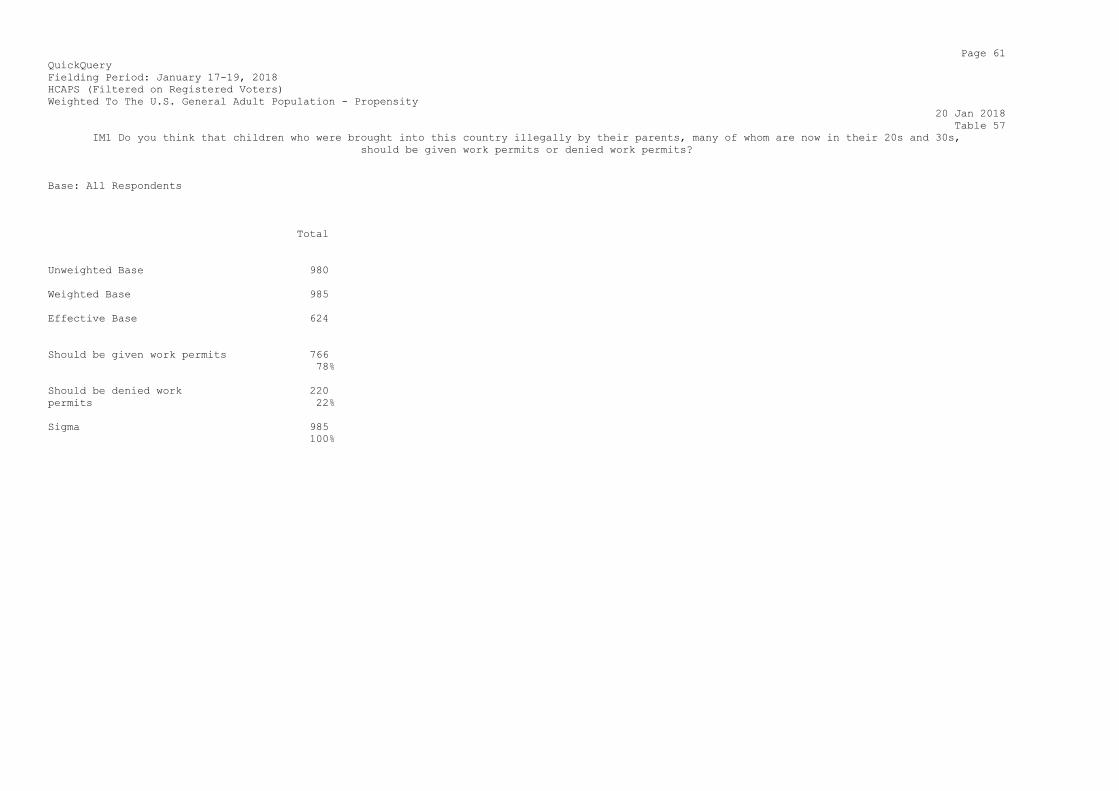
IM1 Do you think that children who were brought into this country illegally by their parents, many of whom are now in their 20s and 30s,
should be given work permits or denied work permits?
Base: All Respondents
Total
Unweighted Base 980
Weighted Base 985
Effective Base 624
Should be given work permits 766
78%
Should be denied work 220
permits 22%
Sigma 985
100%
Page 62
QuickQuery
Fielding Period: January 17-19, 2018
HCAPS (Filtered on Registered Voters)
Weighted To The U.S. General Adult Population - Propensity
20 Jan 2018
Table 58
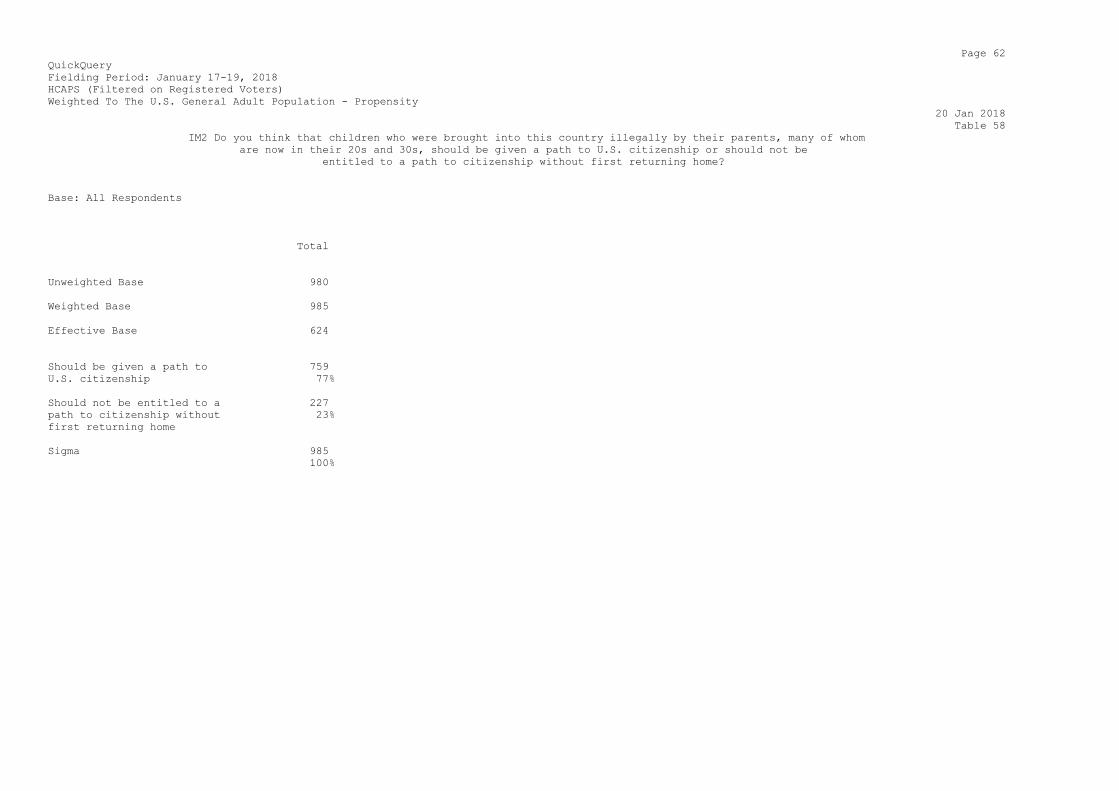
IM2 Do you think that children who were brought into this country illegally by their parents, many of whom
are now in their 20s and 30s, should be given a path to U.S. citizenship or should not be
entitled to a path to citizenship without first returning home?
Base: All Respondents
Total
Unweighted Base 980
Weighted Base 985
Effective Base 624
Should be given a path to 759
U.S. citizenship 77%
Should not be entitled to a 227
path to citizenship without 23%
first returning home
Sigma 985
100%
Page 63
QuickQuery
Fielding Period: January 17-19, 2018
HCAPS (Filtered on Registered Voters)
Weighted To The U.S. General Adult Population - Propensity
20 Jan 2018
Table 59
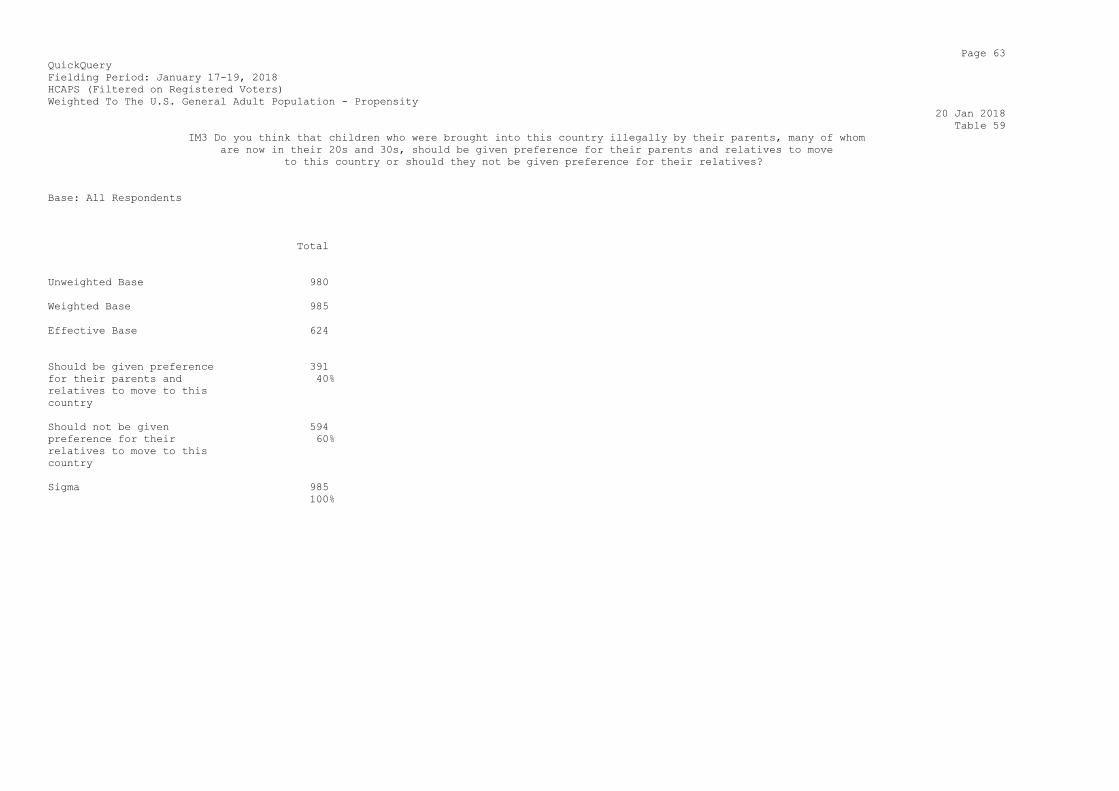
IM3 Do you think that children who were brought into this country illegally by their parents, many of whom
are now in their 20s and 30s, should be given preference for their parents and relatives to move
to this country or should they not be given preference for their relatives?
Base: All Respondents
Total
Unweighted Base 980
Weighted Base 985
Effective Base 624
Should be given preference 391
for their parents and 40%
relatives to move to this
country
Should not be given 594
preference for their 60%
relatives to move to this
country
Sigma 985
100%
Page 64
QuickQuery
Fielding Period: January 17-19, 2018
HCAPS (Filtered on Registered Voters)
Weighted To The U.S. General Adult Population - Propensity
20 Jan 2018
Table 60
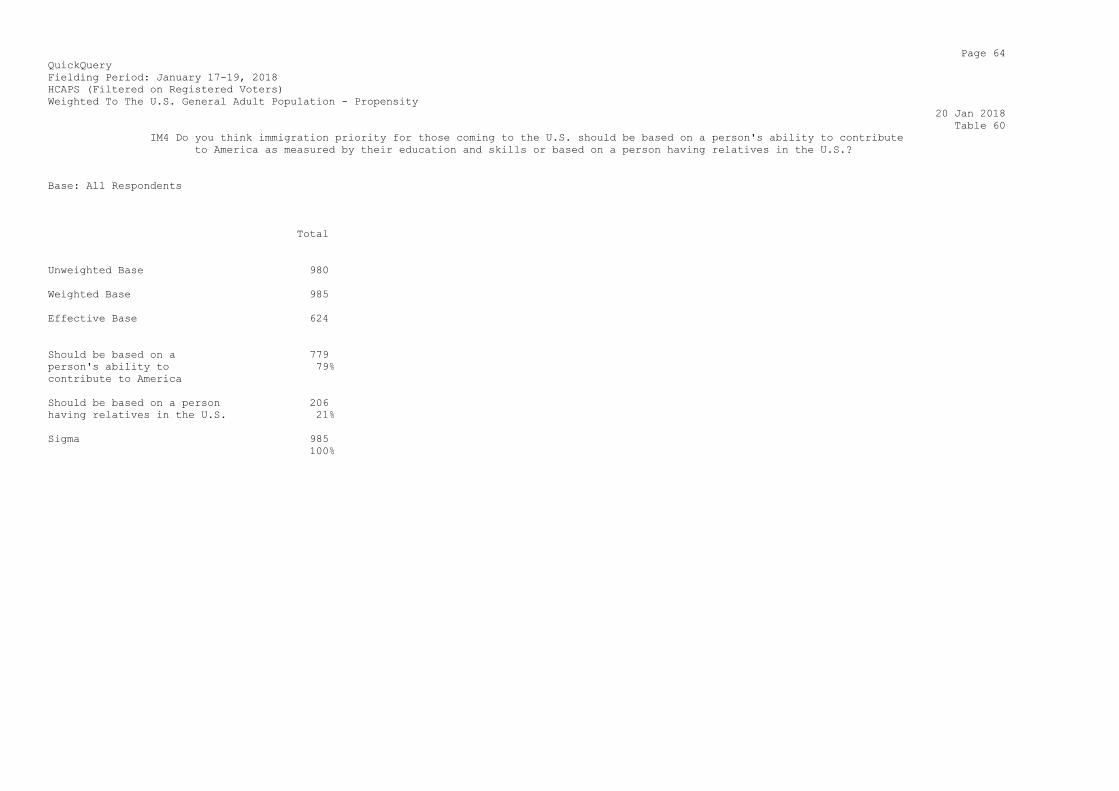
IM4 Do you think immigration priority for those coming to the U.S. should be based on a person's ability to contribute
to America as measured by their education and skills or based on a person having relatives in the U.S.?
Base: All Respondents
Total
Unweighted Base 980
Weighted Base 985
Effective Base 624
Should be based on a 779
person's ability to 79%
contribute to America
Should be based on a person 206
having relatives in the U.S. 21%
Sigma 985
100%

Page 65
QuickQuery
Fielding Period: January 17-19, 2018
HCAPS (Filtered on Registered Voters)
Weighted To The U.S. General Adult Population - Propensity
20 Jan 2018
Table 61
IM5 In your opinion, about how many legal immigrants should be admitted to the U.S. each year?
Base: All Respondents
Total
Unweighted Base 980
Weighted Base 985
Effective Base 624
None 88
9%
1 to less than 250,000 343
35%
250,000 to 499,999 189
19%
500,000 to less than 1 177
million 18%
1 million to less than 1.5 70
million 7%
1.5 million to less than 2 33
million 3%
2 million to less than 2.5 12
million 1%
2.5 million or more 74
8%
Sigma 985
100%
Page 66
QuickQuery
Fielding Period: January 17-19, 2018
HCAPS (Filtered on Registered Voters)
Weighted To The U.S. General Adult Population - Propensity
20 Jan 2018
Table 62
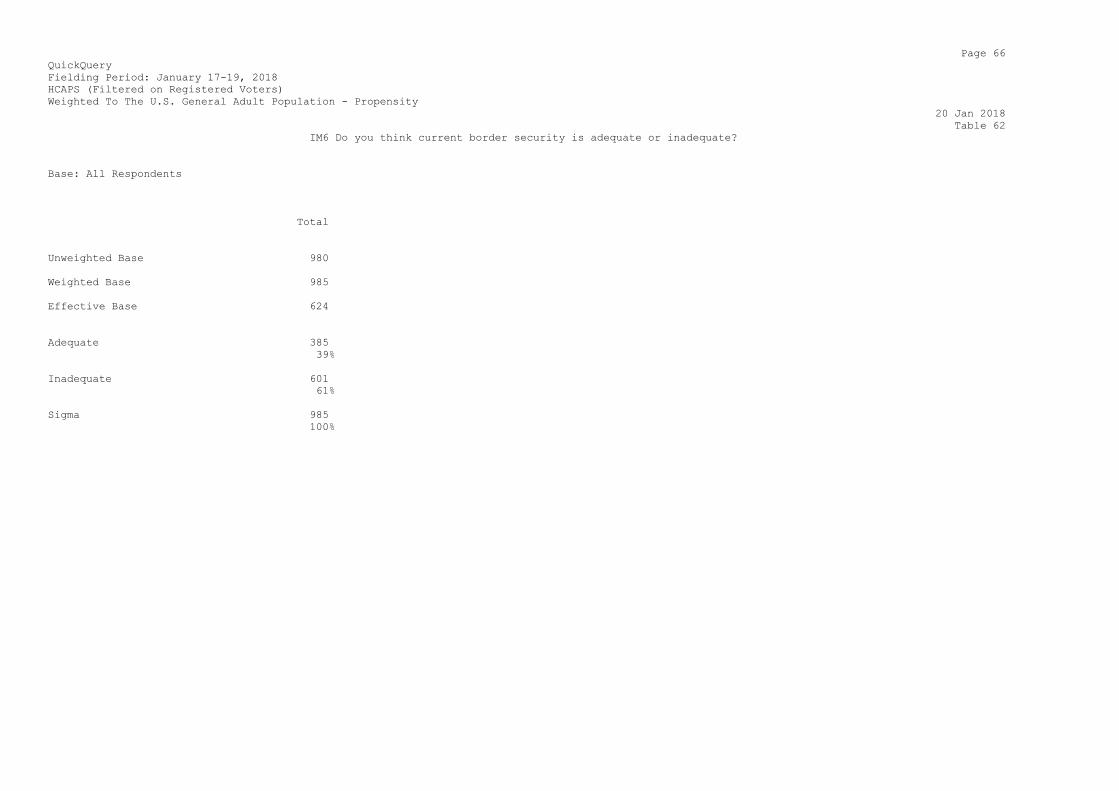
IM6 Do you think current border security is adequate or inadequate?
Base: All Respondents
Total
Unweighted Base 980
Weighted Base 985
Effective Base 624
Adequate 385
39%
Inadequate 601
61%
Sigma 985
100%
Page 67
QuickQuery
Fielding Period: January 17-19, 2018
HCAPS (Filtered on Registered Voters)
Weighted To The U.S. General Adult Population - Propensity
20 Jan 2018
Table 63
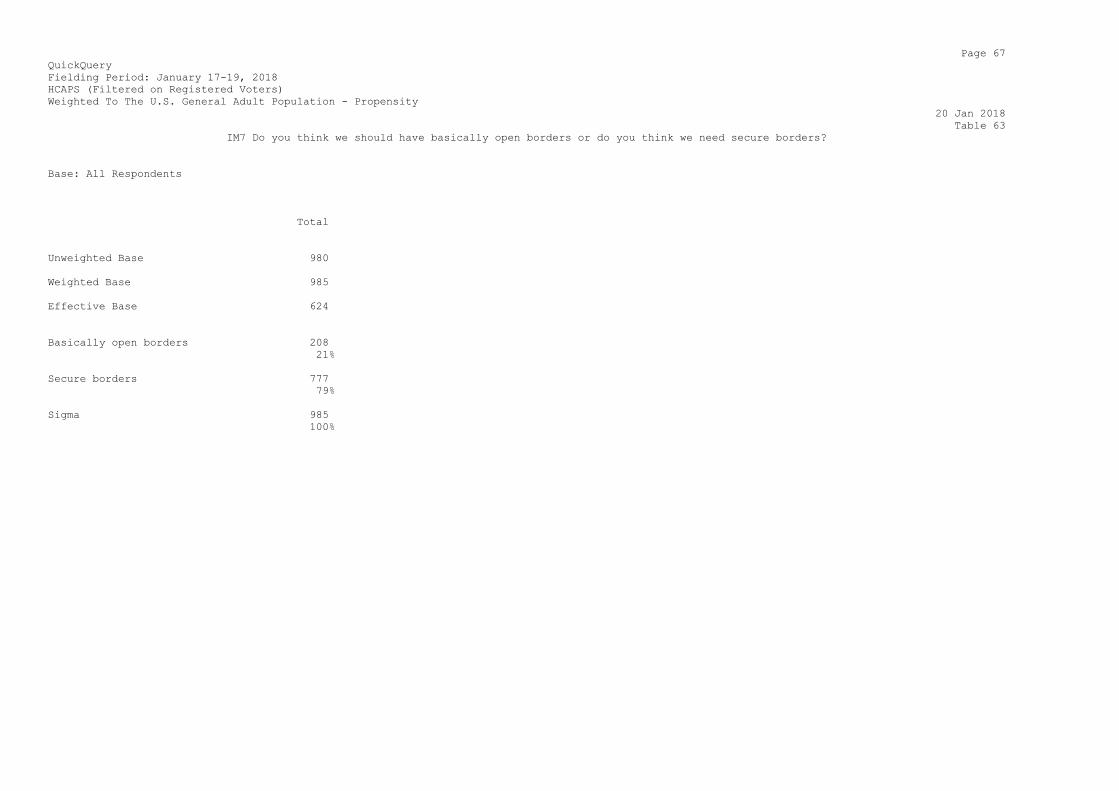
IM7 Do you think we should have basically open borders or do you think we need secure borders?
Base: All Respondents
Total
Unweighted Base 980
Weighted Base 985
Effective Base 624
Basically open borders 208
21%
Secure borders 777
79%
Sigma 985
100%
Page 68
QuickQuery
Fielding Period: January 17-19, 2018
HCAPS (Filtered on Registered Voters)
Weighted To The U.S. General Adult Population - Propensity
20 Jan 2018
Table 64
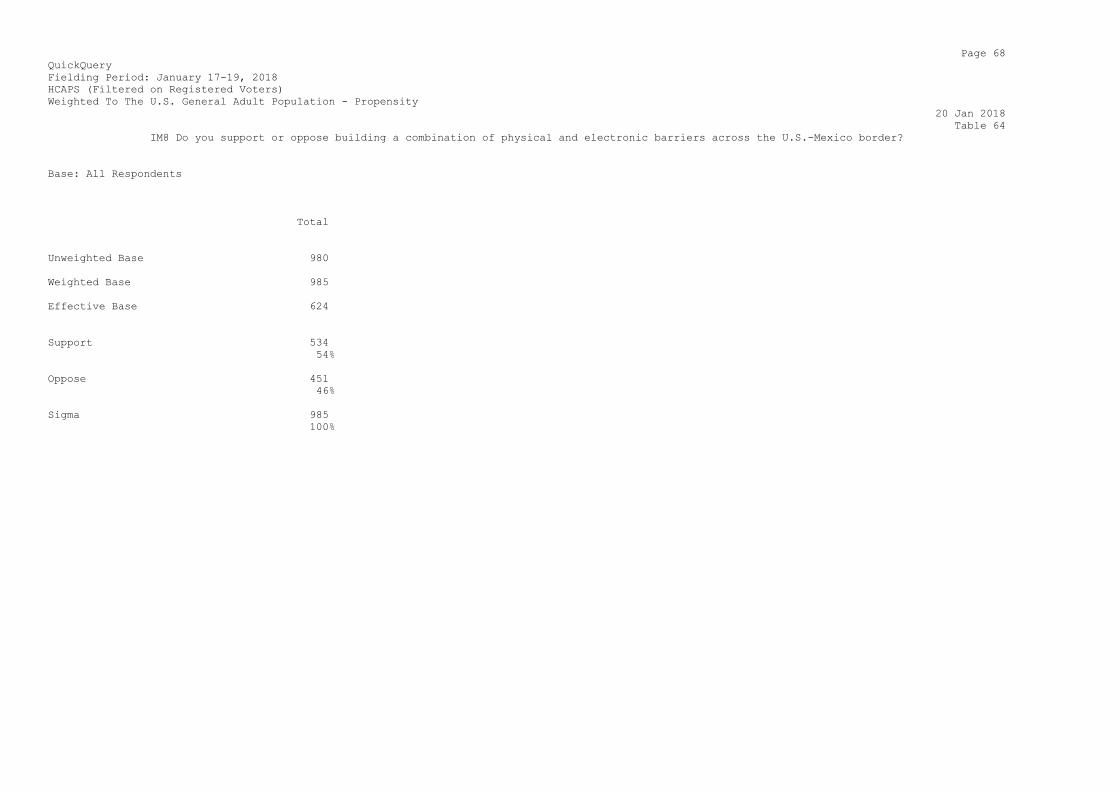
IM8 Do you support or oppose building a combination of physical and electronic barriers across the U.S.-Mexico border?
Base: All Respondents
Total
Unweighted Base 980
Weighted Base 985
Effective Base 624
Support 534
54%
Oppose 451
46%
Sigma 985
100%
Page 69
QuickQuery
Fielding Period: January 17-19, 2018
HCAPS (Filtered on Registered Voters)
Weighted To The U.S. General Adult Population - Propensity
20 Jan 2018
Table 65
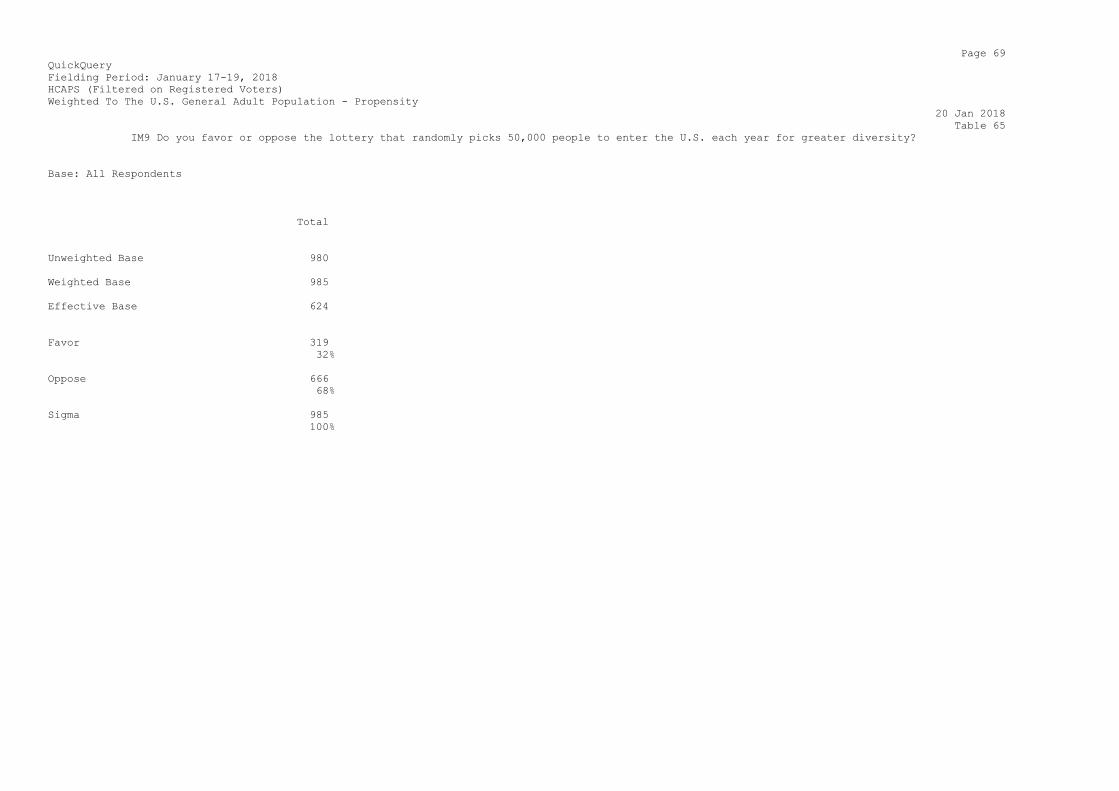
IM9 Do you favor or oppose the lottery that randomly picks 50,000 people to enter the U.S. each year for greater diversity?
Base: All Respondents
Total
Unweighted Base 980
Weighted Base 985
Effective Base 624
Favor 319
32%
Oppose 666
68%
Sigma 985
100%
Page 70
QuickQuery
Fielding Period: January 17-19, 2018
HCAPS (Filtered on Registered Voters)
Weighted To The U.S. General Adult Population - Propensity
20 Jan 2018
Table 66
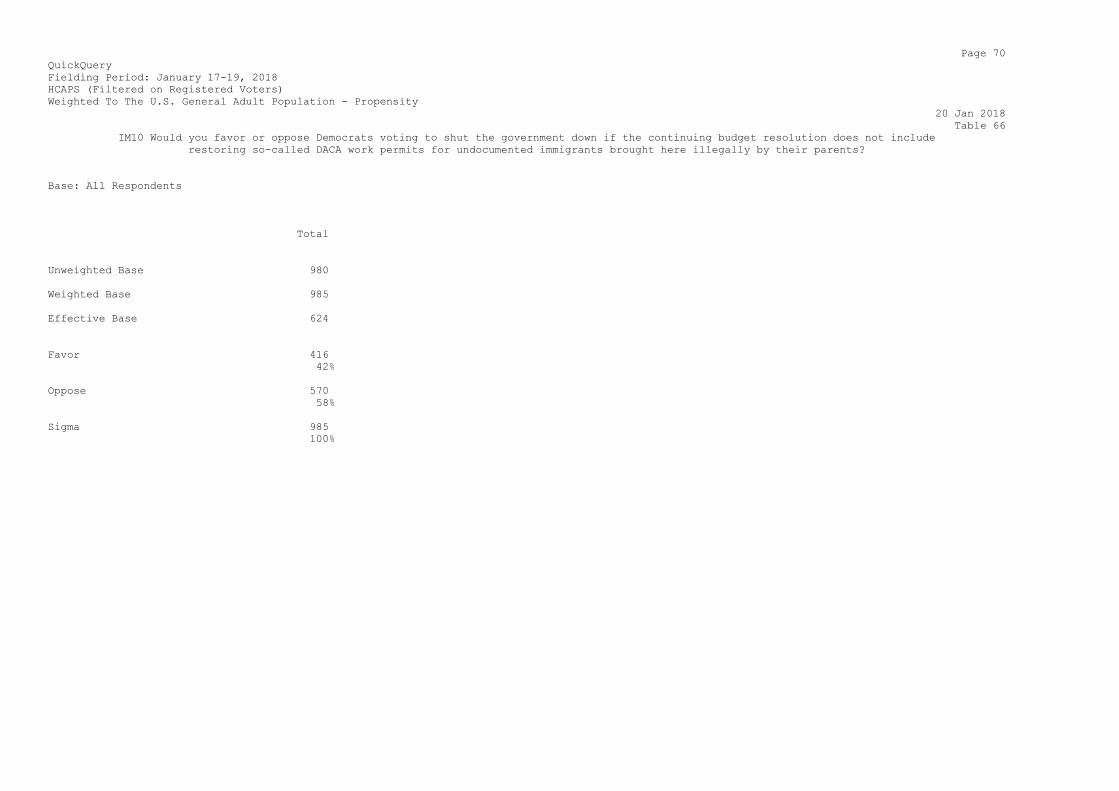
IM10 Would you favor or oppose Democrats voting to shut the government down if the continuing budget resolution does not include
restoring so-called DACA work permits for undocumented immigrants brought here illegally by their parents?
Base: All Respondents
Total
Unweighted Base 980
Weighted Base 985
Effective Base 624
Favor 416
42%
Oppose 570
58%
Sigma 985
100%
Page 71
QuickQuery
Fielding Period: January 17-19, 2018
HCAPS (Filtered on Registered Voters)
Weighted To The U.S. General Adult Population - Propensity
20 Jan 2018
Table 67
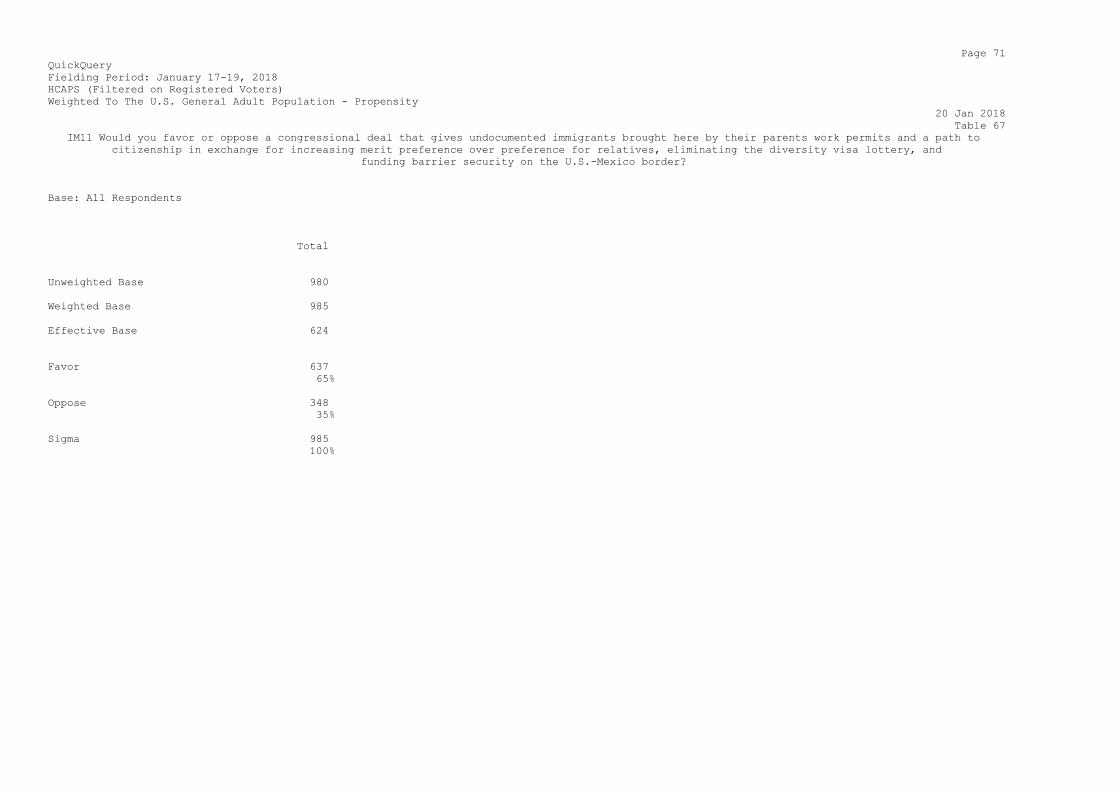
IM11 Would you favor or oppose a congressional deal that gives undocumented immigrants brought here by their parents work permits and a path to
citizenship in exchange for increasing merit preference over preference for relatives, eliminating the diversity visa lottery, and
funding barrier security on the U.S.-Mexico border?
Base: All Respondents
Total
Unweighted Base 980
Weighted Base 985
Effective Base 624
Favor 637
65%
Oppose 348
35%
Sigma 985
100%
Page 73
QuickQuery
Fielding Period: January 17-19, 2018
HCAPS (Filtered on Registered Voters)
Weighted To The U.S. General Adult Population - Propensity
20 Jan 2018
Table 69
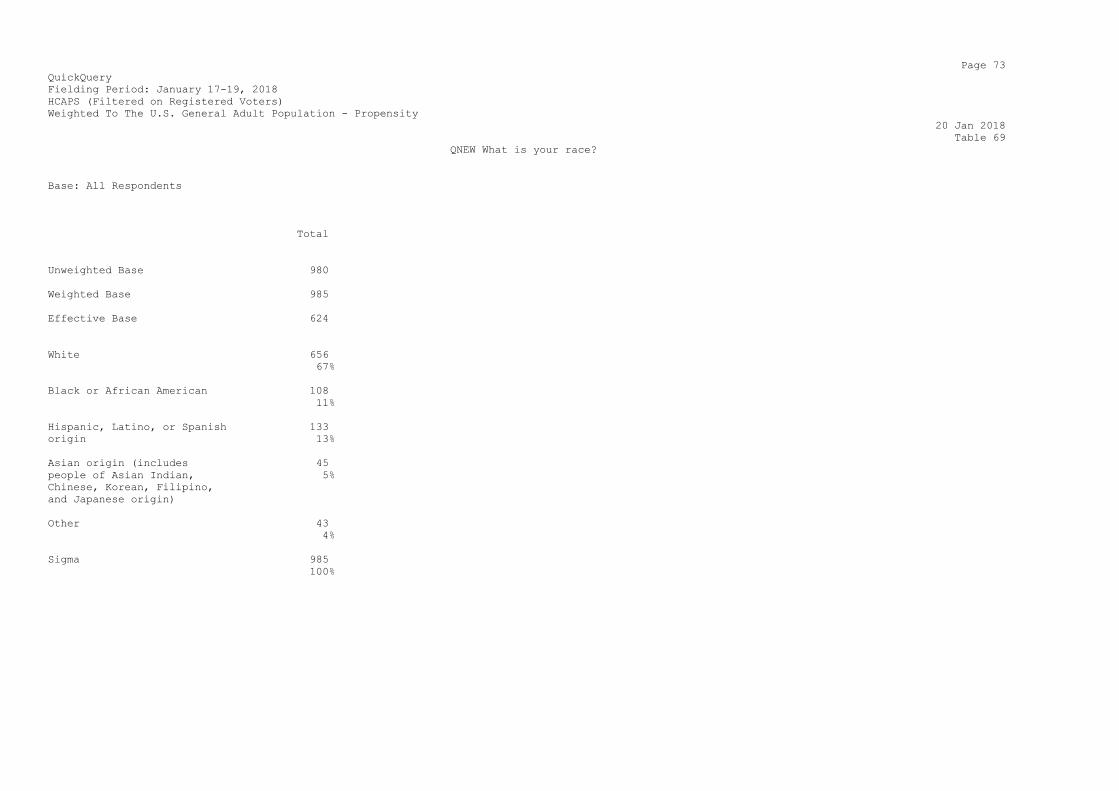
QNEW What is your race?
Base: All Respondents
Total
Unweighted Base 980
Weighted Base 985
Effective Base 624
White 656
67%
Black or African American 108
11%
Hispanic, Latino, or Spanish 133
origin 13%
Asian origin (includes 45
people of Asian Indian, 5%
Chinese, Korean, Filipino,
and Japanese origin)
Other 43
4%
Sigma 985
100%
Page 74
QuickQuery
Fielding Period: January 17-19, 2018
HCAPS (Filtered on Registered Voters)
Weighted To The U.S. General Adult Population - Propensity
20 Jan 2018
Table 70
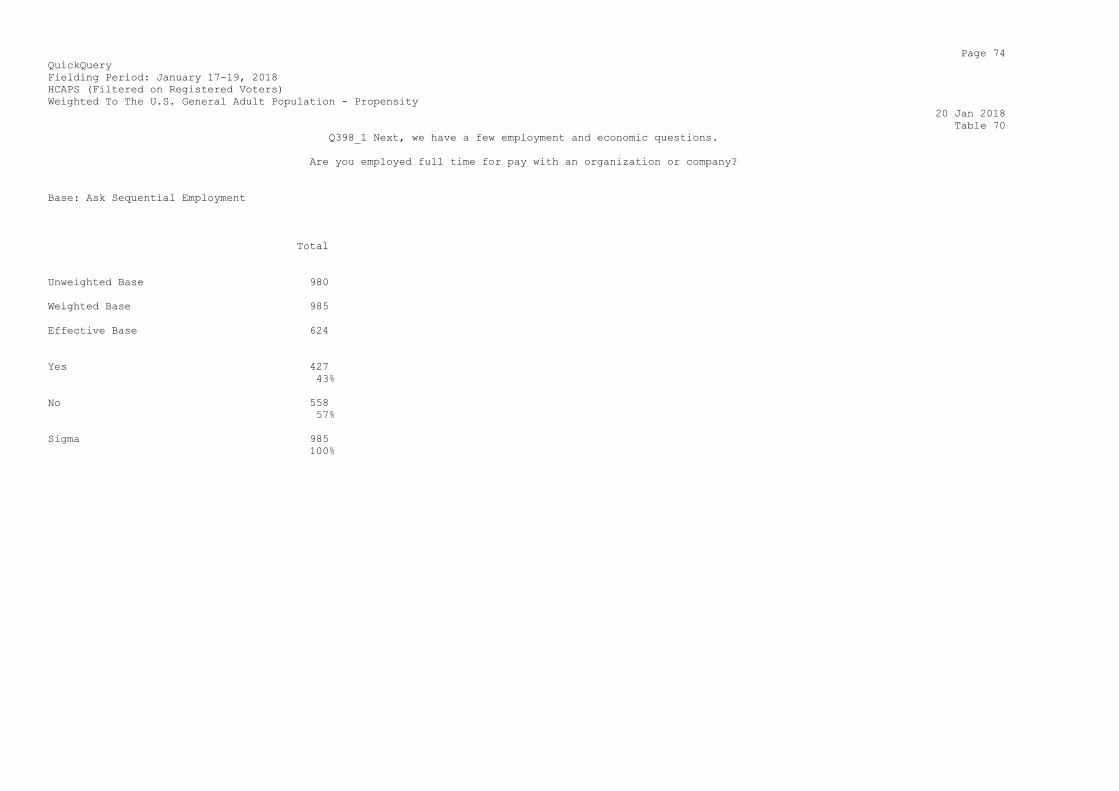
Q398_1 Next, we have a few employment and economic questions.
Are you employed full time for pay with an organization or company?
Base: Ask Sequential Employment
Total
Unweighted Base 980
Weighted Base 985
Effective Base 624
Yes 427
43%
No 558
57%
Sigma 985
100%

Page 75
QuickQuery
Fielding Period: January 17-19, 2018
HCAPS (Filtered on Registered Voters)
Weighted To The U.S. General Adult Population - Propensity
20 Jan 2018
Table 71
Q398_2 Next, we have a few employment and economic questions.
Are you employed part time for pay with an organization or company?
Base: Ask Sequential Employment
Total
Unweighted Base 980
Weighted Base 985
Effective Base 624
Yes 178
18%
No 807
82%
Sigma 985
100%
Page 76
QuickQuery
Fielding Period: January 17-19, 2018
HCAPS (Filtered on Registered Voters)
Weighted To The U.S. General Adult Population - Propensity
20 Jan 2018
Table 72
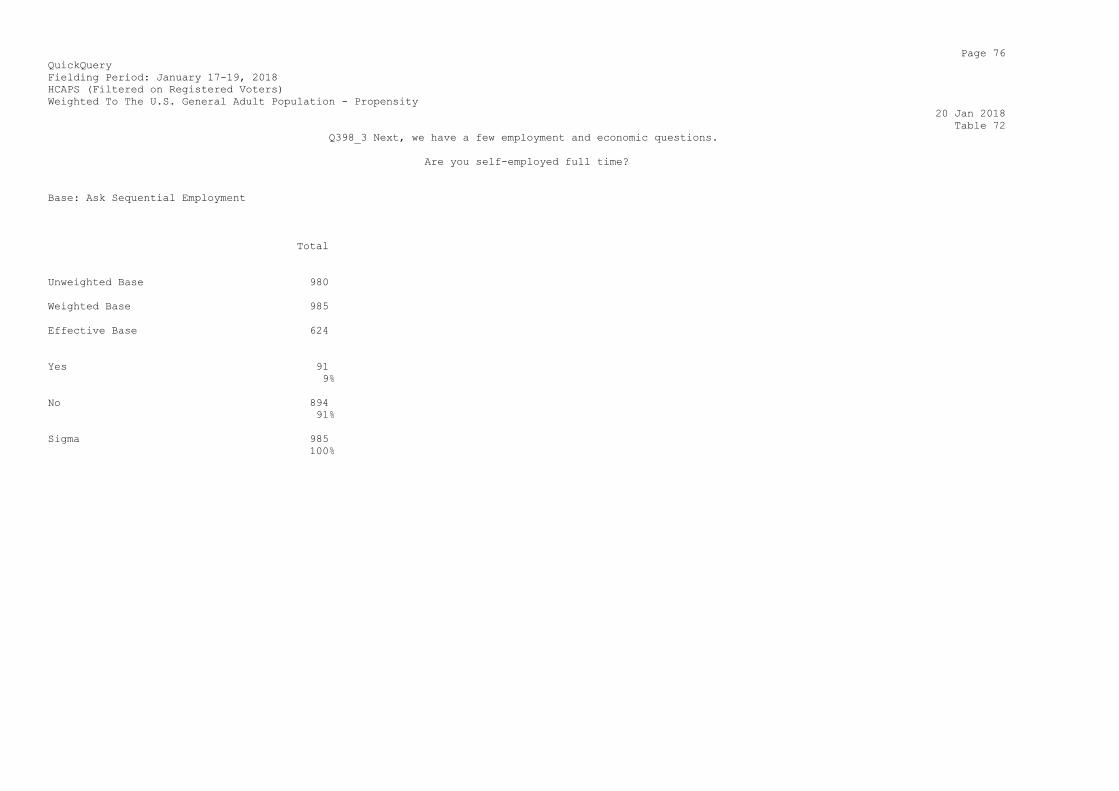
Q398_3 Next, we have a few employment and economic questions.
Are you self-employed full time?
Base: Ask Sequential Employment
Total
Unweighted Base 980
Weighted Base 985
Effective Base 624
Yes 91
9%
No 894
91%
Sigma 985
100%
Page 77
QuickQuery
Fielding Period: January 17-19, 2018
HCAPS (Filtered on Registered Voters)
Weighted To The U.S. General Adult Population - Propensity
20 Jan 2018
Table 73
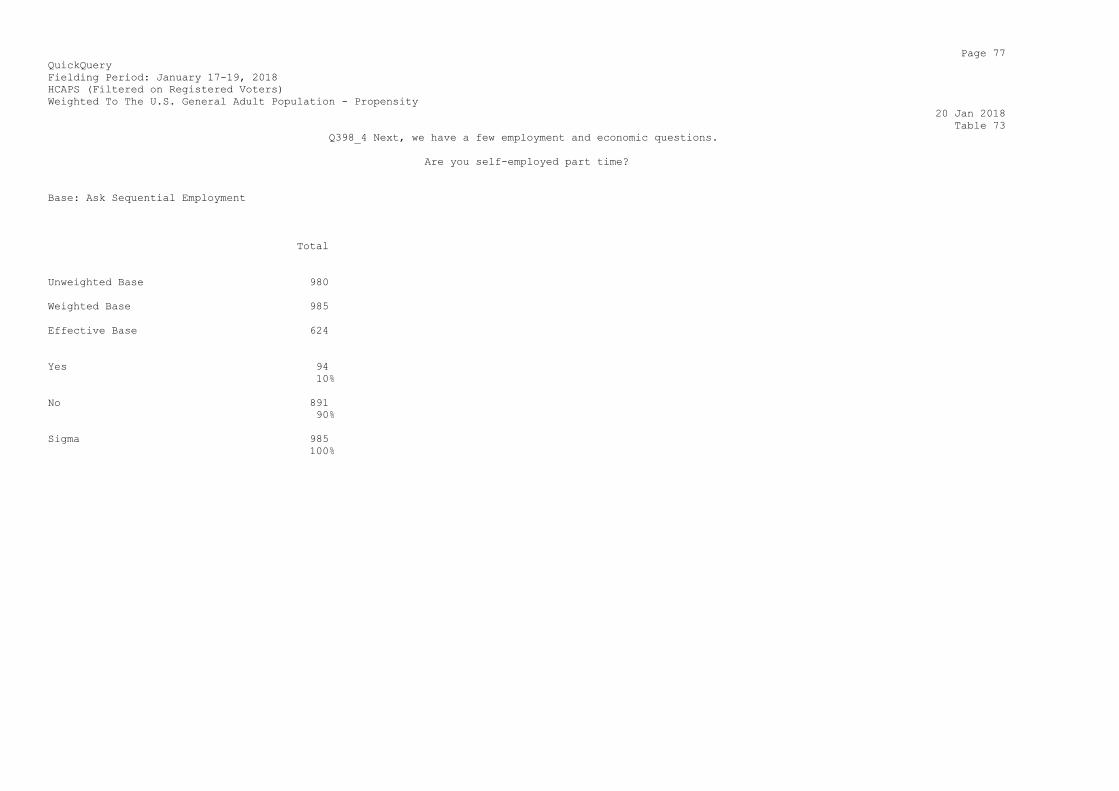
Q398_4 Next, we have a few employment and economic questions.
Are you self-employed part time?
Base: Ask Sequential Employment
Total
Unweighted Base 980
Weighted Base 985
Effective Base 624
Yes 94
10%
No 891
90%
Sigma 985
100%
Page 78
QuickQuery
Fielding Period: January 17-19, 2018
HCAPS (Filtered on Registered Voters)
Weighted To The U.S. General Adult Population - Propensity
20 Jan 2018
Table 74
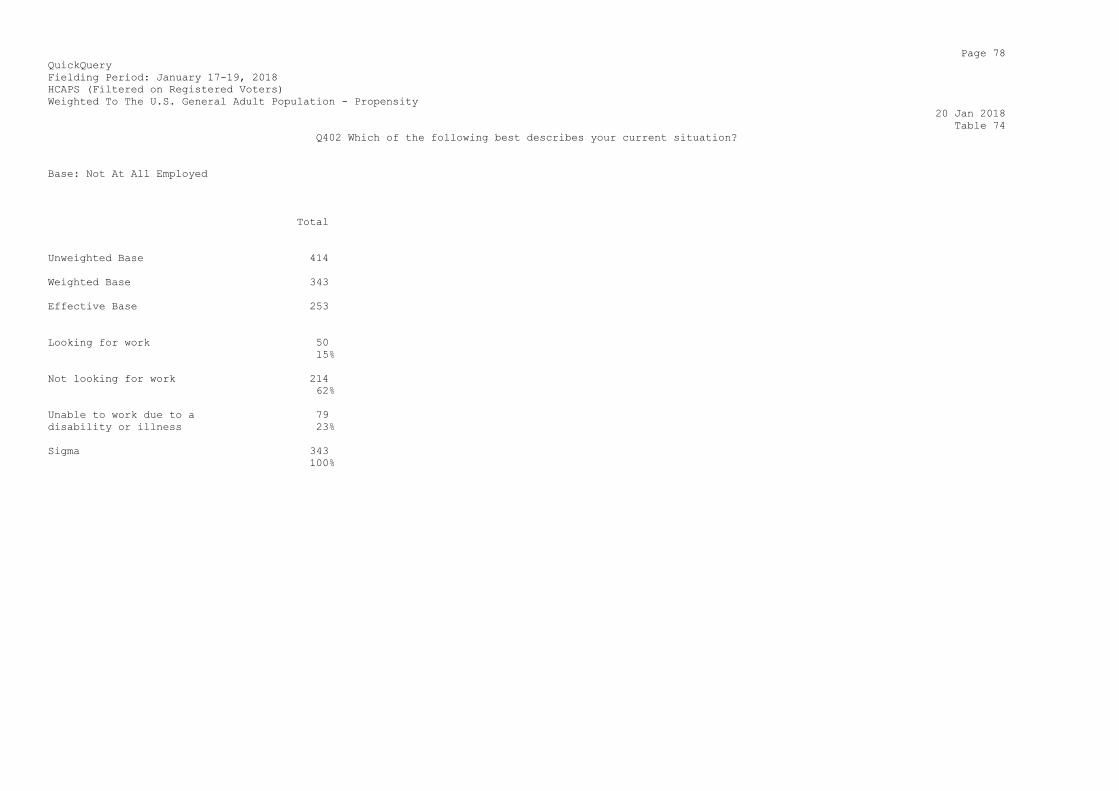
Q402 Which of the following best describes your current situation?
Base: Not At All Employed
Total
Unweighted Base 414
Weighted Base 343
Effective Base 253
Looking for work 50
15%
Not looking for work 214
62%
Unable to work due to a 79
disability or illness 23%
Sigma 343
100%
Page 79
QuickQuery
Fielding Period: January 17-19, 2018
HCAPS (Filtered on Registered Voters)
Weighted To The U.S. General Adult Population - Propensity
20 Jan 2018
Table 75
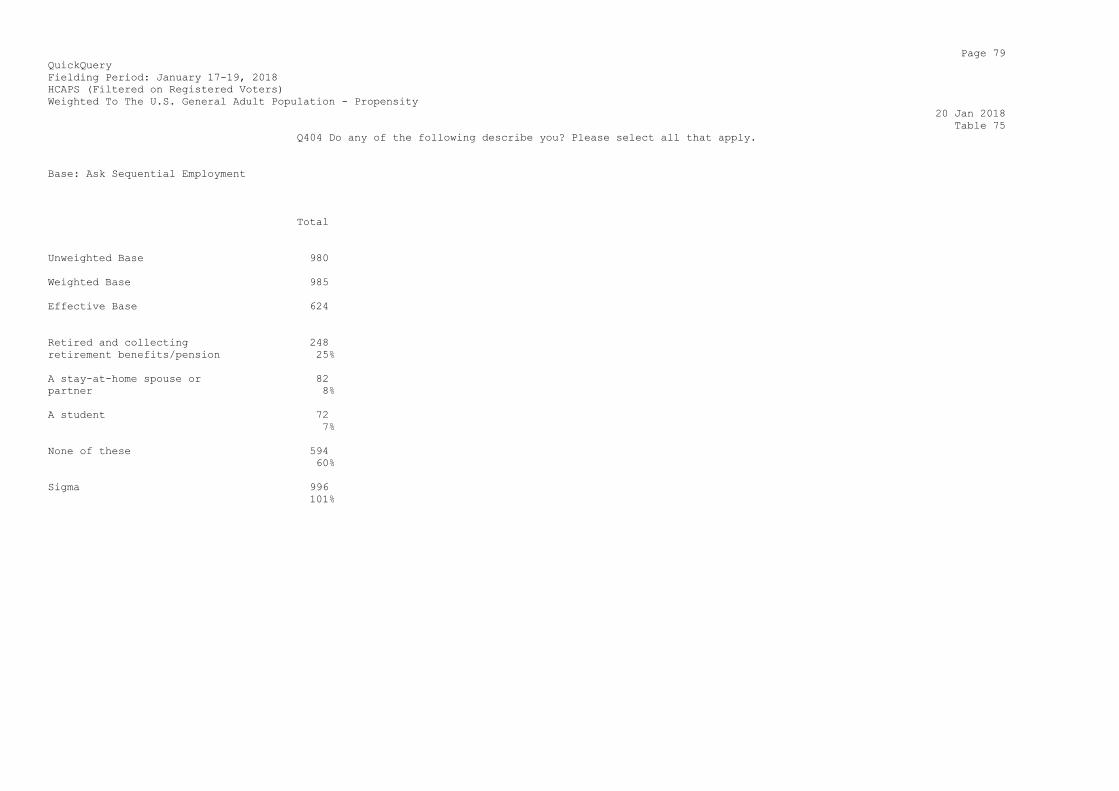
Q404 Do any of the following describe you? Please select all that apply.
Base: Ask Sequential Employment
Total
Unweighted Base 980
Weighted Base 985
Effective Base 624
Retired and collecting 248
retirement benefits/pension 25%
A stay-at-home spouse or 82
partner 8%
A student 72
7%
None of these 594
60%
Sigma 996
101%

Page 80
QuickQuery
Fielding Period: January 17-19, 2018
HCAPS (Filtered on Registered Voters)
Weighted To The U.S. General Adult Population - Propensity
20 Jan 2018
Table 76
Q406 What is your employment status?
Base: All Respondents
Total
Unweighted Base 980
Weighted Base 985
Effective Base 624
Employed full time 483
49%
Employed part time 251
26%
Self-employed full time 91
9%
Not employed, but looking 50
for work 5%
Not employed and not looking 214
for work 22%
Not employed, unable to work 79
due to a disability or 8%
illness
Retired 248
25%
Student 72
7%
Stay-at-home spouse or 82
partner 8%
Self-employed part time 94
10%
Sigma 1665
169%

Page 81
QuickQuery
Fielding Period: January 17-19, 2018
HCAPS (Filtered on Registered Voters)
Weighted To The U.S. General Adult Population - Propensity
20 Jan 2018
Table 77
Q410 Which one of the following best describes your employment status?
Base: 18 Years Old Or Older And (Single Employment Item Selected And More Than 1 Valid Code From Q406)
Total
Unweighted Base 980
Weighted Base 985
Effective Base 624
Employed full time 388
39%
Employed part time 113
11%
Self-employed full time 61
6%
Not employed, but looking 45
for work 5%
Not employed and not looking 10
for work 1%
Not employed, unable to work 50
due to a disability or 5%
illness
Retired 187
19%
Student 43
4%
Stay-at-home spouse or 45
partner 5%
Self-employed part time 42
4%
Sigma 985
100%
Page 82
QuickQuery
Fielding Period: January 17-19, 2018
HCAPS (Filtered on Registered Voters)
Weighted To The U.S. General Adult Population - Propensity
20 Jan 2018
Table 78
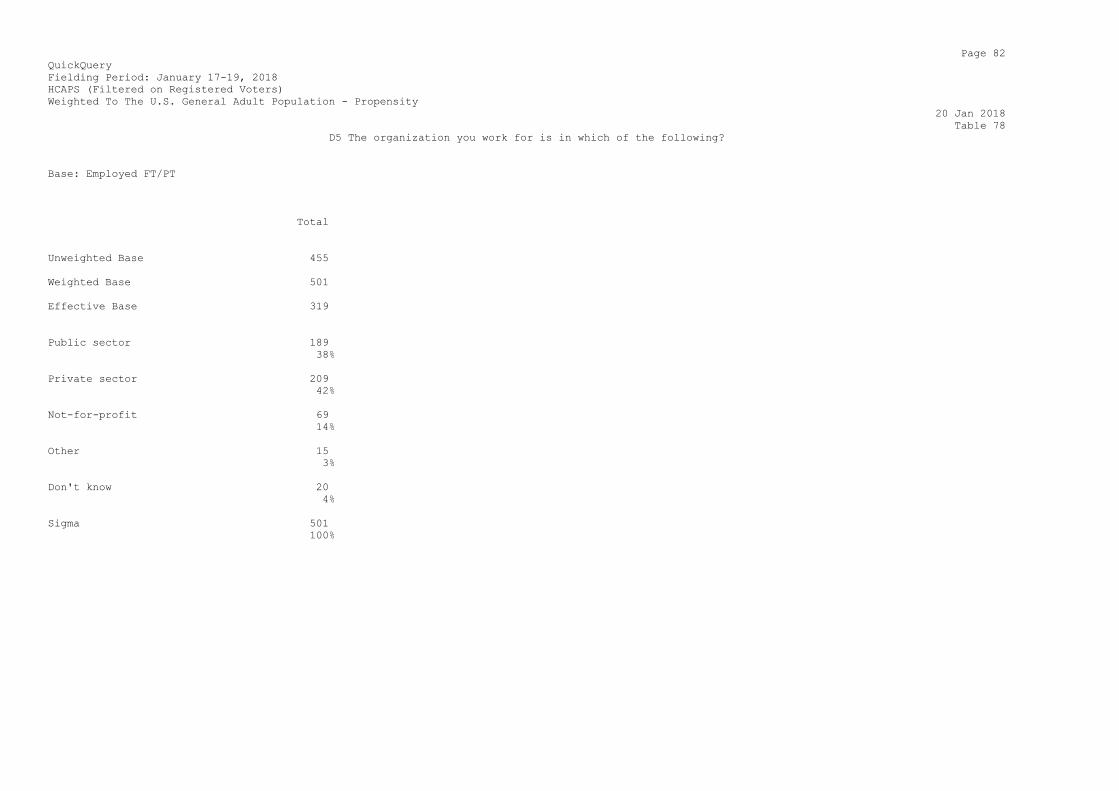
D5 The organization you work for is in which of the following?
Base: Employed FT/PT
Total
Unweighted Base 455
Weighted Base 501
Effective Base 319
Public sector 189
38%
Private sector 209
42%
Not-for-profit 69
14%
Other 15
3%
Don't know 20
4%
Sigma 501
100%
Page 83
QuickQuery
Fielding Period: January 17-19, 2018
HCAPS (Filtered on Registered Voters)
Weighted To The U.S. General Adult Population - Propensity
20 Jan 2018
Table 79
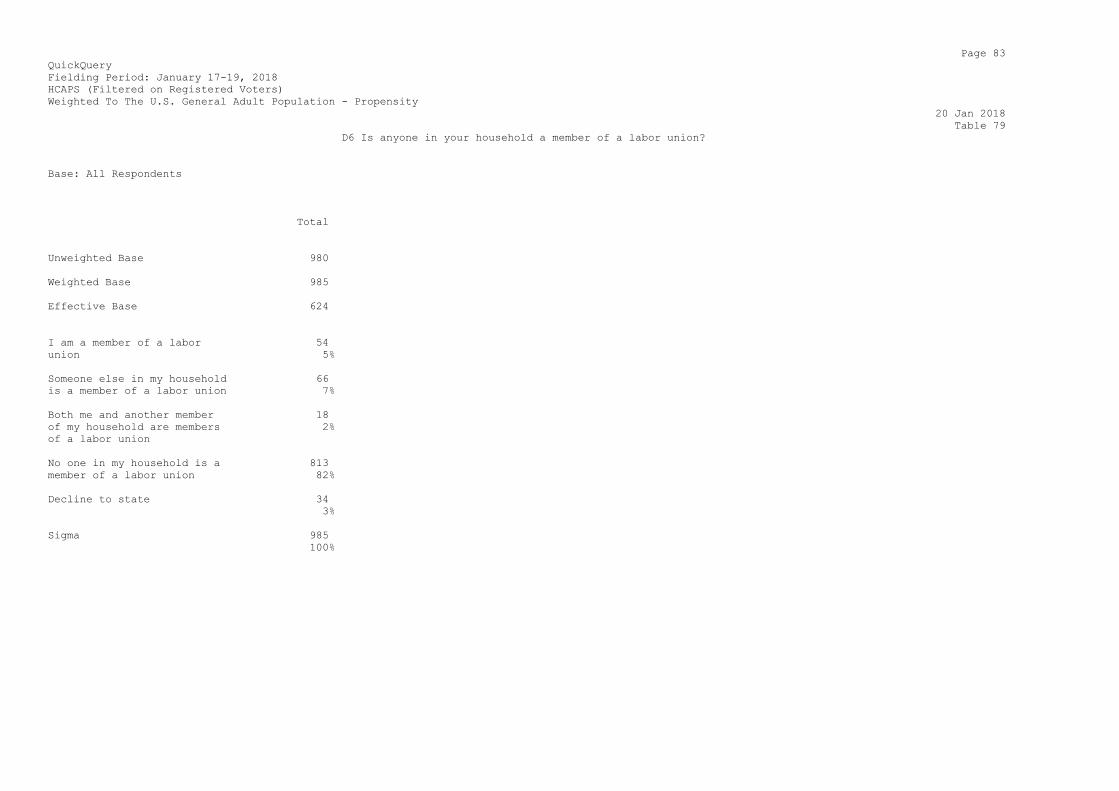
D6 Is anyone in your household a member of a labor union?
Base: All Respondents
Total
Unweighted Base 980
Weighted Base 985
Effective Base 624
I am a member of a labor 54
union 5%
Someone else in my household 66
is a member of a labor union 7%
Both me and another member 18
of my household are members 2%
of a labor union
No one in my household is a 813
member of a labor union 82%
Decline to state 34
3%
Sigma 985
100%
Page 84
QuickQuery
Fielding Period: January 17-19, 2018
HCAPS (Filtered on Registered Voters)
Weighted To The U.S. General Adult Population - Propensity
20 Jan 2018
Table 80
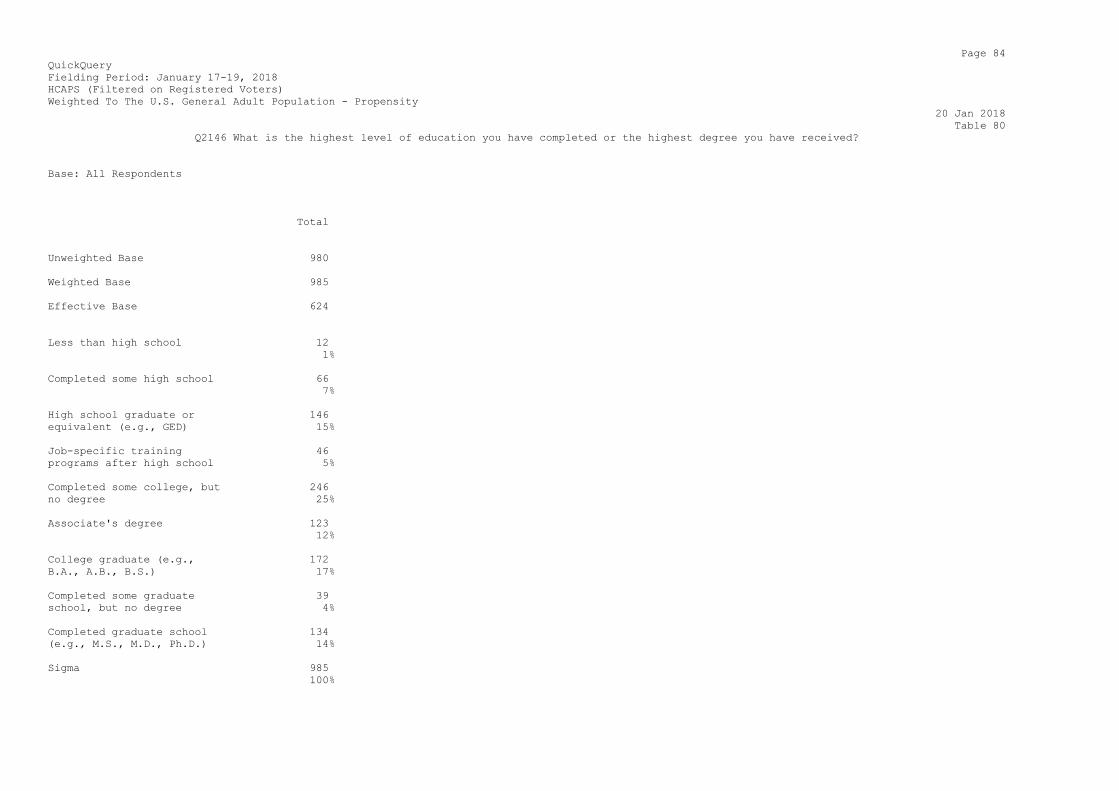
Q2146 What is the highest level of education you have completed or the highest degree you have received?
Base: All Respondents
Total
Unweighted Base 980
Weighted Base 985
Effective Base 624
Less than high school 12
1%
Completed some high school 66
7%
High school graduate or 146
equivalent (e.g., GED) 15%
Job-specific training 46
programs after high school 5%
Completed some college, but 246
no degree 25%
Associate's degree 123
12%
College graduate (e.g., 172
B.A., A.B., B.S.) 17%
Completed some graduate 39
school, but no degree 4%
Completed graduate school 134
(e.g., M.S., M.D., Ph.D.) 14%
Sigma 985
100%
Page 85
QuickQuery
Fielding Period: January 17-19, 2018
HCAPS (Filtered on Registered Voters)
Weighted To The U.S. General Adult Population - Propensity
20 Jan 2018
Table 81
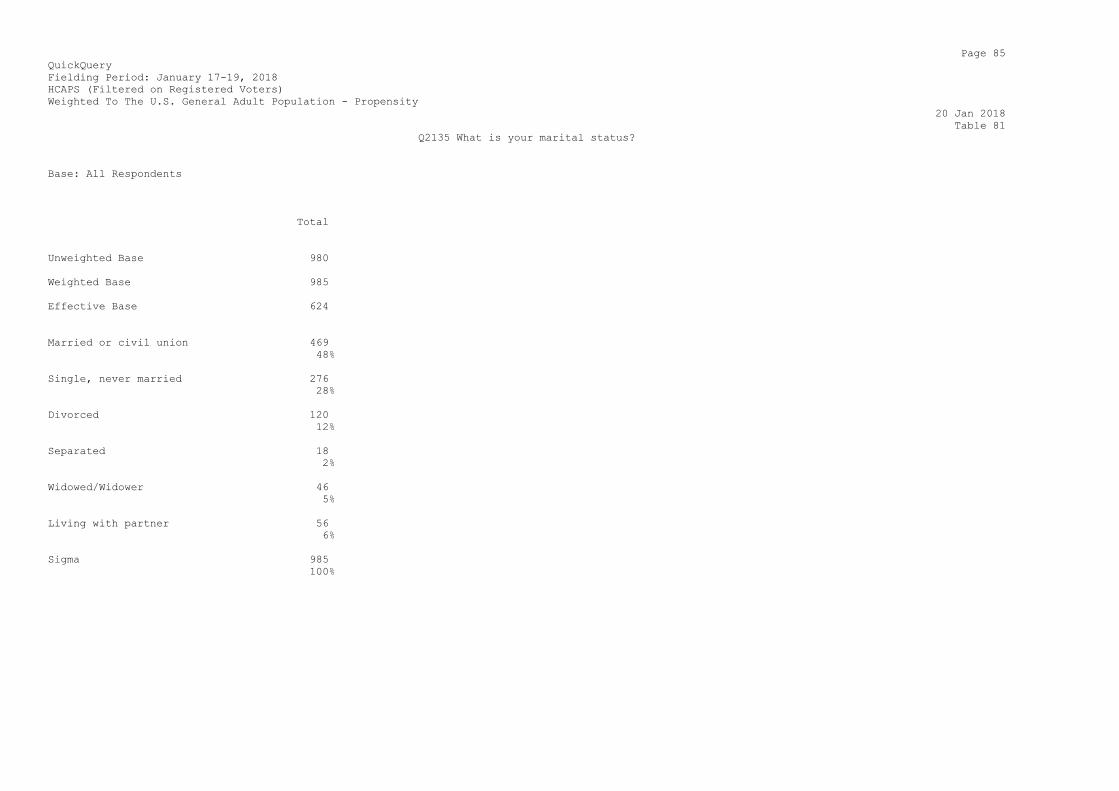
Q2135 What is your marital status?
Base: All Respondents
Total
Unweighted Base 980
Weighted Base 985
Effective Base 624
Married or civil union 469
48%
Single, never married 276
28%
Divorced 120
12%
Separated 18
2%
Widowed/Widower 46
5%
Living with partner 56
6%
Sigma 985
100%
Page 86
QuickQuery
Fielding Period: January 17-19, 2018
HCAPS (Filtered on Registered Voters)
Weighted To The U.S. General Adult Population - Propensity
20 Jan 2018
Table 82
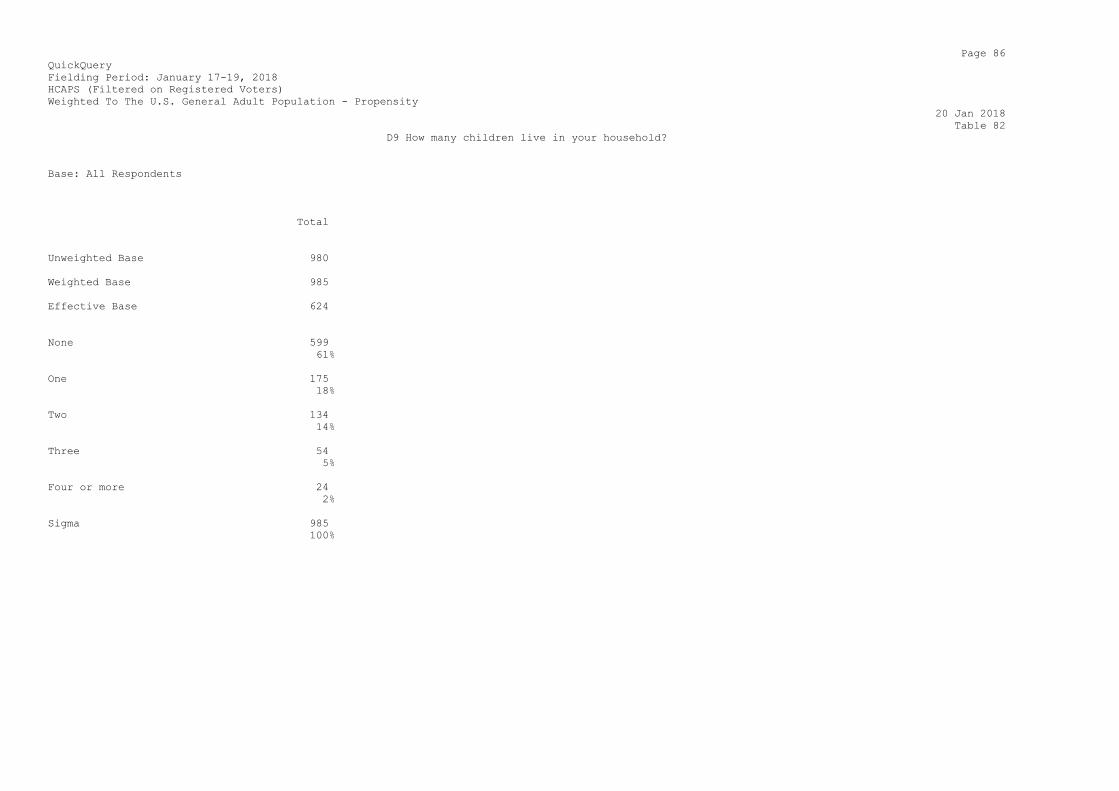
D9 How many children live in your household?
Base: All Respondents
Total
Unweighted Base 980
Weighted Base 985
Effective Base 624
None 599
61%
One 175
18%
Two 134
14%
Three 54
5%
Four or more 24
2%
Sigma 985
100%
Page 87
QuickQuery
Fielding Period: January 17-19, 2018
HCAPS (Filtered on Registered Voters)
Weighted To The U.S. General Adult Population - Propensity
20 Jan 2018
Table 83
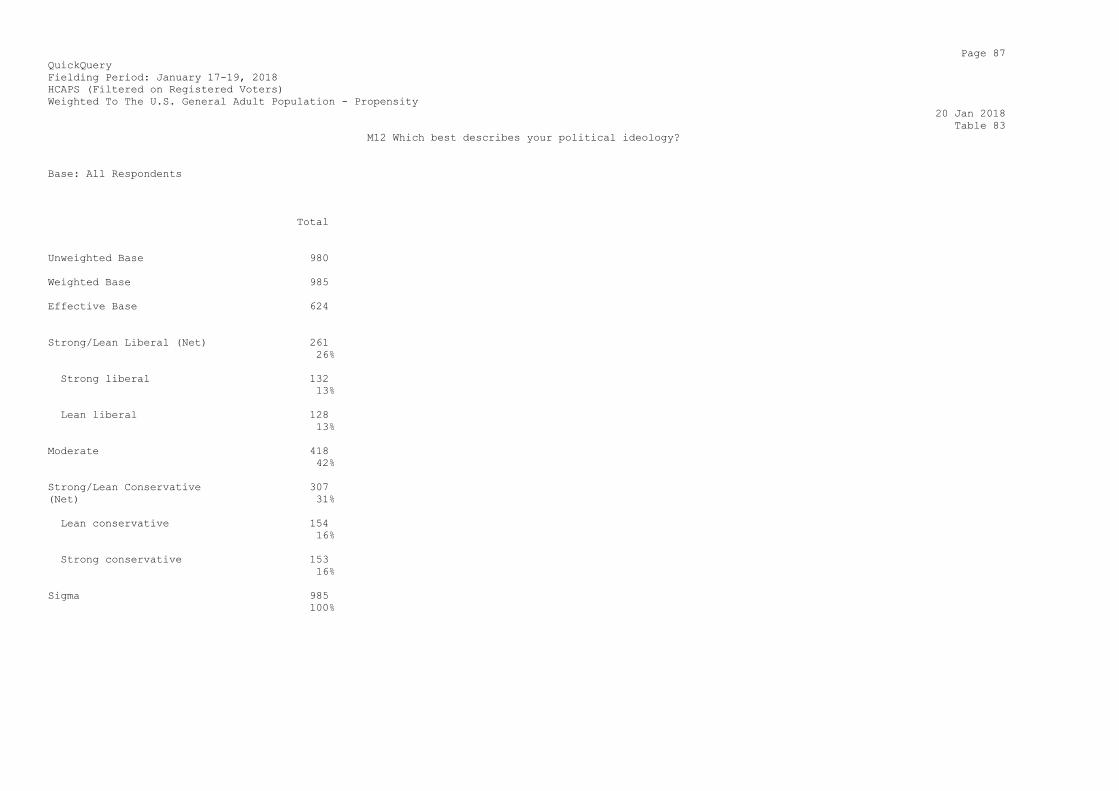
M12 Which best describes your political ideology?
Base: All Respondents
Total
Unweighted Base 980
Weighted Base 985
Effective Base 624
Strong/Lean Liberal (Net) 261
26%
Strong liberal 132
13%
Lean liberal 128
13%
Moderate 418
42%
Strong/Lean Conservative 307
(Net) 31%
Lean conservative 154
16%
Strong conservative 153
16%
Sigma 985
100%

Page 88
QuickQuery
Fielding Period: January 17-19, 2018
HCAPS (Filtered on Registered Voters)
Weighted To The U.S. General Adult Population - Propensity
20 Jan 2018
Table 84
M13 Do you think of yourself as fiscally liberal or conservative?
Base: All Respondents
Total
Unweighted Base 980
Weighted Base 985
Effective Base 624
Fiscally conservative 481
49%
Fiscally liberal 188
19%
Do not lean one way or the 316
other 32%
Sigma 985
100%
Page 89
QuickQuery
Fielding Period: January 17-19, 2018
HCAPS (Filtered on Registered Voters)
Weighted To The U.S. General Adult Population - Propensity
20 Jan 2018
Table 85
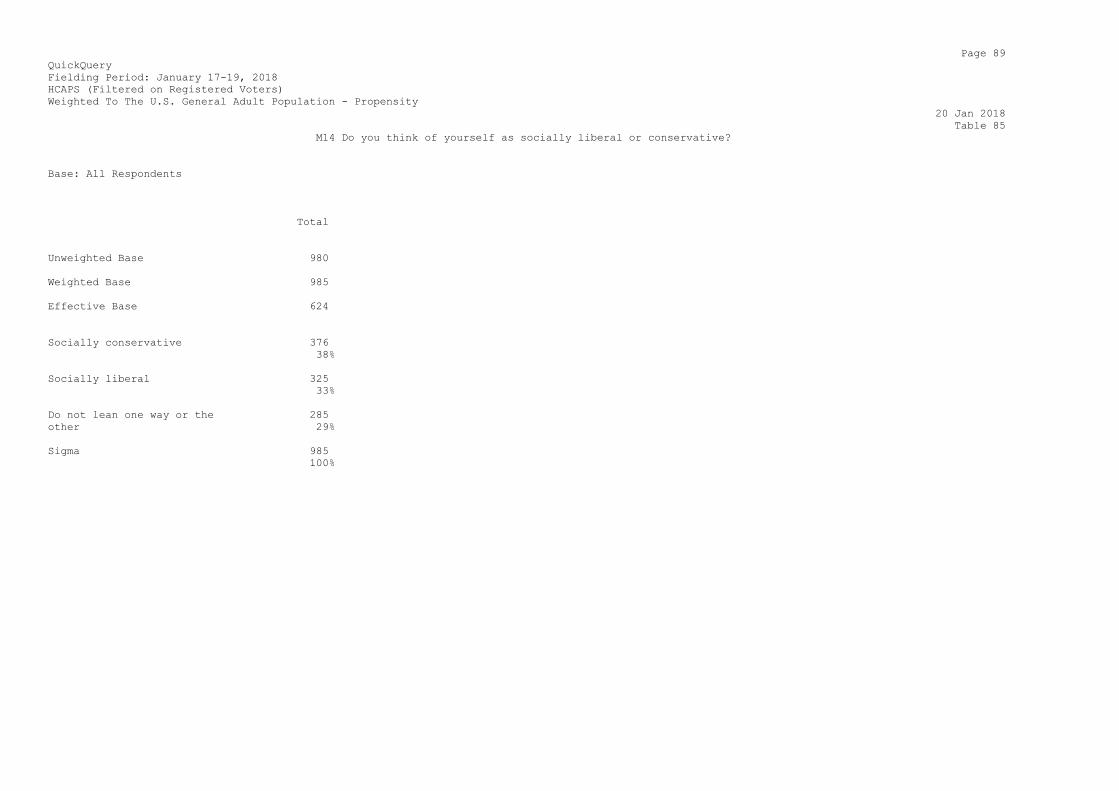
M14 Do you think of yourself as socially liberal or conservative?
Base: All Respondents
Total
Unweighted Base 980
Weighted Base 985
Effective Base 624
Socially conservative 376
38%
Socially liberal 325
33%
Do not lean one way or the 285
other 29%
Sigma 985
100%
Page 90
QuickQuery
Fielding Period: January 17-19, 2018
HCAPS (Filtered on Registered Voters)
Weighted To The U.S. General Adult Population - Propensity
20 Jan 2018
Table 86
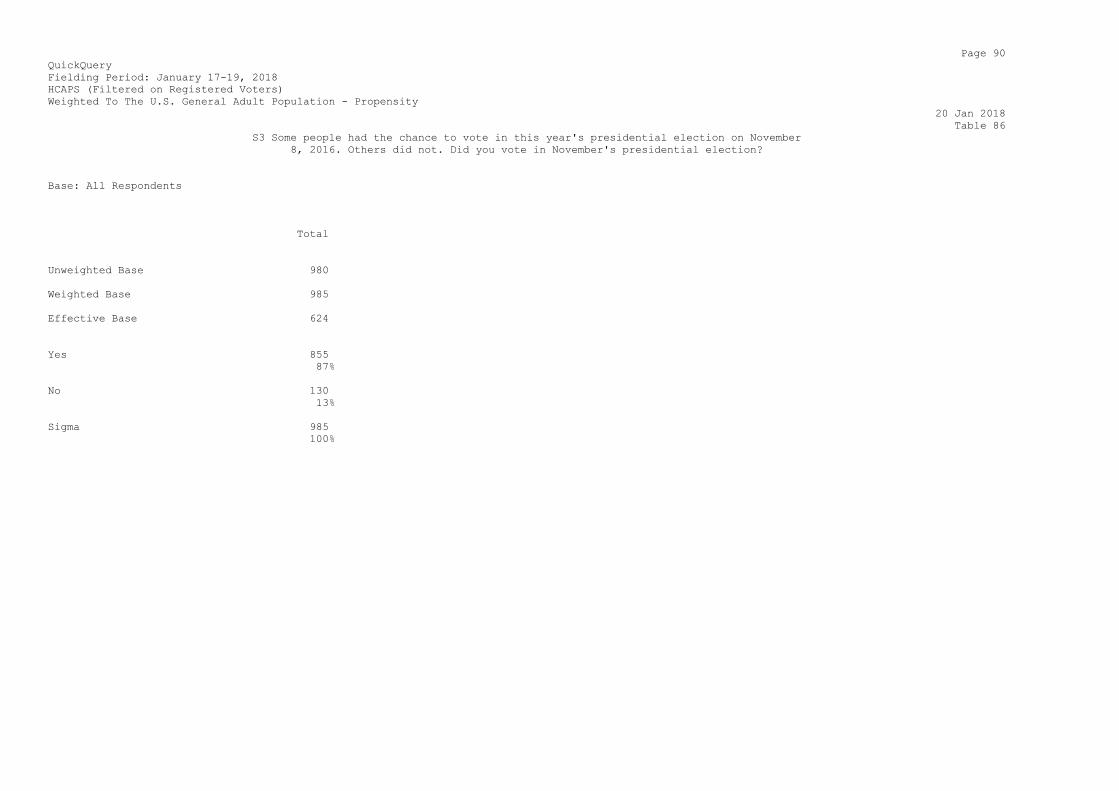
S3 Some people had the chance to vote in this year's presidential election on November
8, 2016. Others did not. Did you vote in November's presidential election?
Base: All Respondents
Total
Unweighted Base 980
Weighted Base 985
Effective Base 624
Yes 855
87%
No 130
13%
Sigma 985
100%
Page 91
QuickQuery
Fielding Period: January 17-19, 2018
HCAPS (Filtered on Registered Voters)
Weighted To The U.S. General Adult Population - Propensity
20 Jan 2018
Table 87
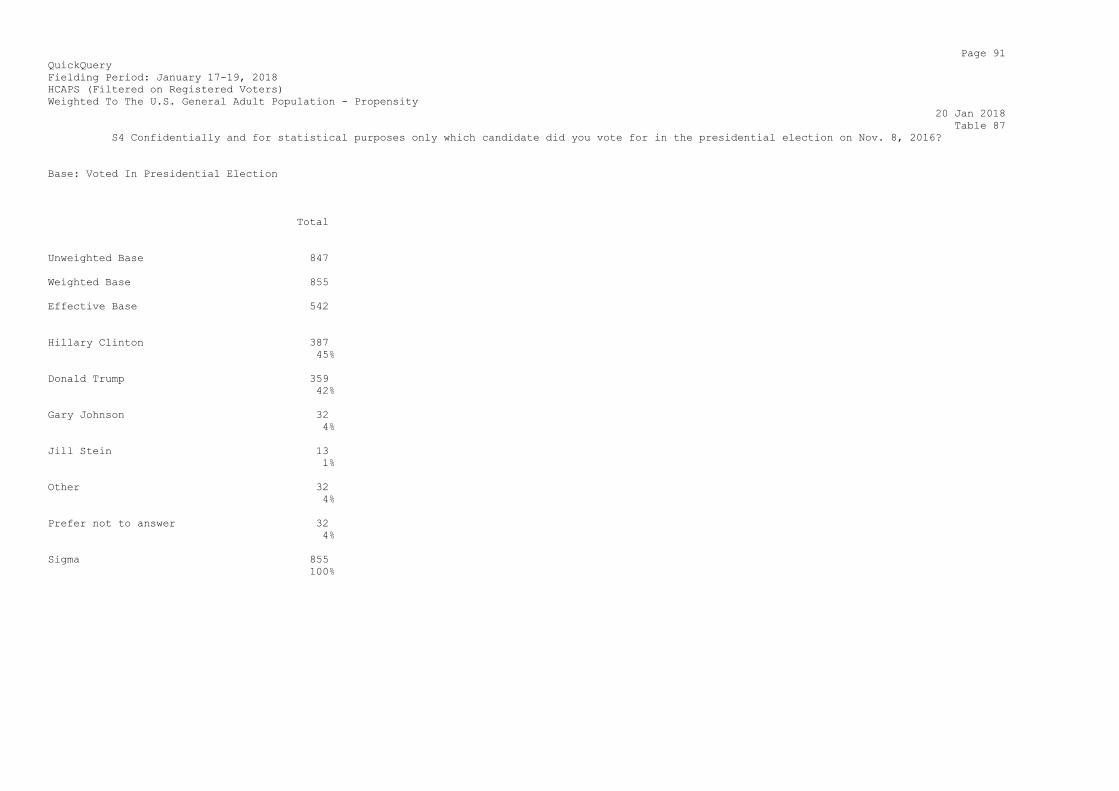
S4 Confidentially and for statistical purposes only which candidate did you vote for in the presidential election on Nov. 8, 2016?
Base: Voted In Presidential Election
Total
Unweighted Base 847
Weighted Base 855
Effective Base 542
Hillary Clinton 387
45%
Donald Trump 359
42%
Gary Johnson 32
4%
Jill Stein 13
1%
Other 32
4%
Prefer not to answer 32
4%
Sigma 855
100%

Page 92
QuickQuery
Fielding Period: January 17-19, 2018
HCAPS (Filtered on Registered Voters)
Weighted To The U.S. General Adult Population - Propensity
20 Jan 2018
Table 88
S4A In casting your vote, what was most important to you - the candidate's likeability or their stand on the issues?
Base: Voted In Presidential Election
Total
Unweighted Base 847
Weighted Base 855
Effective Base 542
Their stand on the issues 781
91%
Likeability 75
9%
Sigma 855
100%

Page 93
QuickQuery
Fielding Period: January 17-19, 2018
HCAPS (Filtered on Registered Voters)
Weighted To The U.S. General Adult Population - Propensity
20 Jan 2018
Table 89
D10 Are you registered to vote at your present address?
Base: All Respondents
Total
Unweighted Base 980
Weighted Base 985
Effective Base 624
Yes 869
88%
No 85
9%
Not Sure 31
3%
Sigma 985
100%
Page 94
QuickQuery
Fielding Period: January 17-19, 2018
HCAPS (Filtered on Registered Voters)
Weighted To The U.S. General Adult Population - Propensity
20 Jan 2018
Table 90
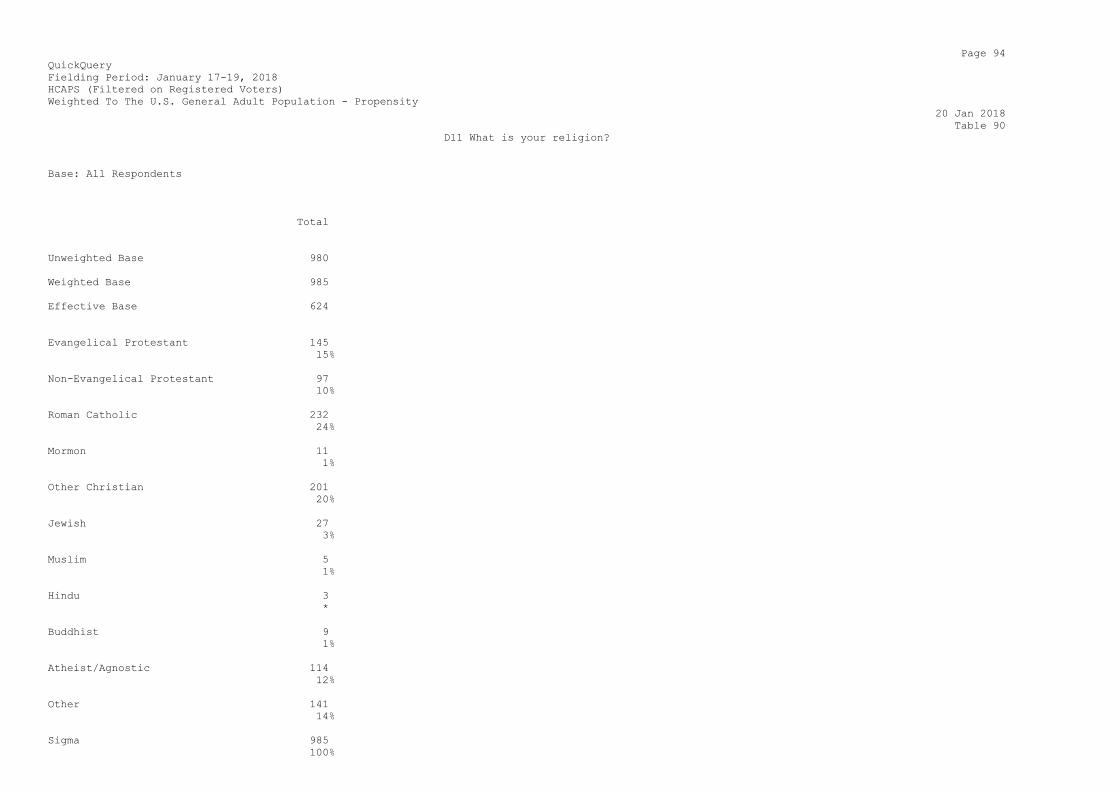
D11 What is your religion?
Base: All Respondents
Total
Unweighted Base 980
Weighted Base 985
Effective Base 624
Evangelical Protestant 145
15%
Non-Evangelical Protestant 97
10%
Roman Catholic 232
24%
Mormon 11
1%
Other Christian 201
20%
Jewish 27
3%
Muslim 5
1%
Hindu 3
*
Buddhist 9
1%
Atheist/Agnostic 114
12%
Other 141
14%
Sigma 985
100%

Page 95
QuickQuery
Fielding Period: January 17-19, 2018
HCAPS (Filtered on Registered Voters)
Weighted To The U.S. General Adult Population - Propensity
20 Jan 2018
Table 91
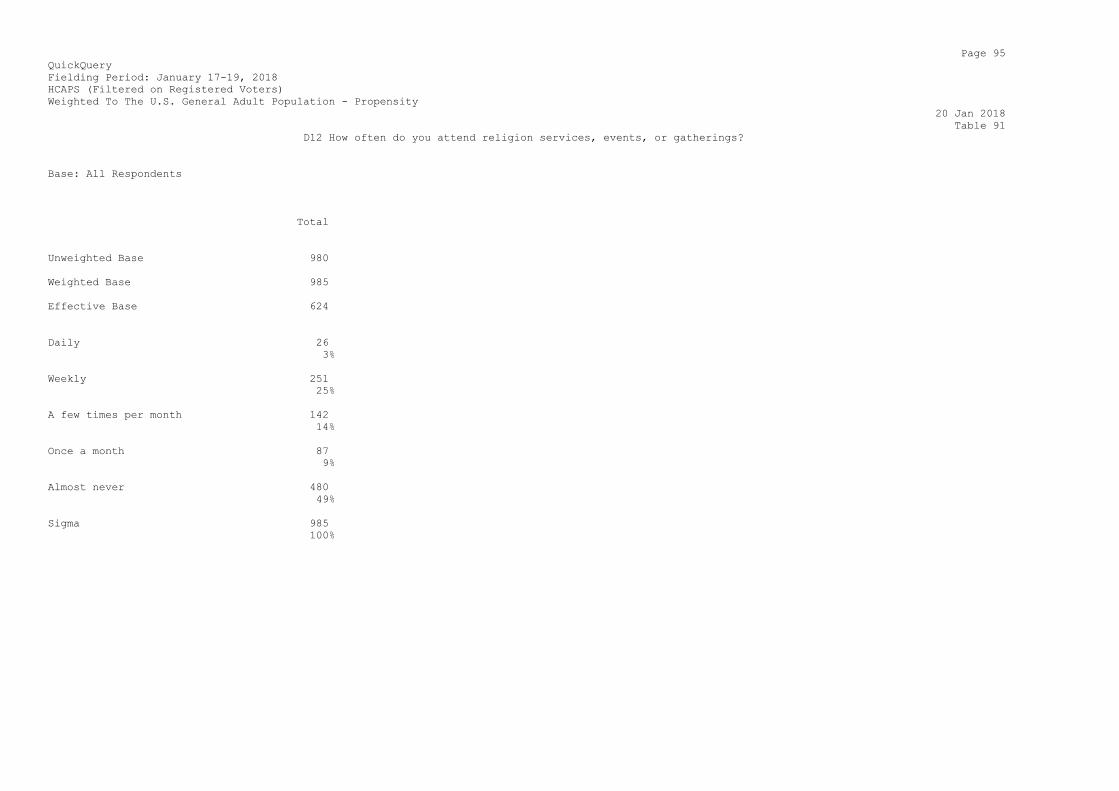
D12 How often do you attend religion services, events, or gatherings?
Base: All Respondents
Total
Unweighted Base 980
Weighted Base 985
Effective Base 624
Daily 26
3%
Weekly 251
25%
A few times per month 142
14%
Once a month 87
9%
Almost never 480
49%
Sigma 985
100%
Page 96
QuickQuery
Fielding Period: January 17-19, 2018
HCAPS (Filtered on Registered Voters)
Weighted To The U.S. General Adult Population - Propensity
20 Jan 2018
Table 92
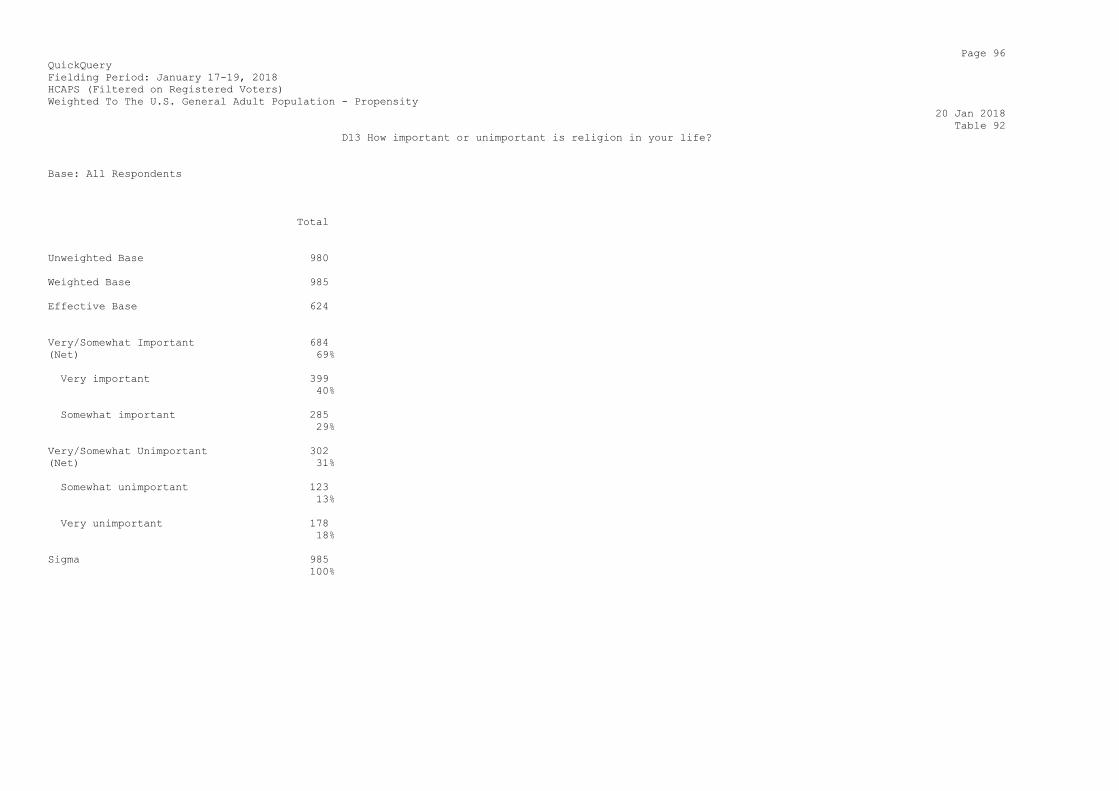
D13 How important or unimportant is religion in your life?
Base: All Respondents
Total
Unweighted Base 980
Weighted Base 985
Effective Base 624
Very/Somewhat Important 684
(Net) 69%
Very important 399
40%
Somewhat important 285
29%
Very/Somewhat Unimportant 302
(Net) 31%
Somewhat unimportant 123
13%
Very unimportant 178
18%
Sigma 985
100%

Page 97
QuickQuery
Fielding Period: January 17-19, 2018
HCAPS (Filtered on Registered Voters)
Weighted To The U.S. General Adult Population - Propensity
20 Jan 2018
Table 93
D14 Does anyone in your household own a gun?
Base: All Respondents
Total
Unweighted Base 980
Weighted Base 985
Effective Base 624
Yes 367
37%
No 618
63%
Sigma 985
100%
Page 98
QuickQuery
Fielding Period: January 17-19, 2018
HCAPS (Filtered on Registered Voters)
Weighted To The U.S. General Adult Population - Propensity
20 Jan 2018
Table 94
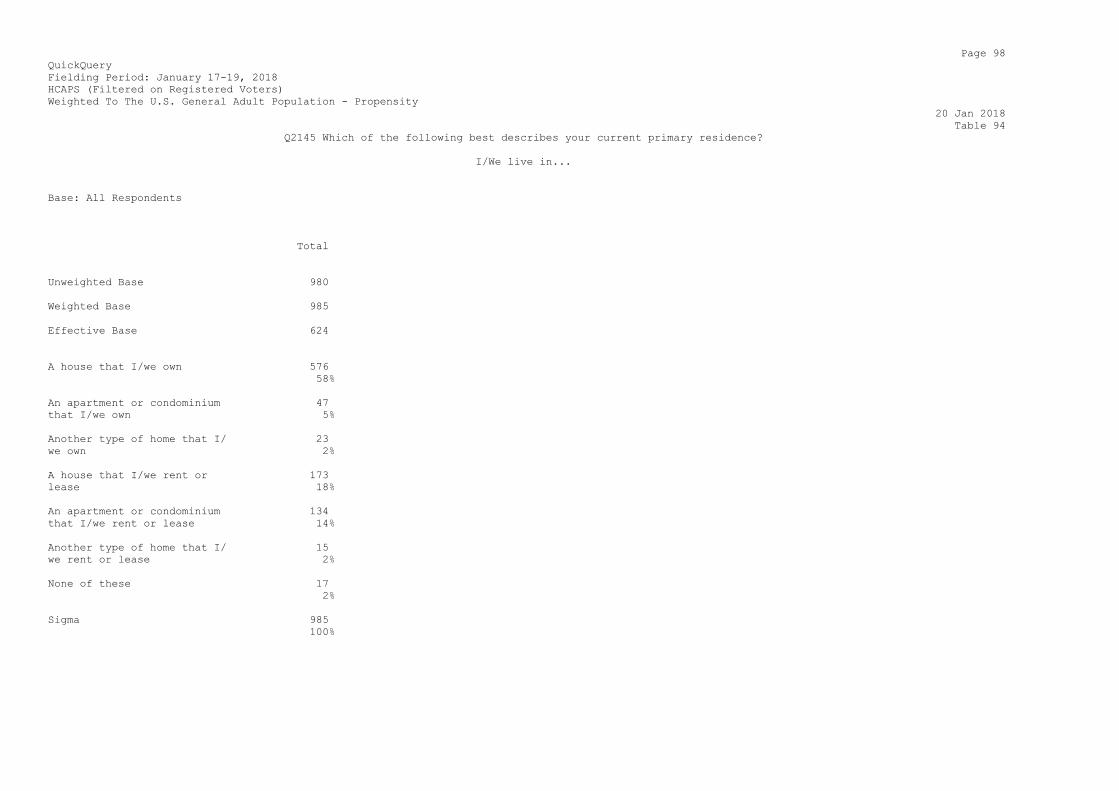
Q2145 Which of the following best describes your current primary residence?
I/We live in...
Base: All Respondents
Total
Unweighted Base 980
Weighted Base 985
Effective Base 624
A house that I/we own 576
58%
An apartment or condominium 47
that I/we own 5%
Another type of home that I/ 23
we own 2%
A house that I/we rent or 173
lease 18%
An apartment or condominium 134
that I/we rent or lease 14%
Another type of home that I/ 15
we rent or lease 2%
None of these 17
2%
Sigma 985
100%
Page 99
QuickQuery
Fielding Period: January 17-19, 2018
HCAPS (Filtered on Registered Voters)
Weighted To The U.S. General Adult Population - Propensity
20 Jan 2018
Table 95
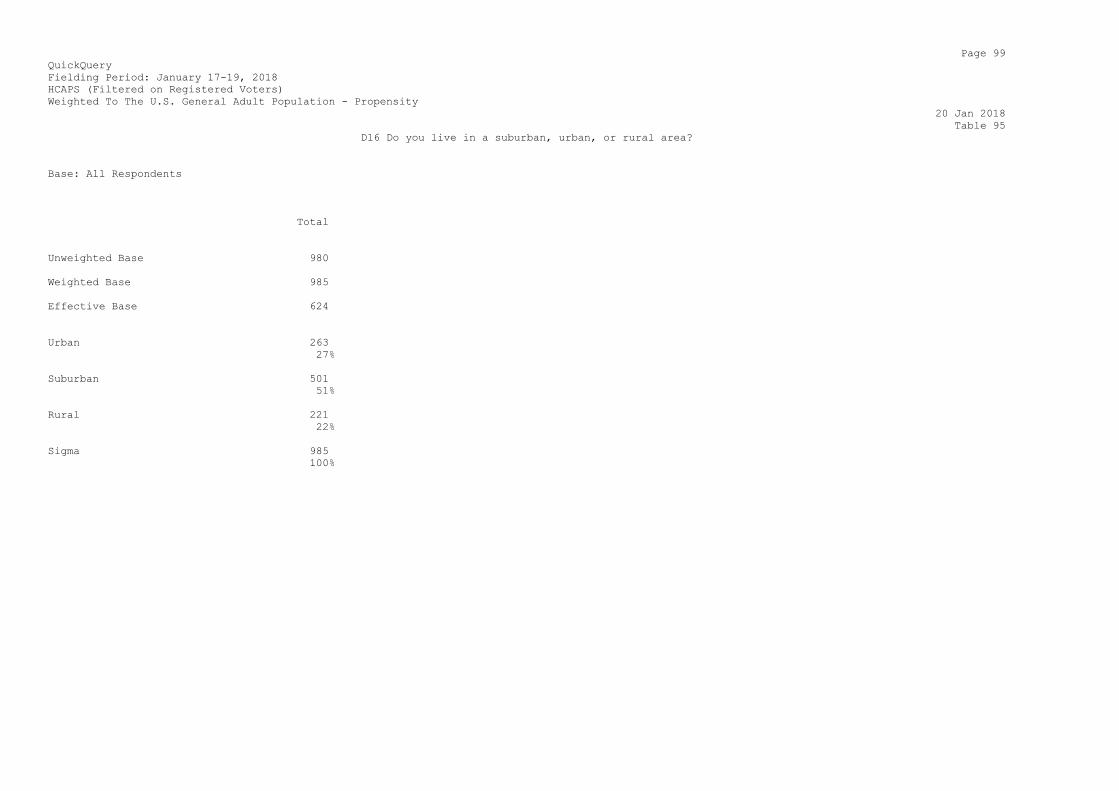
D16 Do you live in a suburban, urban, or rural area?
Base: All Respondents
Total
Unweighted Base 980
Weighted Base 985
Effective Base 624
Urban 263
27%
Suburban 501
51%
Rural 221
22%
Sigma 985
100%

Page 100
QuickQuery
Fielding Period: January 17-19, 2018
HCAPS (Filtered on Registered Voters)
Weighted To The U.S. General Adult Population - Propensity
20 Jan 2018
Table 96
D18 Are you a Citizen of the United States?
Base: All Respondents
Total
Unweighted Base 980
Weighted Base 985
Effective Base 624
Yes 980
100%
No 5
*
Sigma 985
100%
Page 101
QuickQuery
Fielding Period: January 17-19, 2018
HCAPS (Filtered on Registered Voters)
Weighted To The U.S. General Adult Population - Propensity
20 Jan 2018
Table 97
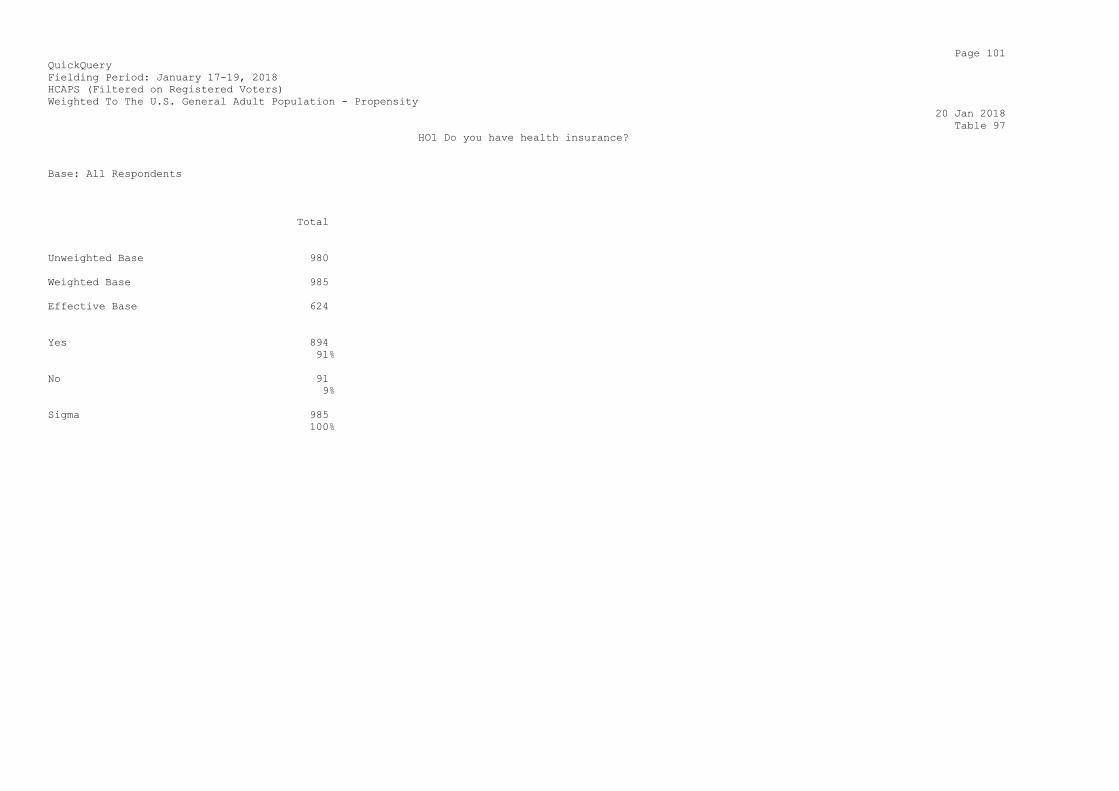
HO1 Do you have health insurance?
Base: All Respondents
Total
Unweighted Base 980
Weighted Base 985
Effective Base 624
Yes 894
91%
No 91
9%
Sigma 985
100%
Page 102
QuickQuery
Fielding Period: January 17-19, 2018
HCAPS (Filtered on Registered Voters)
Weighted To The U.S. General Adult Population - Propensity
20 Jan 2018
Table 98
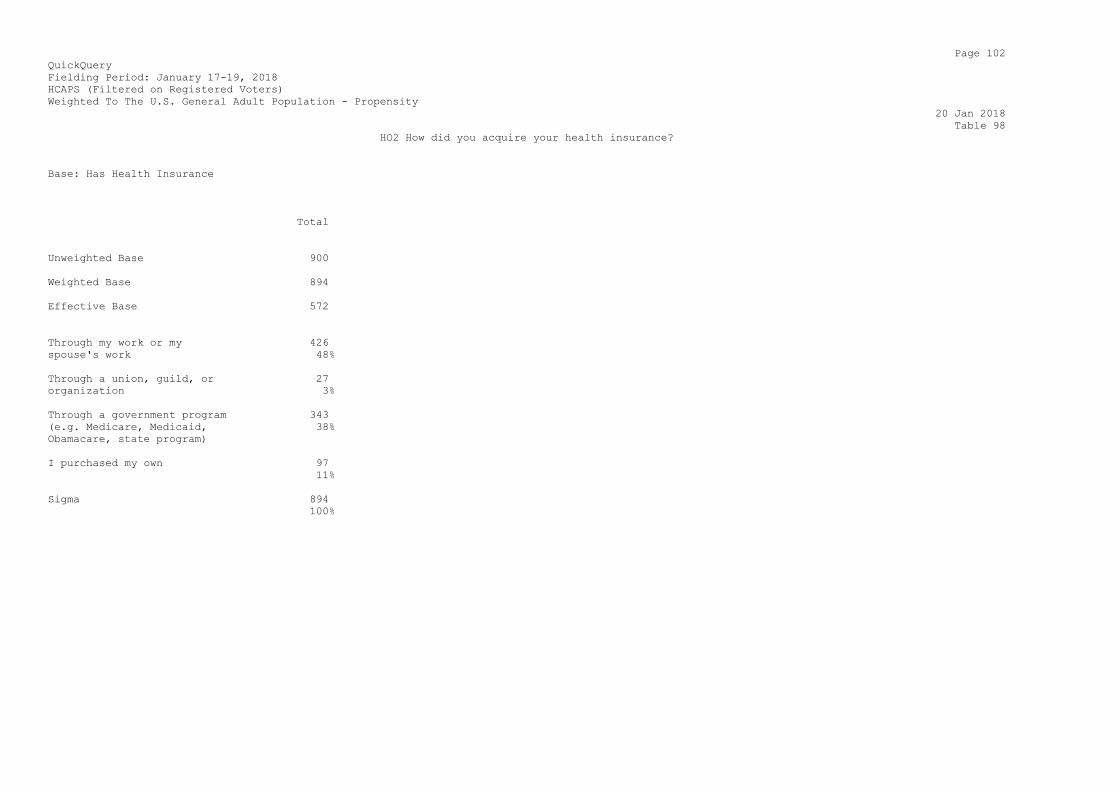
HO2 How did you acquire your health insurance?
Base: Has Health Insurance
Total
Unweighted Base 900
Weighted Base 894
Effective Base 572
Through my work or my 426
spouse's work 48%
Through a union, guild, or 27
organization 3%
Through a government program 343
(e.g. Medicare, Medicaid, 38%
Obamacare, state program)
I purchased my own 97
11%
Sigma 894
100%
Page 103
QuickQuery
Fielding Period: January 17-19, 2018
HCAPS (Filtered on Registered Voters)
Weighted To The U.S. General Adult Population - Propensity
20 Jan 2018
Table 99
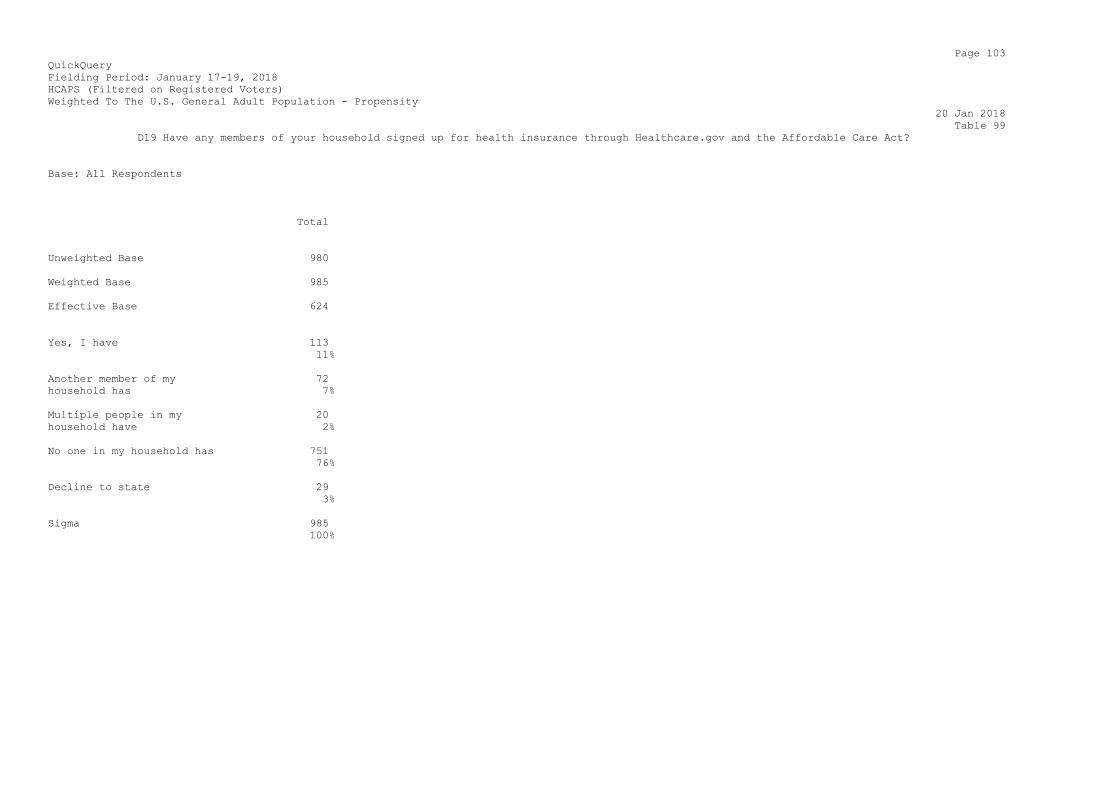
D19 Have any members of your household signed up for health insurance through Healthcare.gov and the Affordable Care Act?
Base: All Respondents
Total
Unweighted Base 980
Weighted Base 985
Effective Base 624
Yes, I have 113
11%
Another member of my 72
household has 7%
Multiple people in my 20
household have 2%
No one in my household has 751
76%
Decline to state 29
3%
Sigma 985
100%
Page 104
QuickQuery
Fielding Period: January 17-19, 2018
HCAPS (Filtered on Registered Voters)
Weighted To The U.S. General Adult Population - Propensity
20 Jan 2018
Table 100
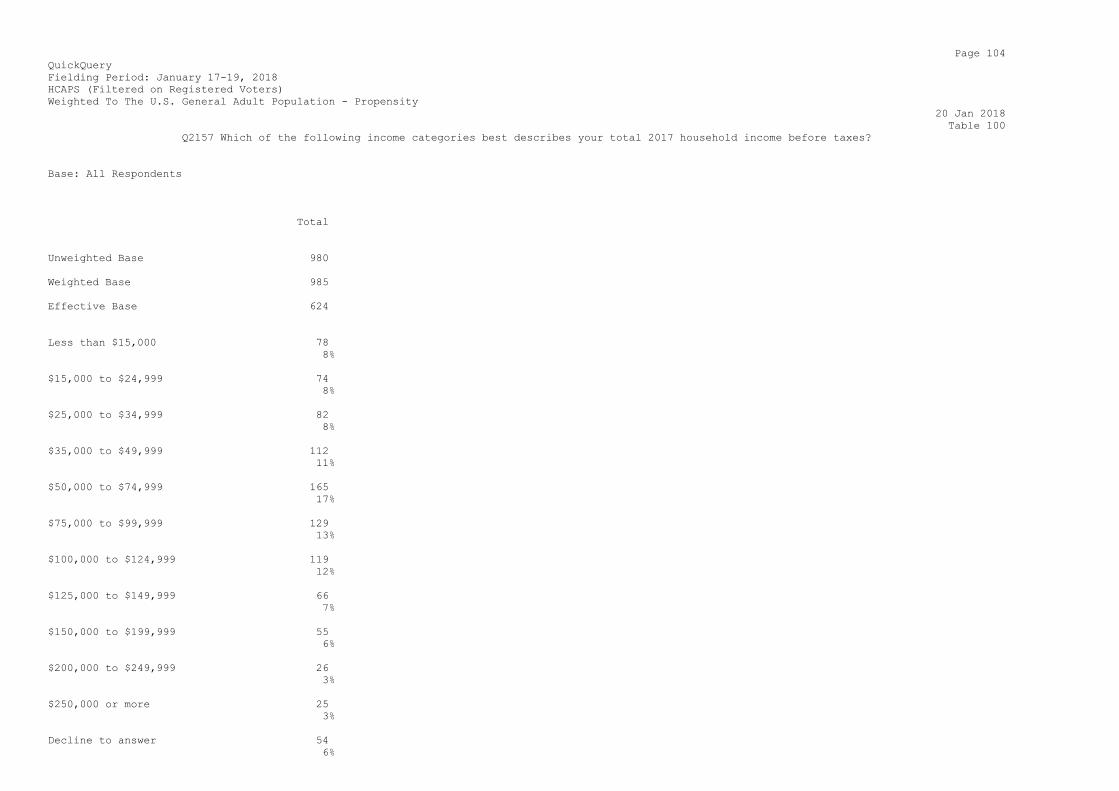
Q2157 Which of the following income categories best describes your total 2017 household income before taxes?
Base: All Respondents
Total
Unweighted Base 980
Weighted Base 985
Effective Base 624
Less than $15,000 78
8%
$15,000 to $24,999 74
8%
$25,000 to $34,999 82
8%
$35,000 to $49,999 112
11%
$50,000 to $74,999 165
17%
$75,000 to $99,999 129
13%
$100,000 to $124,999 119
12%
$125,000 to $149,999 66
7%
$150,000 to $199,999 55
6%
$200,000 to $249,999 26
3%
$250,000 or more 25
3%
Decline to answer 54
6%

Sigma 985
100%
Page 105
QuickQuery
Fielding Period: January 17-19, 2018
HCAPS (Filtered on Registered Voters)
Weighted To The U.S. General Adult Population - Propensity
20 Jan 2018
Table 101
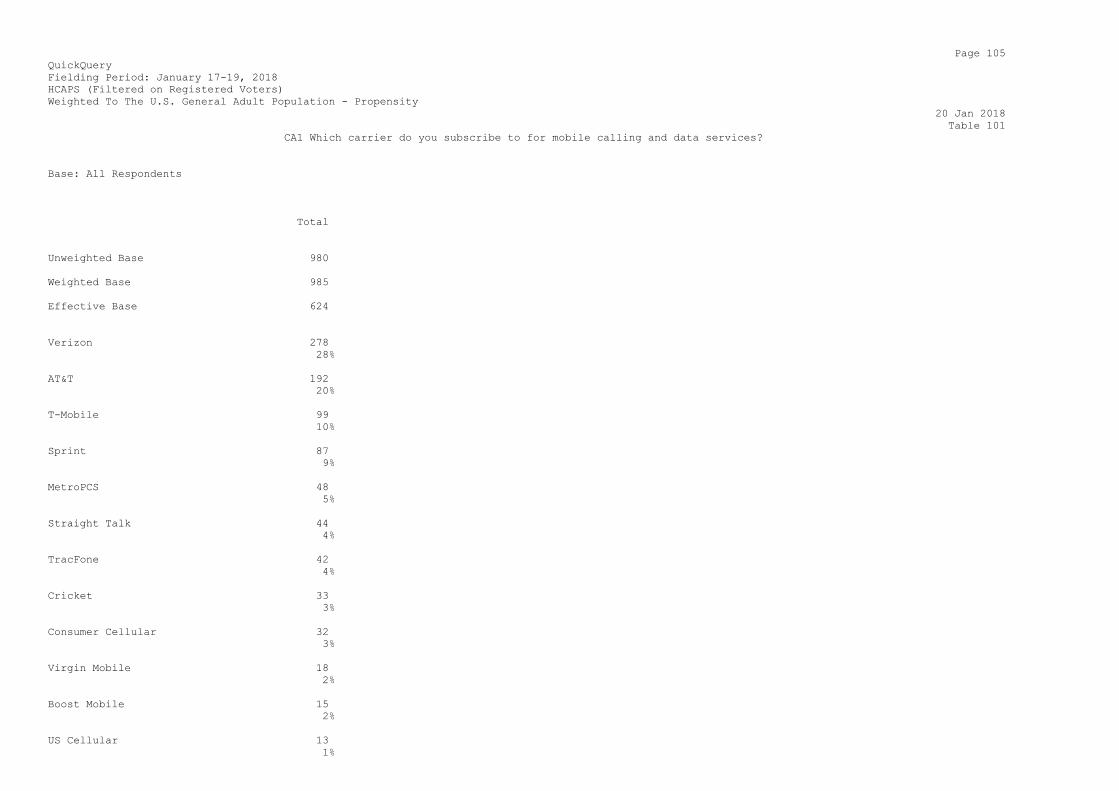
CA1 Which carrier do you subscribe to for mobile calling and data services?
Base: All Respondents
Total
Unweighted Base 980
Weighted Base 985
Effective Base 624
Verizon 278
28%
AT&T 192
20%
T-Mobile 99
10%
Sprint 87
9%
MetroPCS 48
5%
Straight Talk 44
4%
TracFone 42
4%
Cricket 33
3%
Consumer Cellular 32
3%
Virgin Mobile 18
2%
Boost Mobile 15
2%
US Cellular 13
1%

Walmart FamilyMobile 8
1%
Net10 -
-
Other 36
4%
None of the above 40
4%
Sigma 985
100%
Page 106
QuickQuery
Fielding Period: January 17-19, 2018
HCAPS (Filtered on Registered Voters)
Weighted To The U.S. General Adult Population - Propensity
20 Jan 2018
Table 102
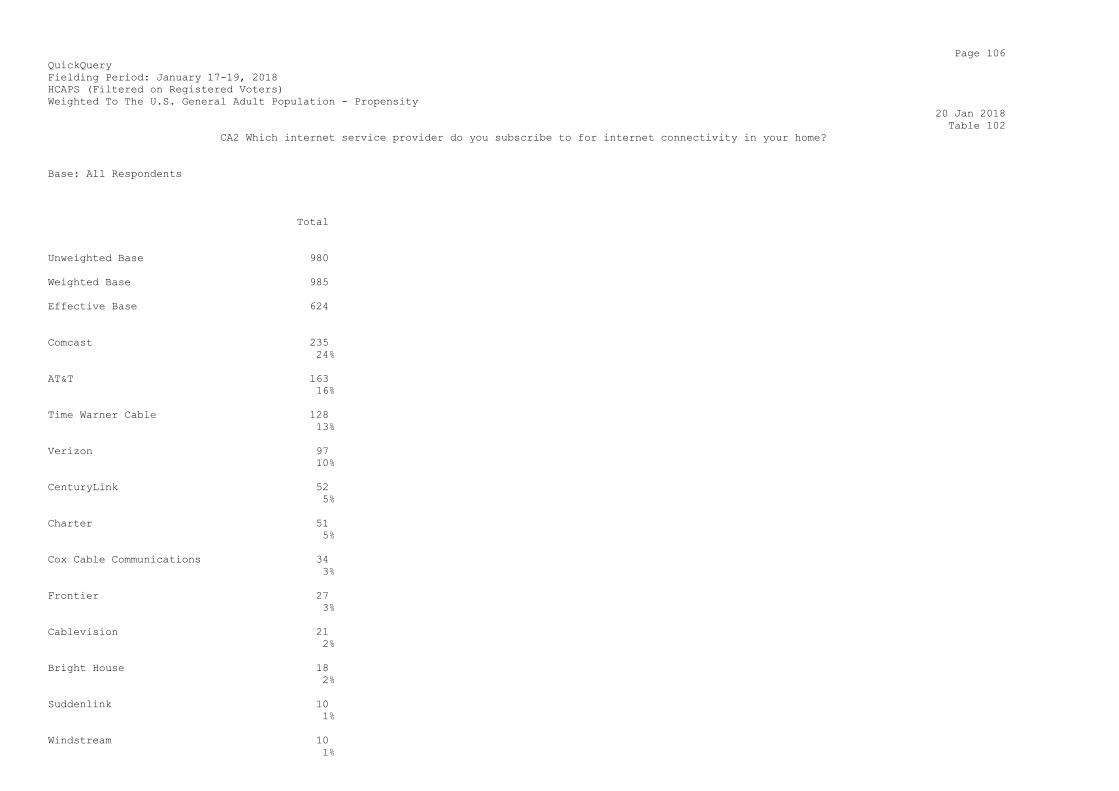
CA2 Which internet service provider do you subscribe to for internet connectivity in your home?
Base: All Respondents
Total
Unweighted Base 980
Weighted Base 985
Effective Base 624
Comcast 235
24%
AT&T 163
16%
Time Warner Cable 128
13%
Verizon 97
10%
CenturyLink 52
5%
Charter 51
5%
Cox Cable Communications 34
3%
Frontier 27
3%
Cablevision 21
2%
Bright House 18
2%
Suddenlink 10
1%
Windstream 10
1%

Mediacom 6
1%
Cincinnati Bell 6
1%
Other 88
9%
None of the above 40
4%
Sigma 985
100%
Page 107
QuickQuery
Fielding Period: January 17-19, 2018
HCAPS (Filtered on Registered Voters)
Weighted To The U.S. General Adult Population - Propensity
20 Jan 2018
Table 103
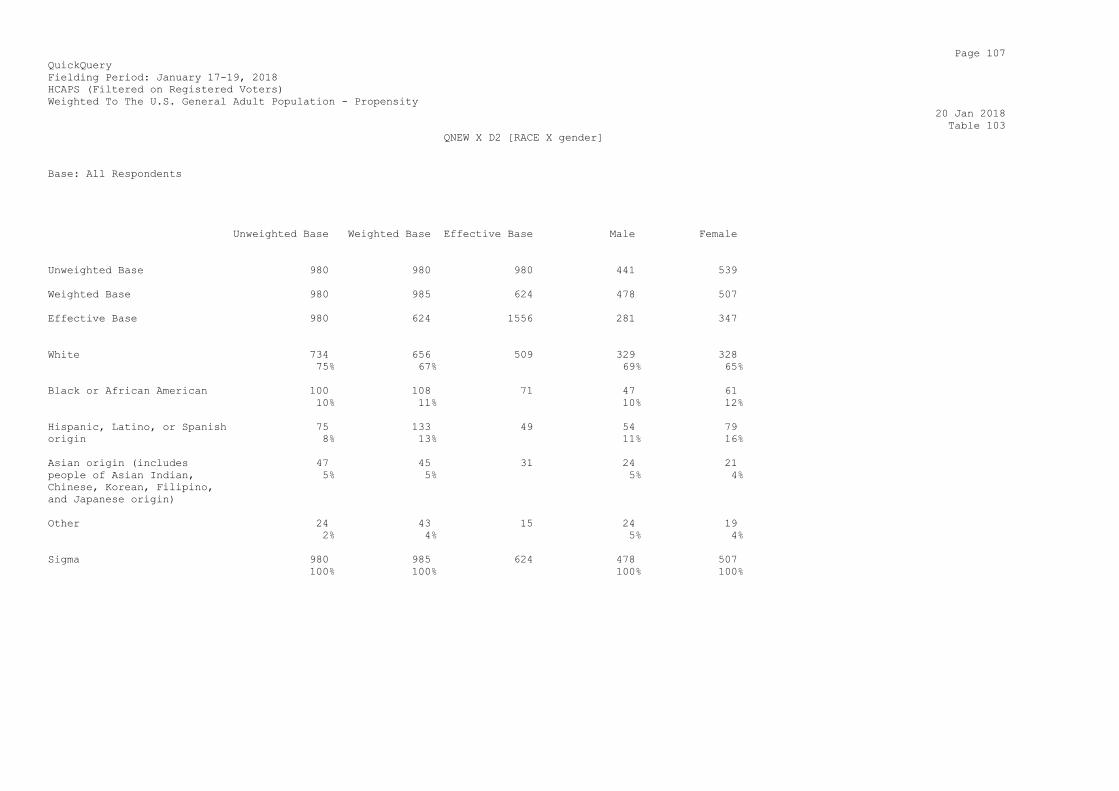
QNEW X D2 [RACE X gender]
Base: All Respondents
Unweighted Base Weighted Base Effective Base Male Female
Unweighted Base 980 980 980 441 539
Weighted Base 980 985 624 478 507
Effective Base 980 624 1556 281 347
White 734 656 509 329 328
75% 67% 69% 65%
Black or African American 100 108 71 47 61
10% 11% 10% 12%
Hispanic, Latino, or Spanish 75 133 49 54 79
origin 8% 13% 11% 16%
Asian origin (includes 47 45 31 24 21
people of Asian Indian, 5% 5% 5% 4%
Chinese, Korean, Filipino,
and Japanese origin)
Other 24 43 15 24 19
2% 4% 5% 4%
Sigma 980 985 624 478 507
100% 100% 100% 100%