Embed Size (px)
Citation preview
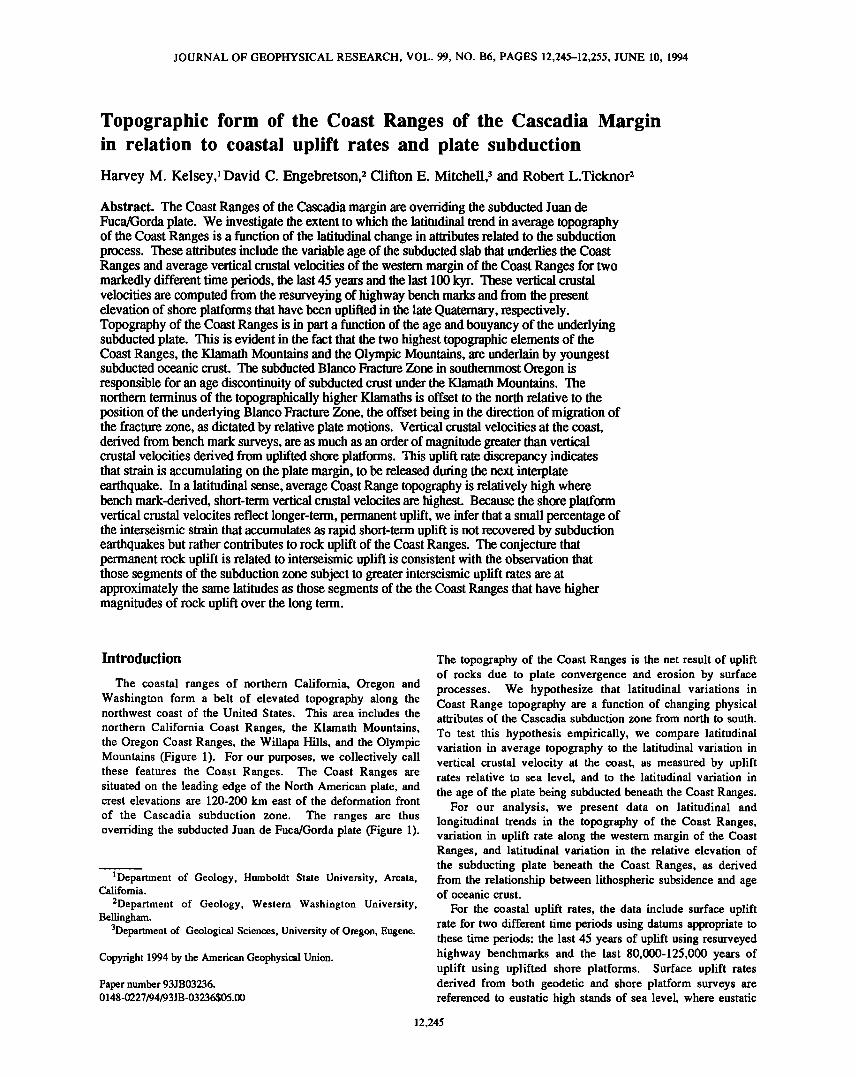
JOURNAL OF GEOPHYSICAL RESEARCH, VOL. 99, NO. B6, PAGES 12,245-12,255, JUNE 10, 1994
Topographic form of the Coast Ranges of the Cascadia Margin in relation to coastal uplift rates and plate subduction
Harvey M. Kelsey, • David C. Engebretson,'• Clifton E. Mitchell, 3 and Robert L.Ticknor'•
Abstract. The Coast Ranges of the Cascadia margin are overriding the subducted Juan de Fuca/Gorda plate. We investigate the extent to which the latitudinal trend in average topography of the Coast Ranges is a function of the latitudinal change in attributes related to the subduction process. These attributes include the variable age of the subducted slab that underlies the Coast Ranges and average vertical crustal velocities of the western margin of the Coast Ranges for two markedly different time periods, the last 45 years and the last 100 kyr. These vertical crustal velocities are computed from the resurveying of highway bench marks and from the present elevation of shore platforms that have been uplifted in the late Quaternary, respectively. Topography of the Coast Ranges is in part a function of the age and bouyancy of the underlying subducted plate. This is evident in the fact that the two highest topographic elements of the Coast Ranges, the Klamath Mountains and the Olympic Mountains, are underlain by youngest subducted oceanic crust. The subducted Blanco Fracture Zone in southernmost Oregon is responsible for an age discontinuity of subducted crust under the Klamath Mountains. The northern terminus of the topographically higher Klamaths is offset to the north relative to the position of the underlying Blanco Fracture Zone, the offset being in the direction of migration of the fracture zone, as dictated by relative plate motions. Vertical crustal velocities at the coast, derived from bench mark surveys, are as much as an order of magnitude greater than vertical crustal velocities derived from uplifted shore platforms. This uplift rate discrepancy indicates that strain is accumulating on the plate margin, to be released during the next interplate earthquake. In a latitudinal sense, average Coast Range topography is relatively high where bench mark-derived, short-term vertical crustal velocites are highest. Because the shore platform vertical crustal velocites reflect longer-term, permanent uplift, we infer that a small percentage of the interseismic strain that accumulates as rapid short-term uplift is not recovered by subduction earthquakes but rather contributes to rock uplift of the Coast Ranges. The conjecture that permanent rock uplift is related to interseismic uplift is consistent with the observation that those segments of the subduction zone subject to greater interseismic uplift rates are at approximately the same latitudes as those segments of the the Coast Ranges that have higher magnitudes of rock uplift over the long term.
Introduction
The coastal ranges of northern California, Oregon and Washington form a belt of elevated topography along the northwest coast of the United States. This area includes the
northern California Coast Ranges, the Klamath Mountains, the Oregon Coast Ranges, the Willapa Hills, and the Olympic Mountains (Figure 1). For our purposes, we collectively call these features the Coast Ranges. The Coast Ranges are situated on the leading edge of the North American plate, and crest elevations are 120-200 km east of the deformation front
of the Cascadia subduction zone. The ranges are thus overriding the subducted Juan de Fuca/Gorda plate (Figure 1).
1Department of Geology, Humboldt State University, Arcata, California.
2Department of Geology, Western Washington University, Bellingham.
3Department of Geological Sciences, University of Oregon, Eugene.
Copyright 1994 by the American Geophysical Union.
Paper number 93JB03236. 0148-0227/94/93JB-03236505.00
The topography of the Coast Ranges is the net result of uplift of rocks due to plate convergence and erosion by surface processes. We hypothesize that latitudinal variations in Coast Range topography are a function of changing physical attributes of the Cascadia subduction zone from north to south.
To test this hypothesis empirically, we compare latitudinal variation in average topography to the latitudinal variation in vertical crustal velocity at the coast, as measured by uplift rates relative to sea level, and to the latitudinal variation in
the age of the plate being subducted beneath the Coast Ranges. For our analysis, we present data on latitudinal and
longitudinal trends in the topography of the Coast Ranges, variation in uplift rate along the western margin of the Coast Ranges, and latitudinal variation in the relative elevation of the subducting plate beneath the Coast Ranges, as derived from the relationship between lithospheric subsidence and age of oceanic crust.
For the coastal uplift rates, the data include surface uplift rate for two different time periods using datums appropriate to these time periods: the last 45 years of uplift using resurveyed highway benchmarks and the last 80,000-125,000 years of uplift using uplifted shore platforms. Surface uplift rates derived from both geodetic and shore platform surveys are referenced to eustatic high stands of sea level, where eustatic
12,245
12,246 KELSEY ET AL.: TOPOGRAPHIC FORM OF COAST RANGES
A
50 ø
45 ø
PACIFIC PLATE
.:::::::.•::: .......... ..:.:.:.:.::.:.:....:.:.:.:.:.
JUAN DE FUCA PLATE
7
40 ø
130 ø
c
WINDOW I
I
I
I
I
I
I
I
I
I
I
I
I
I
I
\
CASCADIA DEFORMATION FRONT
CFW YB
CA
126 ø
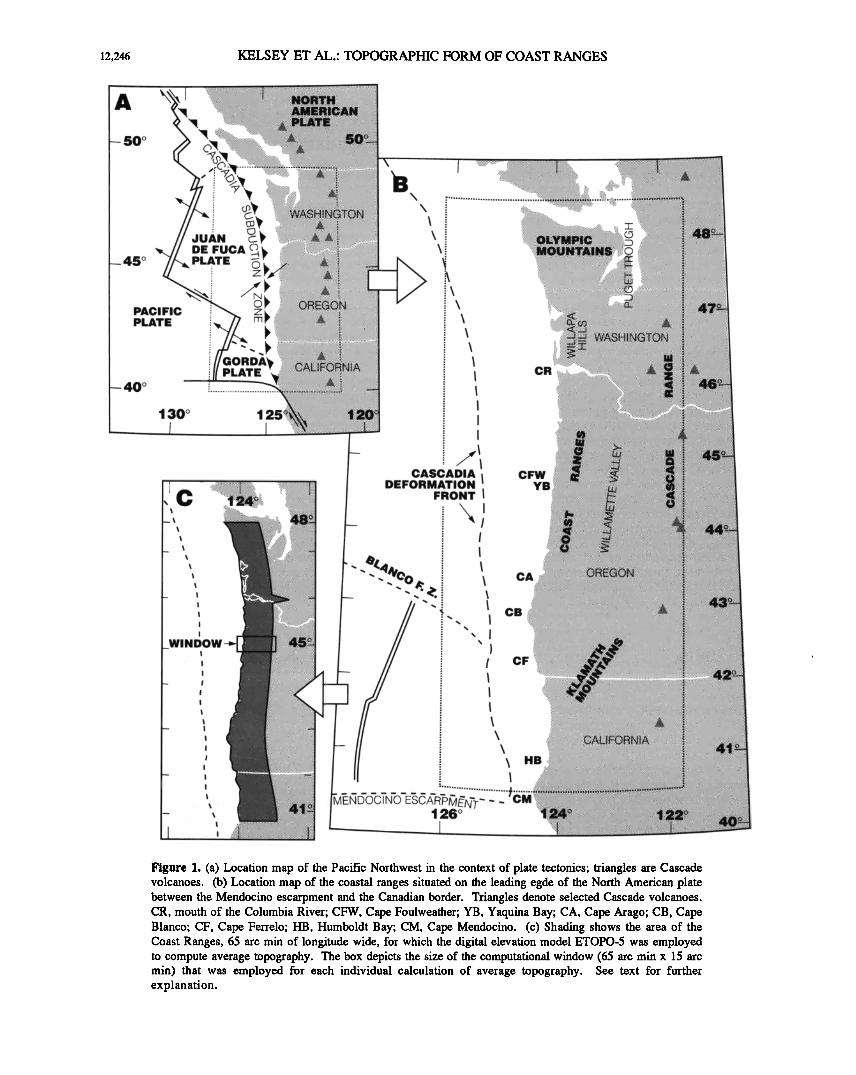
Figure 1. (a) Location map of the Pacific Northwest in the context of plate tectonics; triangles are Cascade volcanoes. (b) Location map of the coastal ranges situated on the leading egde of the North American plate between the Mendocino escarpment and the Canadian border. Triangles denote selected Cascade volcanoes. CR, mouth of the Columbia River; CFW, Cape Foulweather; YB, Yaquina Bay; CA, Cape Arago; CB, Cape Blanco; CF, Cape Ferrelo; HB, Humboldt Bay; CM, Cape Mendocino. (c) Shading shows the area of the Coast Ranges, 65 arc min of longitude wide, for which the digital elevation model ETOPO-5 was employed to compute average topography. The box depicts the size of the computational window (65 arc minx 15 arc min) that was employed for each individual calculation of average topography. See text for further explanation.
KELSEY ET AL' TOPOGRAPHIC FORM OF COAST RANGES 12,247
sea level is an expression of Earth's geoidal surface. The geodetically derived uplift is in reference to present sea level and the shore platform uplift is in reference to the apppropriate late Plesitocene eustatic sea level high stand (see below). Because rock uplift relative to the geoid is equal to surface uplift minus exhumation [England and Molnar, 1990] and because there has been negligible erosion of either the shore platforms or the highway benchmarks, the coastal uplift rates that we discuss are both uplift rates of rock relative to the geoid as well as surface uplift rates. Subsequent use of the term "uplift rate" should thus be unambiguous. Using uplift rate data integrated over the last 45 years and that integrated over the last 80,000-125,000 years, we can compare interseismic uplift with long-term uplift at the coast along the Cascadia margin.
Average Topography Along the Crest of the Coast Ranges
We calculated average topography for the Coast Ranges (Figure 2) using the public domain 5 arc min digital elevation model ETOPO-5 [National Geophysical Data Center, 1988]. Using ETOPO-5, we calculated a running average for the topography of the Coast Ranges in a north-south trending swath extending from the coast inland for 65 arc min of longitude (Figure l c). The swath extends between latitudes 41 ø and 47øN along the trend of the Coast Ranges, for a total length of 778 kin. The average width of the swath is 86.6 km (90.9 km at latitude 41 ø and 82.2 km at latitude 47ø). Each individual calculation of average topography at 5-arc min latitudinal intervals is the running average of the average altitude at 39 different grid points, 13 grid points from each of
three adjacent lines of latitude (computational window (Figure lc) is 65 arc min of longitude x 15 arc min of latitude on a 5 arc min grid), with 13 out of 39 of the grid points changing for each calculation. Thus each calculation of average topography represents an area of about 2400 km 2 (27.8 km x 86.6 km).
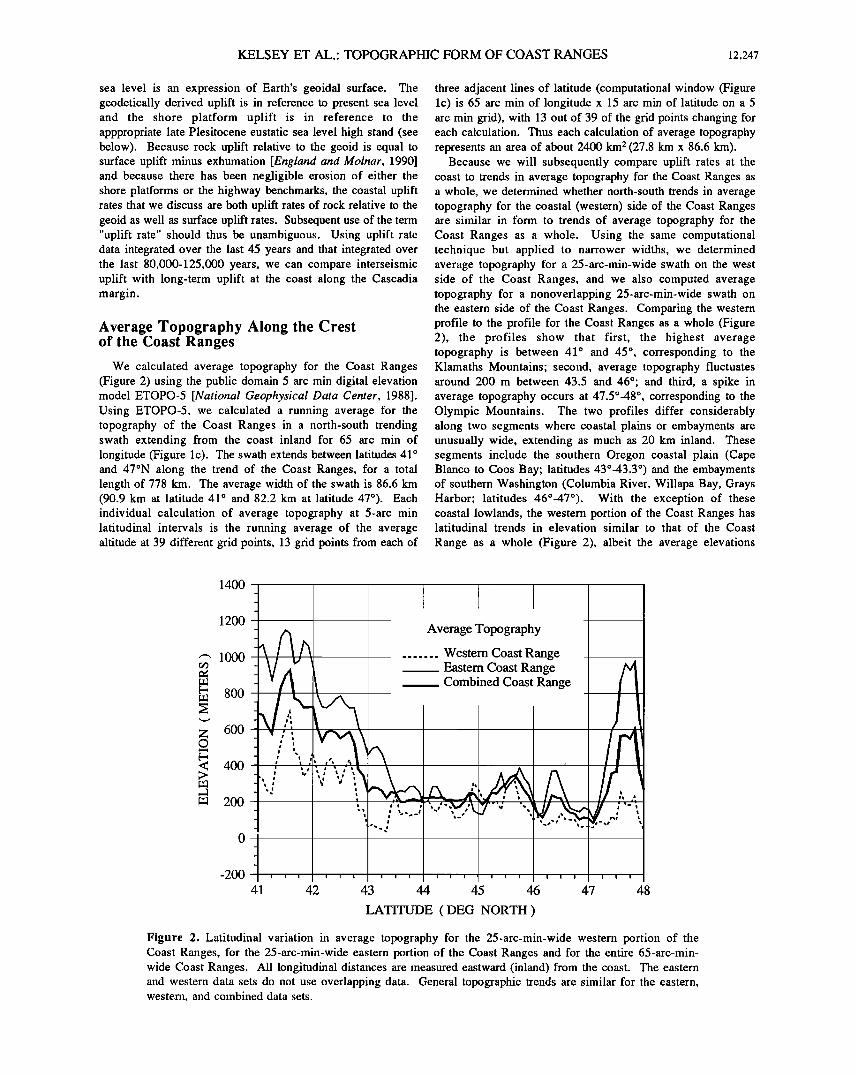
Because we will subsequently compare uplift rates at the coast to trends in average topography for the Coast Ranges as a whole, we determined whether north-south trends in average topography for the coastal (western) side of the Coast Ranges are sinfilar in form to trends of average topography for the Coast Ranges as a whole. Using the same computational technique but applied to narrower widths, we determined average topography for a 25-arc-min-wide swath on the west side of the Coast Ranges, and we also computed average topography for a nonoverlapping 25-arc-min-wide swath on the eastern side of the Coast Ranges. Comparing the western profile to the profile for the Coast Ranges as a whole (Figure 2), the profiles show that first, the highest average topography is between 41 ø and 45 ø , corresponding to the Klamaths Mountains; second, average topography fluctuates around 200 m between 43.5 and 46ø; and third, a spike in average topography occurs at 47.5o-48 ø , corresponding to the Olympic Mountains. The two profiles differ considerably along two segments where coastal plains or embayments are unusually wide, extending as much as 20 km inland. These segments include the southern Oregon coastal plain (Cape Blanco to Coos Bay; latitudes 43ø-43.3 ø) and the embayments of southern Washington (Columbia River, Willapa Bay, Grays Harbor; latitudes 46ø-47ø). With the exception of these coastal lowlands, the western portion of the Coast Ranges has latitudinal trends in elevation similar to that of the Coast
Range as a whole (Figure 2), albeit the average elevations
1400
1200
000
800
600
400
200
-200
- Average Topography
Western Coast Range Eastern Coast Range Combined Coast Range
, ,-, .--- _
.
_
_
_
,
i i i i i i i i i i i i i i i i i i i i i
41 42 43 44 45 46 47 48
LATITUDE ( DEG NORTH )
Figure 2. Latitudinal variation in average topography for the 25-arc-min-wide western portion of the Coast Ranges, for the 25-arc-min-wide eastern portion of the Coast Ranges and for the entire 65-arc-min- wide Coast Ranges. All longitudinal distances are measured eastward (inland) from the coast. The eastern and western data sets do not use overlapping data. General topographic trends are similar for the eastern, western, and combined data sets.
12,248 KELSEY ET AL.: TOPOGRAPHIC FORM OF COAST RANGES
along the coast are lower because Coast Range drainages transport sediment to the west.
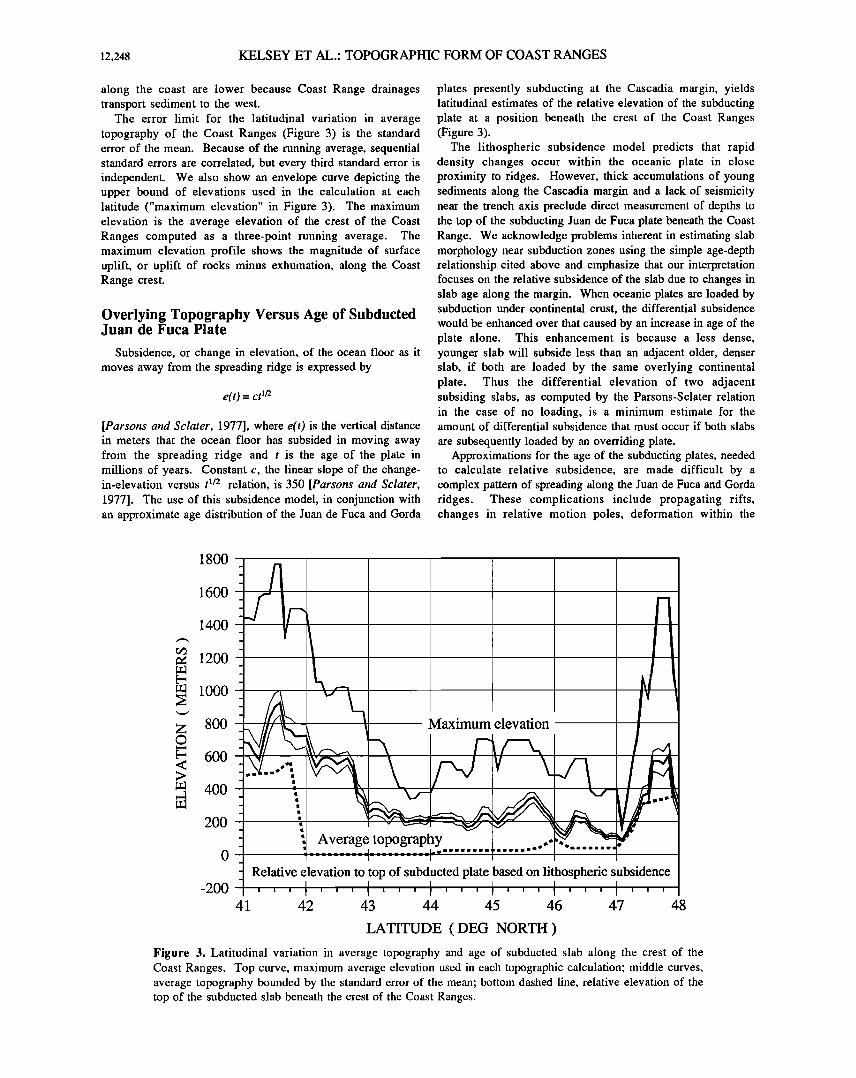
The error limit for the latitudinal variation in average topography of the Coast Ranges (Figure 3) is the standard error of the mean. Because of the running average, sequential standard errors are correlated, but every third standard error is independent. We also show an envelope curve depicting the upper bound of elevations used in the calculation at each latitude ("maximum elevation" in Figure 3). The maximum elevation is the average elevation of the crest of the Coast Ranges computed as a three-point running average. The maximum elevation profile shows the magnitude of surface uplift, or uplift of rocks minus exhumation, along the Coast Range crest.
Overlying Topography Versus Age of Subducted Juan de Fuca Plate
Subsidence, or change in elevation, of the ocean floor as it moves away from the spreading ridge is expressed by
e(t) = ct m
[Parsons and Sclater, 1977], where e(t) is the vertical distance in meters that the ocean floor has subsided in moving away from the spreading ridge and t is the age of the plate in millions of years. Constant c, the linear slope of the change- in-elevation versus t •/2 relation, is 350 [Parsons and Sclater, 1977]. The use of this subsidence model, in conjunction with an approximate age distribution of the Juan de Fuca and Gorda
plates presently subducting at the Cascadia margin, yields latitudinal estimates of the relative elevation of the subducting plate at a position beneath the crest of the Coast Ranges (Figure 3).
The lithospheric subsidence model predicts that rapid density changes occur within the oceanic plate in close proximity to ridges. However, thick accumulations of young sediments along the Cascadia margin and a lack of seismicity near the trench axis preclude direct measurement of depths to the top of the subducting Juan de Fuca plate beneath the Coast Range. We acknowledge problems inherent in estimating slab morphology near subduction zones using the simple age-depth relationship cited above and etnphasize that our interpretation focuses on the relative subsidence of the slab due to changes in slab age along the margin. When oceanic plates are loaded by subduction under continental crust, the differential subsidence
would be enhanced over that caused by an increase in age of the plate alone. This enhancement is because a less dense, younger slab will subside less than an adjacent older, denser slab, if both are loaded by the same overlying continental plate. Thus the differential elevation of two adjacent subsiding slabs, as computed by the Parsons-Sclater relation in the case of no loading, is a minimum estimate for the amount of differential subsidence that must occur if both slabs
are subsequently loaded by an overriding plate. Approximations for the age of the subducting plates, needed
to calculate relative subsidence, are made difficult by a complex pattern of spreading along the Juan de Fuca and Gorda ridges. These complications include propagating rifts, changes in relative motion poles, deformation within the
1800
1600
Maximum elevation
- ; Average• topography 7 • I I
_- Relative elevation to top of subducted plate based on lithospheric subsidence ,,,
1400
1200
1000
800
600
400
200
-200
41 42 43 44 45 46 47 48
LATITUDE ( DEG NORTH )
Figure 3. Latitudinal variation in average topography and age of subducted slab along the crest of the Coast Ranges. Top curve, maximum average elevation used in each topographic calculation; middle curves, average topography bounded by the standard error of the mean; bottom dashed line, relative elevation of the top of the subducted slab beneath the crest of the Coast Ranges.
KELSEY ET AL.: TOPOGRAPHIC FORM OF COAST RANGES 12,249
Gorda plate, and an uncertain history for the development of the Blanco Fracture Zone [Wilson, 1986, 1990; Embley and Wilson, 1992]. Age estimates (Table 1) were determined by reflecting recognizable magnetic isochrons from the Pacific plate onto the Juan de Fuca and Gorda plates using the magnetic isochron map of Atwater and Severinghaus [1989]. A similar result is obtained through an eastward extrapolation of the isochron patterns observed immediately to the west of the Cascadia deformation front.
The age of the slab beneath the crest of the Coast Ranges is uniform except for markedly younger slab at the southern end beneath the Klamath Mountains, which form the Coast Ranges in southernmost Oregon and northernmost California (Figure 3). Younger slab also underlies the Olympic Mountains at the north end of the Coast Range. The age discontinuity in the subducted slab beneath the Klamath Mountains is due to
subduction of the Blanco Fracture Zone (Figure lb), which juxtaposes young crust to the south against older crust to the north (Table 1). The younger slab beneath the Olympic Mountains reflects subduction of progressively younger plate to the north as the Pacific-Juan de Fuca spreading center becomes closer to the leading edge of the North American plate (Figure lb) (Table 1).
The most abrupt latitudinal change in average topography occurs above the subducted Blanco Fracture Zone (Figure 3).
Table 1. Age of the Subducted Juan de Fuca Plate as Projected through the Overlying Pacific Plate to the Crest of the Coast Ranges
Latitude* øN Chron •' Age, Ma
48.0 5/5A 11.0 47.4 5A 12.0 47.25 5B 15.3 47.0 5D 17.86 46.75 5D 17.86 46.5 5D 17.86 46.25 5D 17.86
Pseudo Fault
46.0 5C 16.60 45.75 5D 17.86 45.5 5D 17.86 45.25 5D 17.86 45.0 5D 17.86 44.75 5D 17.86 44.50 5D/5E 18.2 44.25 5D/5E 18.2 44.0 5E 18.8 43.75 5E 18.8 43.5 5E 18.8 43.25 5E 18.8 43.0 5E 18.8 42.75 5E 18.8 42.5 5E 18.8 42.25 5E 18.8 42.0 5E 18.8
Blanco Fracture Zone
41.75 4 7.41
41.5 5E/4 8.5
*Latitude position is along crest of Coast Ranges •- Chron on the Juan de Fuca plate determined from
reflection of chrons from Pacific plate to Juan de Fuca plate across the spreading center.
The top of the relatively young, more bouyant subducted crust south of the Blanco Fracture Zone has an elevation that is
about 500 m higher relative to the top of the slab north of the Blanco Fracture Zone. The north facing scarp in the downgoing slab, with relatively higher slab to the south, is presently directly below the zone of maximum change in average topography along the Coast Range crest (Figure 3). This altitudinal change marks the topographic division between the Klamath Mountains to the south and the
elevationally lower Oregon Coast Ranges to the north. Similarly, the topographically higher Olympic Mountains, at the northern end of the Coast Ranges in Washington, are underlain by relatively young subducted plate that is, in relative elevation, about 300 m higher than older subducted plate further south.
Geodetic Uplift Rates
Differences in the relative heights of bench marks reoccupied by successive first-order leveling surveys provide a data set of geodetically derived uplift rams along the coast for the past -45 years, from 1941 to the period 1987-1988 (Figure 4) [Mitchell et al., 1991, 1992, this issue]. The trends in relative bench mark elevation changes between leveling surveys (Figure 4) are probably real and of tectonic origin because analysis of tidal records along the same segment of coast yields the same magnitudes and trends in uplift. The tidal gage records and the leveling survey records are two independent data sets; differencing the tidal records and differencing the leveling records yield similar relative differences in uplift rate between coastal localities [Mitchell et al., this issue].
The geodetically derived uplift rates are referenced to a contemporary sea level rise of 1.8 mm/yr [Douglas, 1991], with no correction for post glacial rebound. In magnitude and variability, the uplift rates are several times larger than the predicted magnitude of present-day post glacial rebound, and the regional variation of uplift rate is of a much shorter wavelength than that predicted for present-day post glacial rebound [Mitchell et al., this issue]. These geodetically derived uplift rates are uplift rates of rock relative to the geoid and thus are directly comparable to the shore platform uplift rates, described below.
Uplift Rates of Shore Platforms
Uplift rates are calculated for uplifted shore platforms in the latitude range 42 ø to 45øN. The magnitude of uplift, relative to present sea level, was determined for the junction of the paleo- sea cliff and the platform (the shoreline angle). Uncertainties in calculation of the magnitude of uplift of the shoreline angle are (1) the altitude of the shoreline angle at the time of its formation relative to altitude of the eustatic sea level high stand that eroded the shoreline angle (according to Wright [1970] and Trenhaile [1980], the two elevations are the same, + 2 m); (2) altitude of paleo-sea level high stand, this altitude being a function of the age of the high stand and the sea level model employed (see below); (3) present-day altitude of shoreline angle, where the error in assigned altitude is a function of surveying accuracy; we used 7.5 arc min topographic maps for assigning altitude, where the error is +6 m, or one half the contour interval; and (4) original seaward tilt of the platform; this uncertainty only applies in cases of

12,250 KELSEY ET AL.: TOPOGRAPHIC FORM OF COAST RANGES
Geodetic data
&
Yaquina Bay Fault
Cape Ferrelo &&
Cape Blanco (i• Cape Arago
o o o Marine terrace data
Horence
onshore
projection of Wecoma
Fault
& &
&
&
Tillamook Head
42 43 44 45 46
Latitude, degrees north
Figure 4. Latitudinal variation in uplift rates derived from resurveyed bench marks between 1941 and the 1987-1988 period, and from sea cliff/platform junctions of 80-125 ka shore platforms. Triangles, resurveyed bench marks; circles, shore platform data.
poor exposure where platform altitude is measured at a point seaward of the shoreline angle, necessitating calculation of shoreline angle elevation using the original slope of the platform [Bradley and Griggs, 1976].
Uplift rates can only be determined at localities where the shoreline angle elevation can be located on a terrace of a known age. The ages of the late Quaternary eustatic sea level high stands are well established at 80, 105, and 125 ka [Mesolella et al., 1969; Bloom et al., 1974; Chappell and Shackleton, 1986]. The 80 ka and 105 ka wave-cut platforms were identified based on terrace correlation, using soil development [Bockheim et al., 1992] and altitudinal surveys, to terraces of known age in the Cape Blanco [Kelsey, 1990] and Cape Arago [Mclnelly and Kelsey, 1990] areas. Marine terrace sediments of known age have age assignments based on a radiometric age from U-series dating of coral and amino- acid racemization-ratio correlation ages using molluscs (Muhs et al., 1990). In central coastal Oregon, 125 ka platform ages were assigned [Ticknor, 1993] either based on terrace sequence (the terrace in question being the next one altitudinally above the 105 ka terrace) or based on correlation with a 125 ka age- assigned wave-cut platform near Yaquina Bay, Oregon [Kennedy et al., 1982].
We used paleo-sea level high stand elevations as determined from the coastal California sea level high stand elevation
model [Muhs et al., 1992], rather than the New Guinea sea level high stand model [Bloom et al., 1974; Chappell and Shackleton, 1986]. If the New Guinea model is more appropriate for the west coast of North America, uplift rates would be systematically higher for surveyed points on the 80 ka and 105 ka platforms but not for points on the 125 ka platform. The maximum increase in uplift rates would be about 0.1 mm/yr. Given all the above uncertainties in the magnitude of uplift of a shoreline angle formed at 80, 105, or 125 ka, the maximum error in the uplift rate calculation is about +0.2 mm/yr.
Shore platform uplift rates are for the most part <0.25 mm/yr and have a range of-0.04 to 0.87 mm/yr (Figure 4). Abrupt changes in shore platform uplift rate, in some cases by almost an order of magnitude, occur at several localities along the Cascadia margin. All abrupt changes in uplift rate can be related to a distinct structure, a fault or a fold, that displaces the shore platform. Uplift rates abruptly change across structures near Cape Ferrelo (CF, Figure lb and Figure 4) [Kelsey and Bockheim, 1994], Cape Blanco (CB, Figure lb and Figure 4) [Kelsey, 1990], Cape Arago (CA, Figure lb and Figure 4) [Mclnelly and Kelsey, 1990] and Newportffaquina Bay (YB, Figure lb and Figure 4) [Ticknor, 1993].
The platform offsets near Newport (Figure 4) are part of a regionally extensive upper plate fault zone at this latitude,
KELSEY ET AL.: TOPOGRAPHIC FORM OF COAST RANGES 12,251
which includes a set of west-northwest trending faults on the continental rise and shelf [Goldfinger et al., 1992]. These faults project onland to structures that offset or fold the shore platforms. The platform offset north of Newport (Figure 4), near Cape Foulweather (CFW, Figure lb), is at the site of onshore projection of the Wecoma Fault of Goldfinger et al. [1992]. At Yaquina Bay, the 125 ka platform is offset 75 m by the Yaquina Bay Fault (Figure 4) [Ticknor, 1993]; this fault has the largest component of vertical slip, 0.6 m/kyr, of any active fault in coastal Oregon or Washington.
Discussion
Variation in Average Topography as a Function of Age of the Underlying Subducted Plate
Average topography is highest where the relative elevation of the subducted plate, calculated based on lithospheric subsidence [Parsons and Sclater, 1977], is highest. We infer from this circumstantial relationship that uplift of the Coast Ranges is in part a function of the relative age and density of the underlying subducted slab of the Juan de Fuca/Gorda plate. Further, the high topography of the Klamath Mountains is offset to the north, relative to the position of the Blanco Fracture Zone (Figure 3 and Figure 5a versus 5b), and it is offset in the direction of migration of the fracture zone as dictated by relative plate motions [Atwater, 1970; Engebretson et al., 1985]. We suggest the northward movement of the fracture zone serves as a submerged bouyant plow dynamically uplifting crust in front of it. Movement is at the rate of the margin-parallel component of plate convergence of the Juan de Fuca plate (North America fixed), which is presently 24 _+ 10 mm/yr at latitude 44øN [Riddihough, 1984]. McNutt [1983] also related subduction of the Blanco Fracture Zone to the elevation of the Klamath
Mountains based on an observed anomalous isostatic gravity high associated with the Klamath and Siskiyou Mountains in northern California. She proposed that the subducted Blanco Fracture Zone first passed beneath northern California near the end of the Miocene, accounting for both the creation of the observed gravity anomaly and for the rapid rise of the Klamaths at that time [Diller, 1902; Mortimer and Coleman, 1985].
Generation of High Topography: Role of Rock Uplift Rate Versus Rock Age Versus Differential Erosion Rate
From our data, we infer that the higher parts of the Coast Ranges, the Klamath and Olympic Mountains, are high in part because they are dynamically supported by younger subducted oceanic crust. However, what is the relative importance of differential rock uplift, rock age, and selective erosion in the generation of the areas of highest topography? The Olympics are composed of much younger and less metamorphosed crust than the Klamaths. The core rocks of the Olympics are middle Eocene to early Miocene sediments and volcanics [Tabor and Cady, 1978; Brandon and Vance, 1992], whereas the core rocks of the Klamaths are Paleozoic and Mesozoic
metamorphosed sediments and plutonic rocks [Irwin, 1966; Hotz, 1971].
Estimates of late Neogene and Quaternary rock uplift for these two ranges are similar within an order of magnitude.
Rock uplift of the core rocks of the Olympics since 14 Ma is of the order of 1 km/m.y., as derived from fission track analyses on zircon [Brandon and Vance, 1992]. At the locus of late Neogene domal uplift of the Klamaths, the magnitude of rock uplift is at least 7 km [Mortimer and Coleman, 1985] and commenced 10-5 Ma, yielding rock uplift rates of 0.7-1.4 km/m.y.
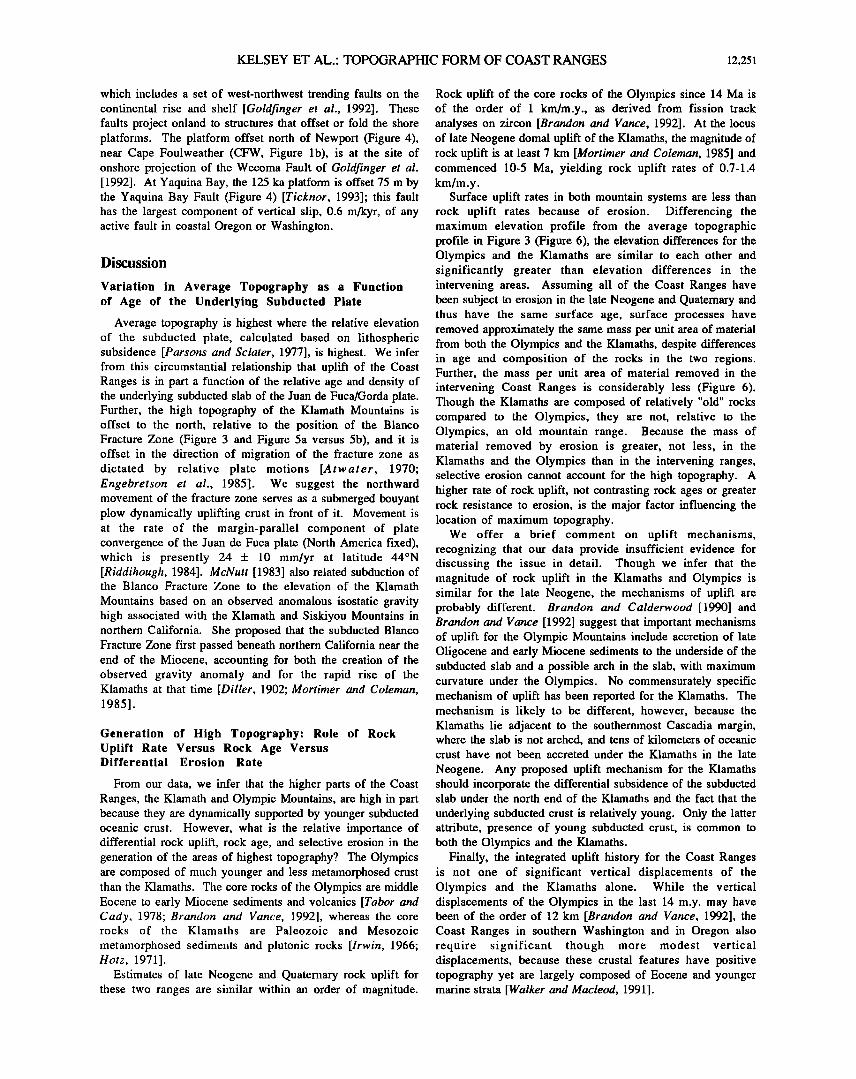
Surface uplift rates in both mountain systems are less than rock uplift rates because of erosion. Differencing the maximum elevation profile from the average topographic profile in Figure 3 (Figure 6), the elevation differences for the Olympics and the Klamaths are similar to each other and significantly greater than elevation differences in the intervening areas. Assuming all of the Coast Ranges have been subject to erosion in the late Neogene and Quaternary and thus have the same surface age, surface processes have removed approximately the same mass per unit area of material from both the Olympics and the Klamaths, despite differences in age and composition of the rocks in the two regions. Further, the mass per unit area of material removed in the intervening Coast Ranges is considerably less (Figure 6). Though the Klamaths are composed of relatively "old" rocks compared to the Olympics, they are not, relative to the Olympics, an old mountain range. Because the mass of material removed by erosion is greater, not less, in the Klamaths and the Olympics than in the intervening ranges, selective erosion cannot account for the high topography. A higher rate of rock uplift, not contrasting rock ages or greater rock resistance to erosion, is the major factor influencing the location of maximum topography.
We offer a brief comment on uplift mechanisms, recognizing that our data provide insufficient evidence for discussing the issue in detail. Though we infer that the magnitude of rock uplift in the Klamaths and Olympics is similar for the late Neogene, the mechanisms of uplift are probably different. Brandon and Calderwood [1990] and Brandon and Vance [1992] suggest that important mechanisms of uplift for the Olympic Mountains include accretion of late Oligocene and early Miocene sediments to the underside of the subducted slab and a possible arch in the slab, with maximum curvature under the Olympics. No commensurately specific mechanism of uplift has been reported for the Klamaths. The mechanism is likely to be different, however, because the Klamaths lie adjacent to the southernmost Cascadia margin, where the slab is not arched, and tens of kilometers of oceanic crust have not been accreted under the Klamaths in the late
Neogene. Any proposed uplift mechanism for the Klamaths should incorporate the differential subsidence of the subducted slab under the north end of the Klamaths and the fact that the
underlying subducted crust is relatively young. Only the latter attribute, presence of young subducted crust, is common to both the Olympics and the Klamaths.
Finally, the integrated uplift history for the Coast Ranges is not one of significant vertical displacements of the Olympics and the Klamaths alone. While the vertical displacements of the Olympics in the last 14 m.y. may have been of the order of 12 km [Brandon and Vance, 1992], the Coast Ranges in southern Washington and in Oregon also require significant though more modest vertical displacements, because these crustal features have positive topography yet are largely composed of Eocene and younger marine strata [Walker and Macleod, 1991 ].
12,252 KELSEY ET AL.: TOPOGRAPHIC FORM OF COAST RANGES
600 . 600
400 • Relative elevation of top of 400 20 subducted plate • 200
0
-200 '! ........ • .... , .... , .... , .... -200 41 42 43 44 45 46 47
1000 1000
800
600
400
200-
0
5
E 3
• 2'
•.1-
0
/• Average topography (for width =.60' of longitude
c Resurveyed highway
benchmarks .
-1
800
6OO
400
200
E 0.5 formed 80-120 ka 0.5 .
• o o
:::3-0.5 ................ , .... , .... -0.5
Latitude, degrees north
E t t t tt Cape Yaquina
Cape Blanco Bay Fault Ferrelo Cape onshore projection,
Arago Wecoma Fault
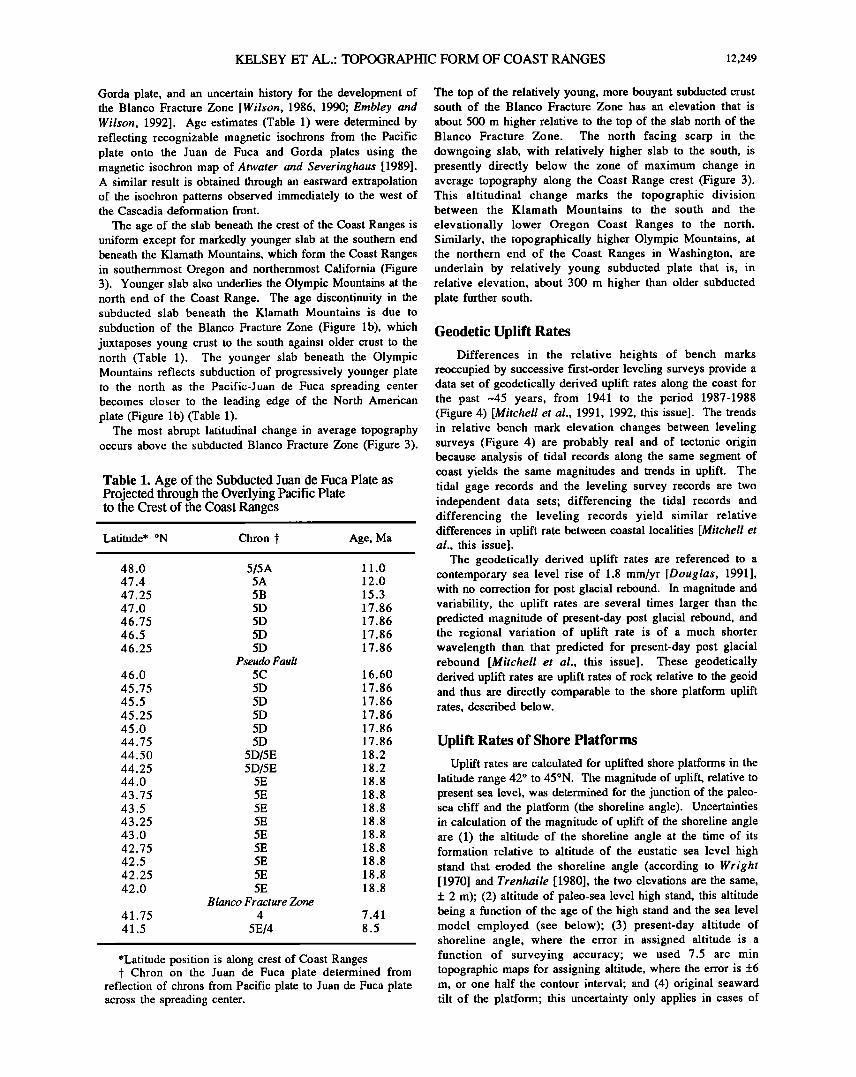
Figure 5. Data sets for plate relief, topography, and vertical crustal velocity, correlated by latitude. (a) Relative elevation of top of subducted Juan de Fuca/Gorda plates. (b) Average topography. (c) Uplift rates from resurveyed bench marks. (d) Uplift rates from shore platforms 80-125 ka in age. (e) Location of coastal sites where abrupt changes in uplift rate occur due to upper plate faulting or folding.
1200
1000 • Difference in elevation between crest elevations r• and average topographic elevation, I• 800
• 600
400
200
0
Latitude, degrees north
Figure 6. Difference in elevation between crest elevations and corresponding average topographic elevation for the Coast Ranges, extending from the Klamath Mountains on the south to the Olympic Mountains on the north.
KELSEY ET AL.: TOPOGRAPHIC FORM OF COAST RANGES 12,253
Average Topography Versus Vertical Crustal Velocities at the Coast
The two sets of vertical crustal velocities, those derived
from resuveyed bench marks and those derived from uplifted shore platforms, represent velocities averaged over markedly different lengths of time (45 years versus 80-125 kyr). The crustal velocities derived from bench marks probably record elastic strain accumulation in the interseismic period between subduction events [Weldon, 1991; Mitchell et al., this issue]; thus much of the strain recorded by the uplift of benchmarks (Figure 4) may be recovered in the next subduction zone earthquake.
The vertical crustal velocities derived from shore platforms are long-term velocities that integrate the effects of as many as a few hundred elastic strain-accumulation-and-release cycles on the subduction zone. Long-term vertical velocities of platforms bear a definable relation to average topography, though smooth cross-latitude trends in the platform vertical velocities are not apparent because the localized folds and faults cause abrupt changes in platform uplift rate. Where platform vertical velocities are variable but in general relatively high, in the latitude range 420-43.3 ø , average topography is higher (Figure 5). In contrast, negligible vertical platform velocities between latitudes 43.30-44.6 ø correspond to lower average topography over the same latitude range. The segment of the Coast Range with the lowest and least variable average topography is identical in latitudinal range to that segment of the coast where platform uplift rate is uniformly low (_• 0.1 mm/yr).
Trends in average topography are correlative latitudinally to trends in vertical crustal velocities derived from bench
marks. The south-to-north descending trend in these two variables is especially notable in Oregon, though the descending trend of the bench mark velocities between latitudes 430-45 ø is offset to the north by about 1-1.5 ø of latitude relative to the descending trend in Coast Range elevation from 41.5ø44 ø (Figure 5b versus 5c). This offset is in the same direction as that of the north edge of high topography of the Klamath Mountains, which is offset north relative to the underlying position of the Blanco Fracture Zone (Figure 5a versus 5b).
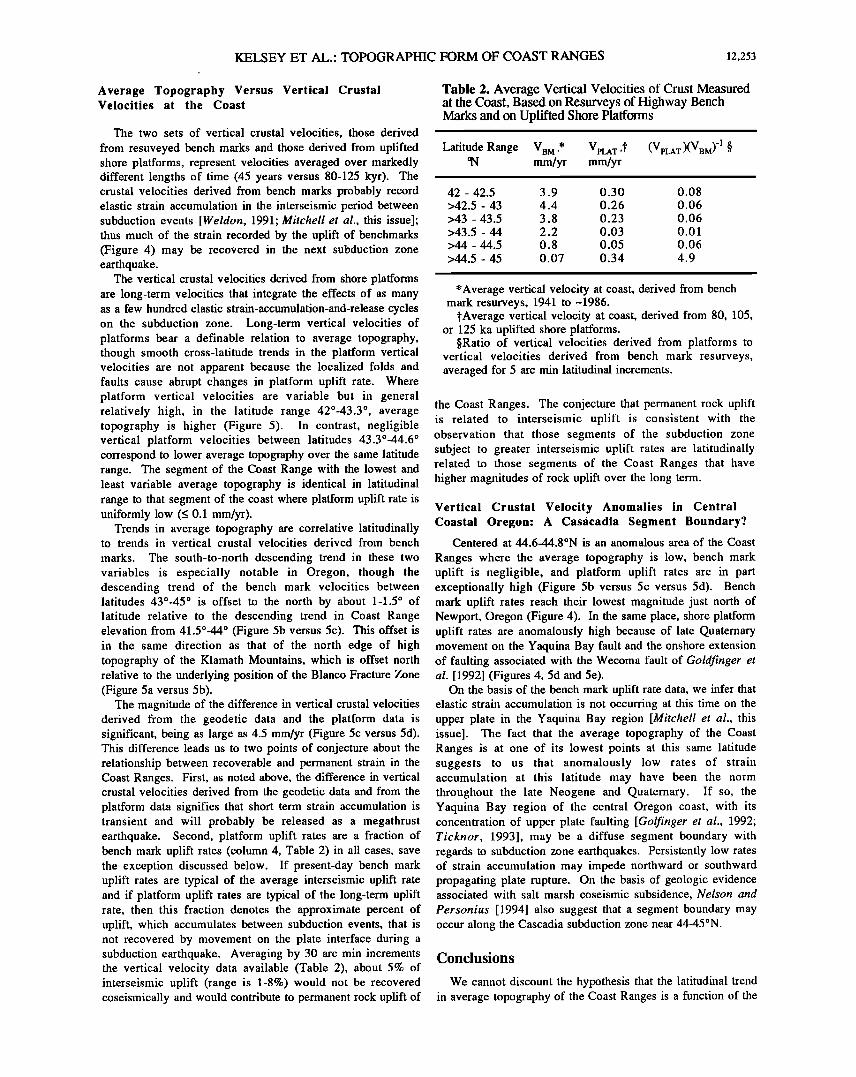
The magnitude of the difference in vertical crustal velocities derived from the geodetic data and the platform data is significant, being as large as 4.5 mm/yr (Figure 5c versus 5d). This difference leads us to two points of conjecture about the relationship between recoverable and permanent strain in the Coast Ranges. First, as noted above, the difference in vertical crustal velocities derived from the geodetic data and from the platform data signifies that short term strain accumulation is transient and will probably be released as a megathrust earthquake. Second, platform uplift rates are a fraction of bench mark uplift rates (column 4, Table 2) in all cases, save the exception discussed below. If present-day bench mark uplift rates are typical of the average interseismic uplift rate and if platform uplift rates are typical of the long-term uplift rate, then this fraction denotes the approximate percent of uplift, which accumulates between subduction events, that is not recovered by movement on the plate interface during a subduction earthquake. Averaging by 30 arc rain increments the vertical velocity data available (Table 2), about 5% of interseismic uplift (range is 1-8%) would not be recovered coseismically and would contribute to permanent rock uplift of
Table 2. Average Vertical Velocities of Crust Measured at the Coast, Based on Resurveys of Highway Bench Marks and on Uplifted Shore Platforms
Latitude Range VuM,* VpLAT ,? (VpLAT)(VBM)-1 õ øN mm/yr mm/yr
42 - 42.5 3.9 0.30 0.08 >42.5 - 43 4.4 0.26 0.06 >43 - 43.5 3.8 0.23 0.06 >43.5 - 44 2.2 0.03 0.01 >44 - 44.5 0.8 0.05 0.06 >44.5 - 45 0.07 0.34 4.9
*Average vertical velocity at coast, derived from bench mark resurveys, 1941 to ---1986.
?Average vertical velocity at coast, derived from 80, 105, or 125 ka uplifted shore platforms.
{}Ratio of vertical velocities derived from platforms to vertical velocities derived from bench mark resurveys, averaged for 5 arc min latitudinal increments.
the Coast Ranges. The conjecture that permanent rock uplift is related to interseismic uplift is consistent with the observation that those segments of the subduction zone subject to greater interseismic uplift rates are latitudinally related to those segments of the Coast Ranges that have higher magnitudes of rock uplift over the long term.
Vertical Crustal Velocity Anomalies in Central Coastal Oregon: A Casacadia Segment Boundary?
Centered at 44.6-44.8øN is an anomalous area of the Coast
Ranges where the average topography is low, bench mark uplift is negligible, and platform uplift rates are in part exceptionally high (Figure 5b versus 5c versus 5d). Bench mark uplift rates reach their lowest magnitude just north of Newport, Oregon (Figure 4). In the same place, shore platform uplift rates are anomalously high because of late Quaternary movement on the Yaquina Bay fault and the onshore extension of faulting associated with the Wecoma fault of Goldfinger et al. [1992] (Figures 4, 5d and 5e).
On the basis of the bench mark uplift rate data, we infer that elastic strain accumulation is not occurring at this time on the upper plate in the Yaquina Bay region [Mitchell et al., this issue]. The fact that the average topography of the Coast Ranges is at one of its lowest points at this same latitude suggests to us that anomalously low rates of strain accumulation at this latitude may have been the norm throughout the late Neogene and Quaternary. If so, the Yaquina Bay region of the central Oregon coast, with its concentration of upper plate faulting [Golfinger et al., 1992; Ticknor, 1993], may be a diffuse segment boundary with regards to subduction zone earthquakes. Persistently low rates of strain accumulation may impede northward or southward propagating plate rupture. On the basis of geologic evidence associated with salt marsh coseismic subsidence, Nelson and
Personius [1994] also suggest that a segment boundary may occur along the Cascadia subduction zone near 44-45øN.
Conclusions
We cannot discount the hypothesis that the latitudinal trend in average topography of the Coast Ranges is a function of the
12,254 KELSEY ET AL.: TOPOGRAPHIC FORM OF COAST RANGES
latitudinal change in attributes that are related to the subduction process. On the basis of data and discussion above, we make the following conclusions. Elevation of the average topography of the Coast Ranges appears to be in part a function of the age and density of the subducted plate that underlies the Coast Ranges. Where the plate is young and relatively bouyant, the surface of the overlying Coast Range is higher.
Underneath the Coast Ranges, a discontinuity in age of the subducted slab occurs at the Blanco Fracture Zone. Because
topography is sensitive to the age and relative bouyancy of the underlying slab and the Blanco Fracture Zone is migrating along the margin at the speed of the margin-parallel component of convergence of the Juan de Fuca plate, the locus of the greatest amount of rock uplift in the southern Coast Ranges is migrating north with time.
Latitudinal trends in average topography are similar to latitudinal trends in vertical crustal velocity for the last 45 years, a period of interseismic strain accumulation in Cascadia. A marked descent to the north in both topography and vertical crustal velocity, based on resurveyed bench marks, is evident in the data. The descending trend in vertical crustal velocity is offset by about one-and-half degrees of latitude to the north relative to the topographic trend, the offset also being in the direction of the margin-parallel component of plate convergence.
For the latitude range 42o-45 ø (a 340-km segment of the Cascadia margin), vertical crustal velocity data are available for 80-125 ka shore platforms. For this segment of the Coast Ranges, average topography is relatively low where vertical crustal velocities are low, and average topography is higher where crustal velocities at the coast are variable but on the
average significantly higher. In general, average topography is also higher where faulting and folding of shore platforms is most evident.
Differential erosion in response to rock units of varying resistance cannot account for the major differences in average Coast Range topography. Rather, the Coast Ranges have been subject to different amounts of rock uplift along the trend of the subduction margin. The mechanisms of uplift for the topographically highest portions of the Coast Ranges, the Olympics and Klamaths, are not the same; but the presence of young, relatively bouyant subducted crust under both of these regions is an integral component of the uplift mechanisms in both of these areas.
Differential total rock uplift best correlates to age of the underlying plate but also correlates to vertical crustal velocity reflecting interseismic strain accumulation. Topographically higher portions of the Coast Ranges spatially correlate with segments of the subduction zone where elastic strain buildup presently is greatest. We infer that a small percentage of the interseismic strain that accumulates as rapid short-term uplift is not recovered during subduction earthquakes. This residual strain contributes to permanent rock uplift of the Coast Ranges, with commensurately more rock uplift where interseismic strain is greatest. Coast Range topographic form may in part be dependent on the persistance of this relation for million of years.
In summary, topographic form of the Coast Ranges could be in large part a function of the subduction process. Variations in the age of the subducting plate under the Coast Ranges and the varying character of interseismic strain accumulation and coseismic strain release along the Cascadia margin are both
variables that spatially correlate with differential uplift of rock along the north-south trend of the Coast Ranges. From this we infer that the variable density of the subducting plate affects the pattern of strain buildup and release along the plate boundary, which in turn is manifest by changes in topographic form along the trend of the Coast Ranges.
Acknowledgments. This research partially supported by NSF grant 8903470 to H. Kelsey and J. Bockheim. Engebretson acknowledges support from a Joint Venture (JOVE) grant from NASA. Mitchell acknowledges helpful consultation with L. Riggers and E. Balazs of the National Geodetic Survey and funding from the National Earthquake Hazard Reduction Program of the USGS. We thank R. J. Weldon II for helpful discussion and M.T. Brandon, P. Bodin, and D. Merritts for thoughtful reviews.
References
Atwater, T., Implications of plate tectonics for the Cenozoic evolution of North America, Geol. Soc. Am. Bull., 81, 3513-3536, 1970.
Atwater, T. and J. Severinghaus, Tectonic maps of the Pacific, in The Geology of North America, vol. N, The Eastern Pacific Ocean and Hawaii, Plate 3B, Geological Society of America, Boulder, Colo., 1989o
Bloom, A., W.S. Broecker, J. Chappell, R.K. Matthews, and K.J. Mesolella, Quaternary sealevel fluctuations on a tectonic coast: new 230Th/234U dates from the Huon Peninsula, New Guinea, Quat. Res., 4, 185-205, 1974.
Bockheim, J.G., H.M. Kelsey, and J.G. Marshall, Soil development, relative dating and correlation of late Quaternary marine terraces in southwestern Oregon, Quat. Res., 37, 60-74, 1992.
Bradley, W.C., and G.B. Griggs, Form, genesis, and deformation of central California wave-cut platforms, Geol. Soc. Am. Bull., 87, 433- 449, 1976.
Brandon, M.T. and A.R. Calderwood, High-pressure metamorphismand uplift of the Olympic subduction complex, Geology, 18, 1252-1255, 1990.
Brandon, M.T., and J.A. Vance, Tectonic evolution of the Cenozoic
Olympic subduction complex, Washington state, as deduced from fission track ages for detrital zircons, Am. J. Sci., 292, 565-636, 1992.
Chappell, J., and N.J. Shackleton, Oxygen isotopes and sealevel, Nature, 234, 137-140, 1986.
Diller, J.S., Topographic development of the Klamath Mountains, U.S. Geol. Surv. Bull., 196, 60 pp., 1902.
Douglas, B.C., Global sea level rise, J. Geophys. Res., 96, 6981-6992, 1991.
Embley, R.W., and D.S. Wilson, Morphology of the Blanco transform fault zone - NE Pacific: Implications for its tectonic evolution, Mar. Geophys. Res., 14, 24-45, 1992.
Engebretson, D.C., A. Cox, and R.G. Gordon, Relative motions between oceanic and continental plates in the Paciifc basin, Geol. Soc. Am. Spec. Pap. 206, 59 pp., 1985.
England, P., and P. Molnar, Surface uplift, uplift of rocks, and exhumation of rocks, Geology, 18, 1173-1177, 1990.
Goldfinger, C., L.D. Kulm, R.S. Yeats, B. Applegate, M.E. MacKay and G.F. Moore, Transverse structural trends along the Oregon convergent margin: Implications for Cascadia earthquake potential and cmstal rotations, Geology, 20, 141-144, 1992.
Hotz, P.E., Plutonic rocks of the Klamath Mountains, California and
Oregon, U.S. Geol. Surv. Prof. Pap., 684B, 20 pp., 1971. Irwin, W.P., Geology of the Klamath Mountains Province, Bull. Calif.
Div. Mines Geol., 190, 19-38, 1966.
Kelsey, H.M., Late Quaternary deformation of marine terraces on the Cascadia subduction zone near Cape Blanco, Oregon, Tectonics, 9, 983-1014, 1990.
Kelsey, H.M. and J.G. Bockheim, Coastal landscape evolution as a function of eustasy and surface uplift rate, Cascadia margin,

KELSEY ET AL.: TOPOGRAPHIC FORM OF COAST RANGES 12,255
southem Oregon, Geol. Soc. Am. Bull., 106, 840-854, 1994. Kennedy, G.L., K.R. Lajoie, and J.F. Wehmiller, Aminostratigraphy and
faunal correlations of late Qu•.Lemary marine terraces, Pacific Coast, USA, Nature, 299, 545-547, 1982.
Mclnelly, G.W., and H.M. Kelsey, Late Quaternary tectonic deformation in the Cape Arago-Bandon region of coastal Oregon as deduced from wave-cut platforms, J. Geophys. Res., 95, 6699-6713, 1990.
McNutt, M., Influence of plate subduction on isostatic compensation in northem Califomia, Tectonics, 2,399-415, 1983.
Mesolella, K.J., R.K. Matthews, W.S. Broecker, and D.L. Thurber, The astronomical theory of climatic change: Barbados data, J. Geol., 77, 250-274, 1969.
Mitchell, C. E., R.J. Weldon II, and P. Vincent, Active uplift of the Pacific northwest margin (abstract), Eos Trans. AGU, 72 (44), Fall Meeting suppl., 314, 1991
Mitchell, C.E., R.J. Weldon II, and H.L. Pittock, Pacific northwest contemporary coastal uplift profile with confidence limits and a revised rate of sea level change at Astoria, OR (abstract), Eos Trans. AGU, 73 (43), Fall Meeting suppl., 119, 1992.
Mitchell, C. E., P. Vincent, R.J. Weldon II, and M.A. Richards, Present- day vertical defomaation of the Cascadia margin, Pacific northwest, United States, J. Geophys. Res., this issue.
Mortimer, N., and R.G. Coleman, A Neogene structural dome in the Klamath Mountains, Califomia and Oregon, Geology, 13, 253-256, 1985.
Muhs, D.R., H. M. Kelsey, G. H. Miller, G. L. Kennedy, J. F. Whelan, and G.W. Mclnelly, Age estimates and uplift rates for late Pleistocene marine terraces: southem Oregon portion of the Cascadia forearc, J. Geophys. Res., 95, 6685-6698, 1990.
Muhs, D.R., T.K. Rockwell, and G.L. Kennedy, Late Quatemary uplift rates of marine terraces on the Pacific coast of North America,
southem Oregon to Baja Califomia Sur, Quat. Int., 15/16, 121-133, 1992.
National Geophysical Data Center, ETOPO-5 bathymetry/topography data, Data Announce. 88-MG-02, Nat. Oceanic and Atmos. Admin., Washington, D.C., 1988.
Nelson, A.R., and S.F. Personius, The potential for great earthquakes in Oregon and Washington-An overview of recent coastal geologic studies and their bearing on segmentation of Holocene ruptures, central Cascadia subduction zone, in Assessing and Reducing
Earthquake Hazards in the Pacific Northwest, edited by A.M. Rodgers, W.J. Kockelmen, G. Priest and T.J. Walsh, U.S. Geol. Surv. Prof. Pap., in press, 1994.
Parsons, B., and J.G. Sclater, An analysis of the variation of ocean floor bathymetry and heat flow with age, J. Geophys. Res., 82, 803-838, 1977.
Riddihough, R., Recent movements of the Juan de Fuca plate system, J. Geophys. Res. 89, 6980-6994, 1984.
Tabor, R.W., and W.M. Cady, Geologic map of the Olympic Peninsula, scale 1:125,000, U.S. Geol. Surv. Map, 1-994, 2 sheets, 1978.
Ticknor, R.L., Late Quaternary crustal defomaation on the central Oregon coast as deduced from uplifted wave-cut platforms, M.S. thesis, 70 pp., West. Wash. Univ., Bellingham, 1993.
Trenhaile, A.S., Shore platforms: a neglected coastal feature, Prog. Phys. Geog., 4, 1-23, 1980.
Walker, G.W., and N.S. Macleod, Geologic map of Oregon, 1:500,000, U.S. Geol. Surv., Reston, Va., 1991.
Wells, F.G., and D.L. Peck, Geologic map of Oregon west of the 121st meridian, scale 1:500,000, U.S. Geol. Surv. Map, 1-325, 1961.
Weldon, R.J. II, Active tectonic studies in the United States, U.S. Natl. Rep. Int. Union Geol. Geophys. 1987-1990, Rev. Geophys., 29, 890- 906, 1991.
Wilson, D.S., A kinematic model for the Gorda deformation zone as a diffuse southem boundary of the Juan de Fuca plate, J. Geophys. Res., 91, 10259-10269, 1986.
Wilson, D.S., Kinematics of overlapping rift propagation with cyclic rift failure, Earth Planet. Sci. Lett., 96, 384-392, 1990.
Wright. L.W., Variation in the level of the cliff/shore platform junction along the south coast of Great Britain, Mar. Geol., 9, 347-353, 1970.
D.C. Engebretson and R.L. Ticknor, Department of Geology, Westem Washington University, Bellingham, WA 98225. (Engebretson, e-mail: rice@ pacific.geol. wwu.edu)
H.M. Kelsey, Department of Geology, Humboldt State University, Arcata, CA 95521. (e-mail: [email protected])
C.E. Mitchell, Department of Geological Sciecnes, University of Oregon, Eugene, OR 94703.
(Received April 5, 1993; revised October 4, 1993; accepted November 15, 1993.)